A Comparison of Motorcycle Helmet Wearing Intention and Behavior between Urban and Rural Areas

 ,
, 
 , ,
, , 
Abstract
:1. Introduction
1.1. Background
1.2. Health Belief Model
- Perceived susceptibility to disease means a person’s direct beliefs about their behavior. They believe or predict that the risk of contracting diseases or having some level of health problems is related to their sickness avoidance actions. The perception of susceptibility to disease is accepted as the main factor in people’s behavior toward good health.
- Perceived severity of disease means the belief that people have towards their ability to assess the severity of diseases or health problems themselves, which includes such elements as the causes of disabilities, death, difficulties, time-consuming cures, complicated diseases, or the effects on their social roles. The perception of susceptibility to disease (1) accompanied with the perceived severity of disease, (2) allow people to recognize the perceived threat of disease and therefore avoid it.
- Perceived benefits of preventive action refers to how people search for methods to maintain themselves or to recover from or prevent diseases. The practice must be recognized as good, beneficial, and suitable to prevent susceptibility to disease. The decision to follow suggestions depends on comparisons between the advantages and disadvantages of such behavior and choosing that which offers greater advantages.
- Perceived barriers to preventive action means the beliefs a person has in the possible problems and obstacles that prevent practical behavior and that are connected to the person’s negative hygienic health behavior, such as the expense involved and illness. Those people who believe there are many problems create barriers that make behavioral change more difficult.
- Cue to action means the events that bring about a person’s required behavior. Completing the HBM requires a consideration of two sides: internal cues such as the acknowledgement their own body condition, and the symptoms of diseases and sickness, and external cues such as obtaining information through mass media or warnings from loved ones or respected people such as husbands, wives, fathers, and mothers.
- Modifying factors are factors that do not directly affect health behavior but affect acknowledgement and practice, such as population factors including age and level of education, and sociopsychological factors including health motivation, which could modify an individual’s decision to use a helmet.
1.3. HBM in Transportation Safety Studies
2. Materials and Methods
2.1. Sample Characteristics
2.2. Survey Design
2.3. Multigroup Structural Equation Modeling
3. Results
3.1. Descriptive Statistics
3.2. Multigroup SEM
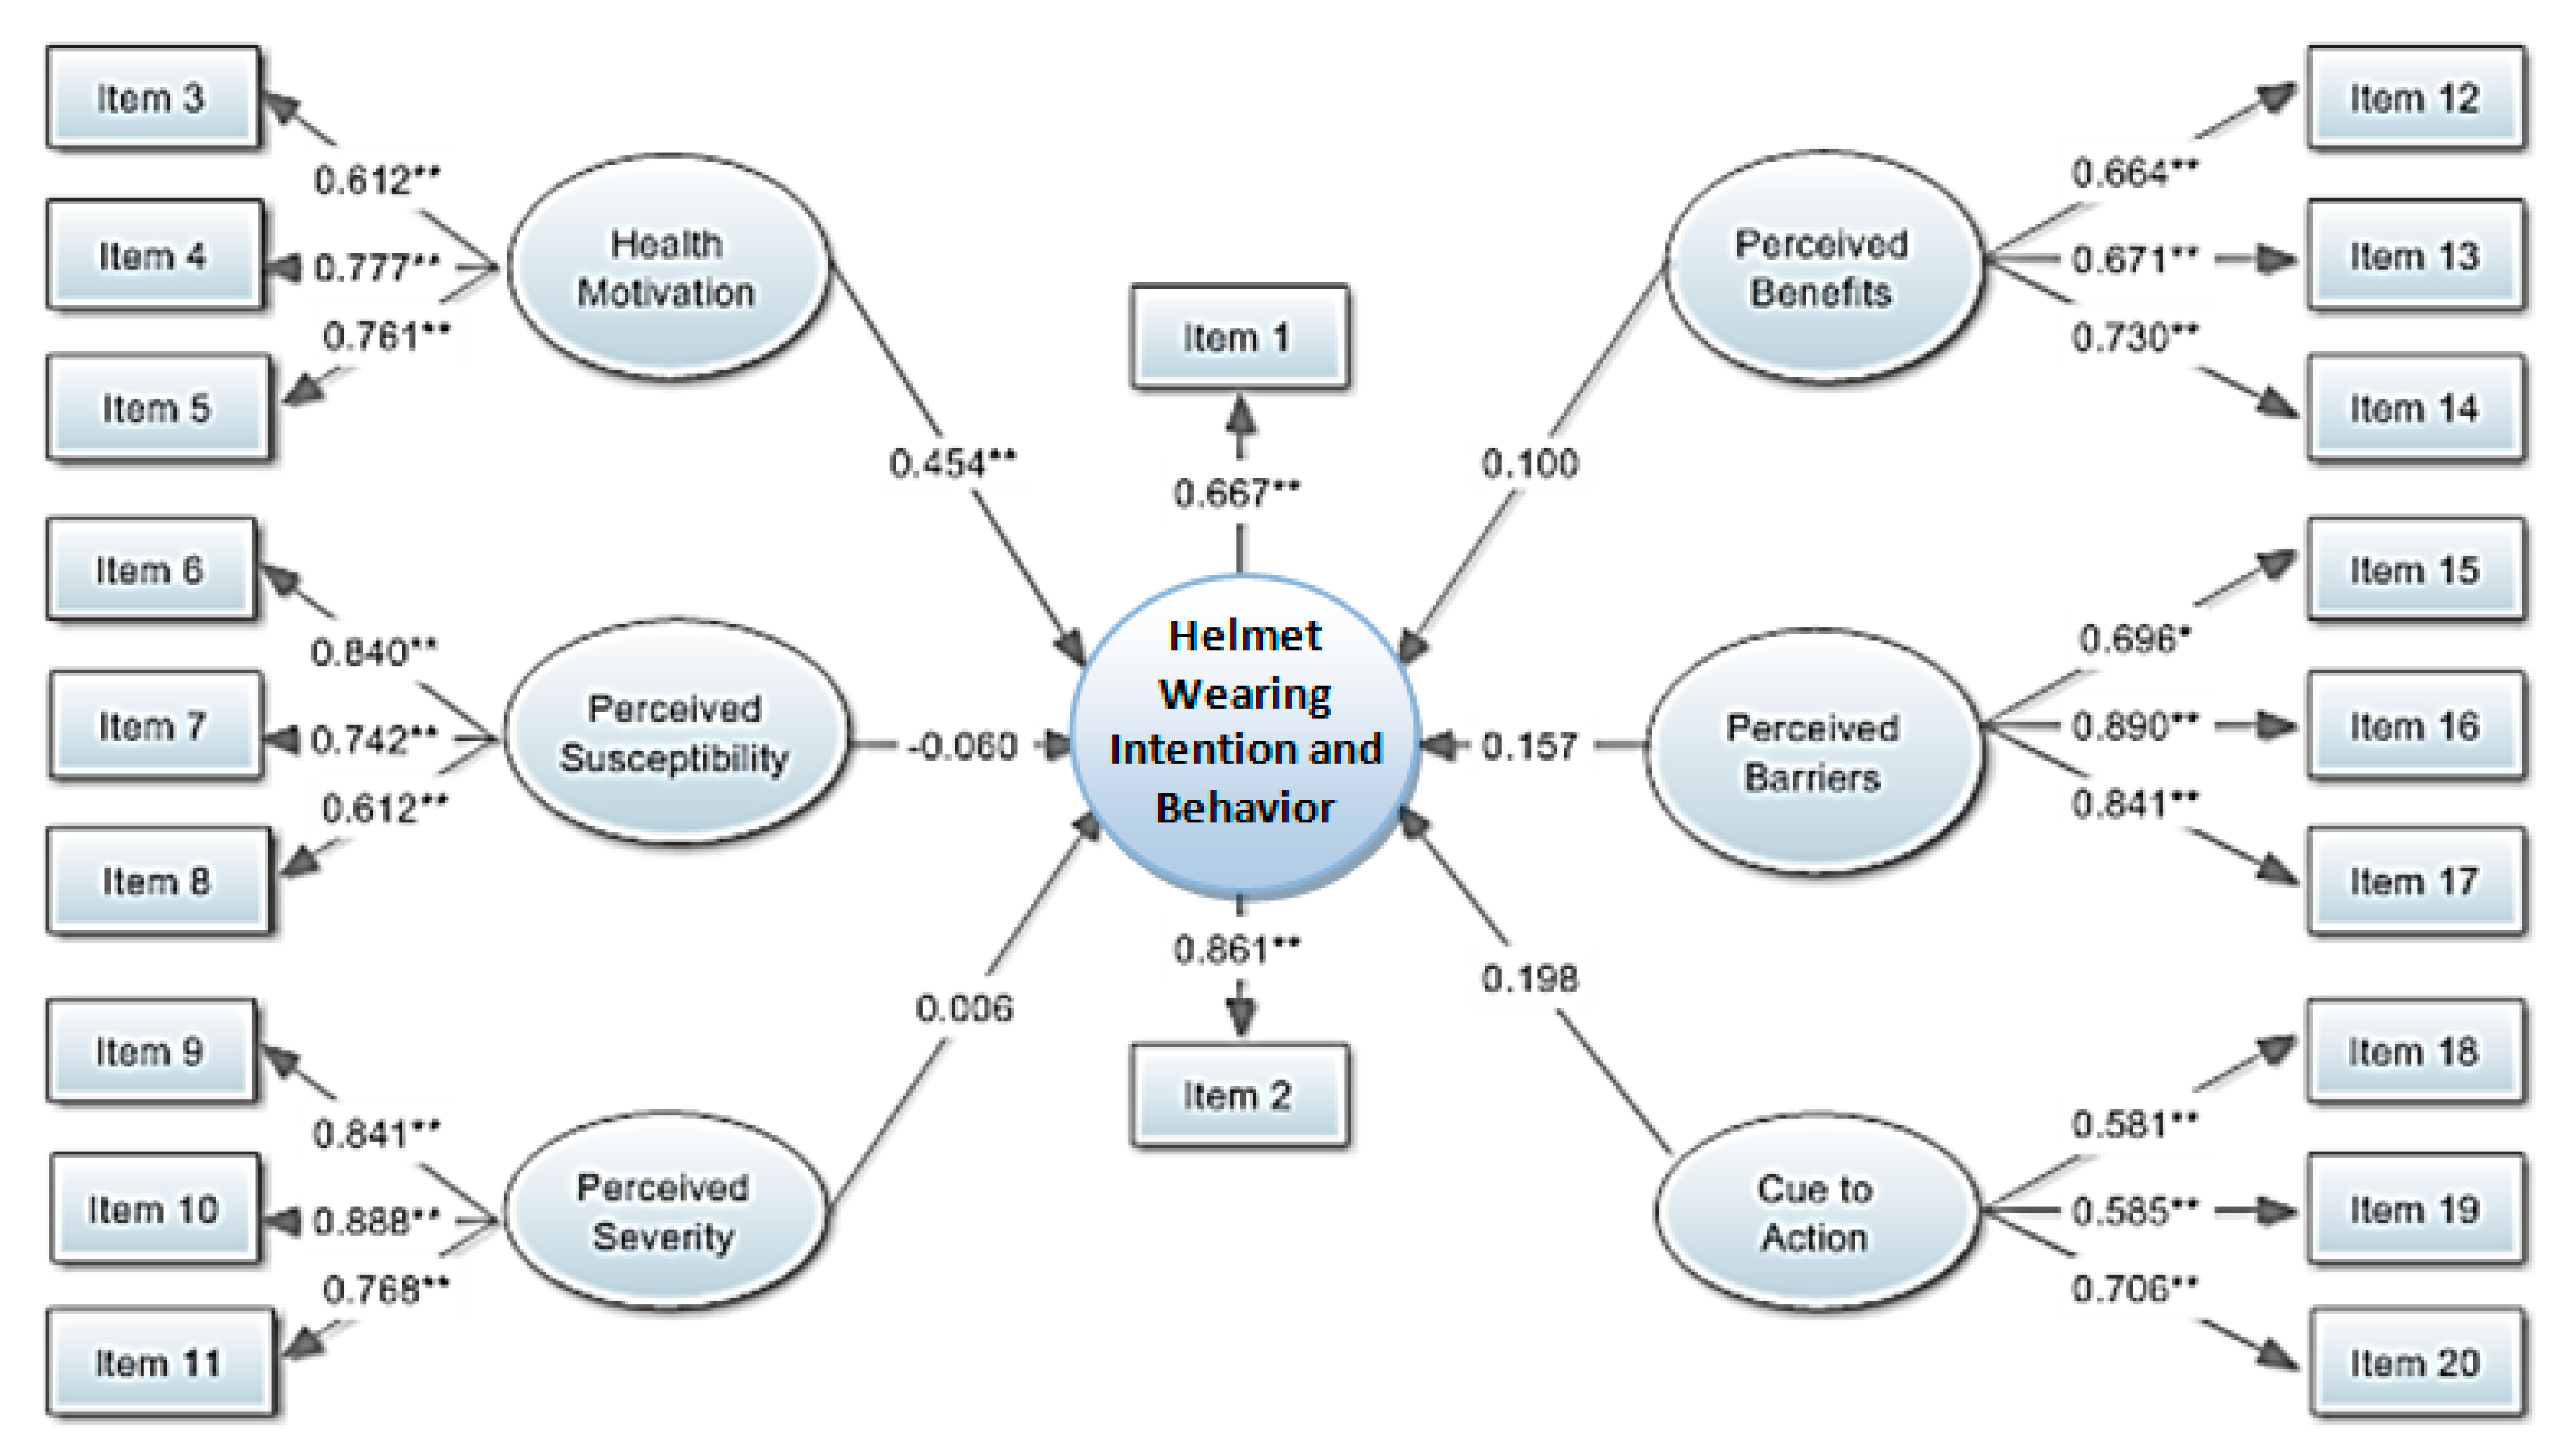
3.3. Urban Area HBM
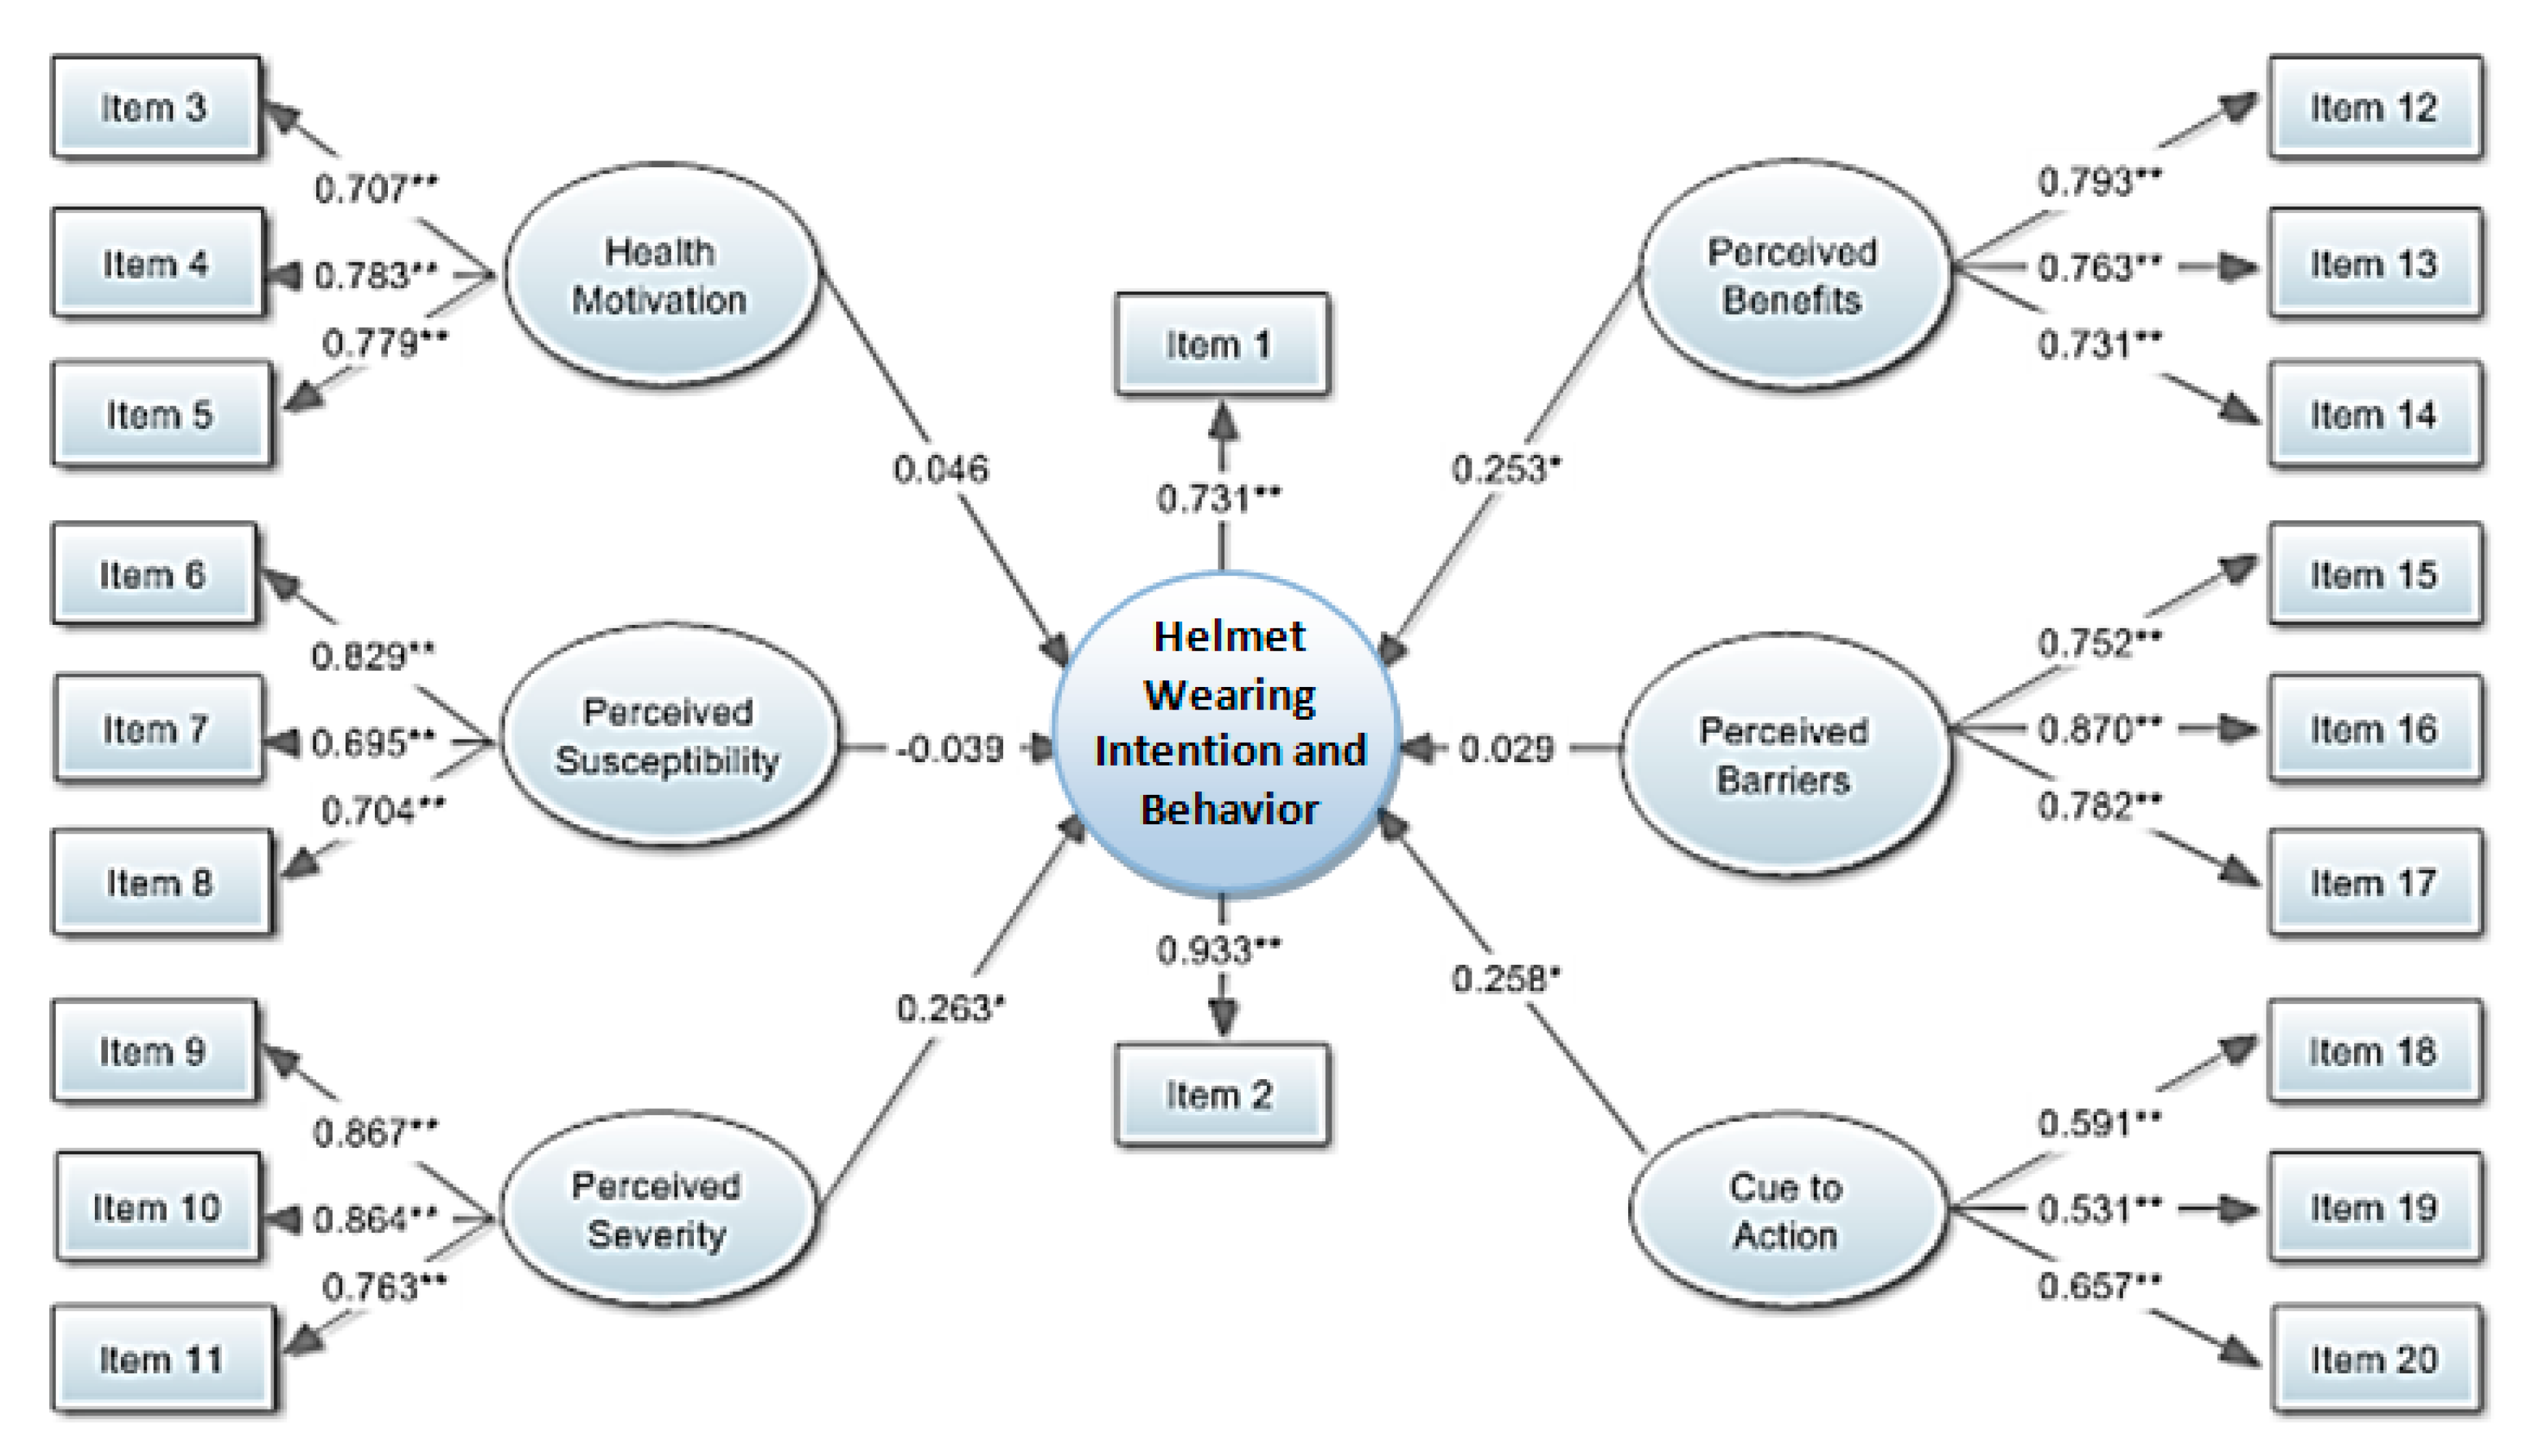
3.4. Rural Area HBM
4. Discussion and Conclusions
5. Limitations and Future Research Studies
Author Contributions
Funding
Acknowledgments
Conflicts of Interest
References
- Sheikh Abdul Kadir, I. Modeling Mode Choice Behavior of Motorcyclists in Malaysia. Ph.D. Thesis, Universiti Putra Malaysia, Putra, Malaysia, 2006. [Google Scholar]
- Yuen, C.W.; Karim, M.R.; Saifizul, A. Investigation on motorcyclist riding behaviour at curve entry in the down slope terrain. KSCE J. Civ. Eng. 2015, 19, 749–755. [Google Scholar] [CrossRef]
- Department of Land Transport. Transport Statistics. Available online: http://apps.dlt.go.th/statistics_web/statistics.html (accessed on 19 January 2019). (In Thai)
- Hsu, T.-P.; Sadullah, A.F.M.; Dao, N.X. A Comparison Study on Motorcycle Traffic Development in Some Asian Countries—Case of Taiwan, Malaysia and Vietnam; The Eastern Asia Society for Transportation Studies (EASTS): Tokyo, Japan, 2003. [Google Scholar]
- Chen, C.-F.; Lai, W.-T. The effects of rational and habitual factors on mode choice behaviors in a motorcycle-dependent region: Evidence from Taiwan. Transp. Policy 2011, 18, 711–718. [Google Scholar] [CrossRef]
- Liu, H.; Li, S.; Xiao, Q.; Feldman, M.W. Social Support and Psychological Well-Being Under Social Change in Urban and Rural China. Soc. Indic. Res. 2013, 119, 979–996. [Google Scholar] [CrossRef]
- Liang, Y.; Wang, P. Influence of Prudential Value on the Subjective Well-Being of Chinese Urban–Rural Residents. Soc. Indic. Res. 2013, 118, 1249–1267. [Google Scholar] [CrossRef]
- Bureau of Highway Safety. Road Accident Statistics. Available online: http://bhs.doh.go.th/statistic/type (accessed on 19 January 2019). (In Thai)
- Eid, H.O.; Barss, P.; Adam, S.H.; Torab, F.C.; Lunsjo, K.; Grivna, M.; Abu-Zidan, F.M. Factors affecting anatomical region of injury, severity, and mortality for road trauma in a high-income developing country: Lessons for prevention. Injury 2009, 40, 703–707. [Google Scholar] [CrossRef]
- Buckley, L.; Bingham, C.R.; Flannagan, C.A.; Carter, P.M.; Almani, F.; Cicchino, J.B. Observation of motorcycle helmet use rates in Michigan after partial repeal of the universal motorcycle helmet law. Accid. Anal. Prev. 2016, 95, 178–186. [Google Scholar] [CrossRef] [Green Version]
- Rice, T.M.; Troszak, L.; Ouellet, J.V.; Erhardt, T.; Smith, G.S.; Tsai, B.-W. Motorcycle helmet use and the risk of head, neck, and fatal injury: Revisiting the Hurt Study. Accid. Anal. Prev. 2016, 91, 200–207. [Google Scholar] [CrossRef] [Green Version]
- Ramli, R.; Oxley, J. Motorcycle helmet fixation status is more crucial than helmet type in providing protection to the head. Injury 2016, 47, 2442–2449. [Google Scholar] [CrossRef]
- Schnegg, M.; Massonnet, G.; Gueissaz, L. Motorcycle helmets: What about their coating? Forensic Sci. Int. 2015, 252, 114–126. [Google Scholar] [CrossRef]
- Ouellet, J.V.; Kasantikul, V. Motorcycle Helmet Effect on a Per-Crash Basis in Thailand and the United States. Traffic Inj. Prev. 2006, 7, 49–54. [Google Scholar] [CrossRef]
- Keng, S.-H. Helmet use and motorcycle fatalities in Taiwan. Accid. Anal. Prev. 2005, 37, 349–355. [Google Scholar] [CrossRef] [PubMed]
- Jou, R.-C.; Yeh, T.-H.; Chen, R.-S. Risk Factors in Motorcyclist Fatalities in Taiwan. Traffic Inj. Prev. 2011, 13, 155–162. [Google Scholar] [CrossRef] [PubMed]
- DeMarco, A.L.; Chimich, D.D.; Gardiner, J.C.; Nightingale, R.W.; Siegmund, G.P. The impact response of motorcycle helmets at different impact severities. Accid. Anal. Prev. 2010, 42, 1778–1784. [Google Scholar] [CrossRef] [PubMed]
- Fernandes, F.A.O.; Alves de Sousa, R.J. Motorcycle helmets—A state of the art review. Accid. Anal. Prev. 2013, 56, 1–21. [Google Scholar] [CrossRef]
- Nakahara, S.; Chadbunchachai, W.; Ichikawa, M.; Tipsuntornsak, N.; Wakai, S. Temporal distribution of motorcyclist injuries and risk of fatalities in relation to age, helmet use, and riding while intoxicated in Khon Kaen, Thailand. Accid. Anal. Prev. 2005, 37, 833–842. [Google Scholar] [CrossRef]
- Branas, C.C.; Knudson, M.M. Helmet laws and motorcycle rider death rates. Accid. Anal. Prev. 2001, 33, 641–648. [Google Scholar] [CrossRef] [Green Version]
- Houston, D.J.; Richardson, L.E. Motorcyclist fatality rates and mandatory helmet-use laws. Accid. Anal. Prev. 2008, 40, 200–208. [Google Scholar] [CrossRef]
- Ratanavaraha, V.; Jomnonkwao, S. Community participation and behavioral changes of helmet use in Thailand. Transp. Policy 2013, 25, 111–118. [Google Scholar] [CrossRef]
- Rosenstock, I.M. Historical Origins of the Health Belief Model. Health Educ. Behav. 1974, 2, 328–335. [Google Scholar] [CrossRef]
- Maiman, L.A.; Becker, M.H. The Health Belief Model: Origins and Correlates in Psychological Theory. Health Educ. Behav. 1974, 2, 336–353. [Google Scholar] [CrossRef]
- Tavafian, S.S.; Aghamolaei, T.; Gregory, D.; Madani, A. Prediction of Seat Belt Use among Iranian Automobile Drivers: Application of the Theory of Planned Behavior and the Health Belief Model. Traffic Inj. Prev. 2011, 12, 48–53. [Google Scholar] [CrossRef] [PubMed]
- Ross, T.P.; Ross, L.T.; Rahman, A.; Cataldo, S. The Bicycle Helmet Attitudes Scale: Using the Health Belief Model to Predict Helmet Use among Undergraduates. J. Am. Coll. Health 2010, 2010, 29–36. [Google Scholar] [CrossRef] [PubMed]
- Germeni, E.; Lionis, C.; Davou, B.; Th Petridou, E. Understanding reasons for non-compliance in motorcycle helmet use among adolescents in Greece. Inj. Prev. 2009, 15, 19–23. [Google Scholar] [CrossRef] [PubMed]
- Lajunen, T.; Räsänen, M. Can social psychological models be used to promote bicycle helmet use among teenagers? A comparison of the Health Belief Model, Theory of Planned Behavior and the Locus of Control. J. Saf. Res. 2004, 35, 115–123. [Google Scholar] [CrossRef] [PubMed]
- Quine, L.; Rutter, D.R.; Arnold, L. Predicting and understanding safety helmet use among schoolboy cyclists: A comparison of the theory of planned behaviour and the health belief model. Psychol. Health 1998, 13, 251–269. [Google Scholar] [CrossRef]
- Witte, K.; Stokols, D.; Ituarte, P.; Schneider, M. Testing the Health Belief Model in a Field Study to Promote Bicycle Safety Helmets. Commun. Res. 1993, 20, 564–586. [Google Scholar] [CrossRef]
- Dennis, A.C.; Bosson, N.; Peralta, J.E.C.; Castillo, C.; Foran, M.; Wall, S.P. Determinants of helmet wearing behavior among motorcyclists in the Dominican Republic. Int. J. Public Health Epidemiol. 2013, 2, 50–55. [Google Scholar]
- Aghamolaei, T.; Tavafian, S.S.; Madani, A. Prediction of Helmet Use among Iranian Motorcycle Drivers: An Application of the Health Belief Model and the Theory of Planned Behavior. Traffic Inj. Prev. 2011, 12, 239–243. [Google Scholar] [CrossRef]
- Ambak, K.; Ismail, R.; Abdullah, R.A.; Borhan, M.N. Using structural equation modeling and the behavioral sciences theories in predicting helmet use. In Proceedings of the International Conference on Advanced Science, Engineering and Information Technology, Putrajaya, Malaysia, 14–15 January 2011. [Google Scholar]
- Brijs, K.; Brijs, T.; Sann, S.; Trinh, T.A.; Wets, G.; Ruiter, R.A.C. Psychological determinants of motorcycle helmet use among young adults in Cambodia. Transp. Res. Part F Traffic Psychol. Behav. 2014, 26, 273–290. [Google Scholar] [CrossRef]
- Ali, M.; Haidar, N.; Ali, M.M.; Maryam, A. Determinants of Seat Belt Use Among Drivers in Sabzevar, Iran: A Comparison of Theory of Planned Behavior and Health Belief Model. Traffic Inj. Prev. 2011, 12, 104–109. [Google Scholar] [CrossRef]
- Golob, T.F. Structural equation modeling for travel behavior research. Transp. Res. Part B Methodol. 2003, 37, 1–25. [Google Scholar] [CrossRef] [Green Version]
- Stevens, J. Applied Multivariate Statistics for the Social Sciences; Lawrence Erlbaum Associates: Mahwah, NJ, USA, 1996. [Google Scholar]
- Byrne, B.M. Structural Equation Modeling with Mplus: Basic Concepts, Applications, and Programming; Taylor and Francis Group: Boca Raton, FL, USA, 2012. [Google Scholar]
- Raykov, T.; Marcoulides, G.A. A First Course in Structural Equation Modeling; Lawrence Erlbaum Associates, Inc.: Mahwah, NJ, USA, 2006. [Google Scholar]
- Brown, T.A. Confirmatory Factor Analysis for Applied Research; The Guilford Press: New York, NY, USA, 2006; p. 475. [Google Scholar]
- Koh, K.; Zumbo, B. Multi-Group Confirmatory Factor Analysis for Testing Measurement Invariance in Mixed Item Format Data. J. Mod. Appl. Stat. Methods JMASM 2008, 7, 471–477. [Google Scholar] [CrossRef]
- Teo, T.; Lee, C.B.; Chai, C.S.; Wong, S.L. Assessing the intention to use technology among pre-service teachers in Singapore and Malaysia: A multigroup invariance analysis of the Technology Acceptance Model (TAM). Comput. Educ. 2009, 53, 1000–1009. [Google Scholar] [CrossRef]
- Nunnally, J.C. Psychometric Theory, 2nd ed.; McGraw-Hill: New York, NY, USA, 1978. [Google Scholar]
- Kline, R.B. Priciples and Practice of Structural Equation Modeling; Guilford Press: New York, NY, USA, 2011. [Google Scholar]
- Hu, L.T.; Bentler, P.M. Cutoff criteria for fit indexes in covariance structure analysis: Conventional criteria versus new alternatives. Struct. Equ. Modeling A Multidiscip. J. 1999, 6, 1–55. [Google Scholar] [CrossRef]
- MacCallum, R.C.; Browne, M.W.; Sugawara, H.M. Power analysis and determination of sample size for covariance structure modeling. Psychol. Methods 1996, 1, 130–149. [Google Scholar] [CrossRef]


| No. | Authors (Year) | Categories | Analyzed Method | Health Belief Model | |||||
|---|---|---|---|---|---|---|---|---|---|
| Health Motivation | Perceived Susceptibility | Perceived Severity | Perceived Benefits | Perceived Barriers | Cue to Action | ||||
| 1 | Brijs, Brijs, Sann, Trinh, Wets, and Ruiter [34] | Motorcycle helmet use | Pearson correlation test, OLS regression analysis, two hierarchical regression analyses | - | ✓ * | ✓ | ✓ * | ✓ * | ✓ |
| 2 | Dennis, Bosson, Peralta, Castillo, Foran, and Wall [31] | Motorcycle helmet use | Text analysis | - | - | - | - | - | ✓ |
| 3 | Aghamolaei, Tavafian, and Madani [32] | Motorcycle helmet use | Regression analysis | ✓ * | ✓ | ✓ | ✓ | ✓ * | ✓ * |
| 4 | Ali, Haidar, Ali, and Maryam [35] | Safety belt use | Regression analysis | - | ✓ * | ✓ | ✓ | ✓ * | ✓ * |
| 5 | Ambak, Ismail, Abdullah, and Borhan [33] | Motorcycle helmet use | SEM | ✓ * | ✓ | ✓ | ✓ | ✓ | ✓ |
| 6 | Tavafian, Aghamolaei, Gregory, and Madani [25] | Safety belt use | Regression analysis | ✓ | ✓ | ✓ * | ✓ * | ✓ | ✓ |
| 7 | Ross, Ross, Rahman, and Cataldo [26] | Bicycle helmet use | Exploratory factor analysis, ANOVA | ✓ | ✓ | ✓ | ✓ | ✓ | ✓ |
| 8 | Germeni, Lionis, Davou, and Th Petridou [27] | Bicycle helmet use | Focus group | - | ✓ | ✓ | ✓ | ✓ | ✓ |
| 9 | Lajunen and Räsänen [28] | Bicycle helmet use | SEM | ✓ * | ✓ | ✓ * | ✓ | ✓ * | ✓ * |
| 10 | Quine, Rutter, and Arnold [29] | Bicycle helmet use | SEM | - | ✓ | ✓ | ✓ * | ✓ * | ✓ |
| 11 | Witte, Stokols, Ituarte, and Schneider [30] | Bicycle helmet use | Correlations | - | - | - | - | - | ✓ * |
| Variables Used in the Study | Urban Society (n = 401) | Rural Society (n = 400) | Pooled Sample (n = 801) | ||||
|---|---|---|---|---|---|---|---|
| M | SD | M | SD | M | SD | ||
| Helmet wearing intention and behavior | α = 0.736 | α = 0.807 | α = 0.777 | ||||
| Item 1 | In the previous week, I always wore a helmet (100%) when riding, and/or sitting on the back of a motorcycle | 5.75 | 1.28 | 5.66 | 1.41 | 5.71 | 1.35 |
| Item 2 | Within the next four weeks, I have the intention to always wear a helmet (100% when riding and/or sitting on the back of a motorcycle | 5.99 | 1.07 | 5.85 | 1.24 | 5.92 | 1.16 |
| Health motivation | α = 0.753 | α = 0.801 | α = 0.784 | ||||
| Item 3 | I think that street accidents are the worst | 6.19 | 1.07 | 6.01 | 1.21 | 6.10 | 1.15 |
| Item 4 | I think that health is the most important issue | 6.47 | 0.88 | 6.22 | 1.18 | 6.35 | 1.05 |
| Item 5 | I mostly give importance to safety when riding a motorcycle | 6.22 | 1.01 | 6.06 | 1.19 | 6.14 | 1.11 |
| Perceived Susceptibility | α = 0.764 | α = 0.785 | α = 0.775 | ||||
| Item 6 | I do not ride a motorcycle at high speed so I need not wear a helmet | 3.90 | 2.01 | 3.84 | 1.89 | 3.87 | 1.96 |
| Item 7 | I think that I do not need to wear a helmet when riding to a nearby place | 4.22 | 2.04 | 4.06 | 1.97 | 4.14 | 2.01 |
| Item 8 | I have experience of riding for several years so I am able to avoid accidents when riding | 4.66 | 1.85 | 4.50 | 1.87 | 4.58 | 1.87 |
| Perceived Severity | α = 0.861 | α = 0.867 | α = 0.886 | ||||
| Item 9 | If an accident happens when I am riding a motorcycle without wearing a helmet, it may cause my death | 6.20 | 1.03 | 6.04 | 1.29 | 6.12 | 1.17 |
| Item 10 | If an accident happens when I am riding a motorcycle without wearing a helmet, it may cause a handicap, a disability, or time-consuming rehabilitation | 6.15 | 1.12 | 5.98 | 1.29 | 6.06 | 1.21 |
| Item 11 | If an accident happens when I am riding a motorcycle without wearing a helmet, it will greatly affect my study or my work | 6.14 | 1.13 | 5.92 | 1.36 | 6.03 | 1.26 |
| Perceived Benefits | α = 0.740 | α = 0.808 | α = 0.785 | ||||
| Item 12 | Wearing a helmet when riding a motorcycle helps me feel safer | 6.08 | 1.08 | 5.88 | 1.33 | 5.98 | 1.22 |
| Item 13 | A helmet is an efficient accessory for reducing the severity of injuries when accidents happen | 6.06 | 1.09 | 5.76 | 1.32 | 5.91 | 1.22 |
| Item 14 | I believe that motorcycle riders who do not wear helmets have more chances to die | 6.11 | 1.15 | 5.88 | 1.32 | 6.00 | 1.25 |
| Perceived Barriers | α = 0.861 | α = 0.843 | α = 0.853 | ||||
| Item 15 | When wearing a helmet, I feel uncomfortable | 4.41 | 1.85 | 4.36 | 1.84 | 4.38 | 1.85 |
| Item 16 | I think that when wearing a helmet, it makes me awkward and funny like a crown | 3.70 | 2.07 | 3.65 | 1.97 | 3.67 | 2.03 |
| Item 17 | I think that helmets are too expensive for their real value or benefits | 3.78 | 2.01 | 3.74 | 1.99 | 3.76 | 2.00 |
| Cue to action | α = 0.701 | α = 0.643 | A = 0.636 | ||||
| Item 18 | I have a lot of friends who regularly wear helmets when riding a motorcycle | 5.76 | 1.20 | 5.49 | 1.35 | 5.62 | 1.29 |
| Item 19 | My parents told me to wear a helmet when I was young | 5.53 | 1.43 | 5.29 | 1.65 | 5.30 | 1.57 |
| Item 20 | I have seen advertisements on television, signs, or posters about the importance of wearing a helmet when riding a motorcycle | 5.88 | 1.22 | 5.69 | 1.28 | 5.43 | 1.44 |
| Description | χ2 | df | χ2/df | CFI | TLI | SRMR | RMSEA (90% CI) | Delta-χ2 | Delta-df | p |
|---|---|---|---|---|---|---|---|---|---|---|
| Individual groups: | ||||||||||
| Model 1: Urban | 287.087 | 147 | 1.95 | 0.959 | 0.947 | 0.038 | 0.049 (0.040–0.057) | |||
| Model 2: Rural | 311.825 | 149 | 2.09 | 0.957 | 0.945 | 0.042 | 0.052 (0.044–0.060) | |||
| Measurement of invariance: | ||||||||||
| Simultaneous model | 584.568 | 294 | 1.98 | 0.960 | 0.948 | 0.040 | 0.050 (0.044–0.056) | |||
| Factor loading, intercepts, structural paths held equal across groups | 643.938 | 333 | 1.93 | 0.957 | 0.951 | 0.052 | 0.048 (0.043–0.054) | 59.37 | 39 | 0.019 |
| Variable | Urban Area | Rural Area | ||||||
|---|---|---|---|---|---|---|---|---|
| Estimate | Standard Error | p-Value | R2 | Estimate | Standard Error | p-Value | R2 | |
| Item 1 | 0.667 | 0.040 | <0.001 | 0.445 | 0.731 | 0.031 | <0.001 | 0.534 |
| Item 2 | 0.861 | 0.039 | <0.001 | 0.741 | 0.933 | 0.027 | <0.001 | 0.871 |
| Item 3 | 0.612 | 0.038 | <0.001 | 0.375 | 0.707 | 0.031 | <0.001 | 0.500 |
| Item 4 | 0.777 | 0.029 | <0.001 | 0.604 | 0.783 | 0.027 | <0.001 | 0.613 |
| Item 5 | 0.761 | 0.030 | <0.001 | 0.579 | 0.779 | 0.027 | <0.001 | 0.607 |
| Item 6 | 0.840 | 0.027 | <0.001 | 0.705 | 0.829 | 0.029 | <0.001 | 0.686 |
| Item 7 | 0.742 | 0.030 | <0.001 | 0.551 | 0.695 | 0.033 | <0.001 | 0.483 |
| Item 8 | 0.612 | 0.038 | <0.001 | 0.375 | 0.704 | 0.034 | <0.001 | 0.495 |
| Item 9 | 0.841 | 0.019 | <0.001 | 0.707 | 0.867 | 0.017 | <0.001 | 0.752 |
| Item 10 | 0.888 | 0.016 | <0.001 | 0.788 | 0.864 | 0.017 | <0.001 | 0.746 |
| Item 11 | 0.768 | 0.024 | <0.001 | 0.590 | 0.763 | 0.024 | <0.001 | 0.582 |
| Item 12 | 0.664 | 0.035 | <0.001 | 0.440 | 0.793 | 0.024 | <0.001 | 0.629 |
| Item 13 | 0.671 | 0.036 | <0.001 | 0.451 | 0.763 | 0.027 | <0.001 | 0.582 |
| Item 14 | 0.730 | 0.030 | <0.001 | 0.533 | 0.731 | 0.029 | <0.001 | 0.535 |
| Item 15 | 0.696 | 0.038 | <0.001 | 0.484 | 0.752 | 0.028 | <0.001 | 0.566 |
| Item16 | 0.890 | 0.028 | <0.001 | 0.791 | 0.870 | 0.023 | <0.001 | 0.757 |
| Item 17 | 0.841 | 0.028 | <0.001 | 0.707 | 0.782 | 0.026 | <0.001 | 0.612 |
| Item 18 | 0.581 | 0.042 | <0.001 | 0.338 | 0.591 | 0.043 | <0.001 | 0.349 |
| Item 19 | 0.585 | 0.042 | <0.001 | 0.343 | 0.532 | 0.047 | <0.001 | 0.284 |
| Item 20 | 0.706 | 0.037 | <0.001 | 0.499 | 0.657 | 0.044 | <0.001 | 0.432 |
| Urban Area | Rural Area | ||||||||
|---|---|---|---|---|---|---|---|---|---|
| Hypotheses | Standardized Estimates | Standard Error | p-Value | Conclusion | Standardized Estimates | Standard Error | p-Value | Conclusion | |
| 1 | Health motivation→ Helmet wearing intention and behavior | 0.454 | 0.102 | <0.001 ** | Supported | 0.046 | 0.092 | 0.620 | Not supported |
| 2 | Perceived susceptibility→ Helmet wearing intention and behavior | -0.060 | 0.082 | 0.463 | Not supported | -0.039 | 0.068 | 0.563 | Not supported |
| 3 | Perceived severity→ Helmet wearing intention and behavior | 0.006 | 0.130 | 0.961 | Not supported | 0.263 | 0.109 | 0.016 * | Supported |
| 4 | Perceived benefits→ Helmet wearing intention and behavior | 0.100 | 0.280 | 0.722 | Not supported | 0.253 | 0.123 | 0.040 * | Supported |
| 5 | Perceived barriers→ Helmet wearing intention and behavior | 0.157 | 0.084 | 0.062 | Not Supported | 0.029 | 0.064 | 0.650 | Not supported |
| 6 | Cue to action→ Helmet wearing intention and behavior | 0.198 | 0.189 | 0.296 | Not supported | 0.258 | 0.114 | 0.024 * | Supported |
© 2020 by the authors. Licensee MDPI, Basel, Switzerland. This article is an open access article distributed under the terms and conditions of the Creative Commons Attribution (CC BY) license (http://creativecommons.org/licenses/by/4.0/).
Share and Cite
Jomnonkwao, S.; Watthanaklang, D.; Sangphong, O.; Champahom, T.; Laddawan, N.; Uttra, S.; Ratanavaraha, V. A Comparison of Motorcycle Helmet Wearing Intention and Behavior between Urban and Rural Areas. Sustainability 2020, 12, 8395. https://doi.org/10.3390/su12208395
Jomnonkwao S, Watthanaklang D, Sangphong O, Champahom T, Laddawan N, Uttra S, Ratanavaraha V. A Comparison of Motorcycle Helmet Wearing Intention and Behavior between Urban and Rural Areas. Sustainability. 2020; 12(20):8395. https://doi.org/10.3390/su12208395
Chicago/Turabian StyleJomnonkwao, Sajjakaj, Duangdao Watthanaklang, Onanong Sangphong, Thanapong Champahom, Napat Laddawan, Savalee Uttra, and Vatanavongs Ratanavaraha. 2020. "A Comparison of Motorcycle Helmet Wearing Intention and Behavior between Urban and Rural Areas" Sustainability 12, no. 20: 8395. https://doi.org/10.3390/su12208395