Comparison of Product Life Cycle Cost Estimating Models Based on Neural Networks and Parametric Techniques—A Case Study for Induction Motors


Faculty of Management and Production Engineering, Lodz University of Technology, 90-924 Łódź, Poland
*
Author to whom correspondence should be addressed.
Sustainability 2020, 12(20), 8353; https://doi.org/10.3390/su12208353
Submission received: 17 August 2020
/
Revised: 6 October 2020
/
Accepted: 9 October 2020
/
Published: 11 October 2020
(This article belongs to the Special Issue Sustainable Business Model and Digital Transformation)
Abstract
:The cost estimation of a product’s life cycle is a key factor in the product design process. The research is based on an innovative model of artificial neural networks (ANNs) compared to a parametric estimation. Introducing modern elements of information technologies in the area of cost estimation for a production company is a vital element of its sustainability in the era of Industry 4.0. The presented modern product life cycle cost estimation tool in the form of ANN is a reliable source of forecast that is the basis for the product life cycle cost reduction program, which is a crucial element of sustainability. Research shows that ANNs are a viable alternative to parametric cost estimation. The percentage error between estimated and historical cost values is 8.05 times lower for ANN than for the parametric approach. ANN is an adequate cost estimation model for technologically complex products. The second contribution is using technical specifications required by the customer directly to estimate the cost of a product’s life cycle automatically. This can translate both into a reduction of the time needed to provide information to the client and the workload of engineers.
1. Introduction
According to the latest research, sustainability in the production industry strongly depends on the use of information and communication technologies [1]. As it was indicated in [2], manufacturing firms should focus more on real-time learning from large data and contextual decision making, which will reduce the complexity of human decisions. Introducing elements of Industry 4.0 to a company can lead to, inter alia, improved sustainability and time savings, as well as a significant reduction in costs (over the entire product life cycle [3]) and physical stress [4]. Nowadays, unrestricted availability and high competitiveness between products on global markets create high expectations for product engineers. Newly implemented products must meet the needs of consumers in terms of technology, usability, quality, and culture. Another important expectation for product engineers is to create products that will be relatively easy to produce, and where the product life cycle cost will be commensurate with its qualitative, functional, and technological parameters [5]. In the product concept and design phase, several evaluations are carried out concerning the functionality, quality, and profitability of resulting products [6,7]. The concept of a product life cycle enables the determination of costs related to its life cycle and the formulation of cost strategies for new products and projects accordingly [8]. In order to optimize the product design process, typical concurrent engineering is used [9]. An optimized concurrent engineering environment provides an opportunity to substantially reduce the total cost of a product’s life cycle. This is because integrated product teams containing members of various skilled disciplines, contribute simultaneously to early product development and definition. Therefore, within a fully integrated product development cycle, multidisciplinary teams working together increase the probability of a reduced life cycle cost by avoiding costly alterations in subsequent design phases [10]. The study considers the costs of the design phase, production, distribution, and marketing of the product which is a common scope in the field of life cycle product costing (probabilistic approach) [11]. Due to the long product life (reaching even several dozen years), the costs related to the disposal/recycling phase are not in the scope of the production company and are transferred to the buyers. The borders of the presented model correspond to the cradle-to-door approach which is one of the known practices in the life cycle assessment area [12,13]. The cost estimation is the basis for the implementation of the product life cycle cost reduction program (optimization of the resource usage is the value analysis) to the target cost. ANNs represent the tool for precise estimations. This new approach constitutes the novelty of the paper. It optimizes the product life cycle cost, i.e., minimizing the consumption of resources related to the life of the product, according to the economic principles of sustainability (see [14]). The level of life cycle costs is one of the basic factors influencing the success of a product in a competitive market. Estimating the product life cycle costs is a fundamental determinant for technical and business decisions made by product engineers related to the design and management of new product costs [15,16].
The accuracy of a product life cycle cost estimation is a decisive factor in a product’s success at an early stage of its operation on the market. When the product life cycle costs are estimated too high, this may lead to the cancellation of a new product’s implementation, because the company may not achieve the desired profit in the future [17]. Improved cost estimation techniques available to product engineers make it easier to control the product life cycle costs during the design process. Despite the great importance of cost estimation, it is neither a simple nor a straightforward task, because of a lack of available information in the early project stages [18].
As is the practice of manufacturing companies, product engineers regularly use parametric estimations for the product life cycle costs [10]. The parametric approach focuses on the characteristics of a product without its complete description to estimate its cost [19]. The main principle of the parametric model estimation is utilizing the cost estimating relationship (CER) [20]. The parametric model enables the efficient use of cost drivers for the purpose of estimating the product life cycle cost. The improvement of techniques for parametric estimation of life cycle costs is not proportionate to changes in industrial technologies, and their accuracy, complexity, and adequacy are insufficient. The relevance of the parametric model depends on the correctness of the mathematical description of the relationship between model variables and the set of data used for its construction. Niazi et al. [21] indicated that inaccurate parameterization of the model leads to bias, especially in non-linear relationships between variables (costs and their drivers). Parametric estimation is an excellent predictor of costs when the correct procedures are followed; the data is meaningful and accurate, and assumptions are clearly identified and carefully documented [22,23,24]. Modifications to the parametric estimation model (e.g., feature-based costing) are being developed and implemented in order to adapt it to the shifting industrial environment [25].
At the turn of the twentieth and twenty-first century, there was great interest from production companies in modern techniques of product cost estimation, namely artificial neural networks—ANNs (see [26,27]). Zhang et al. [28] have used this technique to estimate the cost of packaging products by establishing a relation between their cost and cost-related features. Wang et al. [29] showed that ANNs have the potential to overcome drawbacks and limitations of parametric product cost estimation. They can be complex models of non-parametric forecasting of product costs, which is one of their main advantages over the traditional approach—parametric forecasting. As early as 2002, Seo et al. [30] conducted the first study on the estimation of a product’s life cycle cost using ANNs. In 1995, the first comparative study between ANNs versus parameter-based applications was conducted by Garza and Rouhana [31]. In 2004, Kim et al. [32] carried out a similar comparative study in the field of construction projects. The research showed that ANNs could estimate product life cycle costs without a need for the mathematical description of functional relations between independent variables (cost drivers) and dependent variables (project costs), or a need to define assumptions concerning the form of costs. Ikeda and Hiyama [33] presented the use of four ANN models to estimate the production costs of improved models of induction motors in the Department of Large Rotating Machinery, Toshiba Mitsubishi-Electric Industrial Systems Corporation. Weckman et al. [34] showed that even with limited data, the ANN model is able to produce a superior cost estimate in a fraction of the time required by the parametric cost estimation process. This significant improvement over parametric cost estimation can be attributed to the ANN’s ability to handle complex data sets with many inputs and few data points. The most recent study on the use of ANN models in estimating flow time and cost estimation for transformer orders was carried out in [35]. The authors of this study conclude that the input variables in ANN are the technical specifications of the product set out by the consumer, which renders the ANN model more useful than the parametric model. Similar statements have also been made in various studies based on comparisons between ANN and parametric estimation [36,37,38]. These studies show that ANN is more reliable and consistent for different types of estimation.
The aim of this study was both to compare the accuracy and effectiveness of two estimation techniques (i.e., ANN and parametric models) in estimating product life cycle costs. The literature review given in Section 1 indicates that there is no prior study that uses product specifications or order specifications as required by the consumer to predict the product life cycle cost, other than using the CER (parametric model). In other words, the product life cycle costs have not been predicted by taking into account both the properties of the product and consumer specifications. Section 2.1 briefly describes the case study company. In Section 2.2 and Section 2.3, the research methods are described. In Section 3, the collected cost data are applied to the two approaches in question (the ANN and parametric model), and the performance of the ANN vis-à-vis that of the parametric techniques is compared. The empirical results are discussed in Section 4. The conclusions are summarized in Section 5.
2. Materials and Methods
2.1. Production System of the Company
The source of empirical data used in this research is an induction motor production company from Poland (company name withheld for proprietary trade secrets, data presented in the manuscript in Section 2.2 is partially changed and narrowed down due to the same reason). Data used in the research, which is referred to as the presented final results of estimation, are the original data from the company and has not undergone any modification.
According to the organizational structure of the case study company, three main departments of production can be distinguished: (i) production, (ii) support, and (iii) service. The production division is directly responsible for the production of main induction motor parts. The support divisions produce auxiliary products used in the production department, i.e., dioramas, tools, and machines. The name “service departments” refers to divisions involved inter alia in processes such as transportation, staff training, market research, research, and development (R&D). The production process (production phase) in a simplified form is presented in Figure 1.
2.2. Parametric Cost Estimation of the Product Life Cycle
The company produces a wide range of induction motors. These products have different production standards depending on the parameters of a given induction motor. The company uses standard costing, which is an element of the SAP-ERP information system. Standard costing generates the necessary data on cost standards and the consumption of production resources. The standard data (direct labor-hours per input unit, direct labor rate per hour, direct materials—kg per input unit, price of input direct materials unit, machine-hours per output unit, variable and fixed overhead cost rates per machine-hour, activities costs, and production volume) used in the parametric estimation of a product’s life cycle was obtained from the company’s controlling SAP-ERP model database.
In the case study, we analyzed the induction motor type 4Sm412H-6-AT5 produced by a Polish company. The product parameters are presented in Table 1.
Production lines used to build induction motors have a mass and repetitive character. This kind of product can be analyzed successfully by the parametric product life cycle cost estimation models—widely regarded as one of the most popular methods for estimating the cost of a product’s life cycle, especially at the early stages of development. Using a simple mathematical formula, it is possible to derive the relationship between technological parameters and the cost of a part or cycle phase [17].
The CER can be present as a cost function derived from both (i) technological parameters (cost drivers) and (ii) financial parameters (price/rate). The direct material cost, direct labor cost, and overhead production cost present the relationships between the cost drivers (direct labor-hours per input unit, direct materials—kg per input unit, machine-hours per output unit) and the price/rates of these drivers (direct labor rate per hour, price of direct materials, overhead production cost rate per machine-hour). The overhead production cost can be divided into (i) variable and (ii) fixed costs. Standard costing can be realized through two approaches: (i) absorption and (ii) variable costing. The former results in proportionalities of fixed overhead production costs in the product, similar to the latter. Variable costing approach results in the fact that fixed overhead production costs in the parametric estimation of a product’s life cost are allocated to the product in the same way as variable overhead production costs (this approach is very often criticized by theorists, but in practice, it is widely used by enterprises using ERP systems). The cost of the design, research, marketing, and distribution phases is estimated according to the cost of activities for a given production volume [11].
The CER for the production phase is defined as:
where CD—cost driver, FP—financial parameter.
CER = CD × FP,
The CER for the design and the distribution and marketing phase is calculated as follows:
where FP—financial parameter, PV—production volume until the product is withdrawn from production.
CER = FP/PV,
Table 2 presents the estimated product life cycle costs by the parametric method.
Then the product life cycle cost is equal to 7226.00 USD—the sum of CER for all product life cycle phases: design, production, distribution, and marketing.
According to the cost table (Table 2), the main component of the estimated cost structure of the product’s life cycle is the production phase (Figure 2).
In the case study, the parametric cost estimation of the product life cycle was carried out for one induction motor only (Table 2) in order to present the parametric estimation methodology. For the remaining five induction motors, the estimated cost of the product life was calculated based on the same methodology. Table 3 presents the test set data structure with example values.
2.3. Artificial Neural Networks in the Product Life Cycle Cost Estimation
The origins of ANNs date back to 1943. The principle of a single artificial neuron was presented in [39]. Signals at the inputs of a neuron (equivalent to biological dendrites) are multiplied by real numbers (so-called weights), constituting the total neuron stimulation. This value is then modified by an activation function. In this role, the commonly used functions belong to logistic, hyperbolic tangent, sine, and identity. The signal leaves the nerve cell via the output (which is equivalent to an axon). The currently used networks have neurons grouped into structures called layers. A multilayer perceptron (MLP) has three types of layers: input (neurons retrieve data from outside the ANN), optional hidden (typically one or two layers), and output. MLP with a minimum of two hidden layers—according to Kolmogorov’s theory—can model any continuous function [40].
A set of real historical data, which we used to estimate the product life cycle costs were used in building the ANN model. The data contained 90 cases for different types of induction motors. The historical data (hereinafter referred to as the expected cost of the product life cycle) was obtained from the company’s SAP-ERP database controlling module. The expected cost of the product life cycle contains real, historical cost values and was used in ANNs to train and evaluate the estimation of the product life cycle cost (an ANN model output; out of sample estimation).
Table 4 presents the set of six explanatory (input) and one explained (output) variables used in the research.
We divided the data randomly into three sets: training, validation, and test in the manner shown in Figure 3. Such a division was related to the amount of available data (different types of induction motors) and constituted a compromise between the desired high number of teaching resources (required for more effective training and lower estimation errors) and the number of cases in test resources (necessary for reliable evaluation of the model’s operation). It was also confirmed in the empirical research described in [41].
Two types of ANNs, with unidirectional data flow, were tested: MLP and radial basis function (RBF) networks ([42,43]). Figure 4 shows a construction scheme of ANNs used in the research: the MLP with a single hidden layer and RBF model, respectively.
The scheme of the research method is presented in Figure 5.
The approach used in the research has the limitation connected with the necessity to optimize a lot of the models’ parameters. It can be done completely by a human or with the support of software. In both cases, the human factor plays an important role (when it comes to the final model precision) at the stages of its creation and optimization. However, such limitations do not exist at the stage of using the previously optimized model i.e., during the estimation cost of the product life cycle.
3. Results
The number of tested ANNs surpassed 10,500, therefore only the most precise networks of both types were presented in the study.
In the case of MLP, its relatively non-complex structure is the result of empirical research. Both the increase and the decrease in the number of neurons in the hidden layer led to a decrease in the precision of the model. Also, the enrichment of MLP with subsequent hidden layers resulted in an increase in the estimation error. This is confirmed by the necessity of keeping the model as simple as possible (avoiding its excessive complexity), a need often postulated in the literature [41].
Our studies have shown that MLP-type networks generate a significantly better cost estimation for induction motors than RBF networks. The mean absolute percentage error (MAPE) for the best MLP was 9.01% and 17.27% for the most precise RBF network. The training parameters and network structure (Table 5) were selected automatically by the simulator to minimize the error function—the sum of squares (SOS). Figure 6 presents estimation errors (for the data from the test set) generated by the MLP and the RBF network (the development of [41]).
For both types of ANN, there is a noticeable increase in the estimation error for the lower-cost engines. The reason for such a low precision can be an insufficient number of cases of the low cost of the product life cycle in the training set. This may indicate an increased risk of unacceptable low precision of estimation if the product’s cost strongly differs from the average value [41].
3.1. Regression Analysis as a Comparative Model
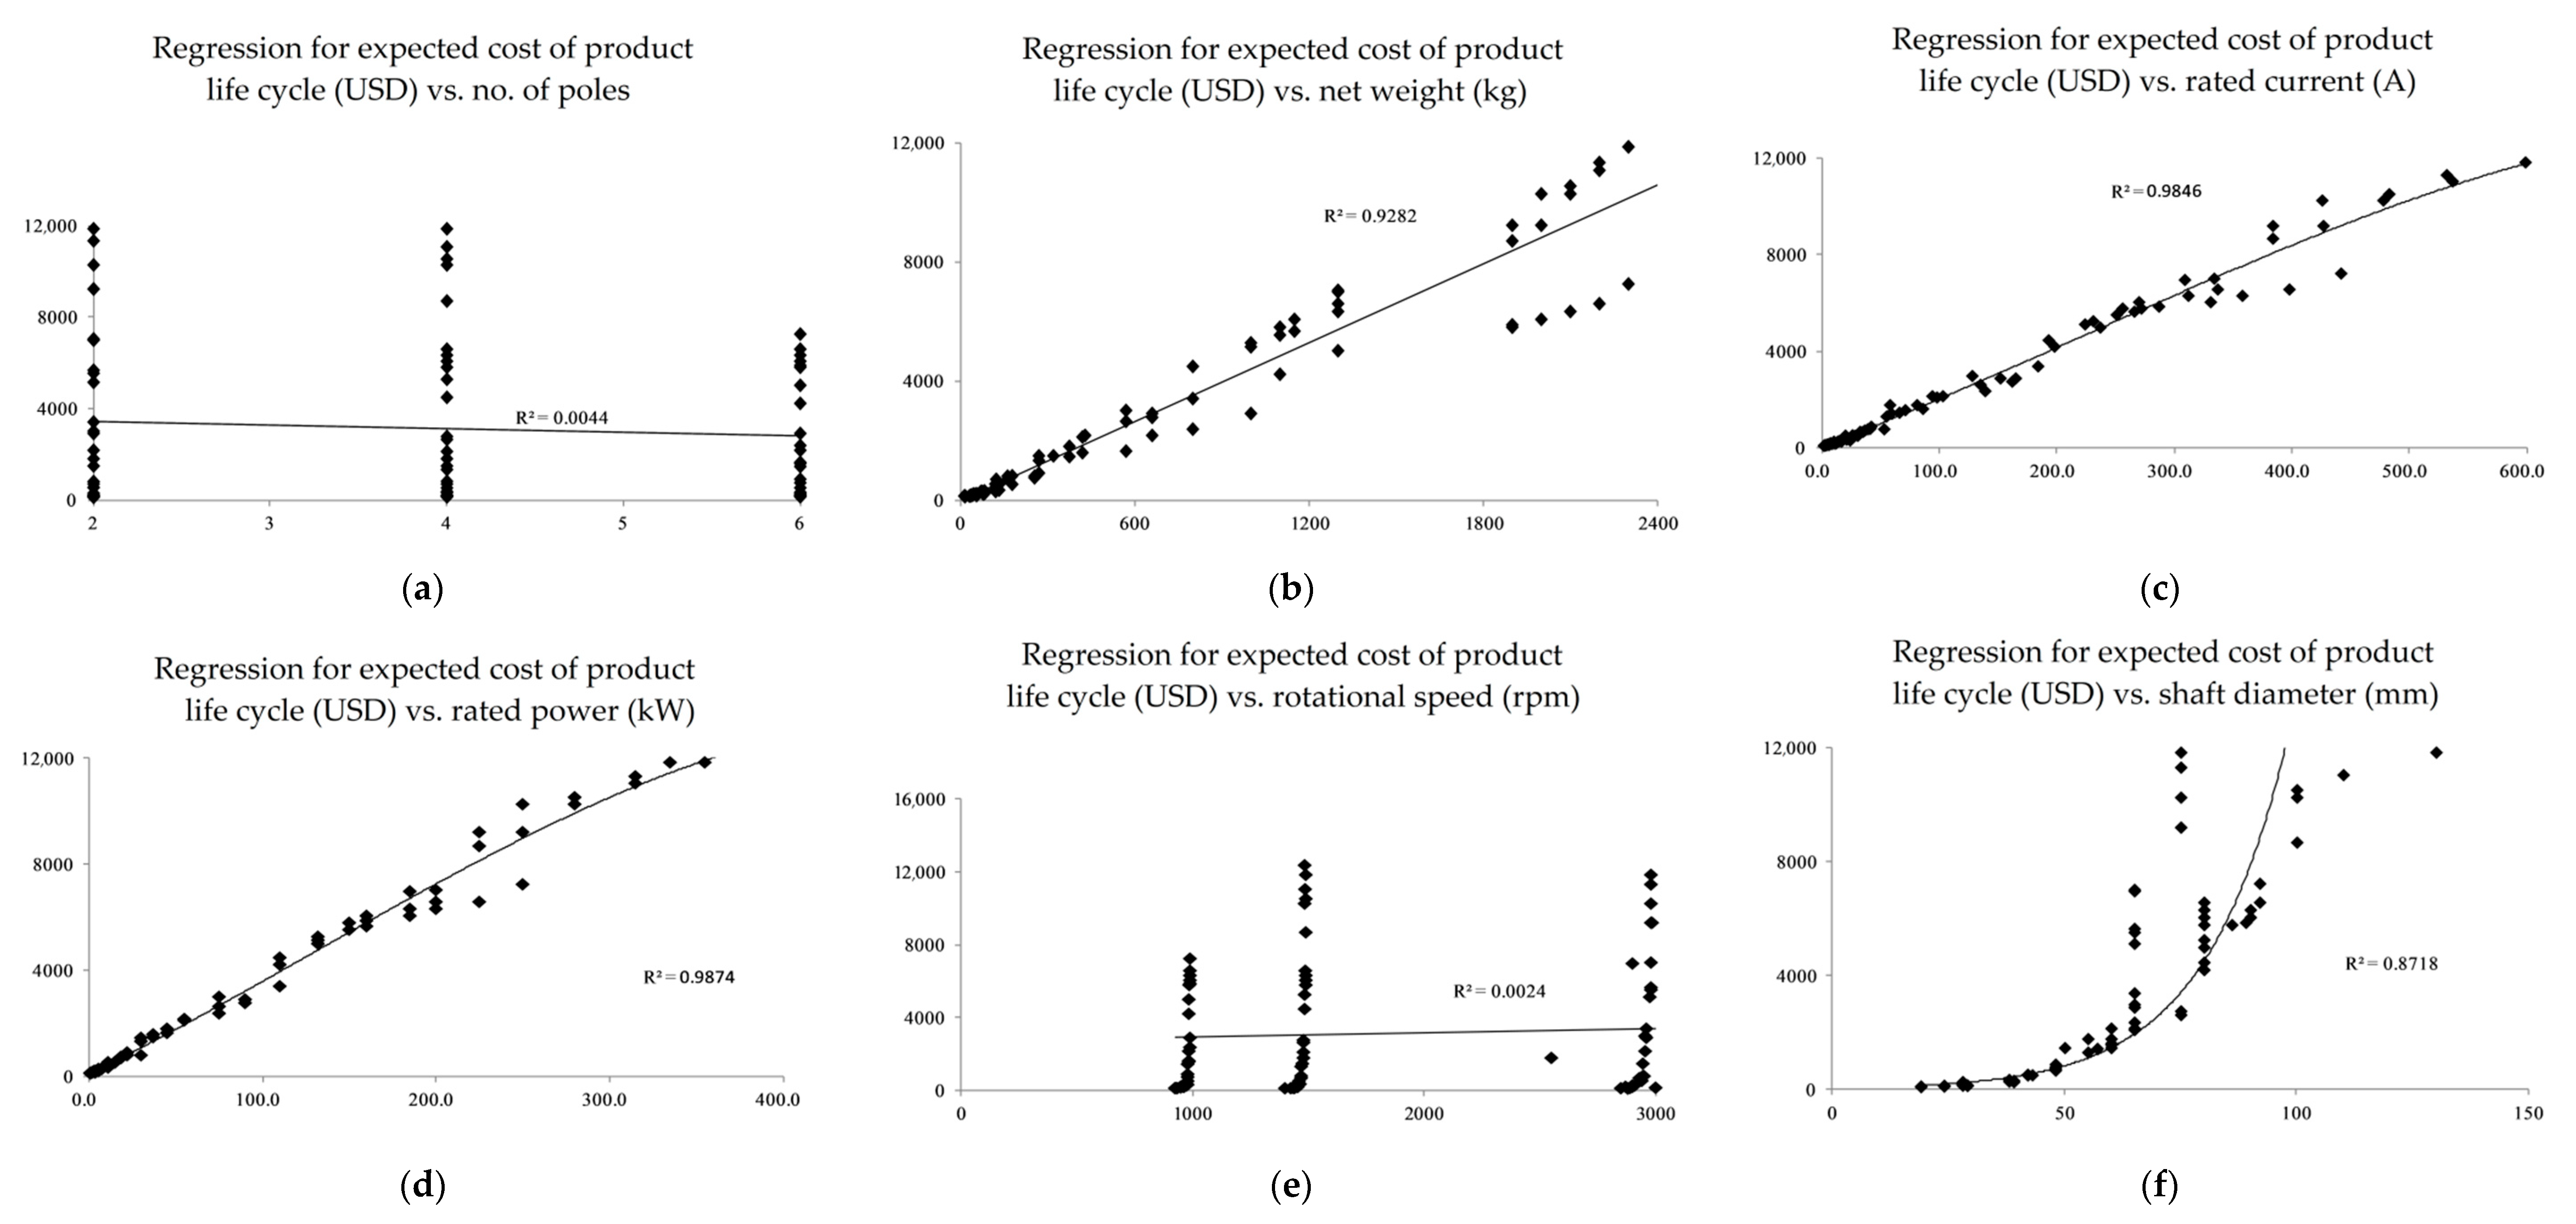
The regression models were designed by the authors and used to investigate the strength and type of relationship (linear, non-linear) between independent (given the technological parameters of induction motors) and dependent variables (the expected cost of the product’s life cycle). The selection of a non-linear function was based on the coefficient of determination R2. The function with the highest R2 has been selected (see Table 6).
A regression model with a single explanatory variable shows that independent variables [X2], [X3], [X4], [X6] have a linear and non-linear impact on the level of the expected cost of the product’s life cycle (Figure 7b–d,f), while variables [X1] and [X5] are not statistically significant from the point of view of the expected cost of the product’s life cycle (Figure 7a,e). Independent variables [X2], [X3], [X4], and [X6] are positively correlated with the expected cost of the product’s life cycle—Y. Determination coefficient R2 for independent variables [X2], [X3], [X4], and [X6] is within the range of 0.87 to 0.99 which proves the high quality of model adjustment. Multiple regression was used as a comparative model for ANNs. Multiple regression for [X1], [X2], [X3], [X4], [X5], and [X6] shows that the determination coefficient R2 is 0.99. The regressions parameters were calculated based on the data used in ANNs as training and validation sets.
3.2. Performance Comparison
In a comparative study, the performance of each model was measured using basic types of forecasting errors. The basic measure of error between the forecasted measure and the forecast is the percentage error (PE). The pre-performance comparison was carried out using data from:
- ANNs in the product life cycle cost estimation;
- Parametric cost estimation of the product life cycle.
Comparative results for randomly selected cases are presented in Table 7. It presents the test set data with example values estimated by the MLP and a parametric approach in comparison with the expected product life cycle costs (historical cost values archived in the SAP-ERP controlling module).
The PE indicates the higher accuracy of the ANN model than the model of a parametric estimation of product life cycle costs. The PE is 8.05 times lower for the ANN (1.10%) than for the parametric model (8.86%).
The PE value of the life cycle cost estimation is not the only factor indicating the advantage of the ANN estimation. The generalization capability of ANN is impressive for these types of estimation issues where the technical product specifications required by the consumer are used directly as input variables for the model instead of the typical cost drivers.
4. Discussion
In companies with advanced production technology, building a model for the parametric estimation of product life cycle costs is complicated, as the number of independent variables—technological parameters—increases. Relations between variables become complex and difficult to describe mathematically. Product engineers are not able to identify the relationships between the dependent variable—the cost of the product’s life cycle, and independent variables—technological parameters (cost drivers). Building a multidimensional cost function is extremely labor-intensive and may even be impossible in some cases. The sets of data necessary to build mathematical equations, are in many cases very large and expensive to obtain. The advantage of parametric estimation of product life cycle costs is the possibility to be used in a reliable audit based on detailed procedures and mathematical equations. In the case of parametric models, cost engineers build mathematical equations, whose correctness can be verified not only by a formal audit but also by the logic of their reasoning. Computer-aided parametric estimation is rather simple and does not involve a lot of work, however, is not as precise as ANNs. The paper presents the model trained with the BFGS algorithm, which transpired to be more precise than the popular backpropagation method used inter alia in [30,33]. The research showed that also models based on a relatively small number of input variables and simple structure (in the comparison to inter alia [30]) can generate the precise estimates of product life cycle costs.
The use of ANNs should also have a positive impact on the macroeconomic aspects of the functioning of the economy. The existence of a relationship between life cycle cost and the generally understood economic development (often defined by GDP or GNP) was indicated in the literature on the subject in, inter alia, [44]. The connection between costs on the microeconomic level and effects on the macroeconomic scale in the classical life cycle costing was also noticed in [45]. Optimizing the product life cycle through the use of ANN should translate into further growth of its positive contribution to the economy. For this reason, economic policy should stimulate the described and similar approaches focusing on the efficient use of economic resources.
Future research should focus on further model optimization. It can be potentially achieved with the use of more complex ANNs, especially deep learning models. Their application enables the effective use of a larger number of neurons. The multitude of different types of layers in deep networks enables the model to be adjusted to a specific problem, but at the same time significantly increases the number of parameters, most of which must be selected experimentally.
5. Conclusions
ANNs do not eliminate all difficulties associated with the use of parametric estimation of product life cycle costs. They are a viable alternative to traditional CER estimation, especially in situations of poor recognition of the nature of technological and production relations between costs and their cost drivers or in situations of non-linear, multidimensional relations between variables. This important advantage of ANNs reduces the need to perform technological and production analyses and to share in-depth technological knowledge with product cost engineers. A computer-aided ANN, unlike parametric estimation, is not simple and requires expert IT knowledge. The disadvantage of ANN is the significant risk involved in the process of building a neural model using a small number of data sets. As indicated by the results of both the literature and the empirical research conducted by the authors of this paper, the number of data samples is one of the basic elements influencing the quality of estimation.
In this study, an ANN using technical specifications required by consumers was designed to estimate the cost of a product’s life cycle. The results show that the accurate prediction capability of the ANN improves cost estimation. Statistical research revealed the existing positive correlation between the selected technical specifications required by the consumers and the expected cost of a product’s life cycle.
Author Contributions
Conceptualization, methodology, validation, formal analysis (neural networks), writing, visualization, Z.L. and T.J.; formal analysis (parametric cost estimation), resources, data curation, Z.L. All authors have read and agreed to the published version of the manuscript.
Funding
This research received no external funding.
Conflicts of Interest
The authors declare no conflict of interest.
References
- Kunkel, S.; Matthess, M. Digital transformation and environmental sustainability in industry: Putting expectations in Asian and African policies into perspective. Environ. Sci. Policy 2020, 112, 318–329. [Google Scholar] [CrossRef]
- Morariu, C.; Morariu, O.; Răileanu, S.; Borangiu, T. Machine learning for predictive scheduling and resource allocation in large scale manufacturing systems. Comput. Ind. 2020, 120, 103244. [Google Scholar] [CrossRef]
- Armengaud, E.; Sams, C.; von Falck, G.; List, G.; Kreiner, C.; Riel, A. Industry 4.0 as digitalization over the entire product lifecycle: Opportunities in the automotive domain. In Communications in Computer and Information Science; Springer: Cham, Switzerland, 2017; Volume 748, pp. 334–351. ISBN 9783319642178. [Google Scholar]
- Brozzi, R.; Forti, D.; Rauch, E.; Matt, D.T. The Advantages of Industry 4.0 Applications for Sustainability: Results from a Sample of Manufacturing Companies. Sustainability 2020, 12, 3647. [Google Scholar] [CrossRef]
- Garetti, M.; Rosa, P.; Terzi, S. Life Cycle Simulation for the design of Product–Service Systems. Comput. Ind. 2012, 63, 361–369. [Google Scholar] [CrossRef]
- Norris, G.A. Integrating life cycle cost analysis and LCA. Int. J. Life Cycle Assess. 2001, 6, 118–120. [Google Scholar] [CrossRef]
- Kloepffer, W. Life cycle sustainability assessment of products. Int. J. Life Cycle Assess. 2008, 13, 89–95. [Google Scholar] [CrossRef]
- Farr, J.V.; Faber, I.J.; Ganguly, A.; Martin, W.A.; Larson, S.L. Simulation-based costing for early phase life cycle cost analysis: Example application to an environmental remediation project. Eng. Econ. 2016, 61, 207–222. [Google Scholar] [CrossRef]
- Rush, C.; Roy, R. Expert Judgement in Cost Estimating: Modelling the Reasoning Process. Concurr. Eng. 2001, 9, 271–284. [Google Scholar] [CrossRef] [Green Version]
- Roy, R. Cost engineering: Why, what and how? In Decision Engineering Report Series; Roy, R., Kerr, C., Eds.; Cranfield University: Bedfordshire, UK, 2003; ISBN 1-861940-96-3. [Google Scholar]
- Horngren, C.T.; Srikant, M.D.; Madhav, R. Cost Accounting: A Managerial Emphasis, 15th ed.; Prentice Hall: Upper Saddle River, NJ, USA, 2014. [Google Scholar]
- Farfan, R.F.M.; Zambrano, T.Y.M.; Solís, A.A.H.; Badillo, F.R.A.; Bravo, J.J.P. Life Cycle of 240 mL Insulated Beakers: Cradle to Door. Int. J. Adv. Sci. Technol. 2020, 29, 5289–5298. [Google Scholar]
- Bravo-Fritz, C.P.; Sáez-Navarrete, C.A.; Herrera-Zeppelin, L.A.; Varas-Concha, F. Multi-scenario energy-economic evaluation for a biorefinery based on microalgae biomass with application of anaerobic digestion. Algal Res. 2016, 16, 292–307. [Google Scholar] [CrossRef]
- Pelzeter, A. Building optimisation with life cycle costs–the influence of calculation methods. J. Facil. Manag. 2007, 5, 115–128. [Google Scholar] [CrossRef]
- Ten Brinke, E.; Lutters, E.; Streppel, T.; Kals, H. Cost estimation architecture for integrated cost control based on information management. Int. J. Comput. Integr. Manuf. 2004, 17, 534–545. [Google Scholar] [CrossRef]
- Mauchand, M.; Siadat, A.; Bernard, A.; Perry, N. Proposal for tool-based method of product cost estimation during conceptual design. J. Eng. Des. 2008, 19, 159–172. [Google Scholar] [CrossRef]
- Anderson, D.M. Design for Manufacturability. Productivity Press: New York; NY, USA, 2014; ISBN 9780429255588. [Google Scholar]
- Hegazy, T. Computer-Based Construction Project Management; Prentice Hall: Upper Saddle River, NJ, USA, 2002; ISBN 978-0130888594. [Google Scholar]
- Duverlie, P.; Castelain, J.M. Cost Estimation During Design Step: Parametric Method versus Case Based Reasoning Method. Int. J. Adv. Manuf. Technol. 1999, 15, 895–906. [Google Scholar] [CrossRef]
- Huang, X.X.; Newnes, L.B.; Parry, G.C. The adaptation of product cost estimation techniques to estimate the cost of service. Int. J. Comput. Integr. Manuf. 2012, 25, 417–431. [Google Scholar] [CrossRef]
- Niazi, A.; Dai, J.S.; Balabani, S.; Seneviratne, L. Product Cost Estimation: Technique Classification and Methodology Review. J. Manuf. Sci. Eng. 2006, 128, 563–575. [Google Scholar] [CrossRef]
- Chang, K.H. Product Manufacturing and Cost Estimating Using CAD/CAE: A Volume in the Computer Aided Engineering Design Series; Academic Press: Cambridge, MA, USA, 2013; ISBN 9780124017450. [Google Scholar]
- Tyagi, S.; Cai, X.; Yang, K. Product life-cycle cost estimation: A focus on the multi-generation manufacturing-based product. Res. Eng. Des. 2015, 26, 277–288. [Google Scholar] [CrossRef]
- Smith, A.E.; Mason, A.K. Cost Estimation Predictive Modeling: Regression Versus Neural Network. Eng. Econ. 1997, 42, 137–161. [Google Scholar] [CrossRef]
- Dysert, L.R. Estimating. In Skills & Knowledgeof Cost Engineering; Scott, J.A., Ed.; AACE International: Morgantown, VA, USA, 2004. [Google Scholar]
- Bode, J. Neural networks for cost estimation: Simulations and pilot application. Int. J. Prod. Res. 2000, 38, 1231–1254. [Google Scholar] [CrossRef]
- Medicine, J. Artificial Intelligence Business Applications: A New Approach to AI and Machine Learning in Modern Business and Marketing, for Beginners and Advanced; John Medicine: USA, 2019; ISBN 978-1085989428. [Google Scholar]
- Zhang, Y.F.; Fuh, J.Y.H.; Chan, W.T. Feature-based cost estimation for packaging products using neural networks. Comput. Ind. 1996, 32, 95–113. [Google Scholar] [CrossRef]
- Wang, Q.; Stockton, D.J.; Baguley, P. Process cost modelling using neural networks. Int. J. Prod. Res. 2000, 38, 3811–3821. [Google Scholar] [CrossRef]
- Seo, K.-K.; Park, J.-H.; Jang, D.-S.; Wallace, D. Approximate Estimation of the Product Life Cycle Cost Using Artificial Neural Networks in Conceptual Design. Int. J. Adv. Manuf. Technol. 2002, 19, 461–471. [Google Scholar] [CrossRef]
- Garza, J.M.; Rouhana, K.G. Neural networks versus parameter-based applications in cost estimating. Cost Eng. 1995, 37, 14–18. [Google Scholar]
- Kim, G.-H.; An, S.-H.; Kang, K.-I. Comparison of construction cost estimating models based on regression analysis, neural networks, and case-based reasoning. Build. Environ. 2004, 39, 1235–1242. [Google Scholar] [CrossRef]
- Ikeda, M.; Hiyama, T. ANN based designing and cost determination system for induction motor. IEE Proc.-Electr. Power Appl. 2005, 152, 1595. [Google Scholar] [CrossRef]
- Weckman, G.R.; Paschold, H.W.; Dowler, J.D.; Whiting, H.S.; Young, W.A. Using Neural Networks with Limited Data to Estimate Manufacturing Cost. J. Ind. Syst. Eng. 2010, 3, 257–274. [Google Scholar]
- Karaoglan, A.D.; Karademir, O. Flow time and product cost estimation by using an artificial neural network (ANN): A case study for transformer orders. Eng. Econ. 2017, 62, 272–292. [Google Scholar] [CrossRef]
- Liu, X.; Kang, S.; Li, F. Simulation of artificial neural network model for trunk sap flow of Pyrus pyrifolia and its comparison with multiple-linear regression. Agric. Water Manag. 2009, 96, 939–945. [Google Scholar] [CrossRef]
- Jiao, L.; Li, H. QSPR studies on the aqueous solubility of PCDD/Fs by using artificial neural network combined with stepwise regression. Chemom. Intell. Lab. Syst. 2010, 103, 90–95. [Google Scholar] [CrossRef]
- Chelgani, S.C.; Hower, J.C.; Hart, B. Estimation of free-swelling index based on coal analysis using multivariable regression and artificial neural network. Fuel Process. Technol. 2011, 92, 349–355. [Google Scholar] [CrossRef]
- McCulloch, W.S.; Pitts, W. A logical calculus of the ideas immanent in nervous activity. Bull. Math. Biophys. 1943, 5, 115–133. [Google Scholar] [CrossRef]
- Kolmogorov, A.N. Selected works of A.N. Kolmogorov; Mikhailovich, T.V., Ed.; Kluwer: Philadelphia, PA, USA, 1991; ISBN 978-9402417081. [Google Scholar]
- Leszczyński, Z.; Jasiński, T. An artificial neural networks approach to product cost estimation. The case study for electric motor. Inform. Ekon. 2018, 1, 72–84. [Google Scholar] [CrossRef]
- Rosenblatt, F. The perceptron: A probabilistic model for information storage and organization in the brain. Psychol. Rev. 1958, 65, 386–408. [Google Scholar] [CrossRef] [PubMed] [Green Version]
- Broomhead, D.S.; Lowe, D. Radial Basis Functions, Multi-Variable Functional Interpolation and Adaptive Networks; Royal Signals and Radar Establishment: London, UK, 1988. [Google Scholar]
- Neugebauer, S.; Forin, S.; Finkbeiner, M. From Life Cycle Costing to Economic Life Cycle Assessment—Introducing an Economic Impact Pathway. Sustainability 2016, 8, 428. [Google Scholar] [CrossRef] [Green Version]
- Wood, R.; Hertwich, E.G. Economic modelling and indicators in life cycle sustainability assessment. Int. J. Life Cycle Assess. 2013, 18, 1710–1721. [Google Scholar] [CrossRef]
Figure 1.
The simplified and generalized process flow diagram of induction motors production phases (source: own elaboration based on information obtained from the company).
Figure 1.
The simplified and generalized process flow diagram of induction motors production phases (source: own elaboration based on information obtained from the company).
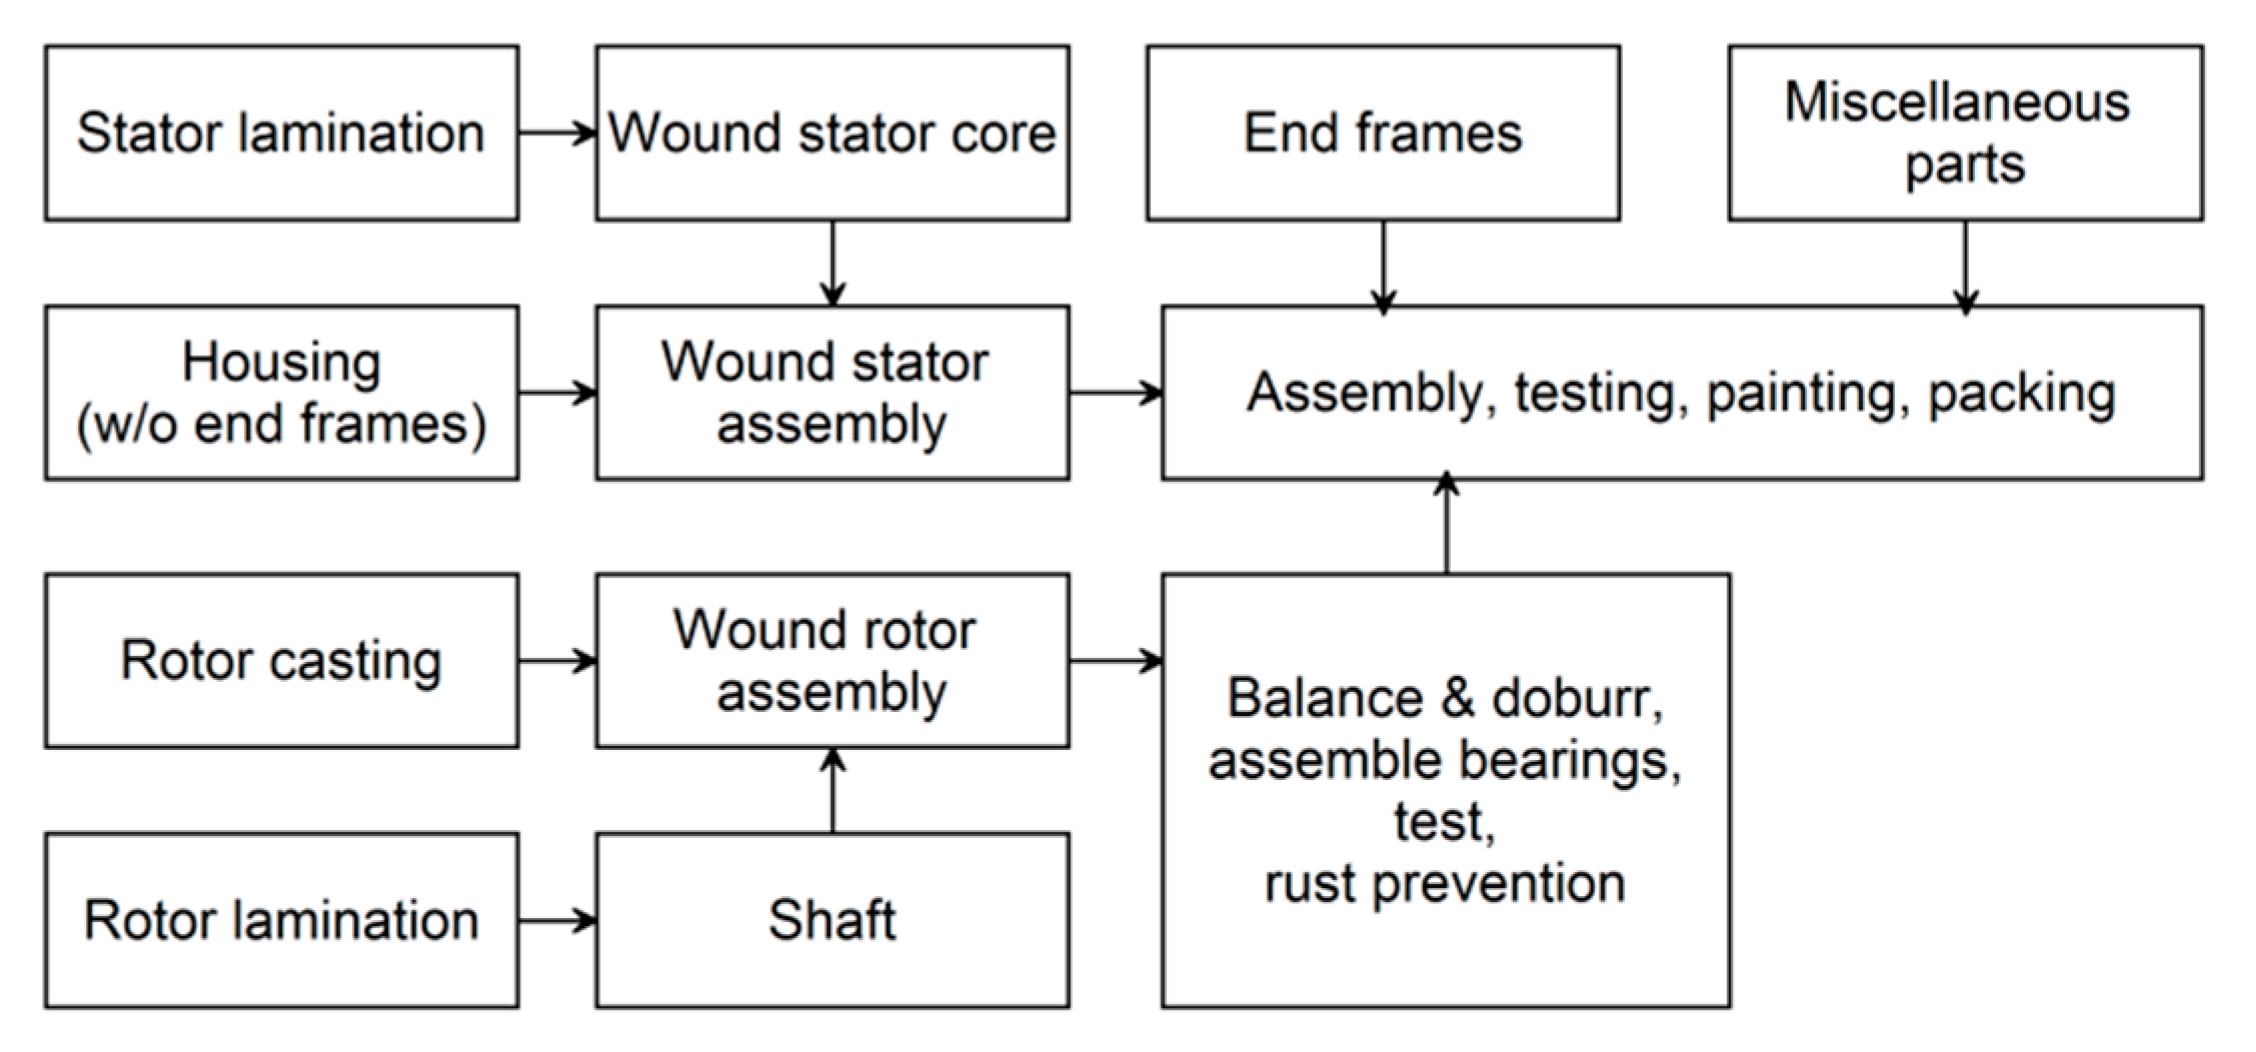
Figure 2.
Estimated cost of the product life cycle—induction motor type 4Sm412H-6-AT5 (source: own elaboration based on the financial data).
Figure 2.
Estimated cost of the product life cycle—induction motor type 4Sm412H-6-AT5 (source: own elaboration based on the financial data).
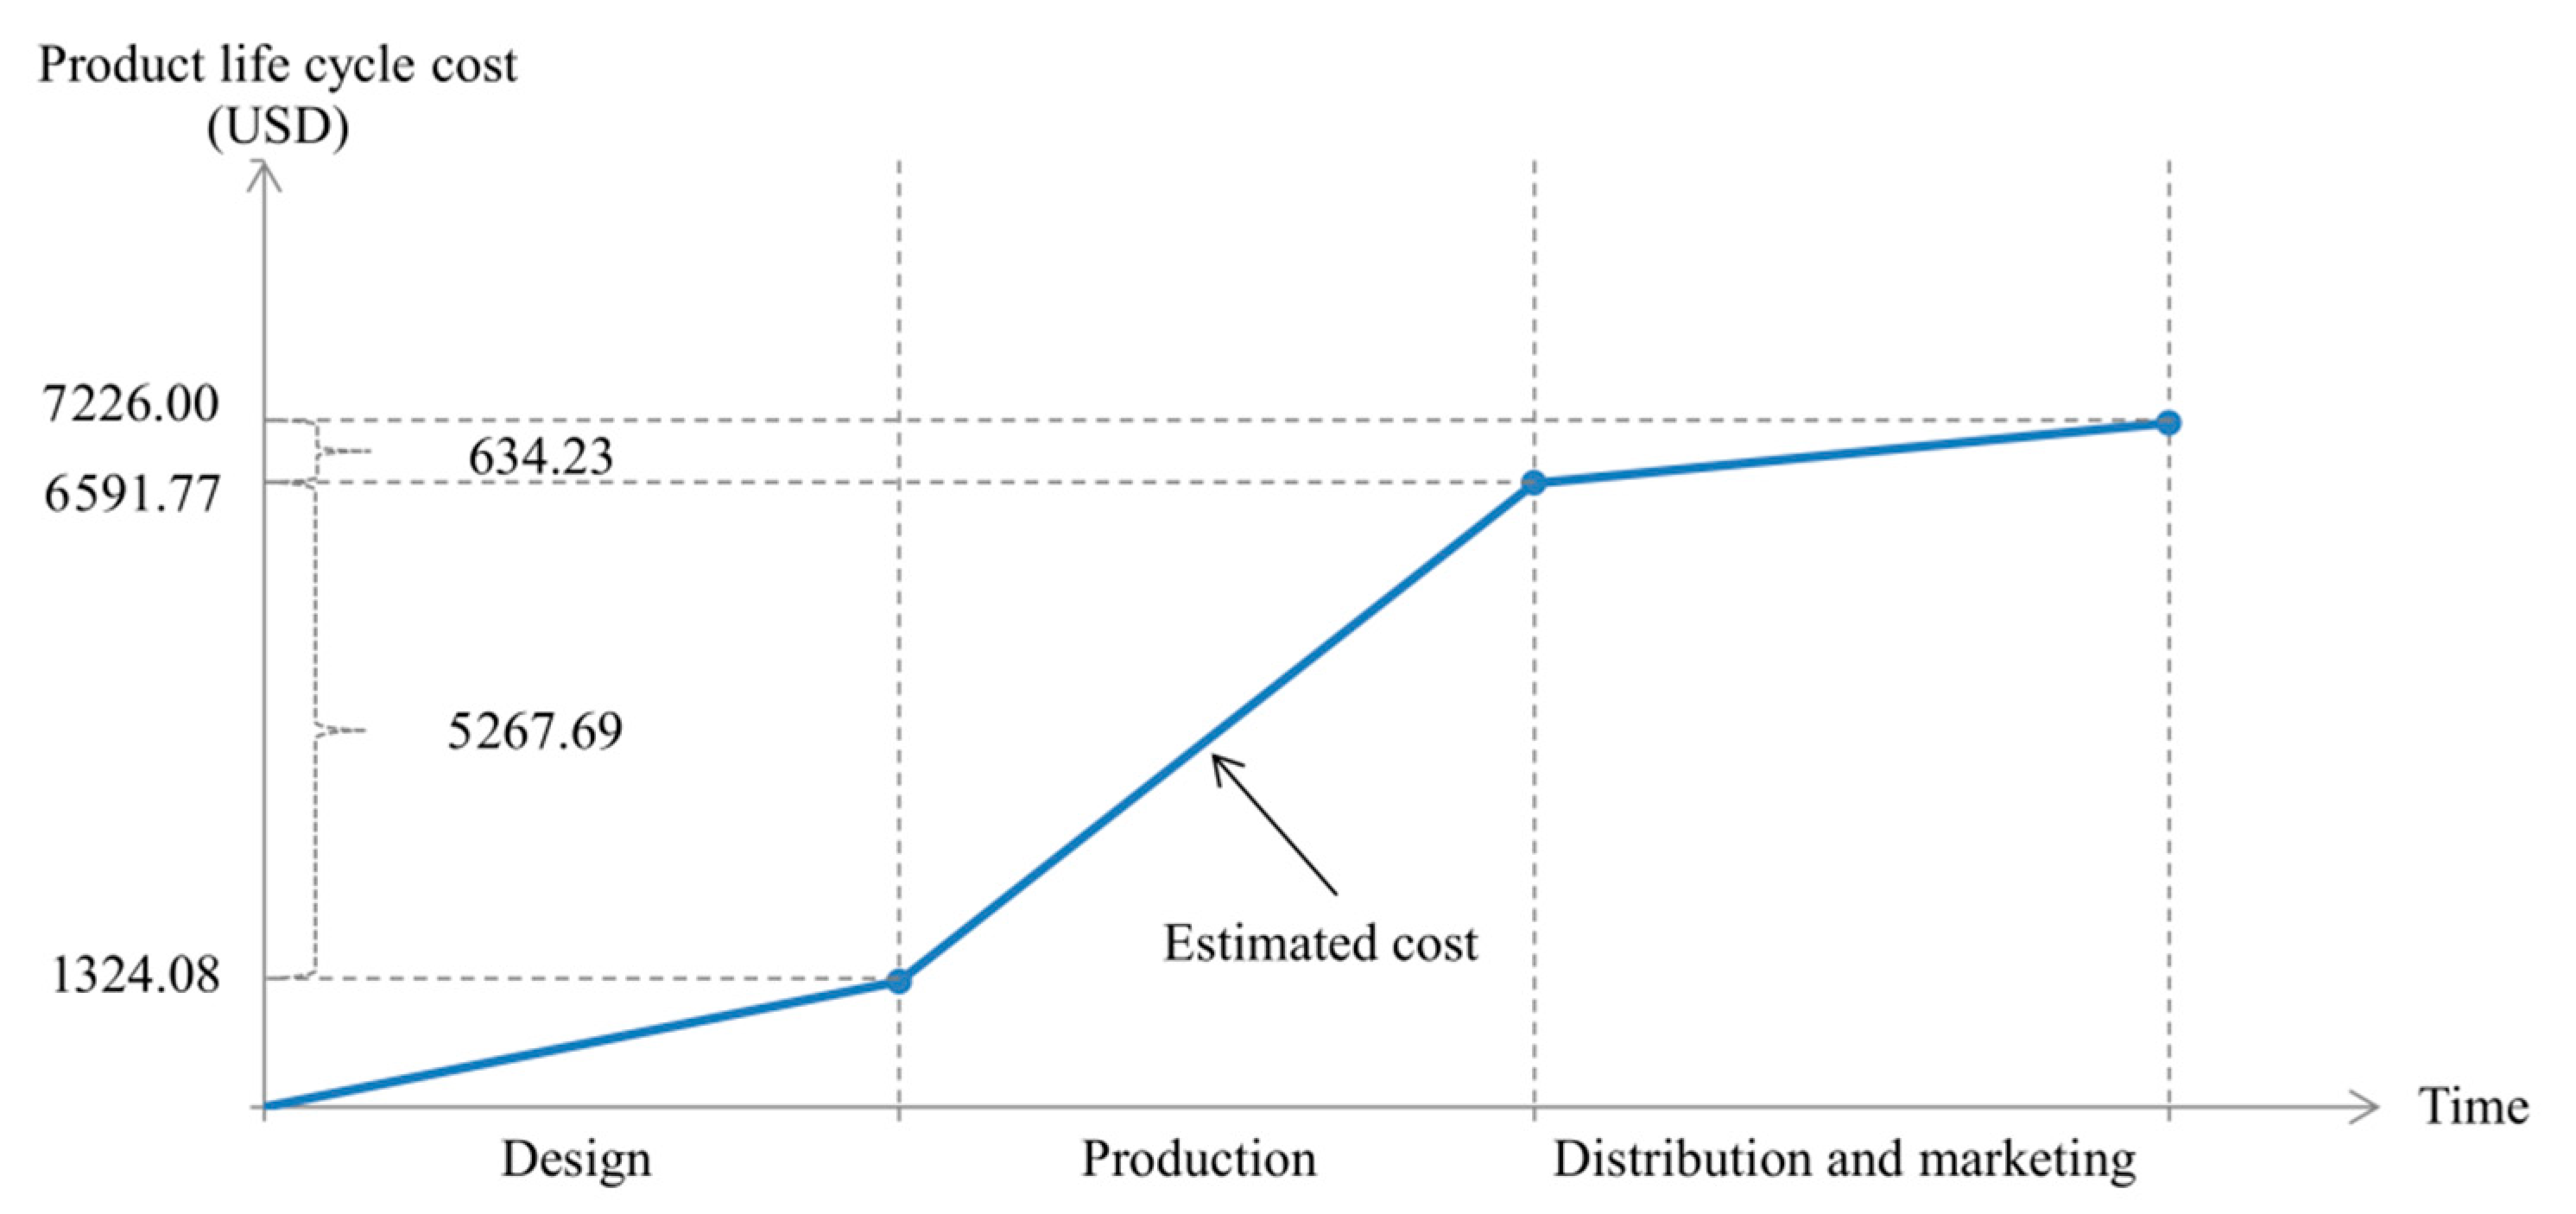
Figure 3.
The data divided into three sets (source: own elaboration).
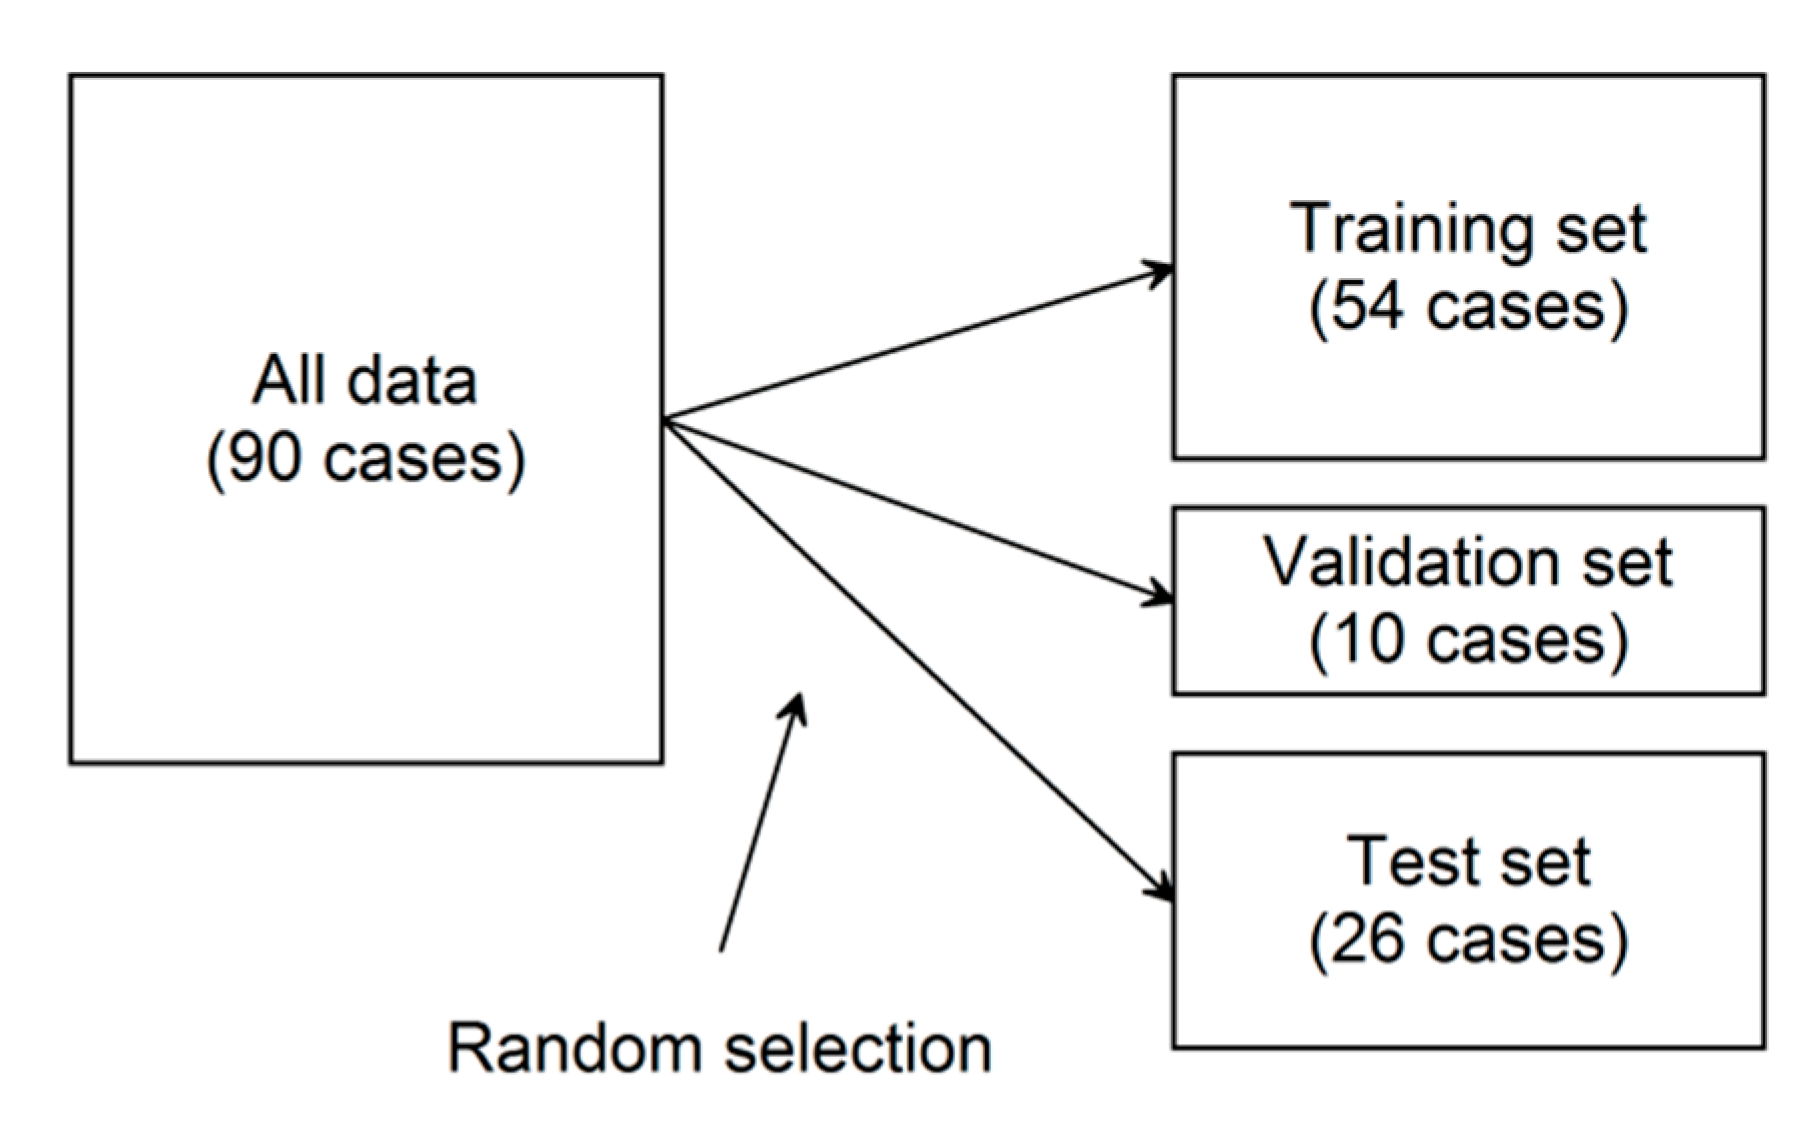
Figure 4.
Architecture of the (a) MLP and (b) RBF network (numbers of variables in accordance with Table 4, source: own elaboration).
Figure 4.
Architecture of the (a) MLP and (b) RBF network (numbers of variables in accordance with Table 4, source: own elaboration).
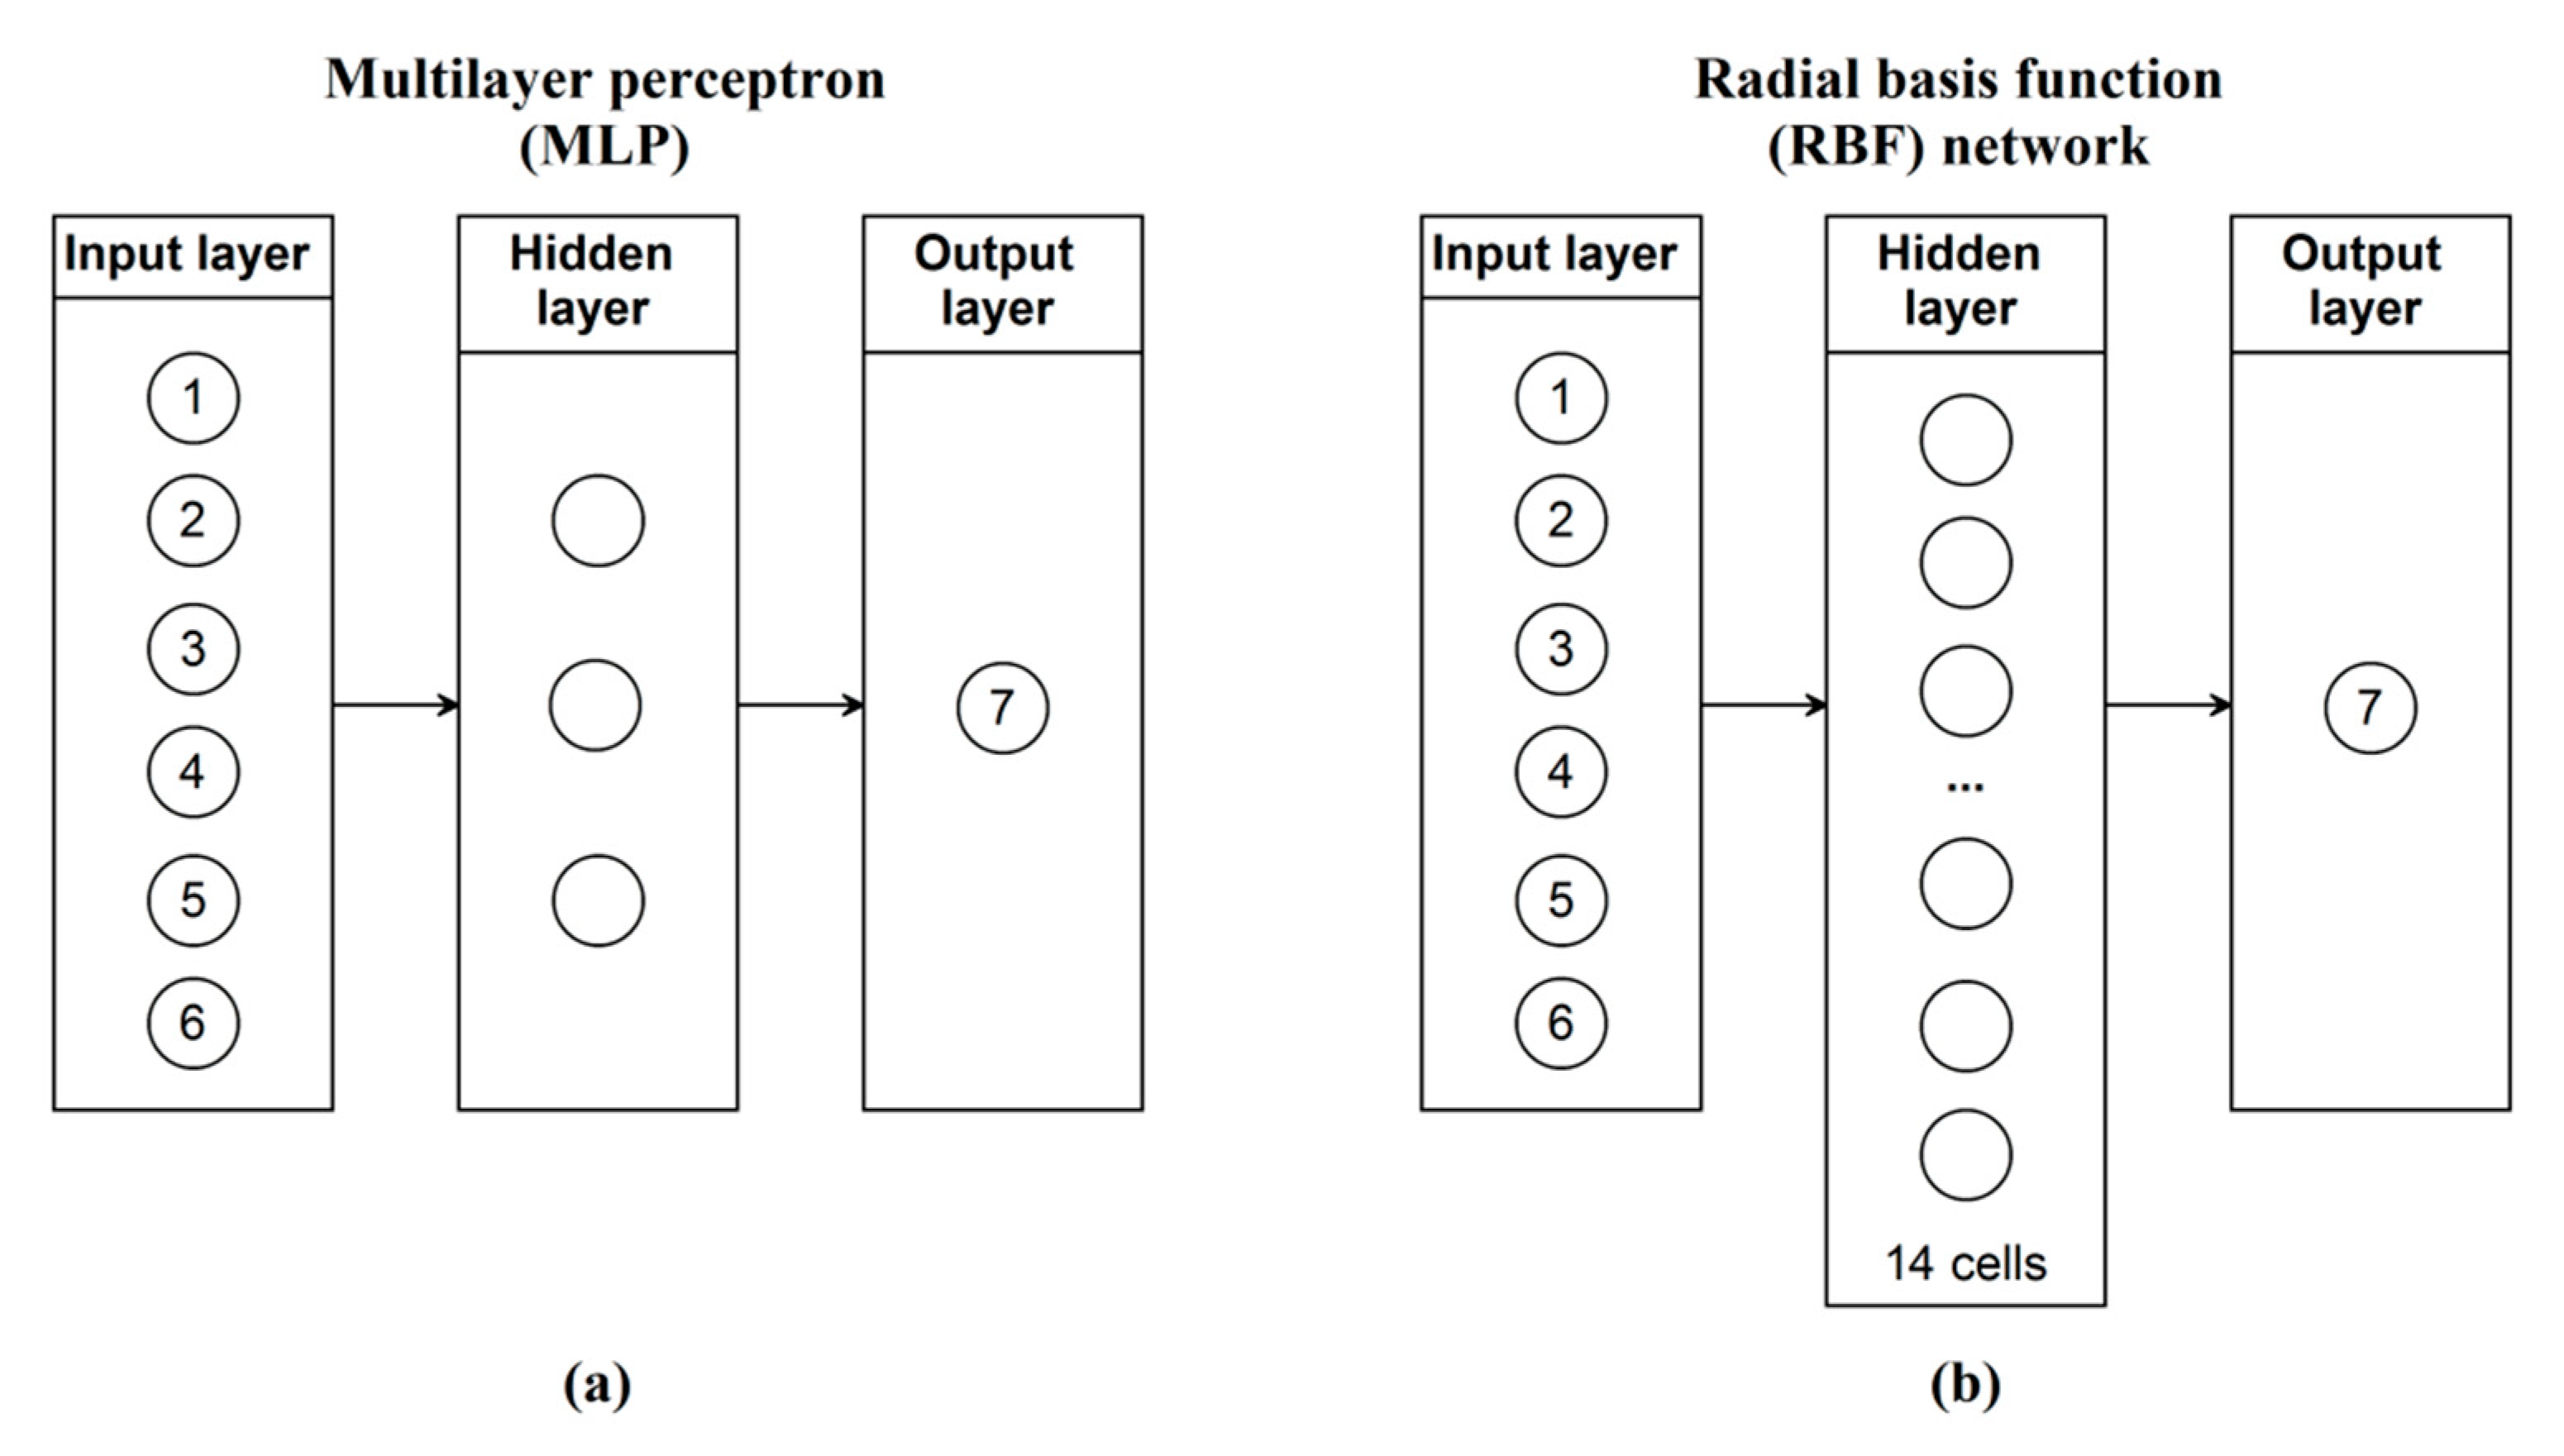
Figure 5.
The block diagram of the research method based on artificial neural networks (ANNs) (source: own elaboration).
Figure 5.
The block diagram of the research method based on artificial neural networks (ANNs) (source: own elaboration).

Figure 6.
Scatter diagram for the best: (a) multilayer perceptron (MLP) and (b) radial basis function (RBF) network (source: own elaboration developed on the basis of [41]).
Figure 6.
Scatter diagram for the best: (a) multilayer perceptron (MLP) and (b) radial basis function (RBF) network (source: own elaboration developed on the basis of [41]).
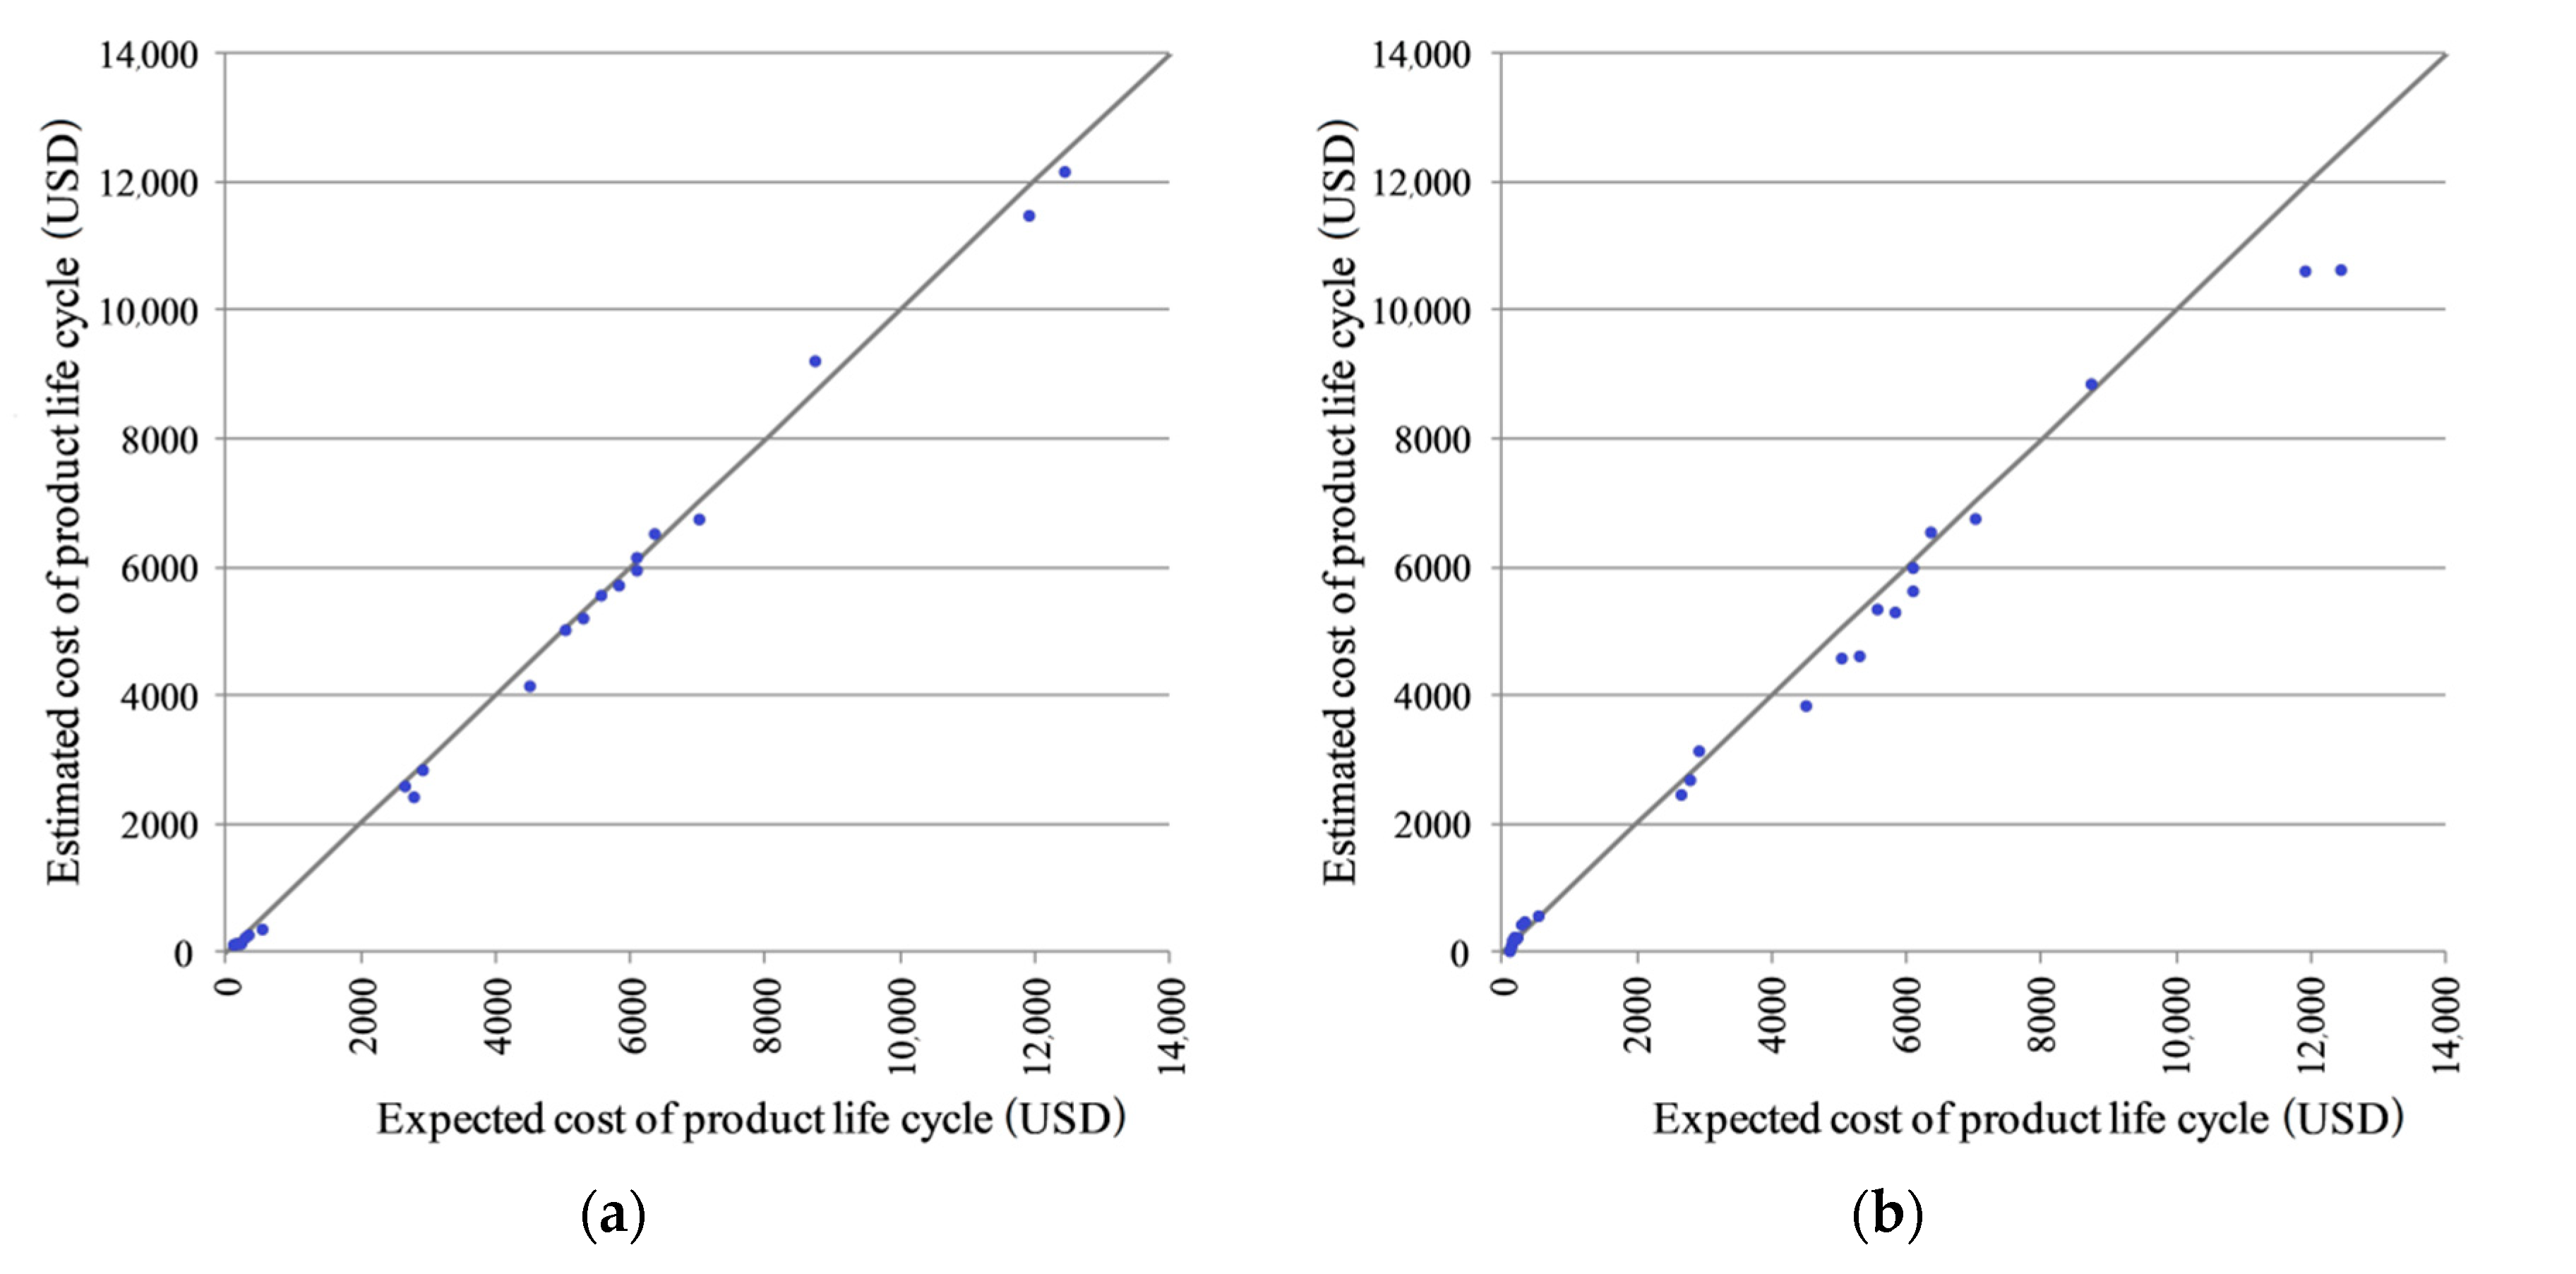
Figure 7.
Regression analysis of the influence of variable: (a) [X1]—number of poles; (b) [X2]—net weight; (c) [X3]—rated current; (d) [X4]—rated power; (e) [X5]—rotational speed; (f) [X6]—shaft diameter on variable Y—expected cost of the product life cycle (source: own elaboration).
Figure 7.
Regression analysis of the influence of variable: (a) [X1]—number of poles; (b) [X2]—net weight; (c) [X3]—rated current; (d) [X4]—rated power; (e) [X5]—rotational speed; (f) [X6]—shaft diameter on variable Y—expected cost of the product life cycle (source: own elaboration).

Table 1.
Induction motor type 4Sm412H-6-AT5 specification (source: own elaboration based on the technical specification).
Table 1.
Induction motor type 4Sm412H-6-AT5 specification (source: own elaboration based on the technical specification).
| Type | Rated Power (kW) | Rated Current 1 (A) | Rated Voltage (V) | Rotational Speed (rpm) | Pole Number | Net Weight (kg) |
|---|---|---|---|---|---|---|
| 4Sm412H-6-AT5 | 250 | 442 | 400 | 990 | 6 | 2300 |
1 at rated voltage and full load.
Table 2.
An example of the estimated product life cycle cost—induction motor type 4Sm412H-6-AT5 (source: own elaboration based on the financial data).
Table 2.
An example of the estimated product life cycle cost—induction motor type 4Sm412H-6-AT5 (source: own elaboration based on the financial data).
| Phase Name | Cost Estimating Relationship (CER) |
|---|---|
| I. Design phase | 1324.08 |
| Product design, process design, research and development, orders and deliveries, testing, corrections of the project, etc. | |
| II. Production phase | 5267.69 |
| Direct materials, direct labor, overhead production costs (variable costs), and overhead production costs (fixed costs). | |
| III. Distribution and marketing phase | 634.23 |
| Advertisements, fairs and exhibitions, marketing research, staff training, transportations, packaging materials, after-sales services, etc. | |
| Product life cycle cost (I + II + III) | 7226.00 |
Table 3.
The test set data structure with example values used in the parametric estimation (source: own elaboration based on the technical specification).
Table 3.
The test set data structure with example values used in the parametric estimation (source: own elaboration based on the technical specification).
| Case Number | Rated Power (kW) | Rated Current 1 (A) | Rotational Speed (rpm) | Number of Poles | Net Weight (kg) | Shaft Diameter (mm) |
|---|---|---|---|---|---|---|
| 1 | 250.0 | 442.0 | 990 | 6 | 2300 | 92 |
| 2 | 90.0 | 162.0 | 1480 | 4 | 660 | 75 |
| 3 | 75.0 | 128.0 | 2960 | 2 | 570 | 65 |
| 4 | 150.0 | 251.0 | 2980 | 2 | 1100 | 65 |
| 5 | 5.5 | 10.2 | 2910 | 2 | 70 | 28 |
1 at rated voltage and full load.
Table 4.
The list of all variables used by ANNs (source: own elaboration).
| No. | Variable Name | Unit |
|---|---|---|
| Input variables | ||
| 1 | Rated power | kW |
| 2 | Rated current | A |
| 3 | Rotational speed | rpm |
| 4 | No. of poles | – |
| 5 | Net weight | kg |
| 6 | Shaft diameter | mm |
| Output variable | ||
| 7 | Product life cycle cost | USD |
Table 5.
Optimum network topology and its parameters (source: own elaboration).
| Parameter Name | Value |
|---|---|
| Multilayer perceptron (MLP) | |
| Number of hidden layers | 1 |
| Number of neurons at the hidden layer | 3 |
| Number of neurons at the input layer | 6 |
| Number of neurons at the output layer | 1 |
| Activation functions of hidden layer neurons | Logistic |
| Activation functions of output layer neuron | Exponential |
| Learning algorithm | Broyden-Fletcher-Goldfarb-Shanno (BFGS) |
| Error function | Sum of squares (SOS) |
| Number of epochs | 102 |
| Radial basis function (RBF) network | |
| Number of neurons at the hidden layer | 14 |
| Number of neurons at the input layer | 6 |
| Number of neurons at the output layer | 1 |
| Activation functions of hidden layer neurons | Gaussian |
| Activation functions of output layer neuron | Identity |
| Learning algorithm | Reduced Breadth-First Search |
| Error function | SOS |
Table 6.
R2 coefficients for regression model (source: own elaboration).
| Regression Model | R2 for Tested Functions of Regression 1 | ||
|---|---|---|---|
| Logarithmic | Exponential | Polynomial | |
| Rated power vs. expected cost of product life cycle | R2 = 0.7052 | R2 = 0.7602 | R2 = 0.9874 |
| Rated current vs. expected cost of product life cycle | R2 = 0.7170 | R2 = 0.7633 | R2 = 0.9846 |
| Shaft diameter vs. expected cost of product life cycle | R2 = 0.6638 | R2 = 0.8718 | R2 = 0.8013 |
1 Bold font indicates the highest value.
Table 7.
The example performance comparison of the ANN and parametric estimation with the test data set (source: own elaboration).
Table 7.
The example performance comparison of the ANN and parametric estimation with the test data set (source: own elaboration).
| Case Number | Expected Value (USD) | ANN | Parametric Estimation | ||
|---|---|---|---|---|---|
| Estimated Value (USD) | Percentage Error (PE) (%) | Estimated Value (USD) | PE (%) | ||
| 1 | 7240 | 7230 | 0.14% | 7226 | 0.19% |
| 2 | 2763 | 2712 | 1.85% | 2478 | 10.31% |
| 3 | 2995 | 2950 | 1.50% | 3500 | 14.43% |
| 4 | 5526 | 5545 | 0.34% | 4900 | 11.33% |
| 5 | 276 | 280 | 1.43% | 250 | 9.42% |
| … | … | … | … | … | … |
| PE (%) for the entire test set | 1.10% | 8.86% | |||
© 2020 by the authors. Licensee MDPI, Basel, Switzerland. This article is an open access article distributed under the terms and conditions of the Creative Commons Attribution (CC BY) license (http://creativecommons.org/licenses/by/4.0/).
Share and Cite
MDPI and ACS Style
Leszczyński, Z.; Jasiński, T. Comparison of Product Life Cycle Cost Estimating Models Based on Neural Networks and Parametric Techniques—A Case Study for Induction Motors. Sustainability 2020, 12, 8353. https://doi.org/10.3390/su12208353
AMA Style
Leszczyński Z, Jasiński T. Comparison of Product Life Cycle Cost Estimating Models Based on Neural Networks and Parametric Techniques—A Case Study for Induction Motors. Sustainability. 2020; 12(20):8353. https://doi.org/10.3390/su12208353
Chicago/Turabian StyleLeszczyński, Zbigniew, and Tomasz Jasiński. 2020. "Comparison of Product Life Cycle Cost Estimating Models Based on Neural Networks and Parametric Techniques—A Case Study for Induction Motors" Sustainability 12, no. 20: 8353. https://doi.org/10.3390/su12208353
Note that from the first issue of 2016, this journal uses article numbers instead of page numbers. See further details here.