Financial Viability of an On-Farm Processing and Retail Enterprise: A Case Study of Value-Added Agriculture in Rural Kentucky (USA)


Department of Agriculture and Natural Resources, Berea College, Berea, KY 40404, USA
Sustainability 2020, 12(2), 708; https://doi.org/10.3390/su12020708
Submission received: 24 December 2019
/
Revised: 14 January 2020
/
Accepted: 16 January 2020
/
Published: 18 January 2020
(This article belongs to the Special Issue Environmental and Economic Performance of Farming and Food Systems)
Abstract
:Value-added processing and direct marketing are commonly recommended strategies for increasing income and improving the economic viability of small farms. This case study uses partial budgeting to examine the performance of an on-farm store in Kentucky (USA) over a six-year period (2014–2019), intended for adding value to raw farm ingredients through processing and direct sales to consumers. Three primary product supply chains were aggregated, stored, processed, and sold through the farm store: livestock (meats), grains (flours and meals), and fresh produce (fruits, vegetables, and herbs). In addition, prepared foods were made largely from the farm’s ingredients and sold as ready-to-eat meals. Whole-farm income increased substantially as a result of the farm-store enterprise but the costs of operation exceeded the added income in every year of the study, illustrating the challenges to small farms in achieving a sufficient economy of scale in value-added enterprises. By the final two years of the study period, the enterprise was approaching break-even status. Ready-to-eat items, initially accounting for a small fraction total sales, were the most important product category by the end of the study period. This study highlights the importance of adaptability in the survival and growth of a value-adding enterprise as well as the critical role of subsidies in establishing similar enterprises, particularly in low-income, rural areas.
1. Introduction
Direct marketing of value-added products is a strategy for improving the financial viability of small-farm businesses, widely promoted in the United States by state cooperative extension services [1,2], state governments and legislation [3,4], non-profit organizations [5,6], federal government agencies [7,8], and academic researchers [9]. Farms that can market and sell directly to consumers have opportunities to receive higher prices for their products without losing part of the retail value to wholesalers or other intermediaries. Farmers markets, farm stands, community-supported agriculture (CSA), and subscription-based arrangements offer ways for farms to sell products directly to consumers at retail or premium prices.
Value-added processing usually refers to steps taken to transform raw ingredients produced on a farm into sellable products that are worth more in the market. Examples include processing fruits into canned preserves, using lower-value cuts of meat to produce sausages, and milling corn into grits or polenta. Processing can take place on the farm if adequate facilities exist or can be carried out at an off-farm facility or business. Value can also be added through various third-party certifications for adopting organic methods, fair or living wages, or humane livestock husbandry [10]. Combining direct marketing with value-added traits can increase gross income substantially if market demand for the products is sufficiently strong.
The objective of this case study is to report on the financial performance of a single diversified farm that opened a processing and retail facility for adding value to raw farm products and selling direct to consumers. Using income and cost records from periods before and after the opening of this new enterprise, a partial budget analysis was performed to assess its overall financial impact on whole-farm net income. In addition, more specific sales and expense records were used to provide insights into the viability of the new enterprise in the context of current market conditions and formulate suggestions for this effort as well as other farm-based, small-business endeavors.
2. Background
The Berea College Farm is one of the oldest student educational farms in North America [11]. Founded in the 1870s to provide educational and work opportunities to students attending the institution, the Berea College Farm is unusual in several ways. First, it encompasses about 200 ha (500 acres) of land, which is comparable to the average farm size in the United States [12] but considerably larger than most educational farms, particularly at liberal arts colleges and universities [13,14]. Secondly, the farm’s main purposes are providing part-time employment for students as well as teaching and learning experiences. Formal research plays a very minor role, with most on-farm experimentation intended to improve the farm’s operations. Income is expected to cover a substantial fraction of operating expenses but not generate a profit. Finally, the number of different farming enterprises is relatively high for the farm’s size [15], resulting in some relatively small-scale enterprises (described in more detail below) that are fairly typical of the Eastern Uplands Region of the United States, which includes most of Kentucky and the central Appalachian region [16].
The farm is located within and around Berea, Kentucky, a city with about 15,000 people located in a hilly area between the Bluegrass Region of central Kentucky and the Cumberland Plateau on the western edge of the Appalachian Mountains (37.5687° N, 84.2963° W). The agricultural landscape is dominated by beef cattle, pastureland, hay fields, and some annual cropland typically planted to corn, soybeans, and small grains. Historically, tobacco had been an important cash crop but has been diminishing in importance for decades with the phasing out of a national price-support program that once made this crop especially appealing to small farms [17]. Farming now plays a fairly small role in the local economy, providing only part-time employment in most cases. Education, manufacturing, and health care are the major sources of employment in Berea. According to United States Census data, median household income in Berea is about 31% less than the national United States (US) median and the percentage of the population in poverty is more than twice the national average [18]. However, the economic conditions of Berea are more favorable than most communities and municipalities of the central Appalachian region.
When viewed within the framework of farm typology used by the United States Department of Agriculture (USDA), this farm would be considered a “small farm” with “moderate sales” [19]. Over its history, the types and number of different enterprises making up the farm have changed and evolved considerably [11,12]. During the six-year period prior to the opening of the store in 2013, there were three main types of production enterprises comprising the farm: livestock, horticulture, and field crops (Figure 1). In terms of land-use and operational costs, the livestock enterprises dominated. These included beef cattle, hogs, broiler chickens, and laying hens. Goat production was being phased out, and turkey production was added. Field crops included corn, wheat, oats, rye, beans, as well as large areas of livestock forage and hay crops composed of perennial grass and legume mixtures. Most of the land was considered suitable for permanent pasture rather than annual field crops [12]. Horticultural crops, including vegetables, fruits, herbs and some ornamentals—grown in fields with drip irrigation and often under protective structures (primarily unheated high tunnels)—occupied less than four hectares (Table 1). Minor enterprises, primarily for educational demonstration, included apiculture, aquaculture (tilapia and channel catfish), and shiitake mushroom production in log culture.
Most of the available pasture and cropland of the Berea College Farm had been managed organically according to USDA regulations since 2009, though several hectares in horticultural production had been managed organically since 1999 [12]. In addition to organic crop production, other efforts to improve the environmental, social, and economic sustainability of the farm during this period included longer crop rotations with mixtures of grasses and legumes to improve fertility and soil quality while reducing the need for tillage; minimizing the frequency of corn in the rotation; a transition to grass-finishing beef cattle to eliminate the need for corn in their ration; rotationally-grazing all livestock including beef cattle, hogs, and poultry; and acquiring third-party certifications for management practices, including USDA Organic for all crops [20], American Grassfed Association for cattle [21], and Animal Welfare Approved for cattle and hogs [22,23]. Efforts were also made to transition away from selling commodities, including livestock and grains, and toward potentially more lucrative wholesale and retail markets (Figure 2). All of these changes emphasized production practices with lower capital requirements but often higher labor demands; approaches that are arguably appropriate for limited-resource farmers in the region.
Prior to 2013, fresh vegetables, fruits, herbs, plants, mushrooms, eggs, honey, and limited quantities of frozen meats were sold at local farmers markets. Meats, including beef, pork, chicken, and goat, were processed and packaged by regional USDA-inspected slaughter facilities and maintained frozen until sold. Some meats and grains were sold in wholesale quantities to restaurants or farmers in need of feedstuffs, respectively. Most livestock and grains, however, were sold through commodity markets, regional auctions, contracts, or agreements with regional buyers to be used as replacement stock or finished for meat production. A previous study of the farm’s operations suggested the potential for improved financial performance by selling more livestock as meat through wholesale and retail markets and expanding the production and retail marketing of horticultural products [12]. Opportunities for expanding retails sales, however, were very limited through seasonal farmers markets in the area.
In an effort to build a more financially sustainable farming operation through value-added processing and direct marketing and sales, the Berea College Farm opened a farm store in late 2013 in a renovated industrial building at the interface between its campus and farm [24]. The main purpose for the Berea College farm store (hereon referred to as the “farm store”) was to serve as a space for year-round, direct sales to consumers and as a facility for value-added processing and product development (Figure 1 and Figure 2). Additionally, it provided educational opportunities for students to learn about and experiment with value-added agricultural processing as part of formal academic courses and though the College’s labor program, in which all students work part-time in one of more than 100 departments on campus in exchange for a full-tuition scholarship while attending the institution (about 10 hours of work per week). Since education is fundamental to the store’s existence, its operational transparency makes it possible to assess the farm store’s performance as a business.
The farm store serves as a facility to store, process, package, and sell products derived largely from the field crops, horticultural crops, livestock, and minor production enterprises of the farm (Figure 1). It is equipped with a refrigerated meat processing room, commercial kitchen, walk-in refrigerator and freezer spaces, dry storage and processing areas for grains and horticultural crops, and a retail space with seating and tables that allow dining for about 20 customers (Figure 3). Although livestock are still slaughtered at regional, USDA-inspected facilities, primal and sub-primal cuts can be further processed into retail cuts or value-added products likes sausages and deli meats. A limited range of items produced by other businesses are also offered for resale, particularly regionally-grown products from area farmers or entrepreneurs, or from former students.
The transition from vending at local farmers markets once or twice per week for 9–10 months of the year (March to December) to year-round sales, five days per week, required not only new infrastructure but also improved systems for tracking sales and transferring funds (income) to the appropriate farm-production enterprises. The farm store compensated the various farm enterprises at fair-market wholesale prices as determined by cost analyses and market research. Transactions were for whole animals only (no halves or quarters) and produce was graded either for retail or as “seconds” having cosmetic imperfections for kitchen use and processing. A point-of-sale (POS) system was adopted for conducting and recording sales, tracking inventory by product and category, and generating financial reports. Sufficient margins to cover estimated overhead costs had to be added to the price of items.
A standard grocery industry gross margin of 30% over the cost of goods sold (COGS) was the target for overall store sales [25]. The margins on individual products ranged considerably as they had to be comparable to and competitive with the retail prices at nearby supermarkets. For example, the margin on ground beef, the most common meat product sold, was about 18% while that of beef tenderloin (filet mignon) was 300%. Vegetables, fruits, herbs and plants were retailed with a 10–30% margin. Adding to the challenge of maintaining a gross margin of 30% over the COGS was an institutionally-mandated discount for students, staff, and faculty of the College. Staff and faculty received 10% off while students received 15% off of all purchases. The costs of production for ready-to-eat foods, such as sandwiches and soups, had to be estimated by factoring in ingredients, labor, utilities, waste, and depreciation on equipment. These prices were often adjusted downward slightly as well to be more comparable to other options that consumers had at “fast casual” or limited-service eateries in the area. Adjustments to compete with local market prices meant that the actual overall gross margin ranged between 25% and 30% above the COGS.
3. Materials and Methods
This study assessed the net financial effect on the farm resulting from the creation of the farm store by determining the additional income and costs associated with processing, storing, marketing, and selling its agricultural products during the first six years of the farm store’s operations. The analysis relied on the following sources of information: (1) sales data from the farm store’s POS system; (2) annual budget reports generated by the Berea College Office of Finance and Department of Agriculture and Natural Resources; and (3) several unpublished documents including a feasibility study for the creation of the farm store [26], a business plan for the farm store [27], and proposals for the creation and development of the farm store. Available financial data (USD, inflation-adjusted to 2019) included whole-farm costs and income from 2007 through 2019, which were divided into pre- (2007–2012) and post-farm store (2014–2019) periods. The transition year during which the farm store was constructed and opened, 2013, was not included in the analysis because consistent protocols for allocating material and personnel costs between the farm store and the various farm-production enterprises were not yet firmly established. Thus, it was not possible to reliably track the flow of resources (materials, labor, and money) between the various enterprises.
Since farm store sales affected all of the farm’s production enterprises directly and indirectly, assessing the impact of the farm store simply by examining and analyzing its income and costs in isolation from the rest of the farm was insufficient for assessing the overall financial impact. Doing so would ignore the multiplier effect of product sales cascading through the whole-farm supply chain. Increasing sales by the farm store would lead to greater demand for products and ingredients from the farm’s production enterprises and increased revenue for those enterprises. For example, beef cattle sold as meat though the farm store rather than as live animals at auction would generate more revenue for the farm’s cattle enterprise as well as for the farm store [12]. By contrast, in the alternative scenario in which the farm store did not exist, the farm would still have opportunities to sell cattle through other established but less lucrative market pathways, such as livestock auctions, to generate income.
Therefore to assess the overall effect of the farm store, a partial budgeting analysis was performed. Partial budgeting is a method typically used for farm planning because it allows for comparison of the costs and returns of alternative management decisions for a business [28,29,30]. Aspects of a business remaining unchanged are left out of the analysis. Thus it is particularly useful in deciding upon the adoption of new technologies or production practices, adding or eliminating enterprises, or making capital improvements. Its usefulness depends upon having reliable estimates for the expenses and income of proposed alternatives. In this case study, the alternative is the absence of the farm store. In essence, the question being asked is, would the farm be more or less profitable without the farm store?
This question is answered by subtracting the additional costs associated with the farm store from the additional income generated through the farm store. This additional income was estimated as the actual whole-farm income (with the farm store) minus the whole-farm income without the farm store, projected with simple linear regression [31] using the actual sales data from the years immediately before the farm store opened: 2007 to 2012 (Figure 4). Thus, it was assumed that whole-farm income would have continued to increase at the same rate from 2014 to 2019 as it did from 2007 to 2012 if the farm store had not been constructed and opened.
Costs added by the farm store were categorized as materials, labor, and overhead. Material costs included all payments to the farm-production enterprises for products and ingredients, products and ingredients from other sources, kitchen supplies and small equipment, licensing and inspection fees, employee training, utilities, repairs, and advertising. The overhead was estimated as the total costs for (1) building design and renovation (including asbestos abatement); and (2) purchase and installation of large equipment. Since these capital expenses were grant-funded—a situation that is possible but unlikely for a small family farm—it was assumed for this analysis that these costs were paid for with a guaranteed loan through the USDA Farm Service Agency with a 40-year term at a fixed 2.5% interest rate [32,33,34]. Property taxes are not charged to non-profit organizations, so none were included here.
Labor costs included the wages, taxes, and benefits for staff responsible for managing and operating the farm store. Total student labor contributions to the farm remained unchanged with the addition of the farm store and were therefore left out of the analysis, as allowed in partial budgeting. Student labor is somewhat flexible and dynamic within the whole-farm operation, a situation that allows for diverse student-learning experiences. Student labor activities shift as needed to carry out necessary work among the various farm enterprises throughout the year. Eliminating the need for some tasks, such as operating a stand at the farmers markets or raising goats, meant that student labor hours were available for other tasks, such as working at the farm store.
In addition to analyzing changes in whole-farm costs and income with the addition of the farm store, sales of each of the four major product categories were examined and compared, including meats, baked goods, fresh produce, and ready-to-eat foods (Figure 1). This revealed patterns about the relative importance of the different product groups over the study period and suggested possible explanations for findings as well as future trends. Data were also available to indirectly examine sales patterns among two groups of customers: (1) students, staff, and faculty affiliated with Berea College; and (2) low-income customers using the USDA Supplemental Nutrition Assistance Program (SNAP). These data served as indicators of the relative importance of the hyperlocal community of campus-affiliated customers as well as the accessibility of the farm store to limited-income customers who use SNAP benefits.
4. Results and Discussion
Prior to opening of the farm store in 2013, whole-farm gross income increased at an average rate of about 1.3% annually based on the sales data from 2007 to 2012 (Figure 4). Over the six-year period following the opening of the farm store, income increased annually at an average rate of 16.5%. By 2019, six years after the opening of the farm store, actual farm income was more than 2.5 times greater than the projected income without the farm store that was forecasted using simple linear regression (Figure 4).
Despite the dramatic increase in whole-farm income, however, the additional costs associated with the farm store were greater than income in every year over the six-year period (Table 2). Annual total operating costs for the farm store enterprise exceeded the additional income by an average of USD 113,390. During the last two years of the study period (2018 and 2019), the enterprise came the closest to breaking even financially but still fell short by USD 60,000 to USD 80,000 (Table 2). Material inputs accounted for the greatest share of total costs and in one year (2015), actually exceeded sales, apparently due to stockpiling products from the farm. These material costs increased from about 41% of total costs in 2014 to 58% in 2019. Labor costs accounted for about a third of total costs throughout the study period while the share for fixed overhead costs declined as expected (Table 2). Even without the fixed overhead costs, the farm store income approached but did not ever reach the equivalent of the variable operating expenses for materials and labor.
These results indicate that efforts to match retail prices found at large grocery chains, typically referred to as “supermarkets” and “superstores,” or using an average gross margin over the COGS of just 30%, or slightly less, was insufficient to cover the costs of operating this value-adding enterprise. While this gross margin may be typical for large grocery store chains with high sales volumes [25], it was not sufficient to cover the costs of this enterprise at this scale. The same economies of scale that make it difficult for small farms to succeed financially [35] are also clearly operating at other stages of the food supply chain beyond farm production, including processing, packaging, storing, retailing, and preparing.
A few typical industry benchmarks and labor-related metrics illustrate this point. The amount of revenue generated annually per employee in the US grocery industry from 2007 to 2010 averaged about USD 200,000 [25]. More recently, Kroger Company, the largest grocery store chain in Kentucky and the world, was generating over USD 300,000 annually in gross sales per employee in 2019 [36,37]. By contrast, the farm store generated just USD 150,000 in sales per full-time equivalent (FTE) employee in 2019.
Further, the cost per FTE employee at the farm store, including wages and benefits, was about USD 50,000 per year in 2019 while the average cost per employee in the US grocery industry was still less than USD 40,000 [38,39]. Part of the higher labor cost stems from institutional efforts to have more employees compensated with what the Massachusetts Institute of Technology’s Living Wage Calculator indicates is needed for a typical family in the area [40,41]. Further, an enterprise like this requires staff highly skilled in a wide range of tasks related to processing and preparing foods from raw ingredients coming directly from the farm, in addition to carrying out all of the routine retail operations and business management. By contrast, a substantial fraction of the workforce at large grocery chain stores are cashiers and stock clerks, specialized jobs with relatively low wages [39].
Another important factor driving the farm store’s higher costs relative to income is the steadily increasing importance of ready-to-eat prepared foods over the six-year period. In 2014, these food items accounted for just 2% of total sales, but by 2019, they were the most important product category, generating 27% of total sales (Figure 5). A retail business that originally resembled a simple, small grocery store featuring the farm’s products was evolving to more closely resemble a “farm-to-table” café or restaurant in its operations. While meat sold fresh or frozen declined in relative importance, it comprised a significant part of many of the ready-to-eat items, such as sandwiches, casseroles, tamales, stews, and soups.
Typical restaurant benchmarks use “prime costs” rather than COGS to account for the labor as well as the ingredients that make up each item sold. Prime costs are expected to be 60% or less of total costs with about half of this being for materials (ingredients) and half for labor [42,43]. This would leave at least a 40% margin to cover all remaining costs as well as profit, rather than the 30% gross margin that was targeted in the farm store’s plan. Ideally, the farm store’s target margins should have shifted to account for the change in product sales. Even if the farm store was meeting its goal of a 30% gross margin over COGS, the margins would likely have been insufficient for covering the remaining costs of operations, with the increasing importance of ready-to-eat offerings.
But while internal factors like labor efficiency and gross-margin targets are clearly important issues, the farm store’s challenges in performance could not be understood without considering external factors, particularly the costs of material inputs and the local market conditions. It has been well established that the price premiums associated with certified organic, fair-trade, and animal-welfare-labelled products are necessary to cover the higher costs of production [44,45,46,47,48,49,50]. These higher production costs either have to be passed on through the supply chain to consumers or absorbed at various stages throughout the chain before reaching consumers. Since most of the farm’s products carried third-party certifications to verify production practices—including USDA certified organic, American Grassfed Association and Animal Welfare Approved—the wholesale costs for most of the farm store’s products and ingredients tended to be higher than comparable conventional inputs.
Raising prices to account for these more expensive inputs presented a challenge, given the unfavorable economic conditions in a region with low household incomes [18]. In fact, the decisions by the farm’s management not to pursue some third-party certifications ,e.g., organic livestock production and poultry welfare, stemmed from the assumption that local market demand would not be sufficient to justify the added costs. Despite steady growth in this segment of the retail grocery market in the US nationwide, surveys have confirmed that the higher prices for such products present barriers to lower-income consumers [51,52,53].
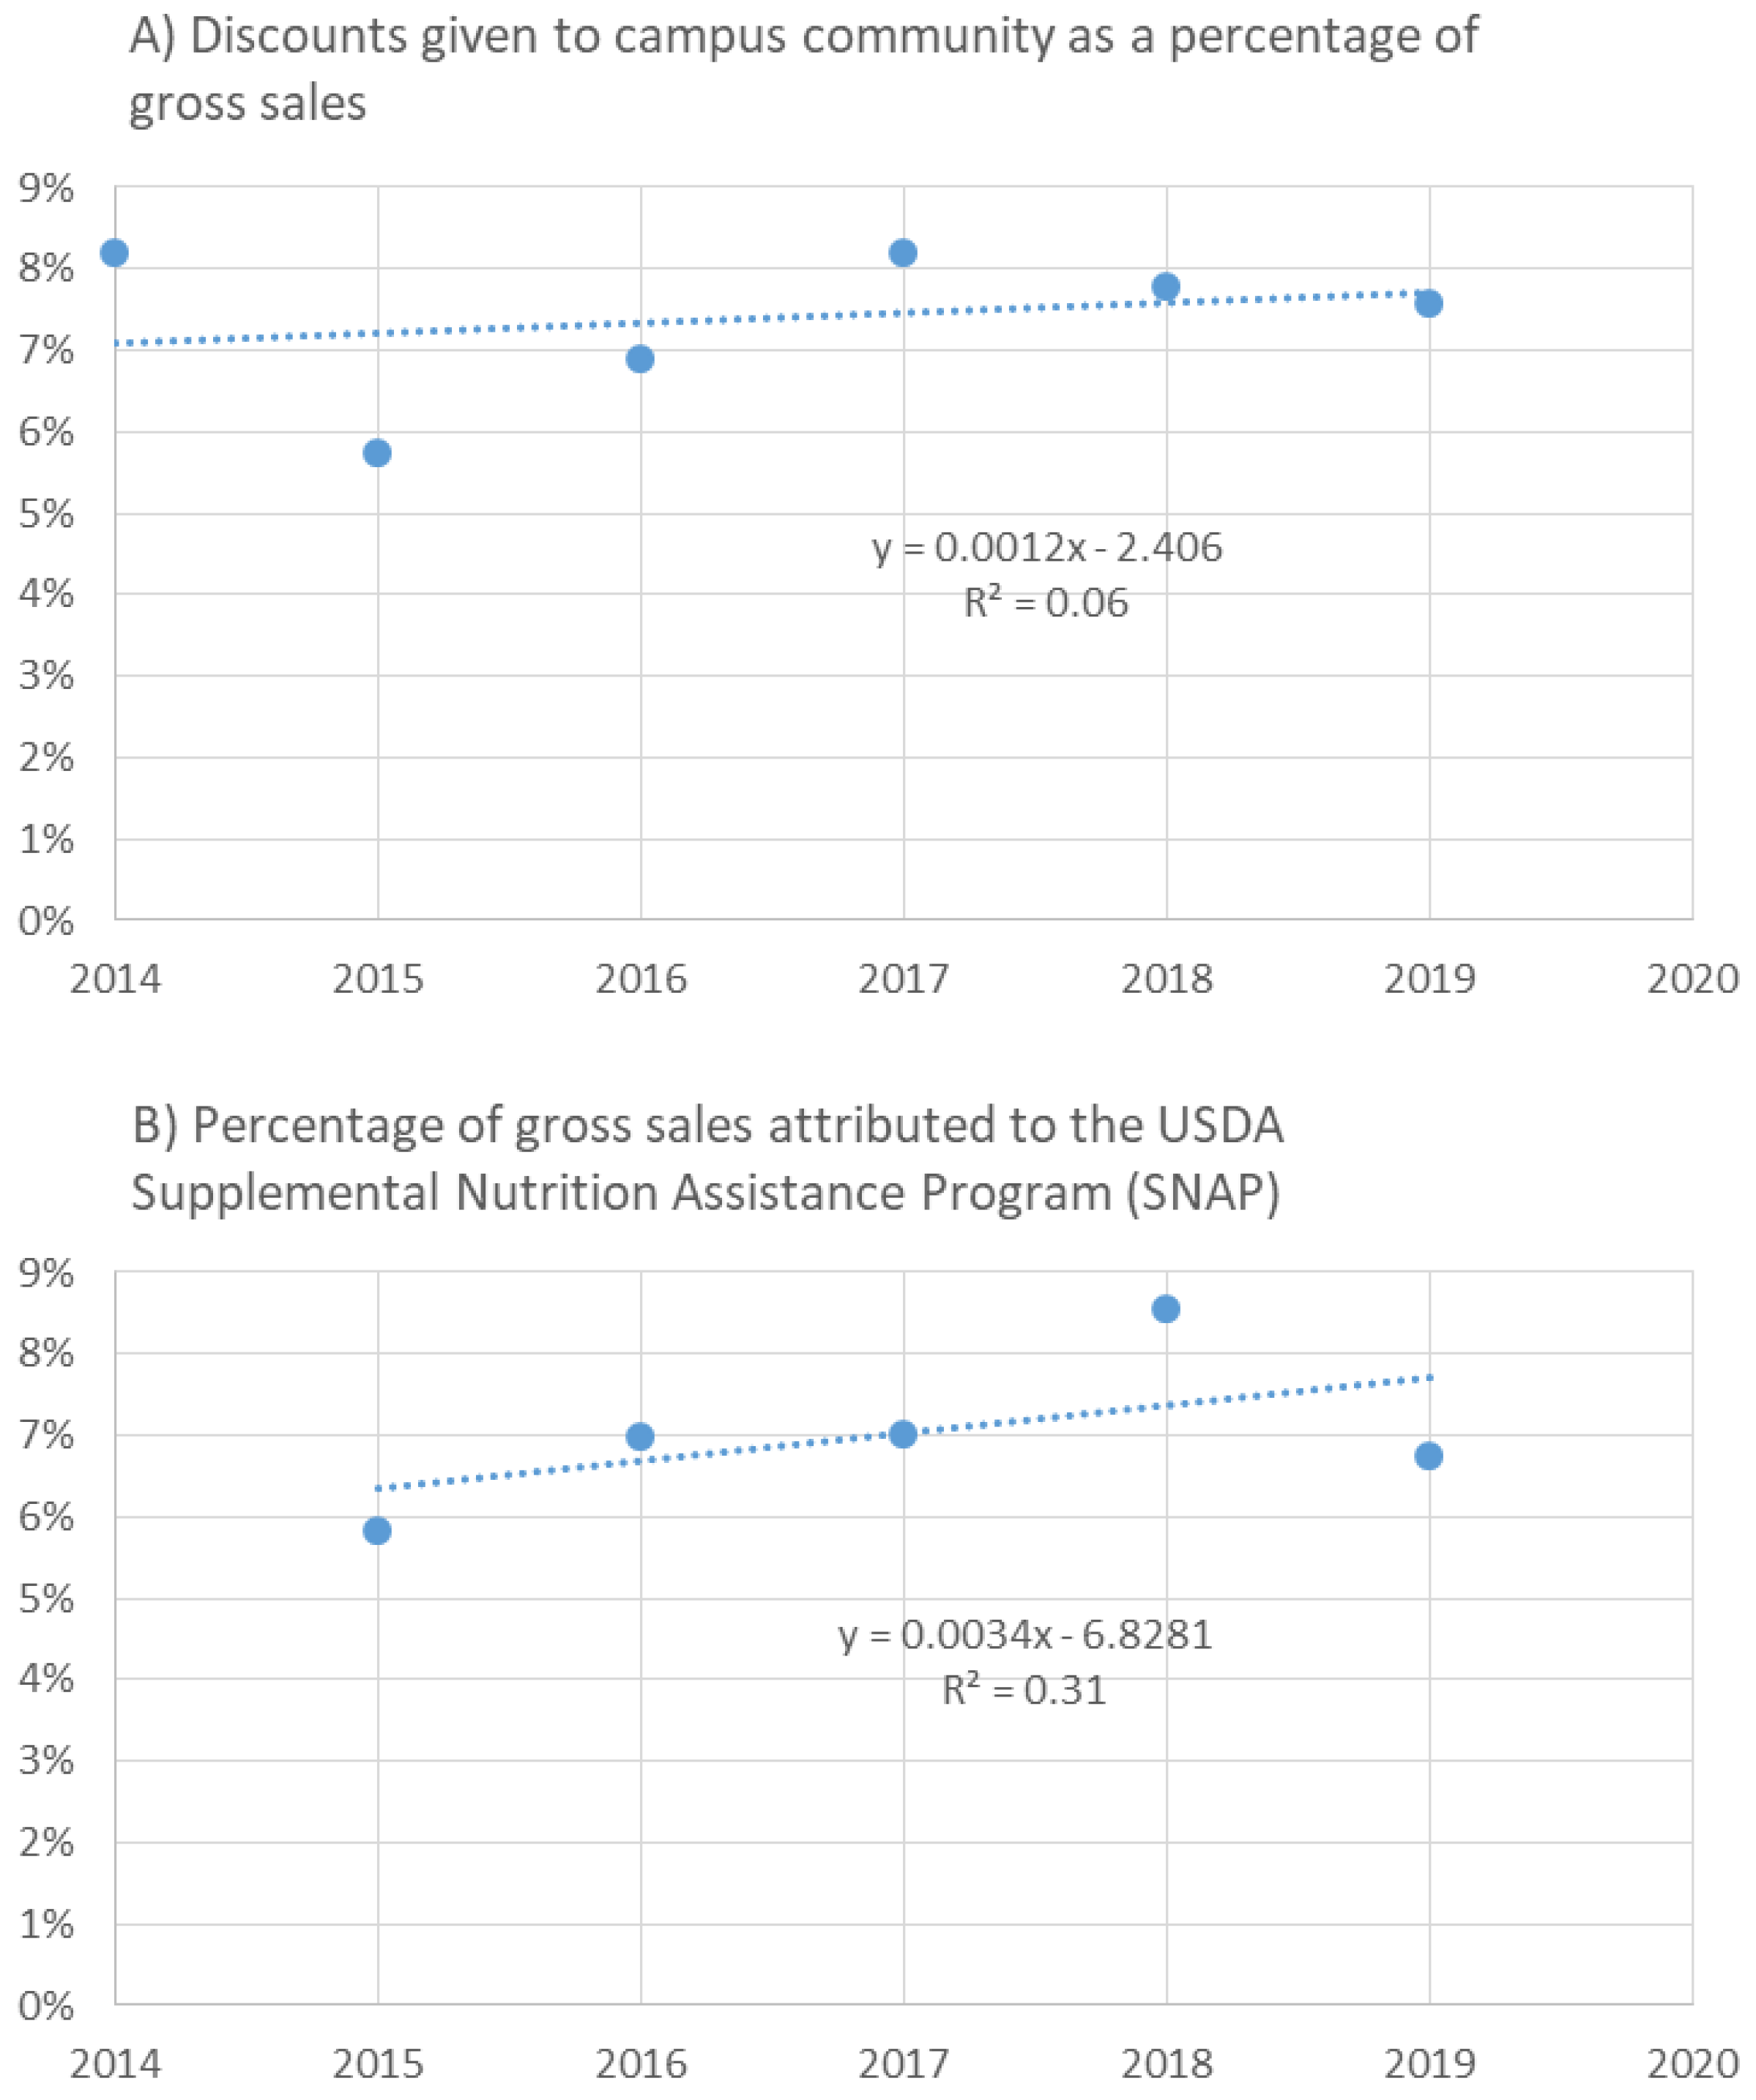
Further, ensuring that retail prices were sufficient to cover the college-mandated 10–15% discount for the campus community added complexity and difficulty. On average, over 7% of gross sales were given back as discounts to consumers who were affiliated with Berea College (Figure 6A). In 2019, this was the equivalent to one-half of the cost for wages and benefits for an FTE employee. Typically discounts such as these are given by retail businesses in exchange for memberships with fees or customer loyalty in the form of repeated purchases and/or information used in targeted advertising. The farm store received neither of these benefits in return for the discounts, but raising prices to account for the discount margin risked turning away other customers in the community who would likely seek less expensive options.
A price-sensitive group of customers given particular consideration were those using USDA SNAP benefits. Sales data indicate that purchases using SNAP benefits accounted for an average of 7% (range, 5.8% to 8.5%) of farm store income annually over the study period, with a slight positive trend (Figure 6B). Comparing this metric to those of large supermarkets and superstores would provide insights into the cost-competitiveness of the farm store for low-income consumers but these grocery chains do not share this information.
According to USDA data, however, over 80% of SNAP benefits were spent at these large grocery chains in 2017 while less than 0.1% were spent at farmers markets [54]. In that year, SNAP consumers redeemed about USD 63 billion in benefits for food purchases [55]. The entire US grocery industry generated USD 840 billion in sales that year [56], meaning that 7.5% of food purchases in 2017 were derived from SNAP benefits. Based on this information, the farm store’s SNAP-supported sales are on par with the average of the entire US grocery industry, suggesting indirectly that its retail prices were competitive with the large grocery chains.
This difficult situation illustrates a fundamental dilemma experienced by many small businesses, but small farming and food enterprises in particular. Raising prices in order to factor in completely and fairly the costs of materials and labor is a struggle, and sometimes is met with internal resistance by a moral or ethical idealism to keep products affordable. This can result in the self-exploitation of farmers and workers as they try to earn a living [57,58,59,60]. Small farms often exist in communities where incomes are lower because available farmland tends to be cheaper. These farms are faced with the choice of marketing locally and keeping their prices low and their gross margins thin at best or finding more distant markets for their products in communities with more middle- and upper-class consumers who can afford to pay a higher price.
The farm store, pressed between higher-priced inputs and lower-income consumers in the community, exemplifies this common predicament. Any increases in retail prices to account for higher labor and material costs could result in a loss of competitiveness and a decline in sales. It is easy to understand the appeal to small farmers in pursuing value-added enterprises after examining the USDA “Food Dollar” statistics [61]. Farm production accounted for just 7.8% of each dollar spent on food in 2017. By contrast, food processing and retail accounted for 15% and 12.6%, respectively. Capturing some of that value beyond the farm gate offers small farms a chance at improving their financial health without expanding their farmland. However, a serious concern and major risk is, of course, that the additional costs of such pursuits exceed the additional revenue, as seen in this case study.
5. Conclusions
The opening of an on-farm facility to process, add value, and retail products derived from its livestock, field crops, and horticultural crops allowed the Berea College Farm to increase its gross revenue substantially. Six years after opening, however, the farm store was approaching but still not reaching the financial break-even point, as determined with a partial budgeting analysis. Based on industry benchmarks and standard metrics, its costs were too high and sales volumes too low to compete with the large grocery chains that dominate the retail food industry in the region. Additionally, niche marketing opportunities within this relatively low-income region were limited. In short, the farm store lacked a sufficient economy of scale to reach profitability, depended heavily on higher-paid skilled labor, and used higher-cost material inputs carrying third-party certifications for meeting organic and animal-welfare standards, all while attempting to match the retail prices of the nearby grocery chains. Similar difficulties in achieving adequate scale to sustain business enterprises within alternative food networks have been described for farmers markets [62], CSAs [63], food hubs [64,65], wholesale produce auctions [66], and even well-funded, online retail platforms [67].
In addition to having more control over the supply chain and improve the transparency from farm to consumer, the Berea College Farm expected some of the more specific financial advantages associated with vertical integration in opening the farm store. The immediate proximity of the farm store to the farm was anticipated to reduce transportation costs, storage costs, and product losses during transport and storage relative to conventional supply chains. Further, opportunities existed to transform less valuable cuts of meat and blemished produce into more marketable products with greater value. The additional storage capacity provided by the farm store meant that fewer trips would be needed back and forth to slaughter facilities. Additionally, the consolidated storage and inventory system meant more efficient tracking and management to ensure a steady supply of products to sell throughout the year. However, these savings and improved efficiencies were not sufficient to offset the higher costs associated with other aspects of the enterprise.
The farm store’s first six years of operation certainly justify caution in any farm’s plans to transition from vending at seasonal farmers markets to operating a permanent brick-and-mortar business. It would be unlikely that very many farms of this scale could sustain similar financial losses for a comparable period of time while working toward reaching a break-even point. This calls into question the realistic likelihood of improving small-farm profitability through on-farm, value-added processing enterprises. More studies of on-farm, value-adding enterprises are needed to more thoroughly understand the factors most important in determining success and failure.
Despite the farm store’s lack of profitability, there are some potentially useful insights to be gained from its experiences. It quantitatively demonstrated the potential to add value to raw farm products and generate substantial additional income. Toward the end of the study period, the enterprise was trending toward breaking even, covering nearly all the material and personnel costs by 2019. In fact, the amount of potential revenue given back as discounts to college-affiliated customers exceeded the shortfall between the gross income and the variable costs of materials and labor that year. The shift toward producing and selling more ready-to-eat items was essential in driving this positive trend and illustrated the importance of adaptability as the enterprise transitioned from being a farm-based grocery market to more of a limited-service eatery or café. Perhaps this opportunity should have been anticipated, given the steady, decades-long trend in American consumers spending relatively more on food away from home compared to that prepared and consumed at home [68], a phenomenon that grocery chains have been responding to and encouraging very effectively.
This case study also illustrates the critical roles that subsidies can play in establishing new small business enterprises. A grant for the initial capital investment as well as the institutional allowance to operate with annual losses in establishing the enterprise were essential for its continued operation during the six-year period. The need for subsidies could be seen as a sign that the business is simply not financially sustainable, but small business failure rates are highest during the years immediately after opening [69], and such assistance can be critical for small business survival while problems are addressed and operational improvements made. Large grocery chains receive various kinds of subsidies, particularly when they open in low-income areas. These can include grants and tax breaks (both local and federal) [70,71,72] as well as the indirect benefits of a workforce that has among the highest use of SNAP benefits of any sector of the economy [73,74]. Thus, it is not unreasonable to expect small businesses like this one to require similar subsidies during the start-up, particularly since few small farms are in a position to privately finance the creation of such an enterprise in its entirety. Investment subsidies, both public and private, can yield measurable benefits to the community—environmental, social and economic—beyond those immediately associated with the new enterprise. Identifying and assessing these benefits should be a focus of future research efforts.
Funding
This research received no external funding.
Acknowledgments
The author thanks Berea College Office of Finance and the Berea College Farm for providing access to the financial records.
Conflicts of Interest
The author declares no conflict of interest.
References
- Anderson, D.P.; Hanselka, D. Adding Value to Agricultural Products; Texas AgriLife Extension Service: College Station, TX, USA, 2009; Available online: https://oaktrust.library.tamu.edu/bitstream/handle/1969.1/86940/pdf_1302.pdf?sequence=1&isAllowed=y (accessed on 1 November 2019).
- Evans, E. Value Added Agriculture: Is it Right for Me; Florida Cooperative Extension Service; Institute of Food and Agricultural Sciences/University of Florida: Gainesville, FL, USA, 2012; Available online: http://edis.ifas.ufl.edu/pdffiles/FE/FE63800.Pdf (accessed on 1 November 2019).
- Camenisch, A.; Bastin, S.; Hege, A. Entrepreneurship on the farm: Kentucky grower perceptions of benefits and barriers. Sust. Agric. Res. 2016, 5, 86–96. [Google Scholar] [CrossRef]
- Gwin, L.; Brekken, C.A.; Trant, L. Farm Direct at five years: An early assessment of Oregon’s farm-focused cottage food law. J. Agric. Food Syst. Community Dev. 2018, 8, 85–104. [Google Scholar] [CrossRef] [Green Version]
- Born, H.; Bachmann, J. Adding Value to Farm Products: An Overview; Appropriate Technology Transfer for Rural Areas—National Center for Appropriate Technology: Butte, MT, USA, 2006; Available online: https://attra.ncat.org/attra-pub/summaries/summary.php?pub=270 (accessed on 5 November 2019).
- Horwitz, S.; Hashley, J.; Norder, B. Starting a Value Added Food Business; Northeast Network of Immigrant Farming Projects: Boston, MA, USA, 2008; Available online: https://nesfp.nutrition.tufts.edu/sites/default/files/uploads/pl_value_added.pdf (accessed on 5 November 2019).
- Gwin, L.; McCann, N. Use it or lose it: Local food, regional processing and the perils of unused capacity. In Harvesting Opportunity: The Power of Regional Food System Investments to Transform Communities; Federal Reserve Bank of St. Louis, Board of Governors of the Federal Reserve System, Ed.; Federal Reserve Bank of St. Louis: St. Louis, MI, USA, 2017; pp. 151–171. 20p, Available online: https://www.stlouisfed.org/community-development/publications/~/media/files/%20pdfs/community-development/harvesting-opportunity/harvesting_opportunity.pdf?la=en#page=151 (accessed on 5 November 2019).
- Sayre, L. Marketing Strategies for Farmers and Ranchers; Sustainable Agriculture Network; Sustainable Agriculture Research and Education; United States Department of Agriculture: Washington, DC, USA, 2006; Available online: https://www.sare.org/Learning-Center/Bulletins/Marketing-Strategies-for-Farmers-and-Ranchers (accessed on 5 November 2019).
- Reganold, J.; Jackson-Smith, D.; Batie, S.; Harwood, R.; Kornegay, J.L.; Bucks, D.; Flora, C.; Hanson, J.; Jury, W.; Meyer, D.; et al. Transforming US agriculture. Science 2011, 332, 670–671. [Google Scholar] [CrossRef] [PubMed]
- Lu, R.; Dudensing, R. What do we mean by value-added agriculture? Choices 2015, 30, 1–8. [Google Scholar]
- Clark, S. Berea College (1871): The work college legacy. In Fields of Learning: The Student Farm Movement in North America; Sayre, L., Clark, S., Eds.; University Press of Kentucky: Lexington, KY, USA, 2011; pp. 31–50. [Google Scholar]
- Clark, S. Resource-use and partial-budget analysis of a transition to reduced-input and organic practices and direct marketing: A student-farm case study. J. Agric. Food Syst. Community Dev. 2014, 4, 113–130. [Google Scholar] [CrossRef] [Green Version]
- LaCharite, K. Re-visioning agriculture in higher education: The role of campus agriculture initiatives in sustainability education. Agric. Hum. Values 2016, 33, 521–535. [Google Scholar] [CrossRef]
- Sayre, L.; Clark, S. (Eds.) Fields of Learning: The Student Farm Movement in North America; The University Press of Kentucky: Lexington, KY, USA, 2011. [Google Scholar]
- Hoppe, R.A. Structure and Finances of U.S. Farms: Family Farm Report, 2014 Edition; United States Department of Agriculture; Economic Research Service: Washington, DC, USA, 2014.
- Heimlich, R. Farm Resource Regions; Economic Research Service; United States Department of Agriculture: Washington, DC, USA, 2000.
- Clark, S. Agroecology in Central Appalachia: Framing problems and facilitating solutions. In Agroecology, Ecosystems and Sustainability; Benkeblia, N., Ed.; CRC Press: Boca Raton, FL, USA, 2014; pp. 279–308. [Google Scholar]
- United States Census Bureau. Available online: https://www.census.gov/quickfacts/bereacitykentucky (accessed on 6 November 2019).
- Hoppe, R.A.; MacDonald, J.M. Updating the ERS Farm Typology, EIB-110; Economic Research Service; United States Department of Agriculture: Washington, DC, USA, 2013.
- United States Department of Agriculture. Available online: https://www.usda.gov/topics/organic (accessed on 6 November 2019).
- American Grassfed Association. Available online: https://www.americangrassfed.org/ (accessed on 6 November 2019).
- Animal Welfare Approved. Available online: https://agreenerworld.org/certifications/animal-welfare-approved/ (accessed on 6 November 2019).
- Strom, S. What to Make of those Animal-Welfare Labels on Meat and Eggs; New York Times: New York, NY, USA, 2017; Available online: https://www.nytimes.com/2017/01/31/dining/animal-welfare-labels.html (accessed on 17 January 2020).
- Berea College Farm Store. Available online: https://bereacollegefarmstore.com/ (accessed on 6 November 2019).
- The Reinvestment Fund. Understanding the Grocery Industry. 2011. Available online: https://www.reinvestment.com/wp-content/uploads/2015/12/Understanding_the_Grocery_Industry-Brief_2011.pdf (accessed on 17 January 2020).
- Clark, S.; Panciera, M. The Feasibility of Establishing a Self-Sustaining Educational Farm Store at Berea College. 2011; unpublished. [Google Scholar]
- Panciera, P.; Clark, S. Berea College Farm Store Business Plan. 2011; unpublished. [Google Scholar]
- Kay, D.R.; Edwards, W.M. Farm Management, 7th ed.; McGraw-Hill Companies: New York, NY, USA, 2012. [Google Scholar]
- Rabin, J.; Lee, D.L.; McGarrity, C.; Banasiak, M.R. Partial Budgeting: A Financial Management Tool; Rutgers Cooperative Extension: New Brunswick, NJ, USA, 2007; Available online: https://sustainable-farming.rutgers.edu/wp-content/uploads/2014/09/Partial-Budgeting-Manual.pdf (accessed on 8 November 2019).
- Roth, S.; Hyde, J. Partial Budgeting for Agricultural Businesses; Agricultural Research and Cooperative Extension; Penn State University: State College, PA, USA, 2002; Available online: https://extension.psu.edu/partial-budgeting-for-agricultural-businesses (accessed on 8 November 2019).
- Siegel, A.F. Practical Business Statistics, 6th ed.; Academic Press: Burlington, MA, USA, 2011. [Google Scholar]
- Farm Loans; United States Department of Agriculture; Farm Service Agency: Washington, DC, USA, 2014. Available online: https://www.fsa.usda.gov/Assets/USDA-FSA-Public/usdafiles/FactSheets/archived-fact-sheets/farmlnchart_current_nov2014.pdf (accessed on 8 November 2019).
- FSA Loan Programs; United States Department of Agriculture; Farm Service Agency: Washington, DC, USA, 2019; Available online: https://www.agcredit.net/loans/fsa-loan-programs.aspx (accessed on 10 November 2019).
- Your Guide to FSA Farm Loans; United States Department of Agriculture; Farm Service Agency: Washington, DC, USA, 2012. Available online: https://www.fsa.usda.gov/Internet/FSA_File/fsa_br_01_web_booklet.pdf (accessed on 17 January 2020).
- Duffy, M. Economies of size in production agriculture. J. Hunger Environ. Nutr. 2009, 4, 375–392. [Google Scholar] [CrossRef] [PubMed]
- CSIMarket. Available online: https://csimarket.com/stocks/KR-Revenue-per-Employee.html (accessed on 11 November 2019).
- Deloitte. Global Powers of Retailing 2019. Available online: https://www2.deloitte.com/content/dam/Deloitte/global/Documents/Consumer-Business/cons-global-powers-retailing-2019.pdf (accessed on 17 January 2020).
- Bureau of Labor Statistics, United States Department of Labor. Employer Costs for Employee Compensation—June 2019. Available online: https://www.bls.gov/news.release/pdf/ecec.pdf (accessed on 17 January 2020).
- Data USA, Grocery Store. Available online: https://datausa.io/profile/naics/grocery-stores#about (accessed on 11 November 2019).
- The Association for the Advancement of Sustainability in Higher Education. The Sustainability Tracking, Assessment & Rating System. Berea College, 2017. Available online: https://reports.aashe.org/institutions/berea-college-ky/report/2017-06-14/PA/wellbeing-work/PA-11/ (accessed on 1 December 2019).
- Massachusetts Institute of Technology. Living Wage Calculator. Living Wage Calculation for Madison County, Kentucky. Available online: https://livingwage.mit.edu/counties/21151 (accessed on 1 December 2019).
- Susskind, A.M.; Spies, R. Focus on finance: Aiming for restaurant success. In The Cornell School of Hotel Administration on Hospitality: Cutting Edge Thinking and Practice; Sturman, M.C., Corgel, J.B., Verma, R., Eds.; Cornell University; School of Hospitality Administration: Ithaca, NY, USA, 2012; pp. 227–243. Available online: https://onlinelibrary.wiley.com/doi/book/10.1002/9781119200901 (accessed on 17 January 2020).
- Bloom Intelligence. Restaurant Benchmarks. Available online: http://info.bloomintelligence.com/hubfs/Miscellaneous%20Downloads/Restaurant%20Benchmarks.pdf (accessed on 12 November 2019).
- Crowder, D.W.; Reganold, J.P. Financial competitiveness of organic agriculture on a global scale. Proc. Natl. Acad. Sci. USA 2015, 112, 7611–7616. [Google Scholar] [CrossRef] [PubMed] [Green Version]
- Uematsu, H.; Mishra, A.K. Organic farmers or conventional farmers: Where’s the money? Ecol. Econ. 2012, 78, 55–62. [Google Scholar] [CrossRef]
- McBride, W.D.; Greene, C.; Foreman, L.; Ali, M. The Profit Potential of Certified Organic Field Crop Production, ERR-188; United States Department of Agriculture; Economic Research Service: Washington, DC, USA, 2015.
- Acevedo, N.; Lawrence, J.D.; Smith, M. Organic, Natural and Grass-Fed Beef: Profitability and Constraints to Production in the Midwestern U.S.; Iowa State Value-Added Agriculture Extension: Ames, IA, USA, 2006. [Google Scholar]
- Matthews, K.H.; Johnson, R.J. Alternative Beef Production Systems: Issues and Implications; United States Department of Agriculture; Economic Research Service: Washington, DC, USA, 2013. Available online: https://www.ers.usda.gov/webdocs/publications/37473/36491_ldpm-218-01.pdf?v=41368 (accessed on 1 December 2019).
- Sumner, D.A.; Gow, H.; Hayes, D.; Matthews, W.; Norwood, B.; Rosen-Molina, J.T.; Thurman, W. Economic and market issues on the sustainability of egg production in the United States: Analysis of alternative production systems. Poult. Sci. 2011, 90, 241–250. [Google Scholar] [CrossRef] [PubMed]
- Painter, K.; Myhre, E.; Bary, A.; Cogger, C.; Jemmett, W. Break-even Analysis of Small-Scale Production of Pastured Organic Poultry; Pacific Northwest Extension; University of Idaho: Moscow, ID, USA, 2015. [Google Scholar]
- Huang, Y.; Edirisinghe, I.; Burton-Freeman, B.M. Low-income shoppers and fruit and vegetables: What do they think? Nutr. Today 2016, 51, 242–250. [Google Scholar] [CrossRef]
- Dettmann, R.L. Organic produce: Who’s eating it? A demographic profile of organic produce consumers. In Proceedings of the American Agricultural Economics Association Annual Meeting, Orlando, FL, USA, 27–29 July 2008. [Google Scholar]
- Riffkin, R. Forty-five percent of Americans seek out organic foods. Gallup. 2014. Available online: www.gallup.com/poll/174524/forty-five-percentamericans-seek-organic-foods.aspx (accessed on 17 January 2020).
- Wolkomir, E. SNAP Boosts Retailers and Local Economies; Center on Budget and Policy Priorities: Washington, DC, USA, 2018; Available online: https://www.cbpp.org/sites/default/files/atoms/files/8-29-17fa.pdf (accessed on 17 January 2020).
- SNAP Data Tables, 1969–2018. USDA Food and Nutrition Service. Available online: https://fns-prod.azureedge.net/sites/default/files/resource-files/SNAPsummary-11.pdf (accessed on 15 November 2019).
- Campbell, C.U.S. Grocery Industry Margins Could Shrink One-Third by 2023; The Food Institute: Upper Saddle River, NJ, USA, 2018; Available online: https://foodinstitute.com/blog/us-grocery-industry-margins-could-shrink-a-third-by-2023 (accessed on 17 January 2020).
- Galt, R.E. The moral economy is a double-edged sword: Explaining farmers’ earnings and self-exploitation in community-supported agriculture. Econ. Geogr. 2013, 89, 341–365. [Google Scholar] [CrossRef]
- Pilgeram, R. The only thing that isn’t sustainable … is the farmer: Social sustainability and the politics of class among Pacific Northwest farmers engaged in sustainable farming. Rural Soc. 2011, 76, 375–393. [Google Scholar] [CrossRef]
- Smith, B. Don’t Let your Children Grow up to Be Farmers; The New York Times: New York, NY, USA, 2014; Available online: https://www.nytimes.com/2014/08/10/opinion/sunday/dont-let-your-children-grow-up-to-be-farmers.html?_r=0 (accessed on 17 January 2020).
- Newman, C. Small Farms Aren’t the Answer. Medium. 2019. Available online: https://medium.com/sylvanaquafarms/small-family-farms-arent-the-answer-742b6684857e (accessed on 1 December 2019).
- Food Dollar Series; United States Department of Agriculture; Economic Research Service: Washington, DC, USA, 2017. Available online: https://www.ers.usda.gov/data-products/food-dollar-series/documentation.aspx (accessed on 1 December 2019).
- Stephenson, G.; Lev, L.; Brewer, L. ‘I’m getting desperate’: What we know about farmers’ markets that fail. Renew. Agric. Food Syst. 2008, 23, 188–199. [Google Scholar] [CrossRef]
- Woods, T.; Ernst, M.; Tropp, D. Community Supported Agriculture–New Models for Changing Markets; U.S. Department of Agriculture; Agricultural Marketing Service: Washington, DC, USA, 2017.
- Feldstein, S.; Barham, J. Running a Food Hub: Learning from Food Hub Closures; United States Department of Agriculture: Washington, DC, USA, 2017.
- Brislen, L.; Woods, T.; Meyers, L.; Routt, N. Grasshoppers Distribution: Lessons Learned and Lasting Legacy; University of Kentucky: Lexington, KY, USA, 2015; Available online: http://www2.ca.uky.edu/agcomm/pubs/SR/SR108/SR108.pdf (accessed on 12 January 2020).
- Johnson, R.; Fraser, E.D.; Hawkins, R. Overcoming barriers to scaling up sustainable alternative food systems: A comparative case study of two Ontario-based wholesale produce auctions. Sustainability 2016, 8, 328. [Google Scholar] [CrossRef] [Green Version]
- Noble, M. Crowd Cow Promised to Bring Craft Meat to the Masses. Some Ranchers Say it’s Been a Bad Deal; The New Food Economy, 2019. Available online: https://newfoodeconomy.org/crowd-cow-broken-promises-small-farmers-craft-meat/ (accessed on 2 December 2019).
- Saksena, M.J.; Okrent, A.M.; Anekwe, T.D.; Cho, C.; Dicken, C.; Eand, A.; Elitzak, H.; Guthrie, J.; Hamrick, K.S.; Hyman, J.; et al. America’s Eating Habits: Food Away from Home; United States Department of Agriculture Economic Research Service: Washington, DC, USA, 2018. Available online: https://www.ers.usda.gov/publications/pub-details/?pubid=90227 (accessed on 9 December 2019).
- Parsa, H.G.; Self, J.T.; Njite, D.; King, T. Why restaurants fail. Cornell Hotel Restaur. Adm. Q. 2005, 46, 304–323. [Google Scholar] [CrossRef]
- Freedman, M.; Kuhns, A. Supply-side subsidies to improve food access and dietary outcomes: Evidence from the New Markets Tax Credit. Urban Stud. 2018, 55, 3234–3251. [Google Scholar] [CrossRef] [Green Version]
- Planning for Healthy Places. Getting to Grocery: Tools for Attracting Healthy Food Retail for Underserved Neighborhoods. 2009. Available online: https://www.ca-ilg.org/sites/main/files/file-attachments/resources__getting_to_grocery_final_090909.pdf (accessed on 17 December 2019).
- Wenger, Y. Baltimore to Give Big Tax Break to Attract More Grocery Stores; Baltimore Sun: Baltimore, MD, USA, 2015; Available online: https://www.baltimoresun.com/maryland/baltimore-city/bs-md-ci-grocery-credit-20151210-story.html (accessed on 17 January 2020).
- Brown, H.C. Amazon Gets Huge Subsidies to Provide Good Jobs—But It’s a Top Employer of SNAP Recipients in at Least Five States; The New Food Economy, 2018. Available online: https://newfoodeconomy.org/amazon-snap-employees-five-states/ (accessed on 17 December 2019).
- Watkins, S. Kroger Ranks among Top Employers of Workers on Food Stamps; Cincinnati Business Courier, 2018. Available online: https://www.bizjournals.com/cincinnati/news/2018/09/12/kroger-ranks-among-top-employers-of-workers-on.html (accessed on 17 December 2019).
Figure 1.
A summary of production enterprises on the Berea College Farm and the categories of products generated and sold through its farm store. Ready-to-eat, prepared foods were made primarily from ingredients derived from the horticulture, livestock, and field-crop enterprises of the farm.
Figure 1.
A summary of production enterprises on the Berea College Farm and the categories of products generated and sold through its farm store. Ready-to-eat, prepared foods were made primarily from ingredients derived from the horticulture, livestock, and field-crop enterprises of the farm.
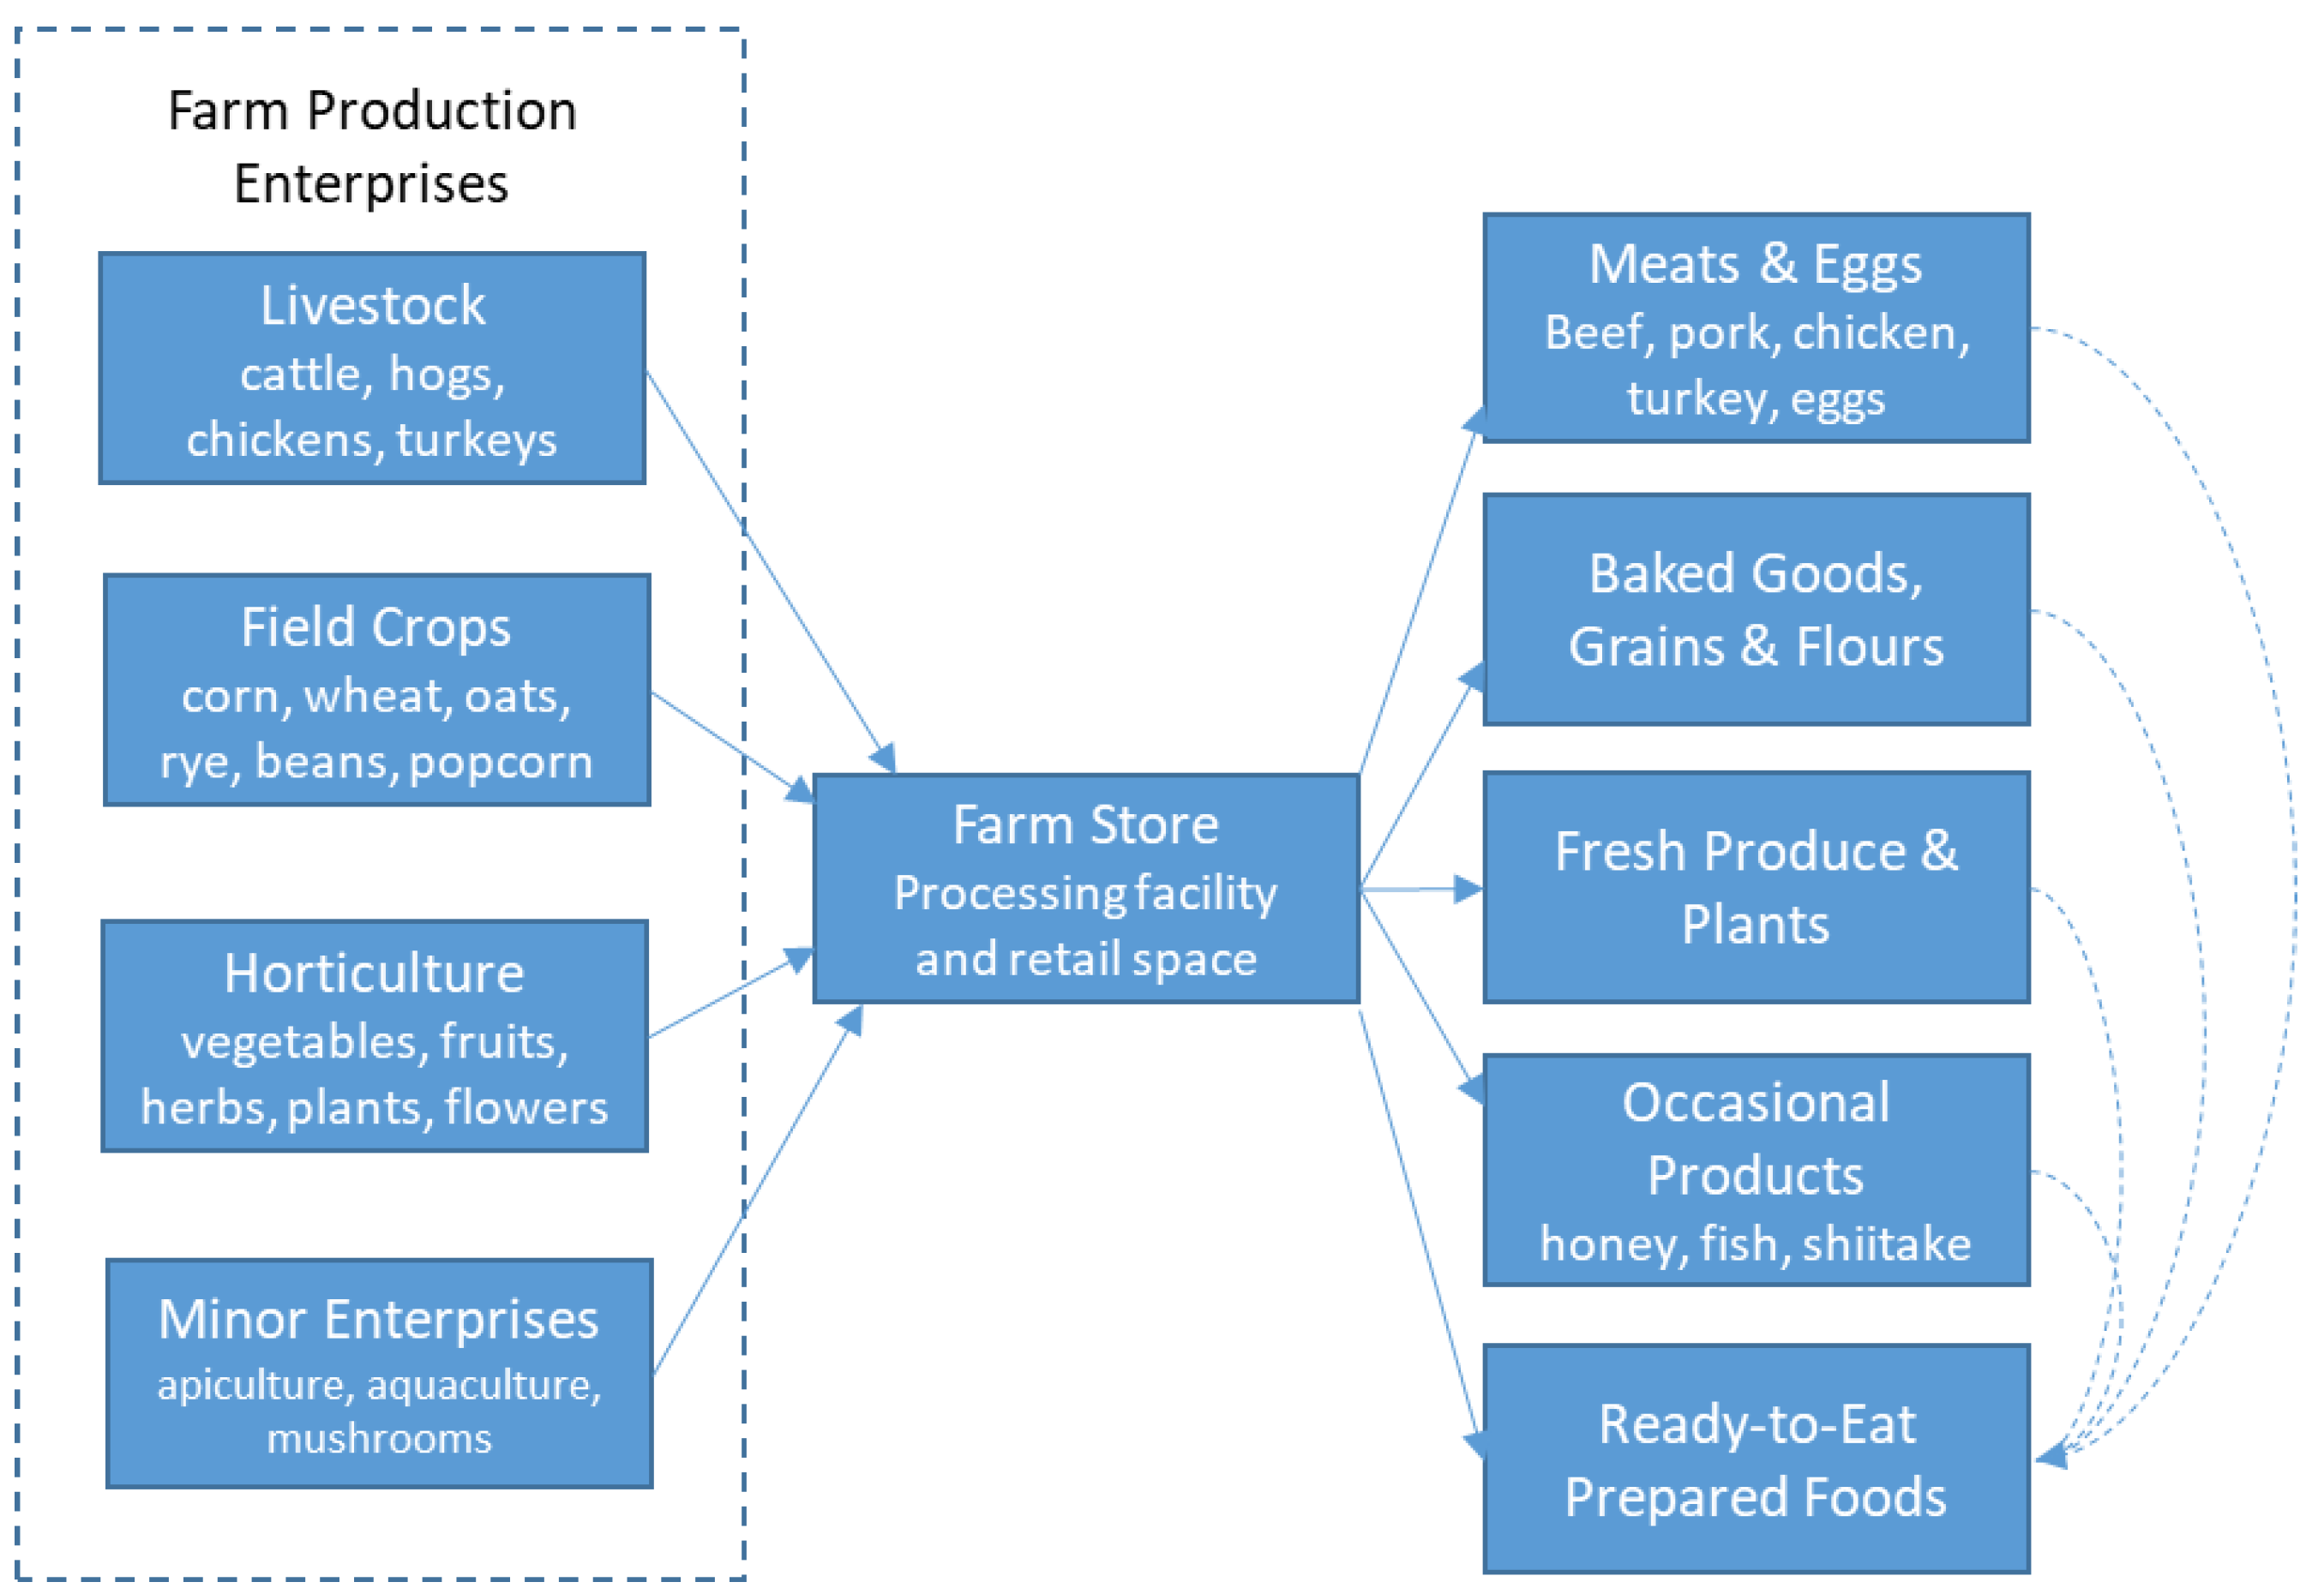
Figure 2.
The Berea College Farm’s markets include commodity, wholesale, and retail pathways. The addition of the farm store in 2013 facilitated a major shift away from commodities and toward retail sales.
Figure 2.
The Berea College Farm’s markets include commodity, wholesale, and retail pathways. The addition of the farm store in 2013 facilitated a major shift away from commodities and toward retail sales.

Figure 3.
The Berea College farm store was opened in 2013 in a (A) renovated industrial building at the interface of the campus of Berea College and its student farm. It includes (B) a meat processing room, (C) a commercial kitchen, and a (D) retail space with dining area.
Figure 3.
The Berea College farm store was opened in 2013 in a (A) renovated industrial building at the interface of the campus of Berea College and its student farm. It includes (B) a meat processing room, (C) a commercial kitchen, and a (D) retail space with dining area.

Figure 4.
Whole-farm income before (blue) and after (red) the opening of the Berea College farm store in 2013. The regression line forecasts income without the farm store based on actual income from 2007 to 2012. All data presented USD inflation-adjusted to 2019.
Figure 4.
Whole-farm income before (blue) and after (red) the opening of the Berea College farm store in 2013. The regression line forecasts income without the farm store based on actual income from 2007 to 2012. All data presented USD inflation-adjusted to 2019.

Figure 5.
Percentages of total sales at the Berea College farm store accounted for by the four major categories of products: meat, produce, bakery, and ready-to-eat prepared items.
Figure 5.
Percentages of total sales at the Berea College farm store accounted for by the four major categories of products: meat, produce, bakery, and ready-to-eat prepared items.

Figure 6.
Percentages of farm store gross sales (A) discounted for students, staff, and faculty purchases and (B) attributed to customers using the USDA Supplemental Nutrition Assistance Program (SNAP).
Figure 6.
Percentages of farm store gross sales (A) discounted for students, staff, and faculty purchases and (B) attributed to customers using the USDA Supplemental Nutrition Assistance Program (SNAP).

Table 1.
Typical seasonal availability of Berea College Farm horticultural products with each ‘X’ indicating approximately one week of production.
Table 1.
Typical seasonal availability of Berea College Farm horticultural products with each ‘X’ indicating approximately one week of production.
| Produce | Jan | Feb | Mar | Apr | May | Jun | Jul | Aug | Sep | Oct | Nov | Dec |
|---|---|---|---|---|---|---|---|---|---|---|---|---|
| Apples | X | XXXX | XX | |||||||||
| Arugula | XX | XXXX | XXXX | XXXX | XXXX | X | ||||||
| Basil | XXXX | XXXX | XXXX | XXXX | ||||||||
| Beans | XXX | XXXX | XXXX | XXXX | ||||||||
| Beets | X | XXXX | ||||||||||
| Blackberries | XXX | XX | ||||||||||
| Blueberries | XXXX | XX | ||||||||||
| Broccoli | XXXX | XX | XX | |||||||||
| Cabbage | XXXX | XX | XX | |||||||||
| Carrots | XXXX | XXXX | XXXX | XXXX | XXXX | XXXX | ||||||
| Cilantro | XXXX | XXXX | ||||||||||
| Collards | XXXX | XXXX | XXXX | XXXX | ||||||||
| Cucumbers | XXXX | XXXX | XXXX | |||||||||
| Dill | XXXX | XXXX | ||||||||||
| Kale | XX | XXXX | XXXX | XXXX | XXXX | XXXX | ||||||
| Kohlrabi | XXXX | XX | XX | XXXX | ||||||||
| Lettuce, head | XXXX | XXXX | XXXX | XXXX | XXXX | X | ||||||
| Lettuce, leaf | XX | XXXX | XXXX | XXXX | XXXX | XXXX | X | |||||
| Micro-greens | XXXX | XXXX | XXXX | X | XXXX | XXXX | XXXX | |||||
| Mizuna | XX | XXXX | X | XXXX | XXXX | X | ||||||
| Mustard greens | XX | XXXX | XXXX | XXXX | XXXX | XXXX | XXXX | X | ||||
| Okra | X | XXXX | XXX | |||||||||
| Onions | XXXX | XX | ||||||||||
| Parsley | XXXX | XXXX | XXXX | XXXX | XXXX | XXXX | ||||||
| Pea shoots | XXXX | XXXX | XXXX | X | XXXX | XXXX | XXXX | |||||
| Peppers, hot | XX | XXXX | XXXX | |||||||||
| Peppers, sweet | XX | XXXX | XXXX | |||||||||
| Potatoes | XXXX | XXXX | XXXX | XXXX | XXXX | |||||||
| Potted plants | XXXX | XXXX | XXXX | XXXX | XXXX | XXXX | XXXX | XXXX | XXXX | XXXX | XXXX | XXXX |
| Radishes | XXX | X | XXX | |||||||||
| Rosemary | XXXX | XXXX | XXXX | XXXX | XXXX | XXXX | XXXX | XXXX | XXXX | XXXX | XXXX | XXXX |
| Sage | XXXX | XXXX | XXXX | XXXX | XXXX | XXXX | XXXX | |||||
| Seasonal flowers | XXXX | XXXX | XXXX | XXXX | XXXX | |||||||
| Shiitake | XXXX | XXXX | XXXX | XXXX | ||||||||
| Snap peas | XX | XX | XXX | |||||||||
| Snow peas | XX | XX | XXX | |||||||||
| Spinach | XX | XXXX | XX | XX | XXXX | XXXX | X | |||||
| Strawberries | XX | XXX | ||||||||||
| Summer squash | XXXX | XXXX | XXXX | XXXX | ||||||||
| Sweet potatoes | XXXX | XXXX | XXXX | XXXX | XXXX | XXXX | XXXX | |||||
| Swiss chard | XX | XXXX | XX | XX | XXXX | XX | ||||||
| Tatsoi | XX | XXXX | ||||||||||
| Tomatoes, cherry | XXXX | XXXX | XXXX | XXXX | XXXX | |||||||
| Tomatoes, slicing | XXXX | XXXX | XXXX | XXXX | ||||||||
| Turnips | XXXX | XXXX | XX | |||||||||
| Winter squash | XXXX | XXXX | XXXX | XXXX | XXXX | XXXX | XXXX | |||||
| Zucchini | XXXX | XXXX | XXXX | XXXX |
Table 2.
Partial budget analysis of the farm store using the projected and actual whole-farm income after the opening of the farm store and the costs of operating the farm store. The net financial result is calculated by subtracting the additional costs from the additional income. All data are presented in 2019 inflation-adjusted USD.
| Year | Projected Gross Whole Farm Income (Based on Trend, 2007–2012) | Actual Gross Whole Farm Income | Difference Between Actual and Projected Gross Whole Farm Income | Farm Store Material Costs | Farm Store Labor Costs (Wages and Benefits) | Farm Store Overhead Costs (Assumed Loan Payment) | Farm Store Total Costs | Net Change in Whole-Farm Gross Income |
|---|---|---|---|---|---|---|---|---|
| 2014 | 212,430 | 284,356 | 71,926 | 69,117 | 57,007 | 43,820 | 169,944 | −98,018 |
| 2015 | 215,178 | 351,267 | 136,089 | 173,085 | 92,606 | 43,820 | 309,511 | −173,422 |
| 2016 | 217,925 | 433,780 | 215,855 | 193,835 | 105,307 | 43,820 | 342,962 | −127,107 |
| 2017 | 220,673 | 397,289 | 176,616 | 169,382 | 106,195 | 43,820 | 319,397 | −142,781 |
| 2018 | 223,420 | 493,017 | 269,597 | 193,251 | 111,926 | 43,820 | 348,997 | −79,400 |
| 2019 | 226,168 | 591,499 | 365,331 | 245,767 | 135,362 | 43,820 | 424,949 | −59,618 |
© 2020 by the author. Licensee MDPI, Basel, Switzerland. This article is an open access article distributed under the terms and conditions of the Creative Commons Attribution (CC BY) license (http://creativecommons.org/licenses/by/4.0/).
Share and Cite
MDPI and ACS Style
Clark, S. Financial Viability of an On-Farm Processing and Retail Enterprise: A Case Study of Value-Added Agriculture in Rural Kentucky (USA). Sustainability 2020, 12, 708. https://doi.org/10.3390/su12020708
AMA Style
Clark S. Financial Viability of an On-Farm Processing and Retail Enterprise: A Case Study of Value-Added Agriculture in Rural Kentucky (USA). Sustainability. 2020; 12(2):708. https://doi.org/10.3390/su12020708
Chicago/Turabian StyleClark, Sean. 2020. "Financial Viability of an On-Farm Processing and Retail Enterprise: A Case Study of Value-Added Agriculture in Rural Kentucky (USA)" Sustainability 12, no. 2: 708. https://doi.org/10.3390/su12020708
Note that from the first issue of 2016, this journal uses article numbers instead of page numbers. See further details here.