Evaluation of the Operating Efficiency of a Hybrid Wind–Hydro Powerplant
by
 , and
, and
Francisco Briongos
1, 
Carlos A. Platero
1 ,
,
José A. Sánchez-Fernández
2,* and
Christophe Nicolet
3 1
Department of Automatic Control, Electrical and Electronic Engineering and Industrial Informatics, Universidad Politécnica de Madrid, E-28040 Madrid, Spain
2
Department of Hydraulic, Energy and Environmental Engineering, Universidad Politécnica de Madrid, E-28040 Madrid, Spain
3
Power Vision Engineering Sàrl, CH-1024 Ecublens, Switzerland
*
Author to whom correspondence should be addressed.
Sustainability 2020, 12(2), 668; https://doi.org/10.3390/su12020668
Submission received: 17 December 2019
/
Revised: 10 January 2020
/
Accepted: 14 January 2020
/
Published: 16 January 2020
(This article belongs to the Special Issue Renewable Energies for Sustainable Development)
Abstract
:This paper analyzes the operating efficiency of a hybrid wind–hydro power plant located in El Hierro Island. This plant combines a wind farm (11.48 MW) and a pumped storage power plant (11.32 MW). It was built with the aim of supplying the island demand from renewable energy instead of using existing diesel units. The paper discusses several operational strategies and proposes an efficiency metric. Using 10 min data, the operation of this power plant has been simulated. From these simulations (more than 50,000 for a year), the operating efficiency and the percentage of demand covered from renewable energy is obtained. The difference between the worst and the best strategy is a twofold increase in efficiency. Moreover, the results of the simulations are compared with the system operational history since June 2015 (when the wind–hydro power plant started operation) until 2018. These comparisons show a reasonable agreement between simulations and operational history.

1. Introduction
Since the beginning of electrification, fossil fuel burning has been the main source of primary energy on which electricity generation is based [1]. However, there is growing evidence that fossil fuel burning for electricity generation is one of the main causes of global warming because of greenhouse gas emissions [2]. For this reason, renewable energy resources have had an important development. Among these renewable energy resources, wind energy has the largest installed capacity in the world [3]. Notwithstanding, wind speed variations and its prediction difficulties create some problems in power system operation. Therefore, when wind penetration increases, power system operators have to take measures to maintain system integrity [4] or consider complementary renewable energy sources [5].
Small islands are of particular interest because, on them, fossil fuel costs are higher [6]. Therefore, renewable energies can be cost competitive. In fact, many islands are installing some renewable energy supplies [7]. To this aim, the support of the local community is an important contribution to success, as the case of Samsø has proven [8]. However, island power systems usually lack the support of a strong interconnected system. So, maintaining system integrity is a harder problem on islands [9]. Notwithstanding, there are several examples of island power systems that have largely increased their share of renewables. To this aim, one successful approach is combining several renewable energy sources [10]. Another option is adding an energy storage system [11]. Furthermore, there are islands that combine both possibilities, such as the Caribbean island of St. Eustatius [12]. In addition, the possible contribution of electric vehicles smart charging to solar and wind integration has been proposed in The Barbados [13].
One of those islands is El Hierro, an island located in the Canary archipelago (Spain). UNESCO declared it a biosphere reserve in 2000. As such, it aims to become entirely free from carbon dioxide emissions [14]. To fulfill this aim, a combined wind–hydro power plant was built. This plant started operation in 2014 but was not fully operational until 2015 [15].
According to the Merriam-Webster dictionary, efficiency is “the ratio of the useful energy delivered by a dynamic system to the energy supplied to it” [16]. Therefore, each energy conversion technology has its own efficiency. However, the evaluation of energy efficiency in power systems has been based on economic metrics [17]. In [18], Maheshwari and Ramakumar described a procedure to design an optimal size microgrid that supplies energy to a rural area, but do not analyze nor define its operating efficiency. In [19], several procedures to calculate the optimum number, size and location of photovoltaic power plants is applied to two different test networks. The optimality condition tries to minimize power line losses and harmonic distortion. So, a technological metric for evaluating power systems efficiency is needed. This paper intends to do so, using an isolated power system that has a wind–hydro hybrid power plant.
This paper is organized as follows: Section 2 describes the El Hierro power system. Section 3 analyzes the operational strategies that were considered. Section 4 presents the simulation model of the power system. Section 5 presents the results of the simulations done and discuss the results comparing them with the operating experience. Finally, Section 6 summarizes the conclusions.
2. Power System Description
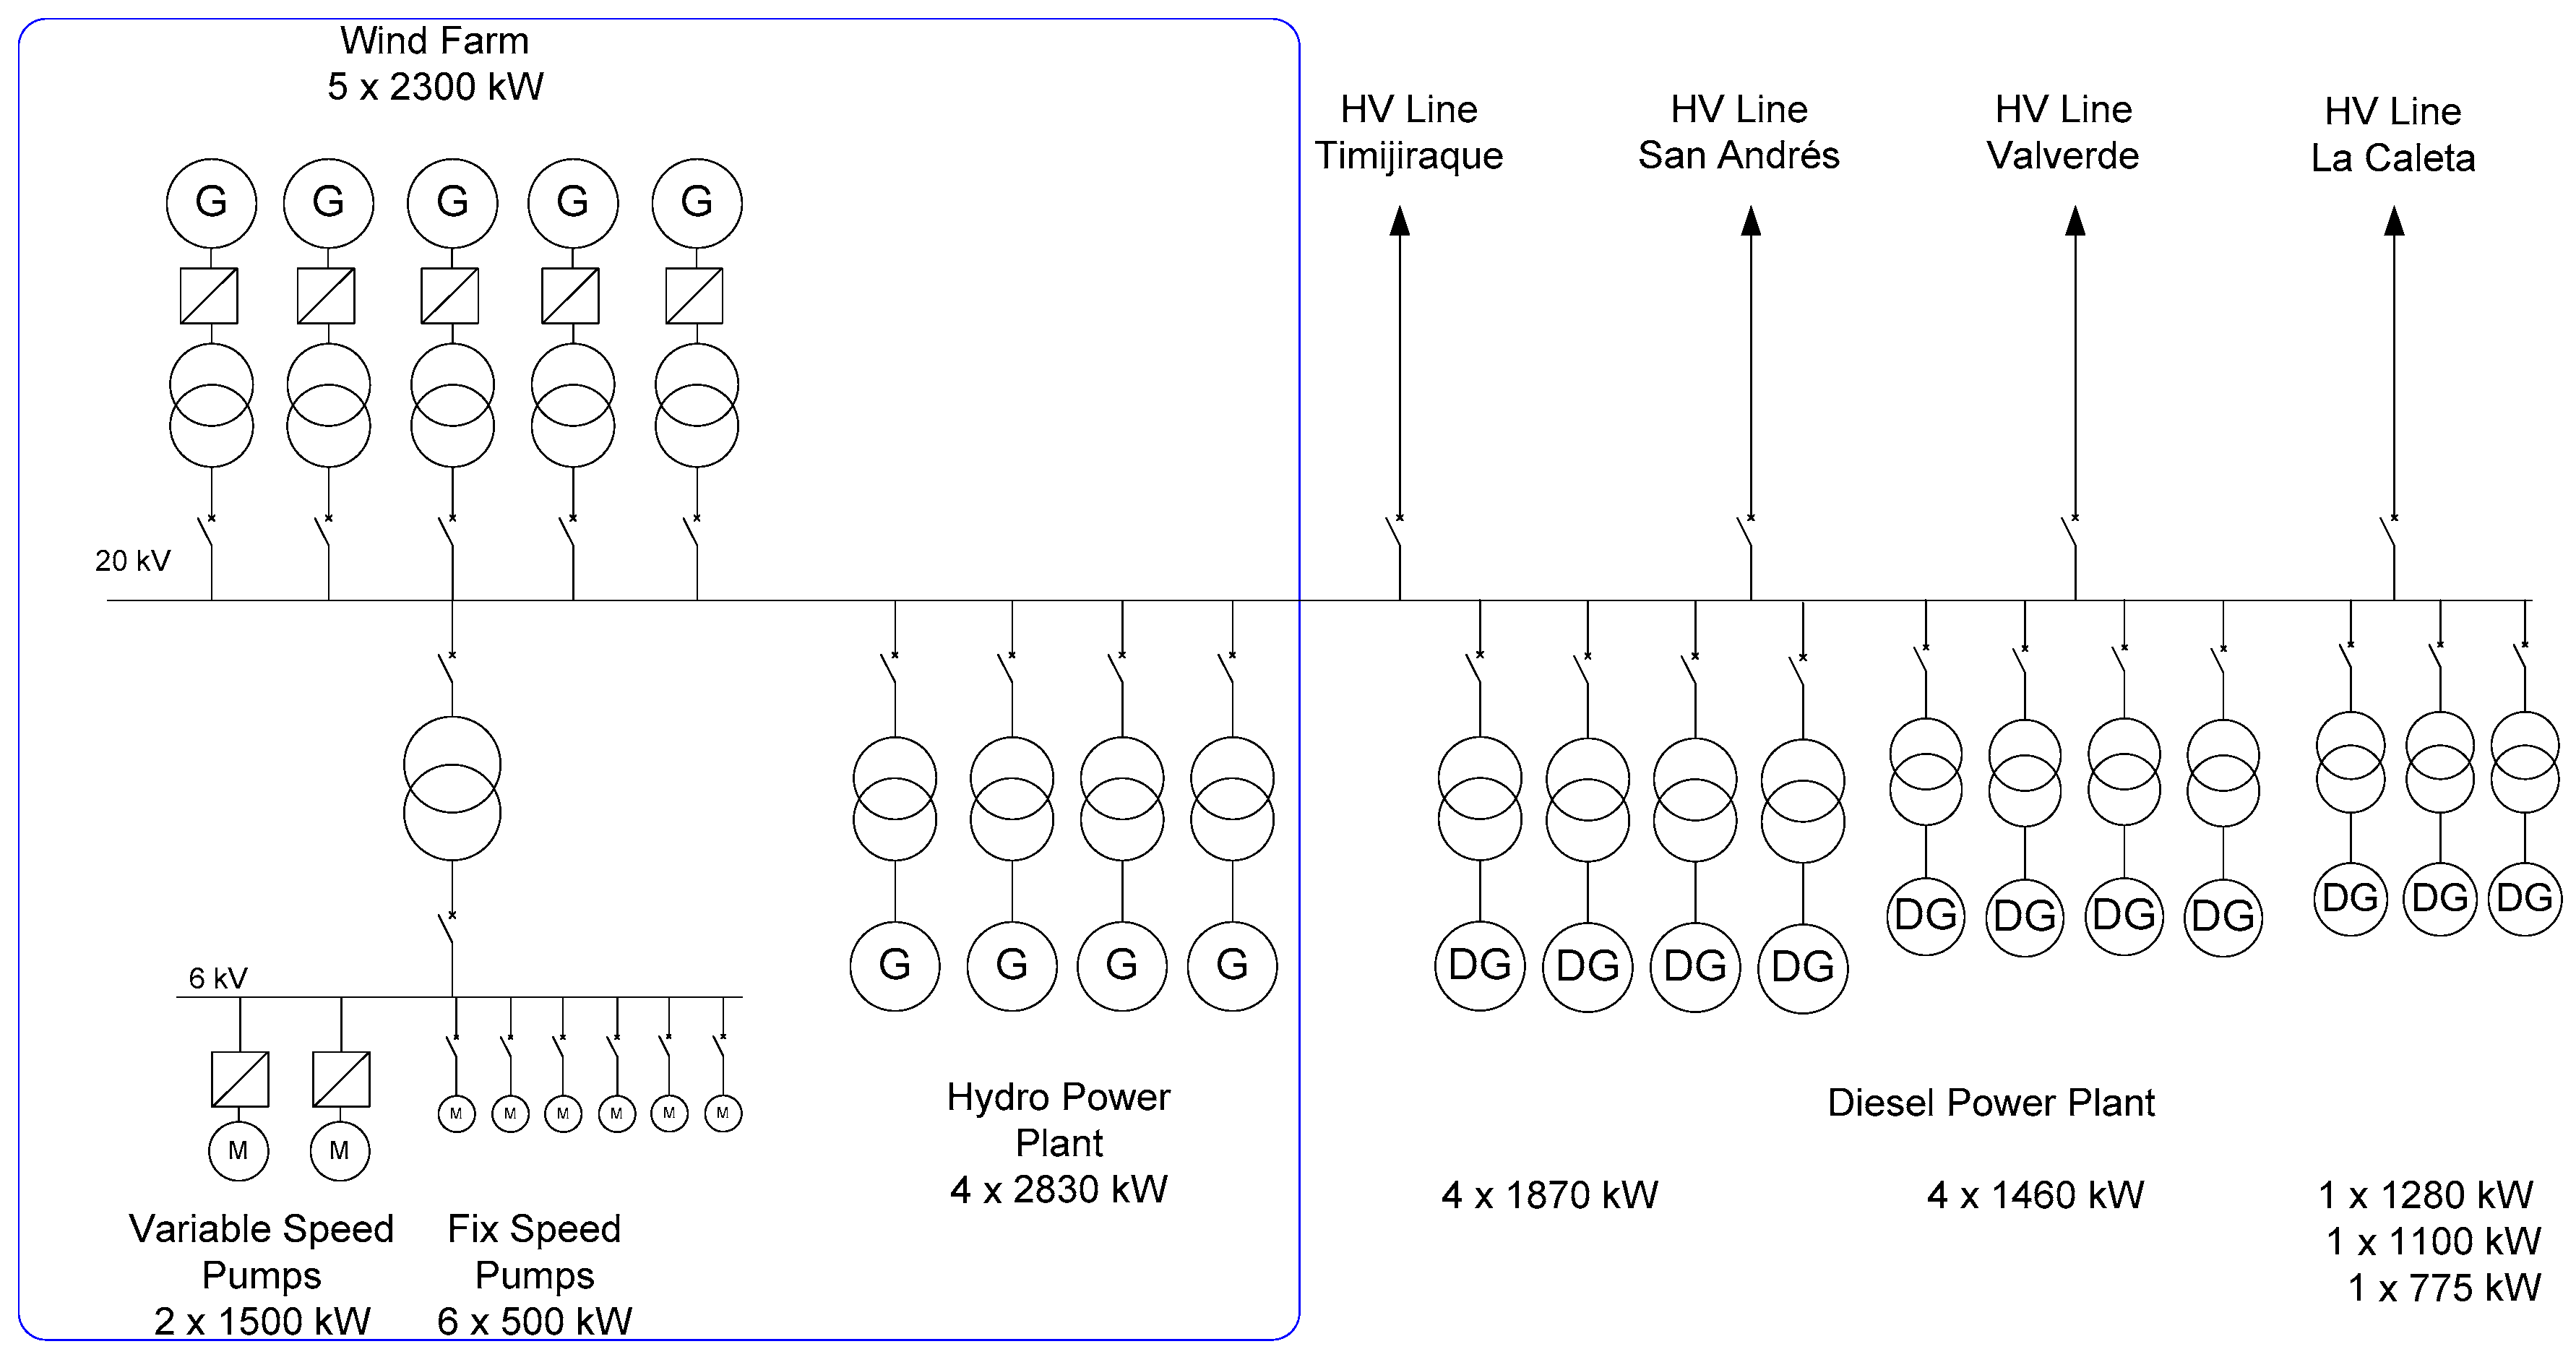
The power system considered for the case study is located on El Hierro Island. This Island is placed in the Canary Islands archipelago, Spain. Its electric power supply was based on diesel engine driven generators, which is a common solution in small islands. There are 10 diesel engines, with rated power from 775 kW to 1870 kW, installed in several phases. The generators are connected to the main busbar through transformers. Electric energy is supplied to the island through four 20 kV power lines [20]. Figure 1 shows a simplified one-line diagram of the El Hierro power system.
El Hierro Island’s orography makes it possible to build an upper and a lower reservoir at a reasonable cost and with a gross height difference larger than 700 m. On the other hand, this island has high wind during long periods. After several studies discussing using fresh or salt water for the hydro power plant, in 2015, a wind farm combined with a pumped storage power plant started commercial operation (using fresh water).
The wind farm comprises five Enercon E-70 wind turbines connected to the 20 kV grid, through separate transformers. The pumped storage power plant has two separate facilities, a hydropower plant and a pumping station. This arrangement is known as 4-machine-type [21]. The Appendix A provides some tables with detailed data on this wind–hydro power plant.
The hydro power plant comprises four Pelton turbines (Table A1), driving synchronous generators (Table A2) with a rated power of 2830 kW, connected to the grid by four transformers (Table A3). The pumping station has eight centrifugal multistage pumps driven by induction motors. There are two variable speed pumps of 1500 kW (Table A6) and six fixed speed pumps of 500 kW (Table A9) [20].
3. Operating efficiency and operational strategies
The efficiency of a system is the ratio of the energy obtained and the energy used. In the case of a power plant is the ratio of energy generated and primary energy used.
The traditional definition of efficiency in case of windmills is the ratio of the wind power converted into electric power and the available wind power. The average efficiency of a windmill is between 32%–43%.
3.1. Operating Efficiency
However, in case of the operating efficiency, the definition is slightly different. It is the ratio between the generated energy and the maximum theoretical electric energy available using the best operational strategy.
In the case of a wind farm, the operating efficiency is the relationship of the produced energy (EWind Produced) and the maximum possible energy that can be generated in particular wind conditions (EWind∞). The maximum possible energy corresponds to the operation of the windmills at maximum power mode; so, the pitch should be regulated to get the maximum energy at any wind speed condition and connected to an infinite power grid.
In order to get a 100% operating efficiency, the produced energy (EWind Produced) should be the maximum possible energy (EWind∞). This is only possible to reach in a large power system, where the power system is able to absorb all the produced energy. In the case of a hybrid wind–hydro power plant installed in a small power system, depending on consumers demand and wind speed, the hydro power plant should store in some periods and generate in others. Therefore, the maximum possible energy cannot always be put on line. Both process, energy storage (pumping mode) and the posterior hydraulic energy generation (turbine mode), have losses. The operating efficiency is defined as the direct wind energy (EWind Grid) put on line plus the hydro energy divided by the maximum energy that the windfarm would have produced in a large power system at maximum power mode (EWind∞).
The operational strategy of the power system has a large influence on its efficiency. In order to analyze this efficiency, all possible strategies should be considered. They have to take into account the non-dispatchable nature of wind energy. Therefore, these strategies are defined by how they manage wind power generation. In what follows, these operational strategies are discussed.
3.2. Isolated Wind
One of the possible operational strategies of this power system consists of splitting the 20 kV bus bar in two. One bar connects the wind farm and the pumping station. The other bar connects the remaining power system.
All the electric energy produced by the wind farm feeds the pumps through the first bus. Through the other bus, the conventional hydro power plant—in combination with the Diesel power plant—feeds the consumers. This is a well-known procedure; the operation is very safe, as the consumers are not exposed to wind power fluctuations. Another important advantage is that the frequency regulation in the windfarm and pumps 20 kV busbar is not critical, as the pumps have no stringent frequency requirements.
The biggest drawback of this operational strategy is the efficiency. This operation mode has a low efficiency, as all renewable energy has been previously pumped and turbined. From the power system point of view, this case is equivalent to a 0% wind power penetration. As wind generators are not electrically connected to the power system, there is no limitation in the wind power. For the above reasons, the operating efficiency of this strategy is around 40%.
3.3. Restricted Wind Power
As wind energy is not fully controllable, the insertion of this type of energy in a small autonomous power system is not an easy task. Close attention should be paid to frequency regulation and wind gusts. A safe strategy is limiting the power injected by the wind farm. In this way, it is possible to get experience of the hybrid wind–hydro power plant operation and, afterwards, slowly increase this limit. When this limit is applied, the wind turbines operate at constant power and, consequently, some wind energy is not harvested.
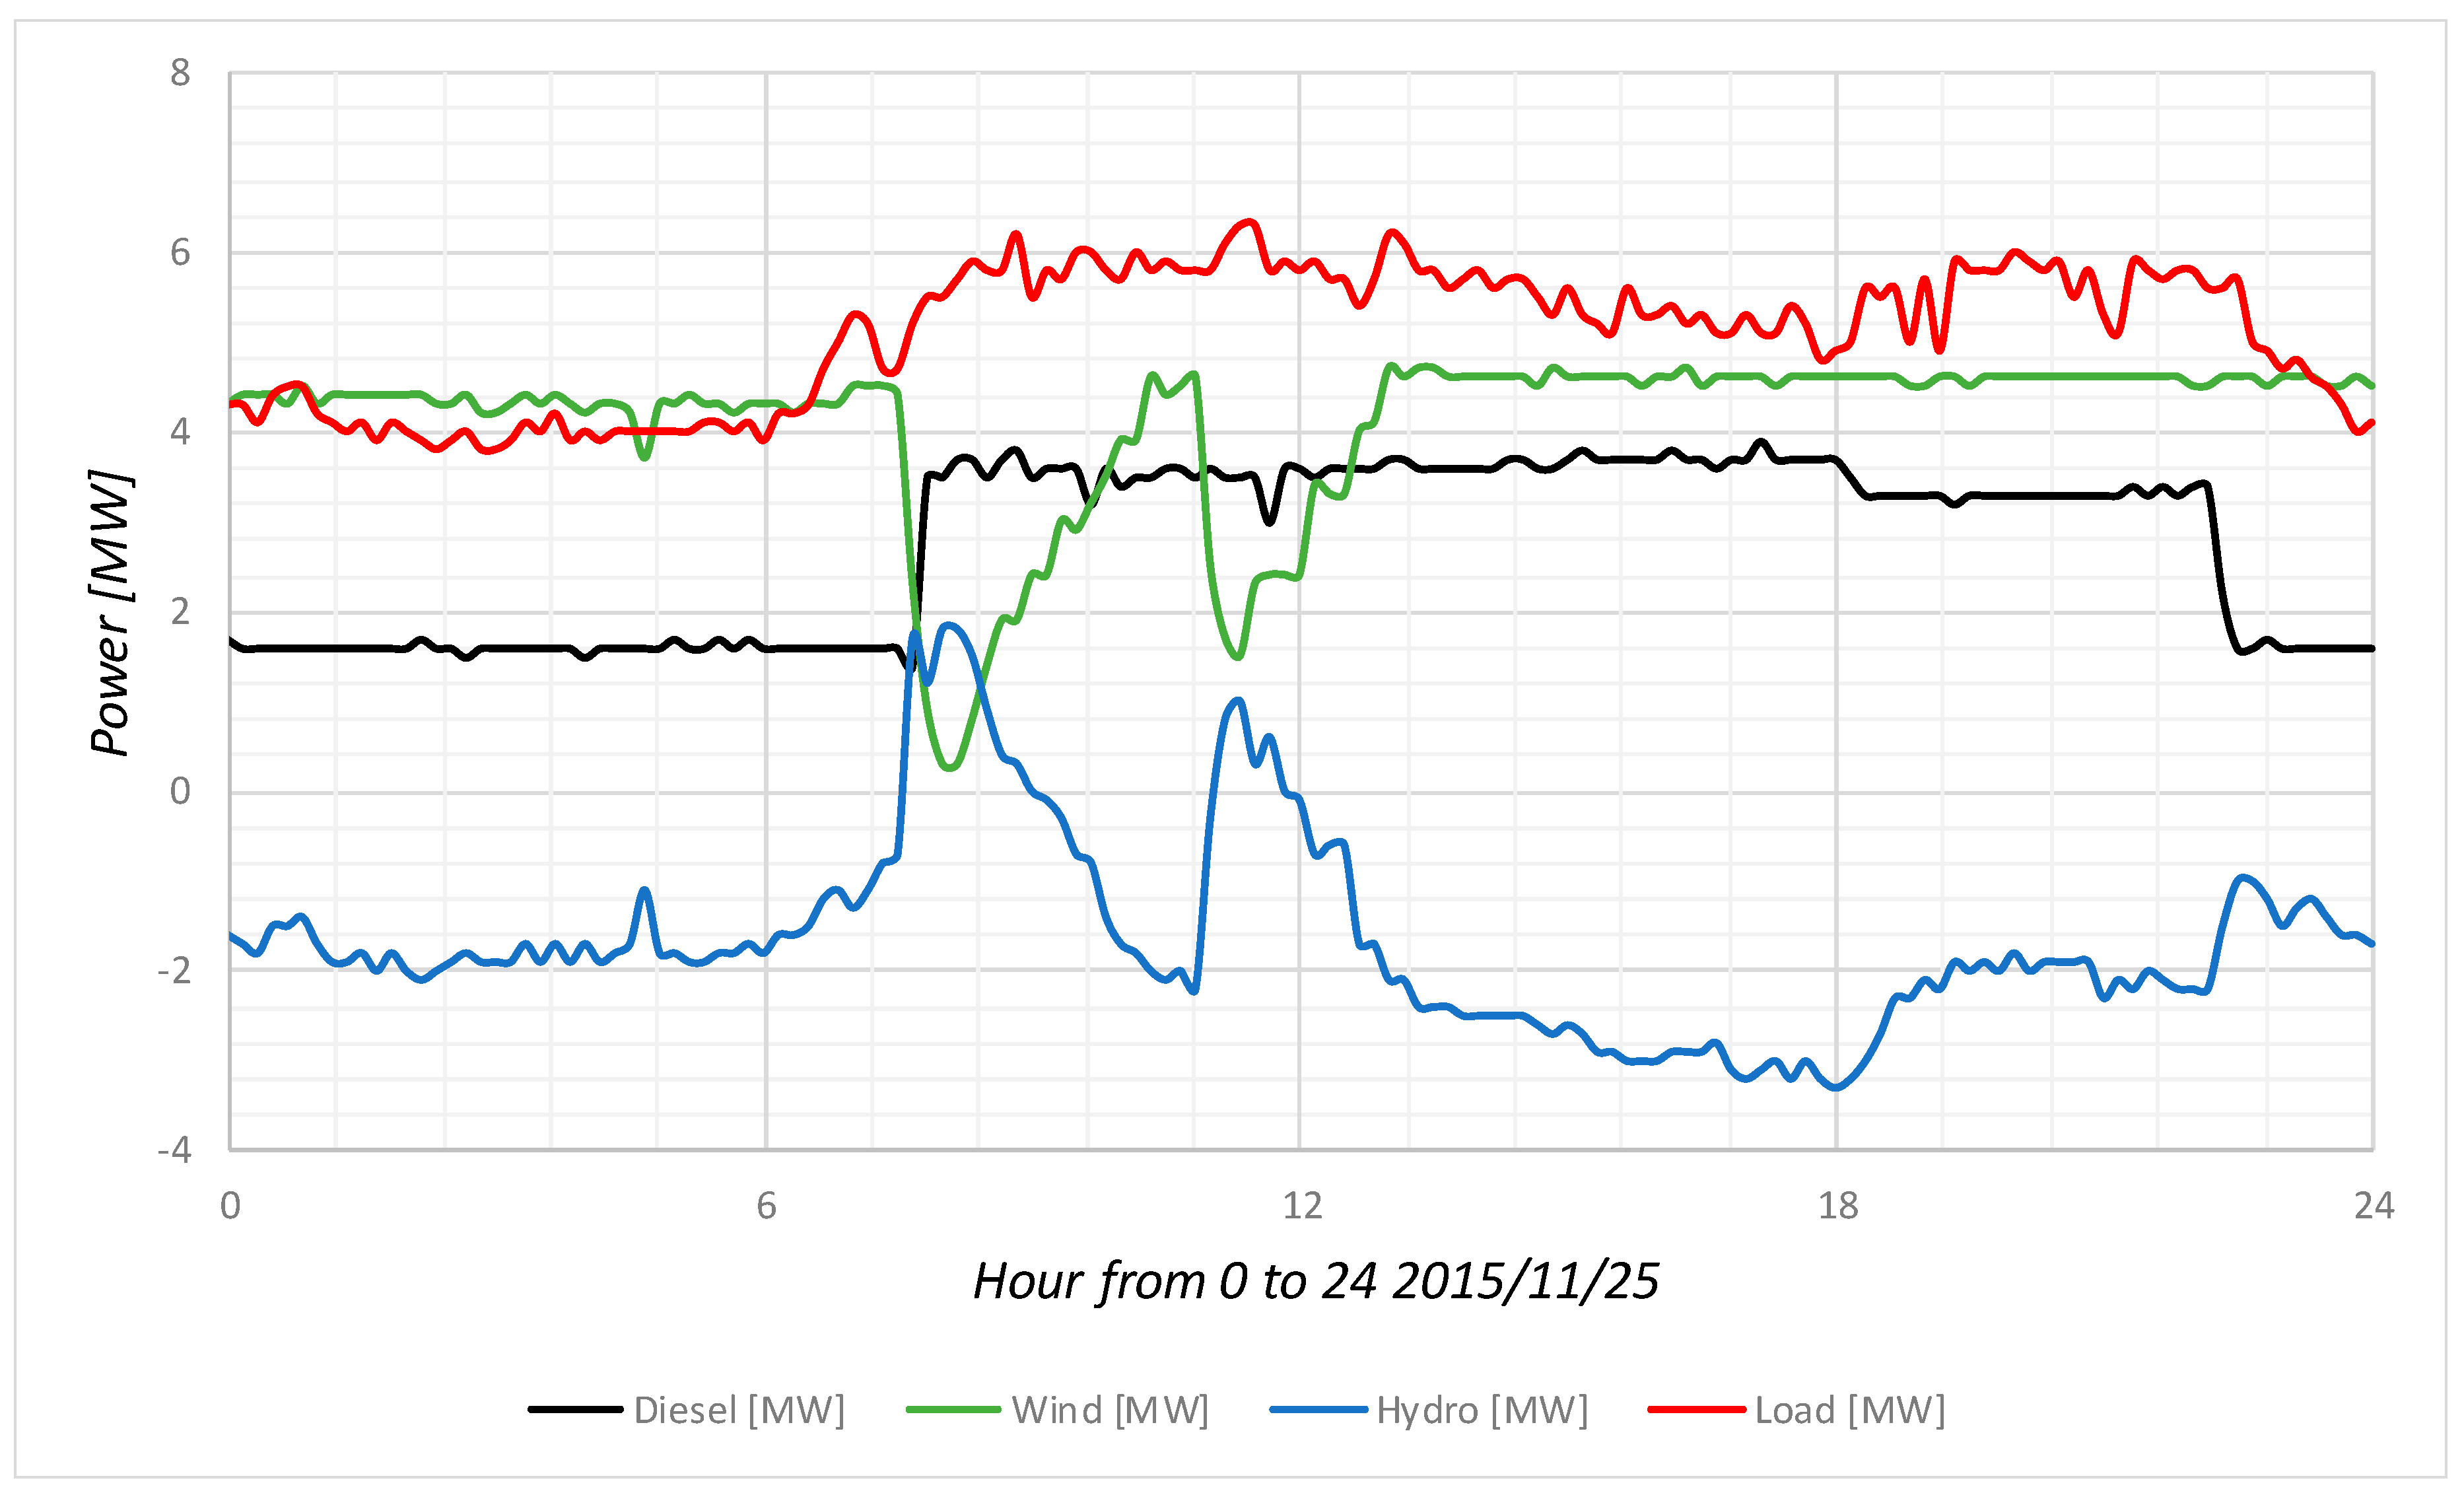
This was the first strategy followed by El Hierro wind–hydro power plant when its operation started. Figure 2 shows wind generation limited to 4.4 MW.
3.4. Restricted Wind Penetration
One other safety-minded strategy is limiting the percentage of system demand covered directly by the wind farm. In this way, not all the energy demanded comes from the wind farm. In case of a sudden wind change or a wind generator trip, there are some backup generators in the power system than can supply the missed energy. However, using this strategy, sometimes there is wind energy that is failed to be harvested.
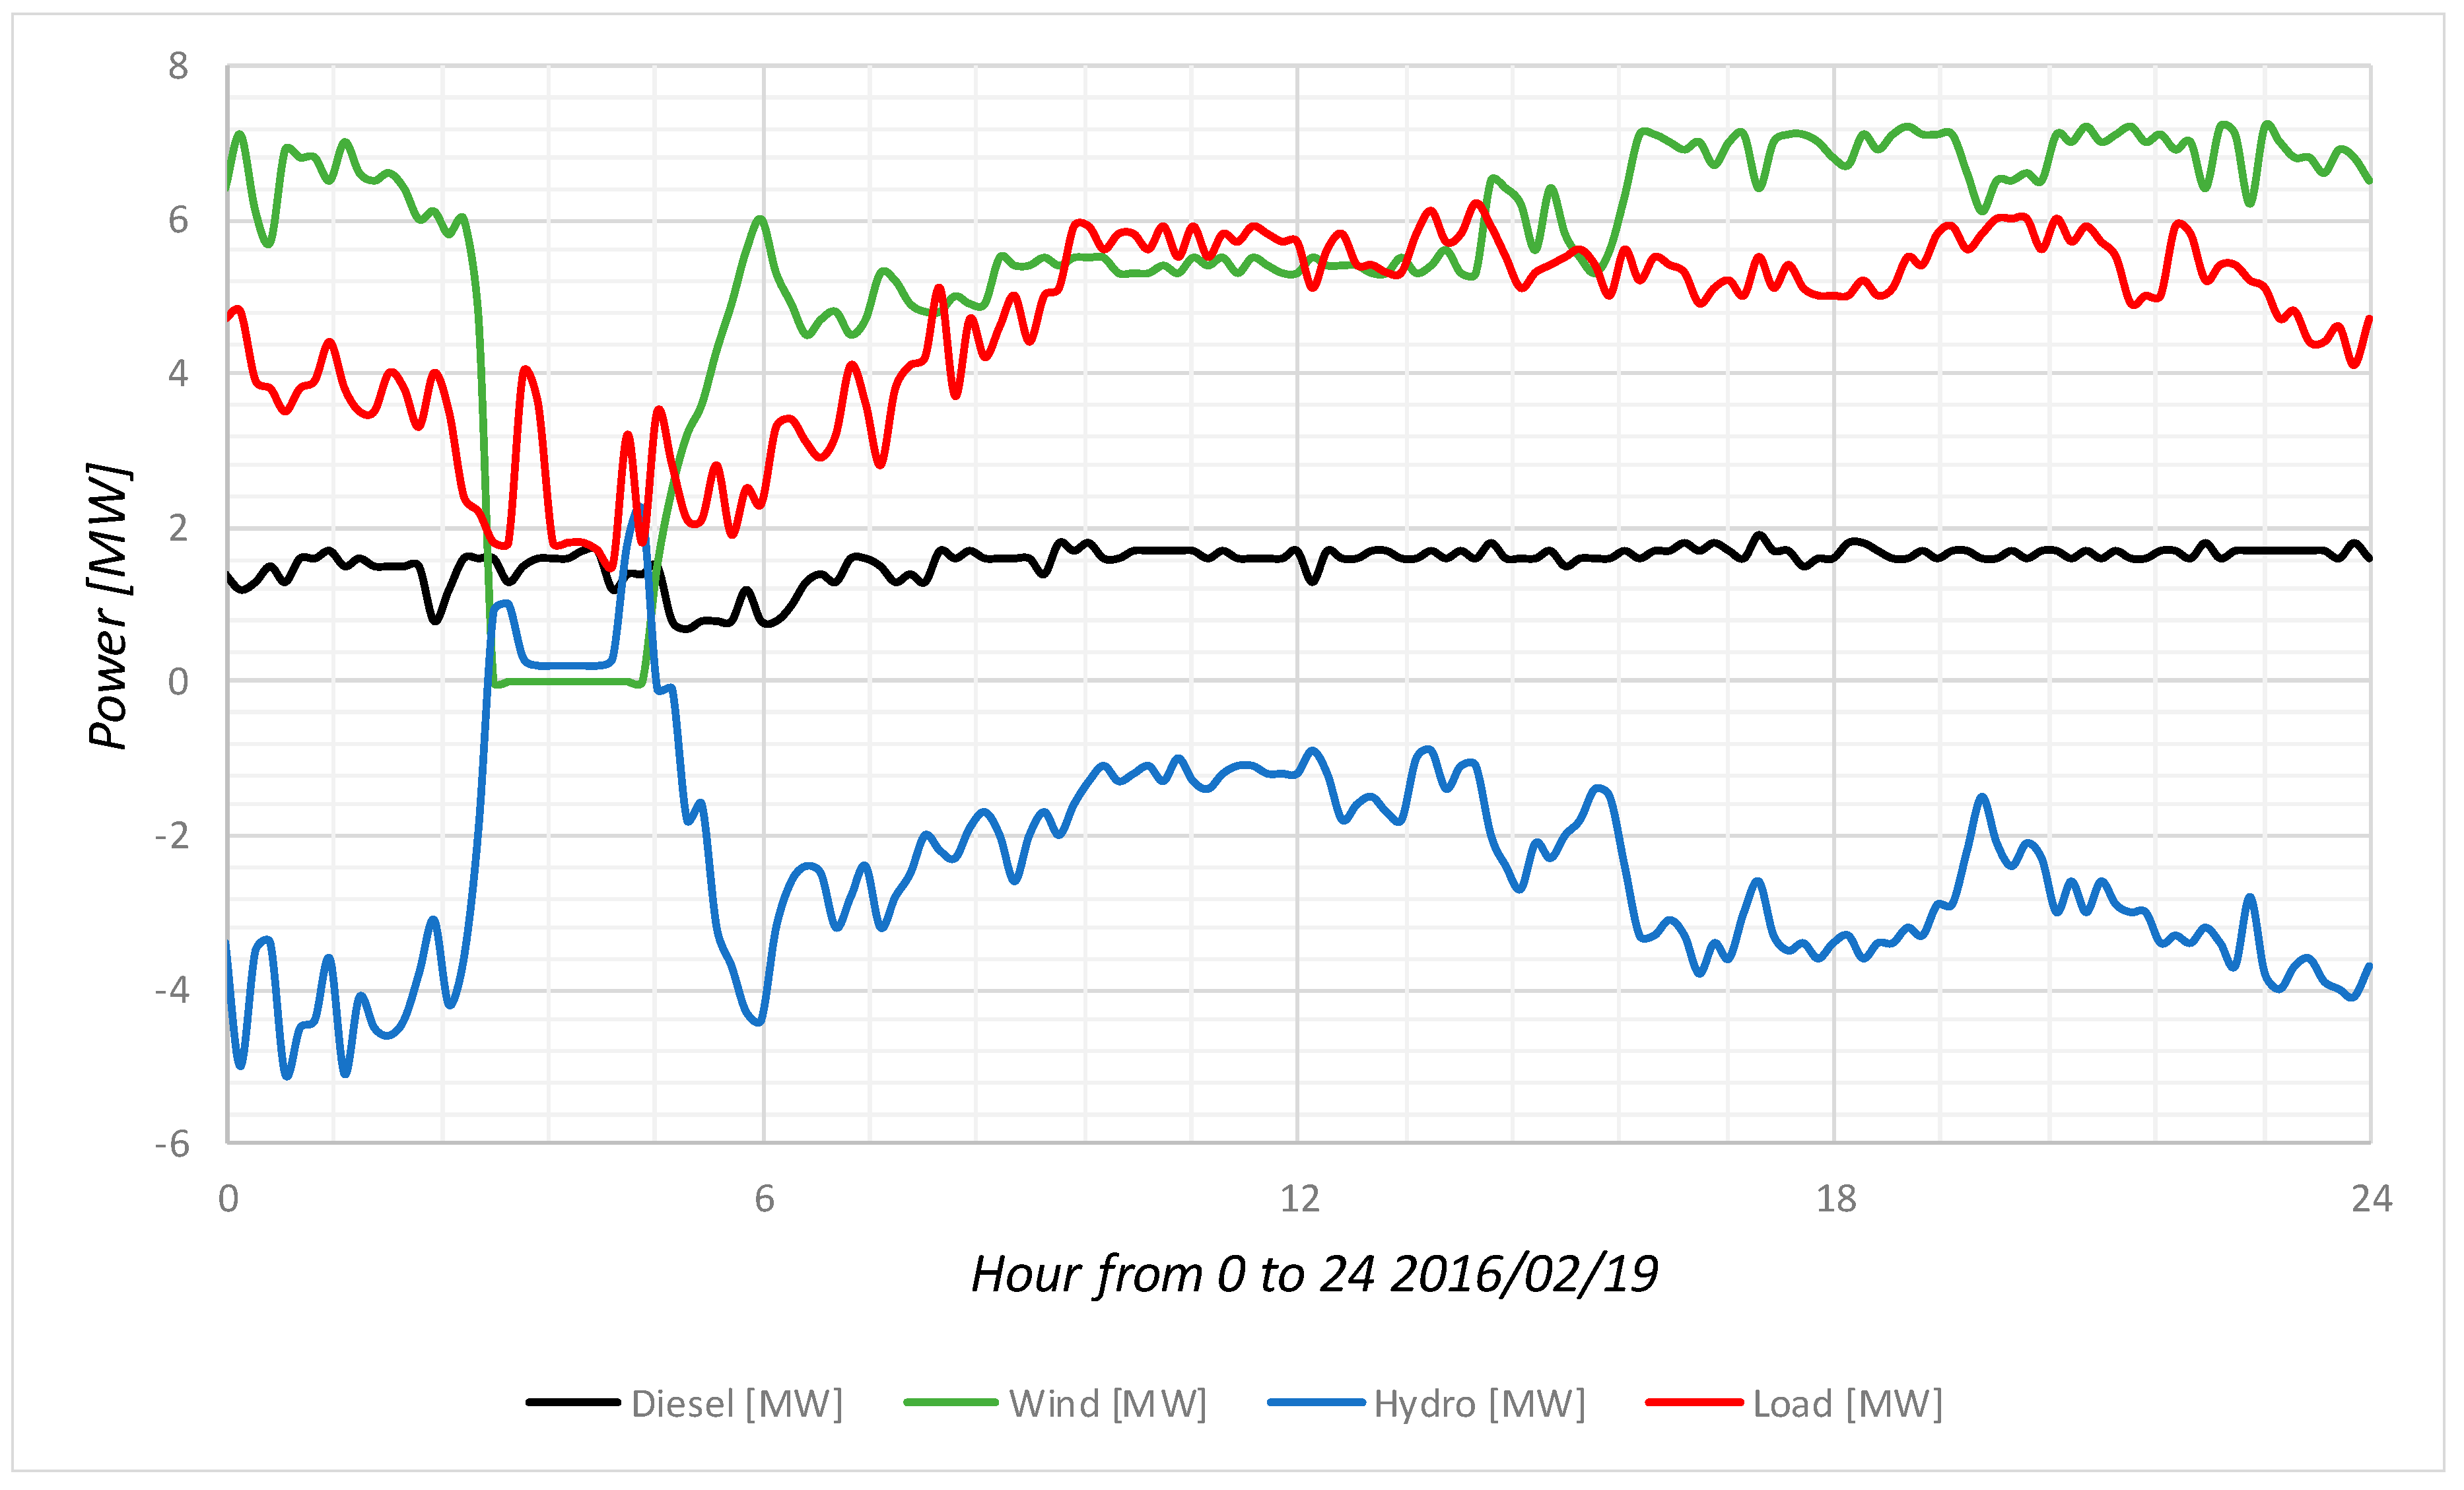
This was the second strategy used by El Hierro wind–hydro power plant. Figure 3 shows wind penetration limited to 70% and wind power limited to 7.2 MW.
3.5. Non-Restricted Wind
On this strategy, wind generators operate as if they were connected to an infinite bus. Therefore, they extract maximum power from the wind, with no limits apart from their own safety. This is only possible if the power system can absorb it. To this aim, the remaining parts of the power plant should adapt their point of operation accordingly. This means increasing or decreasing, in a fast way, the turbines generated, or the pumps demanded, power.
From an efficiency point of view, this is the best strategy. However, integrating all this wind power in El Hierro is a complex problem. The power system should be able to absorb the energy from the wind farm. In case of a wind generator trip, the remaining generators should modify fast enough their generation to maintain frequency. Additionally, in case of wind generation larger than the consumers load, the pumping station should consume the exceeding power. In this way, the frequency could be maintained.
Therefore, there are two different problems in this strategy. The first one is increasing or decreasing, in a fast way, the non-wind generated power in cases of wind generation decreasing below the load [22,23]. The second is increasing or decreasing, also in a fast way, the pumping power demanded [24].
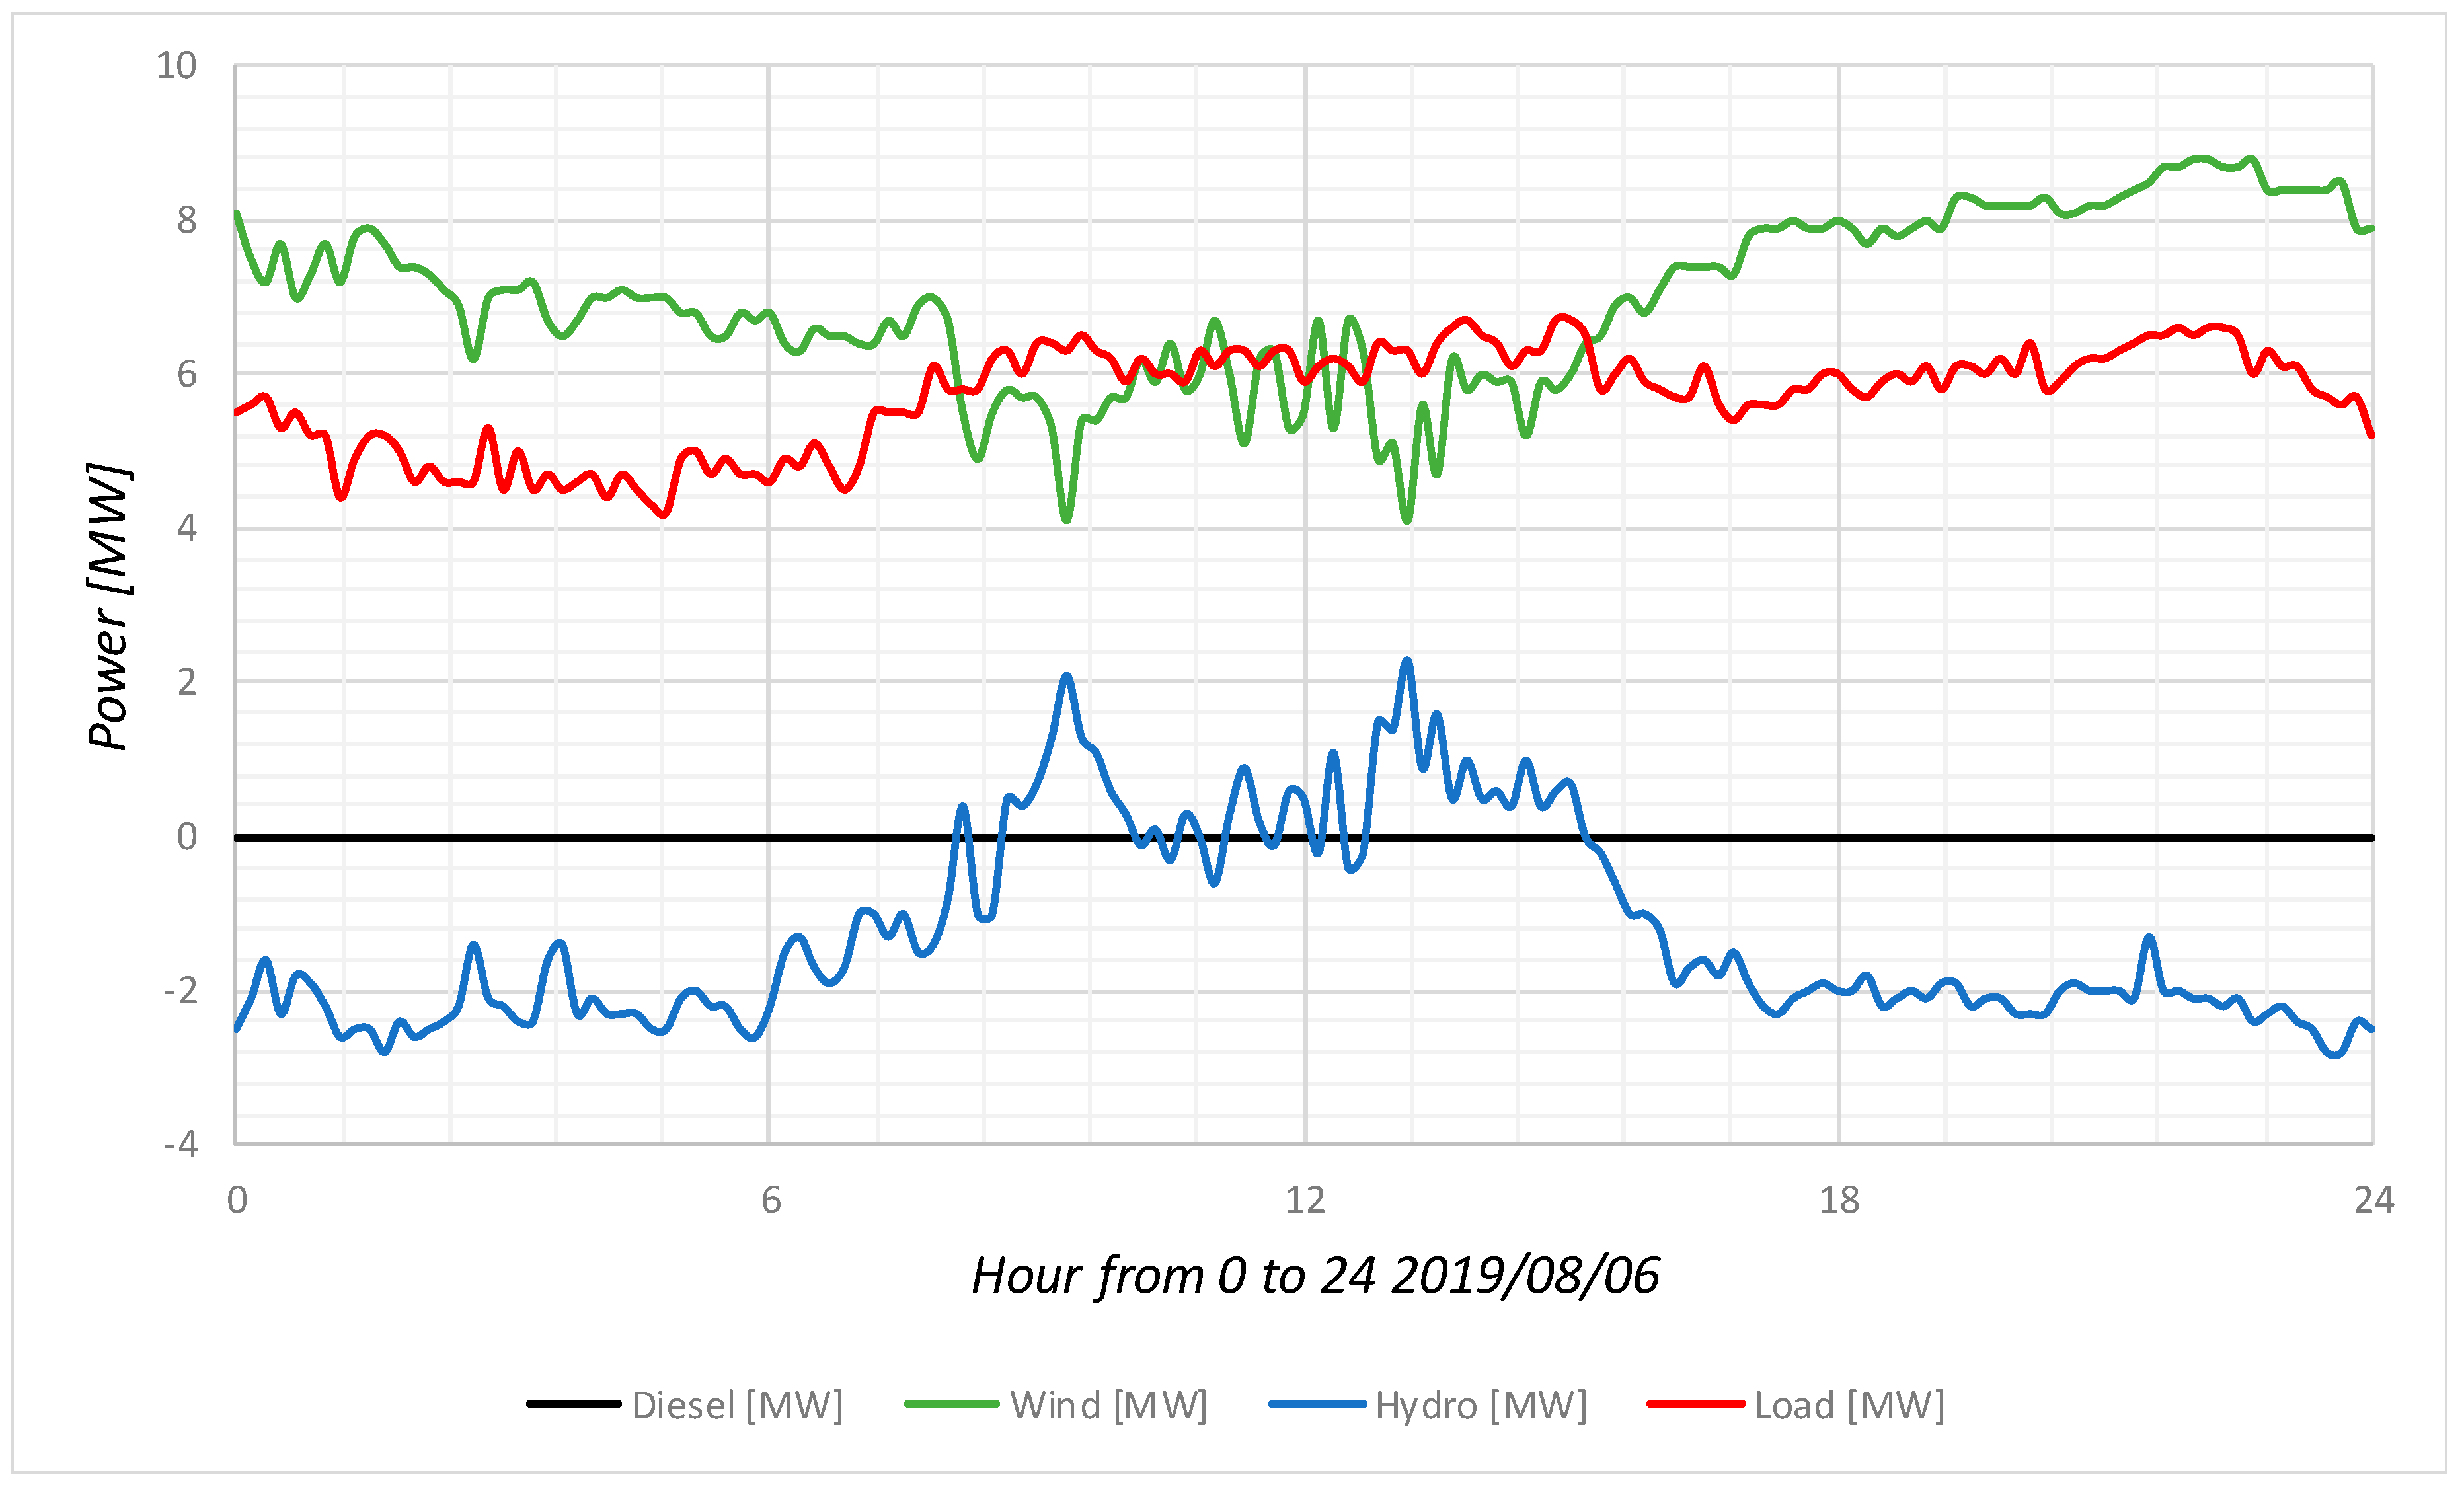
As can be seen in Figure 4, this operational strategy is used nowadays in El Hierro wind–hydro power plant.
4. Simulation Model
The power system has been modelled in MS Excel using Visual Basic for Applications (VBA). The models use data measured every 10 min (wind speed and power system load).
4.1. General Power System Model
In order to analyze how different operational strategies affect the power system, a simulation model has been developed. This model takes into account system restrictions and uses actual wind and load data to obtain the percentage of load covered through renewable energy.
To this aim, all machines of the hybrid wind–hydro powerplant have been modeled. So, the performance of each machine for a given power level can be obtained. Thus, knowing this power for each machine, the overall performance of the system can be calculated.
Each machine will operate at a power level determined by the load share assigned to each generation technology. As the preferred energy source is the wind farm, determining its power output is the first step. Therefore, considering the power available to the wind farm, the hydraulic storage, the diesel power plant and the consumers load, the contribution of each technology can be determined every ten minutes. Adding each of these contributions over a year, the performance of the hybrid wind–hydro power plant and the percentage of renewable energy used in this period can be determined.
When making the power dispatch, first wind farm-available power is compared with load demand. Then, hydraulic storage is checked. Finally, if the load cannot be supplied by wind or hydro, then diesel generators are assigned. As wind and load data are available every ten minutes, this process allows us to evaluate the power assigned to each technology and the variation in hydraulic stored energy every ten minutes.
Power Assigning Rules
Every 10-min period, the power is assigned according to the following steps:
- 1)
- First, curtailments to wind power are checked and, if active, only the allowed power is considered.
- 2)
- Then, wind penetration limit is checked (percentage of system demand covered by the wind farm). According to this limit, wind power sent directly to the grid is established.
- 3)
- After these checks, if there is a surplus of wind power, pumping conditions will be evaluated and in case of missing power, turbine conditions will be evaluated.
- 3a)
- If wind power is larger than load demand, pumping conditions are evaluated:
- Is there enough water in the lower reservoir?
- Is the surplus of wind power lower than the maximum power of the installed pumps?
If there is not enough water in the lower reservoir, pumping will not be carried out and the power supplied by the wind farm will be limited. On the other hand, if the wind farm power surplus is higher than maximum power of the pumps, wind power will be limited to the sum of consumer demand plus the maximum power of the pumps. - 3b)
- If the wind power sent to the grid is not enough to cover consumers demand turbine conditions are evaluated. When the water level of the upper reservoir is not high enough, the turbines will not be activated. So, the diesel power plant will be activated to cover the demand. Additionally, if the wind power plus the turbines power were not enough to cover consumers demand, the diesel plant would also be activated to completely cover the demand.
4.2. Wind Farm Model
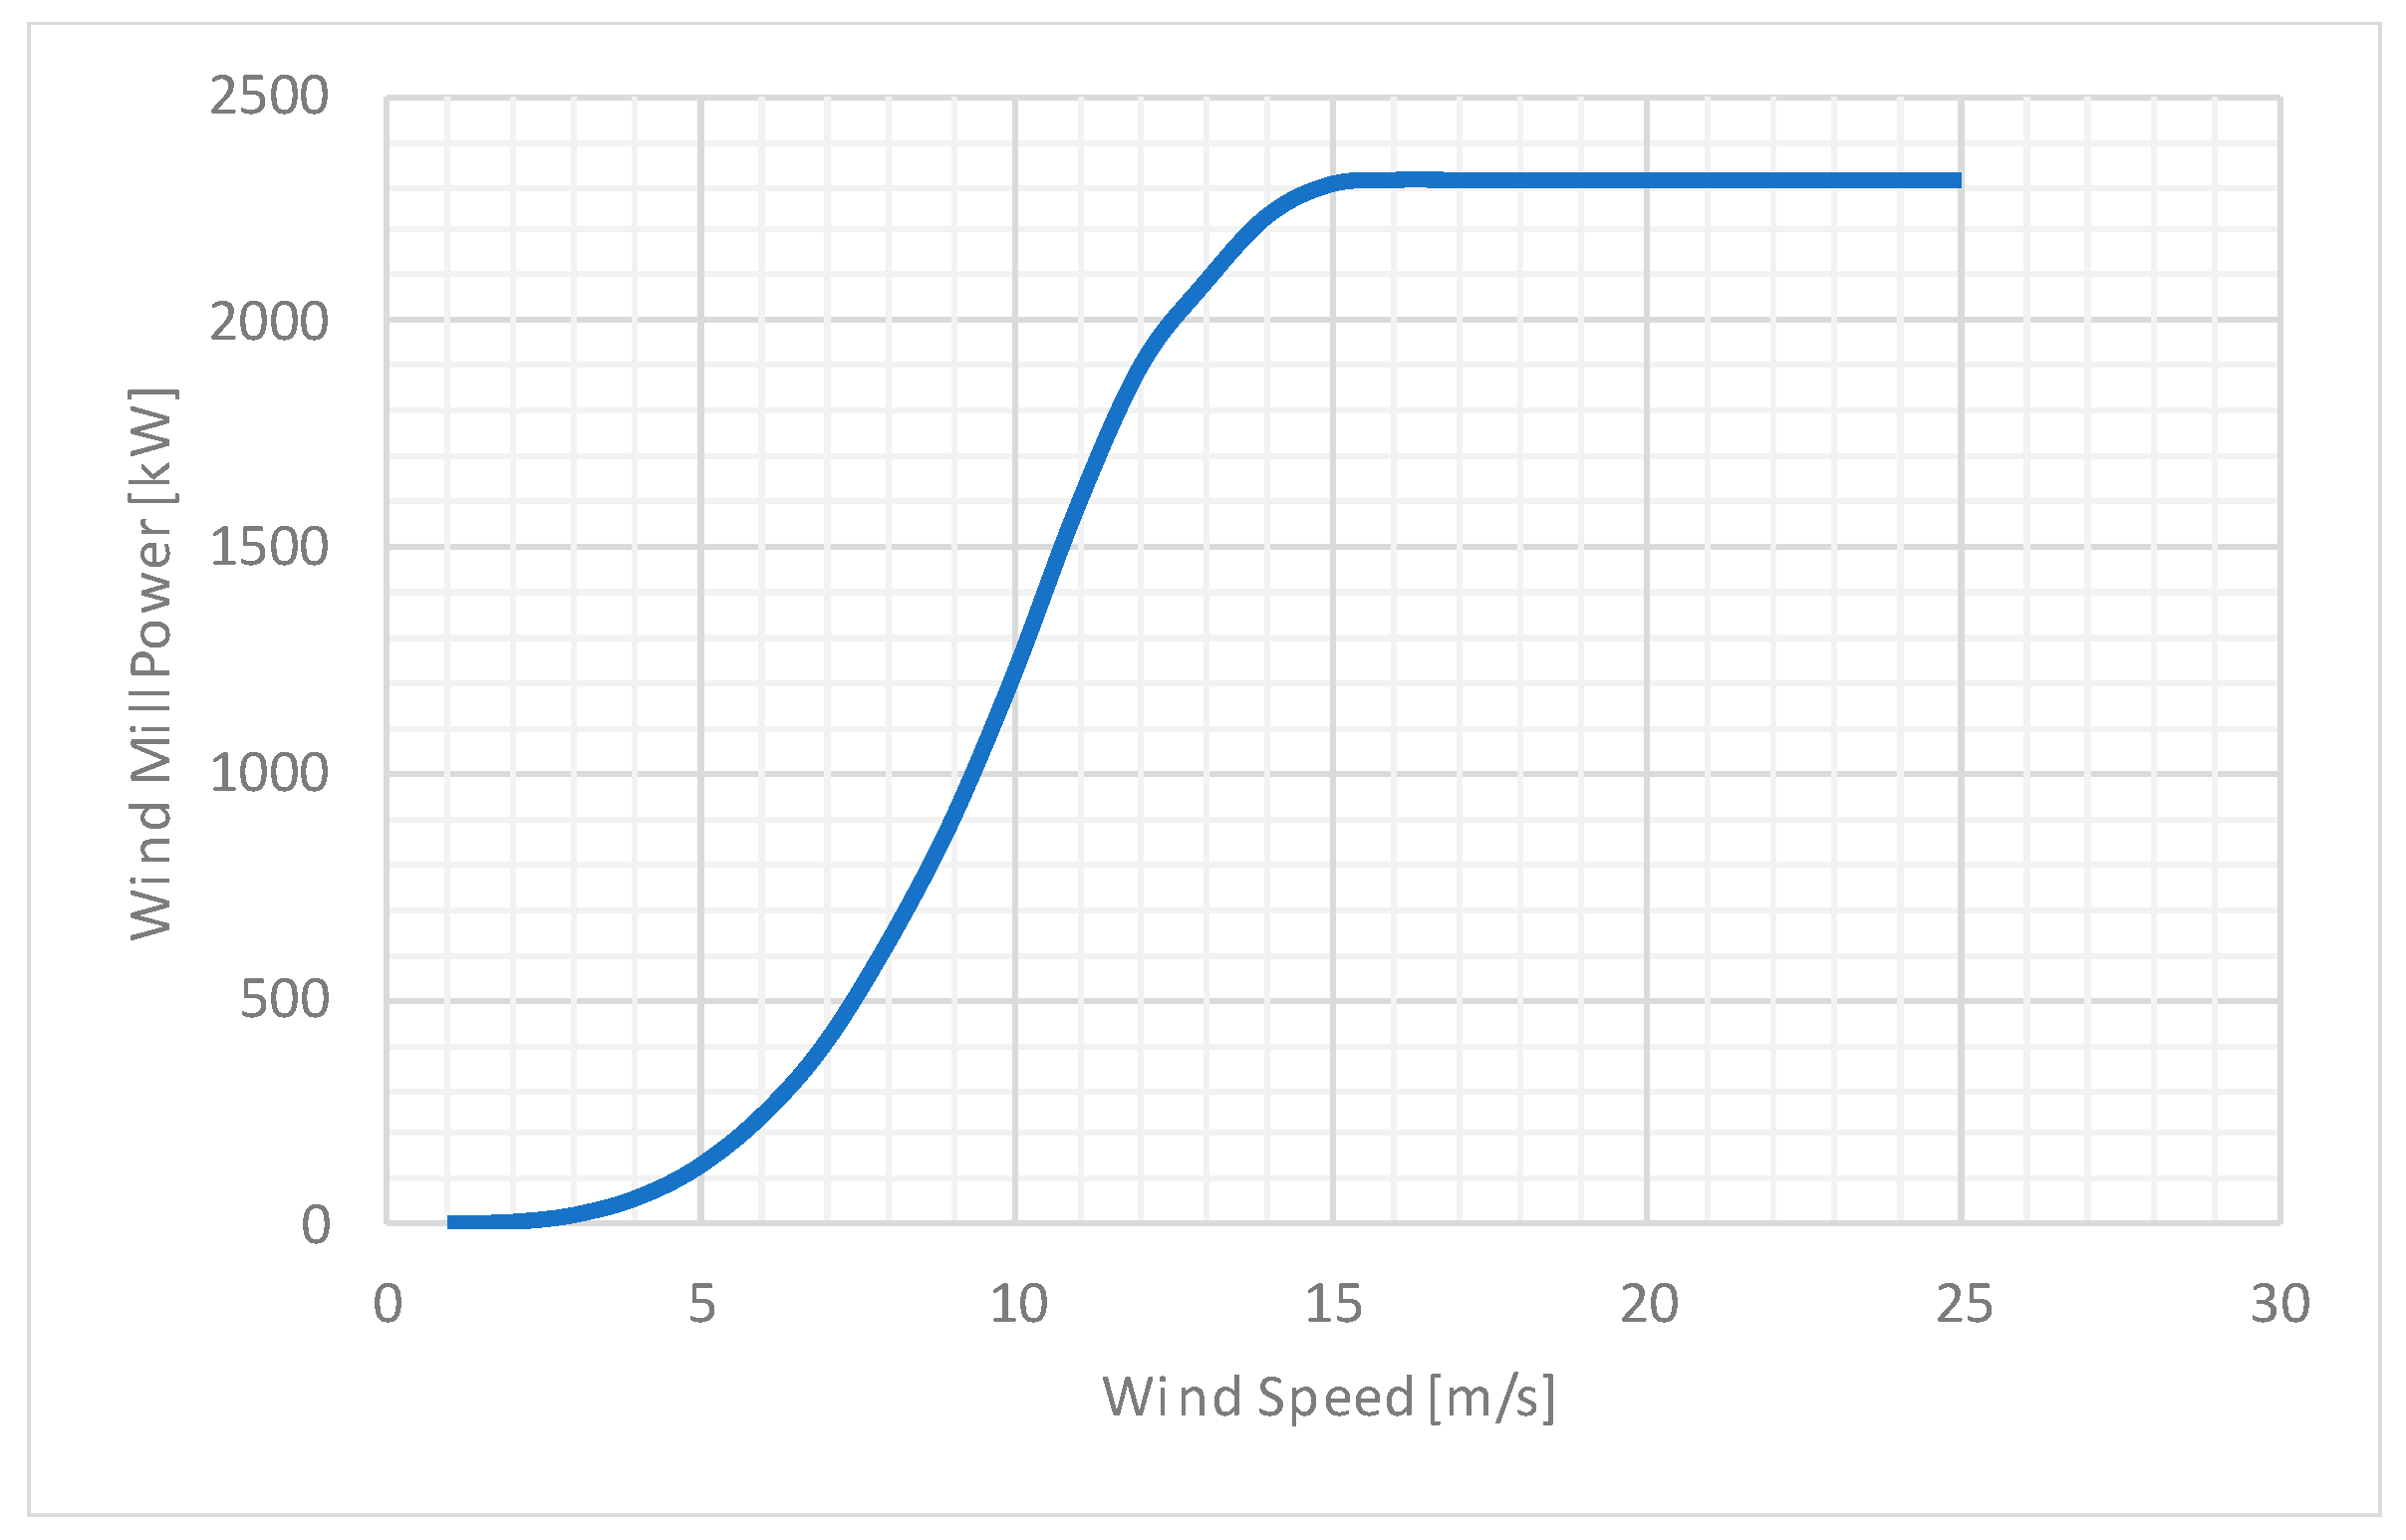
For modeling the wind farm in MS Excel, the manufacturer’s curve that relates wind speed to the power generated by the wind turbine has been taken as a reference.
Since the known parameter is the wind speed every 10 min, using the manufacturer’s curve (shown in Figure 5), the power delivered by each wind turbine is calculated. To make these calculations simpler, a polinomic aproximation of this curve (for wind speeds between 0 and 16 m/s) is used. For wind speeds beteeen 16 and 25 m/s the result is rated power and for wind speeds greater than 25 m/s, zero power is output. These aproximations are programmed in Microsoft Visual Basic for Applications (VBA)
Assuming that all wind turbines in the park receive the same wind speed, the total power produced by the wind farm is obtained multiplying the power generated by one turbine by the number of wind turbines installed in the farm.
4.3. Hydropower Plant Model
A similar aproach has been used for making both the turbining and pumping model. The starting data are the power needed and the storage state. From them and the performance of each machine involved, the power generated/consumed by the pumped storage power plant every 10 min can be obtained.
4.3.1. Pelton Turbines Model
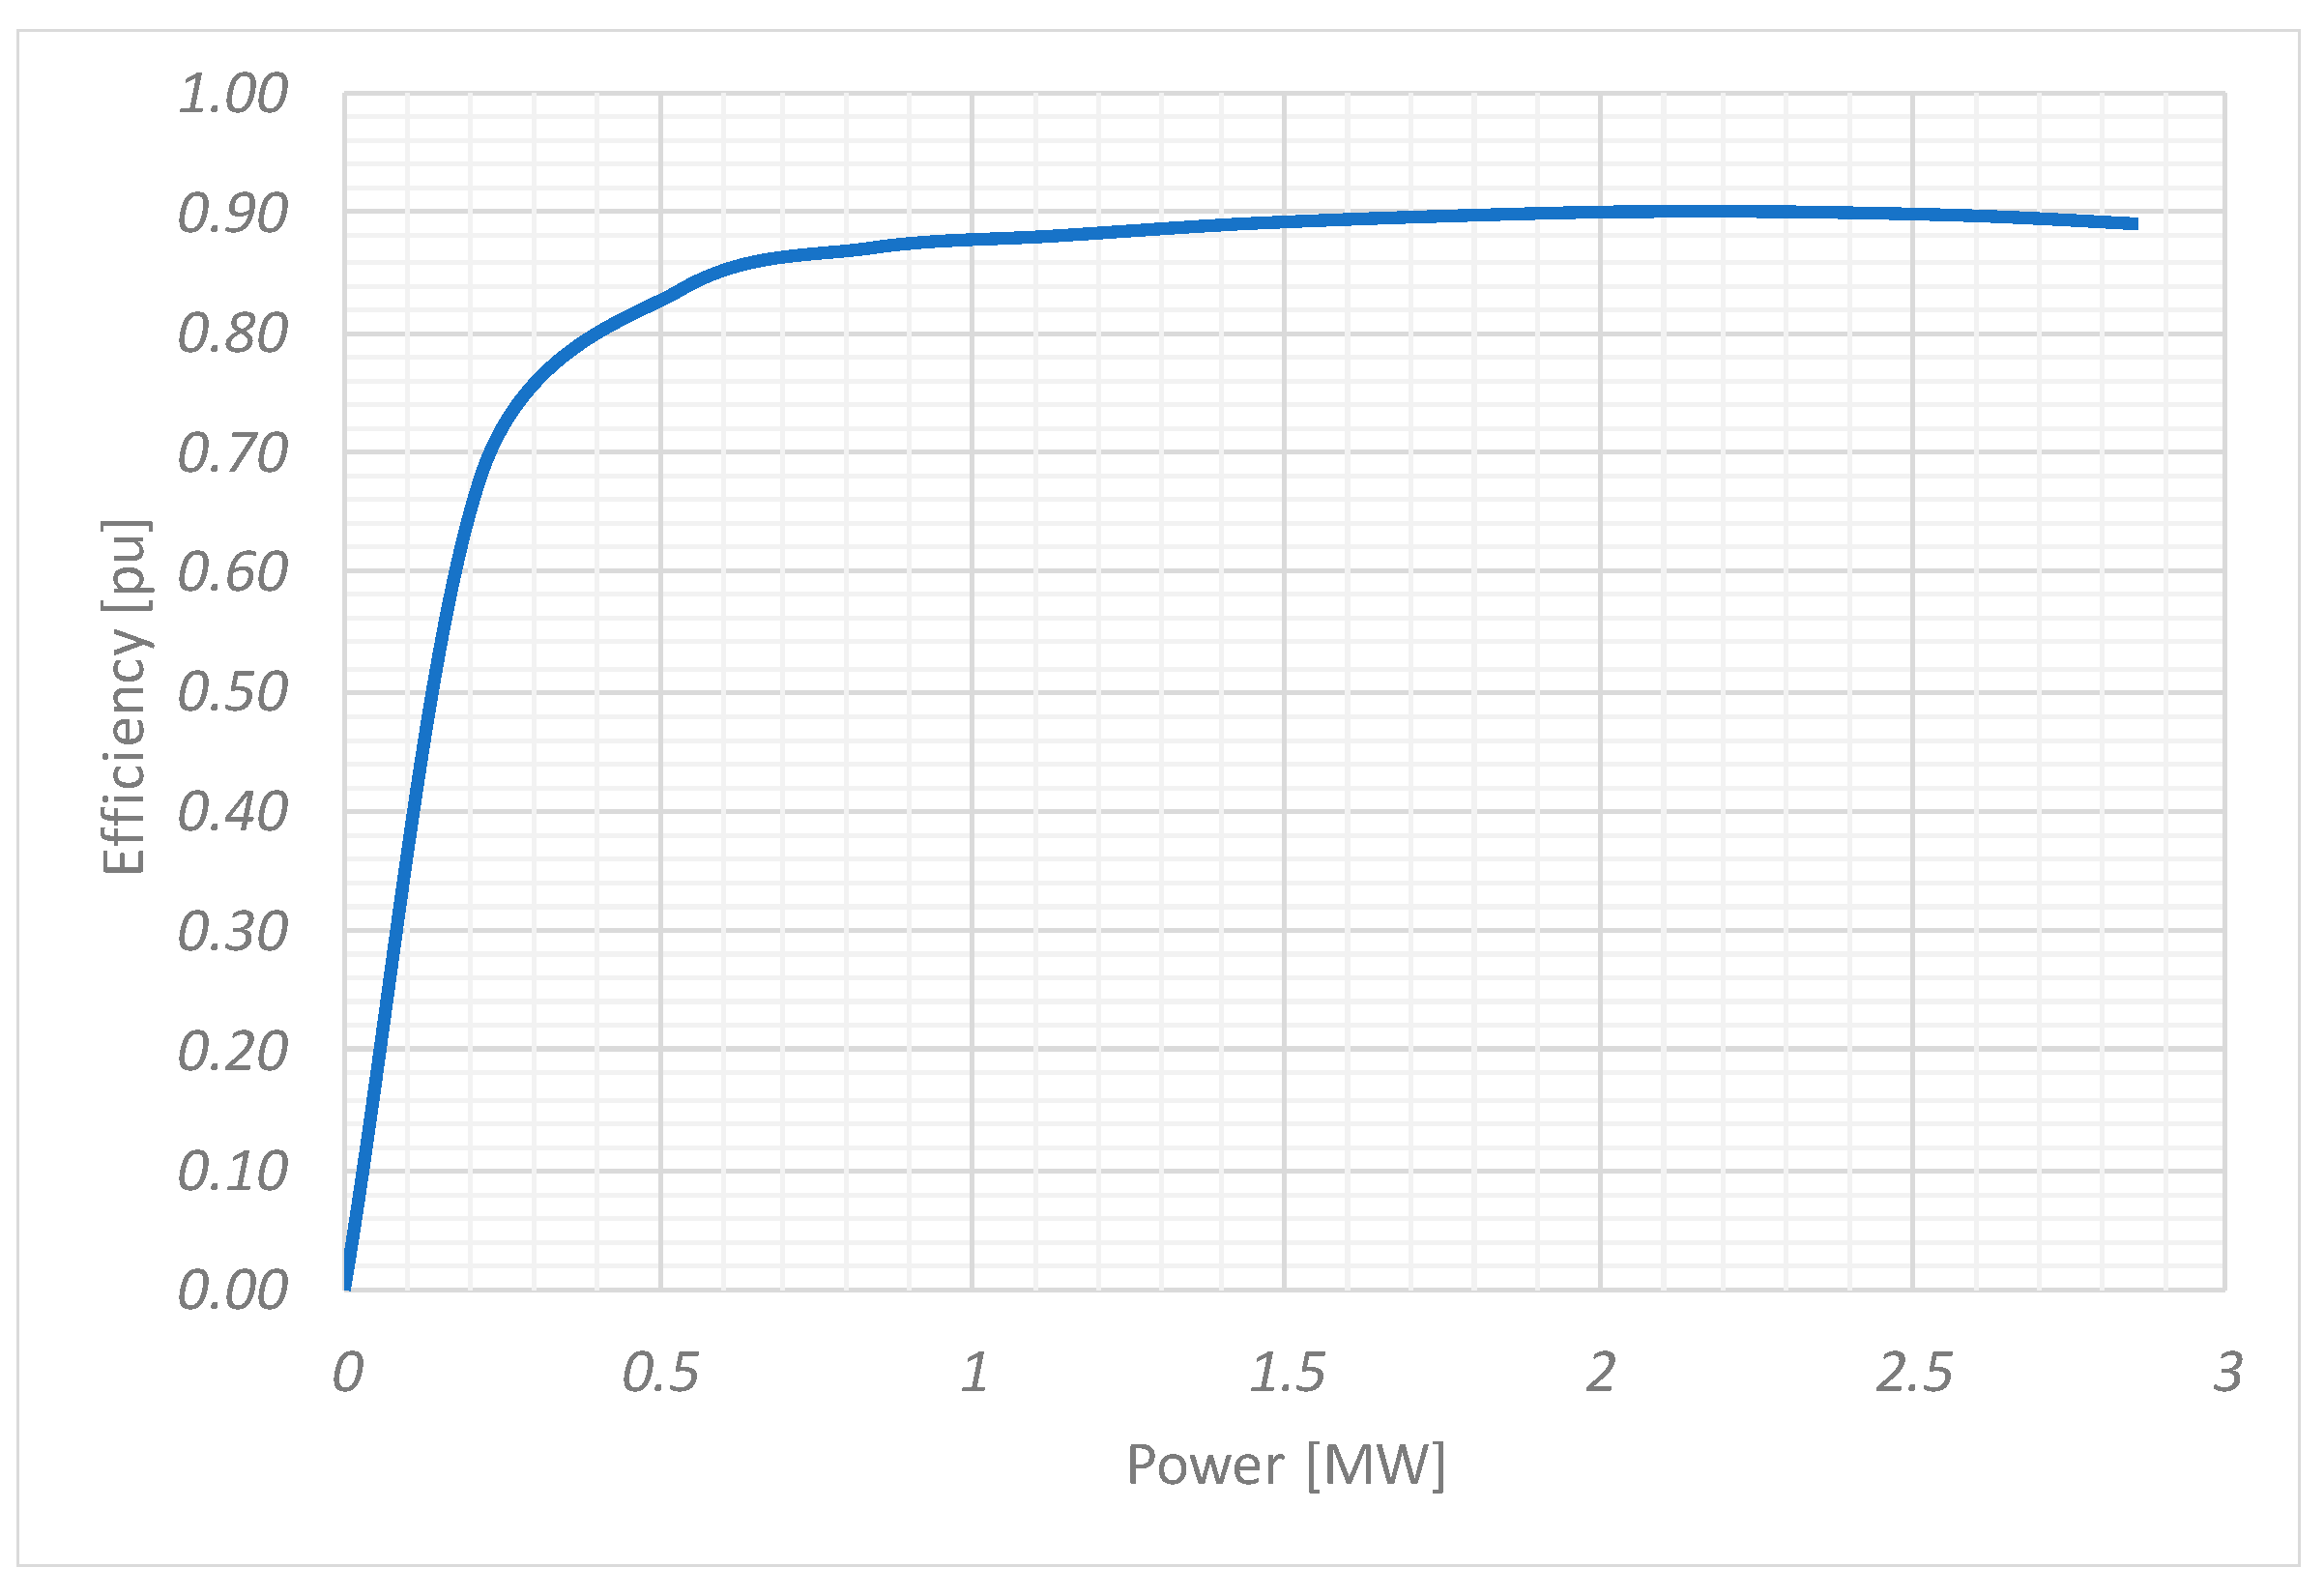
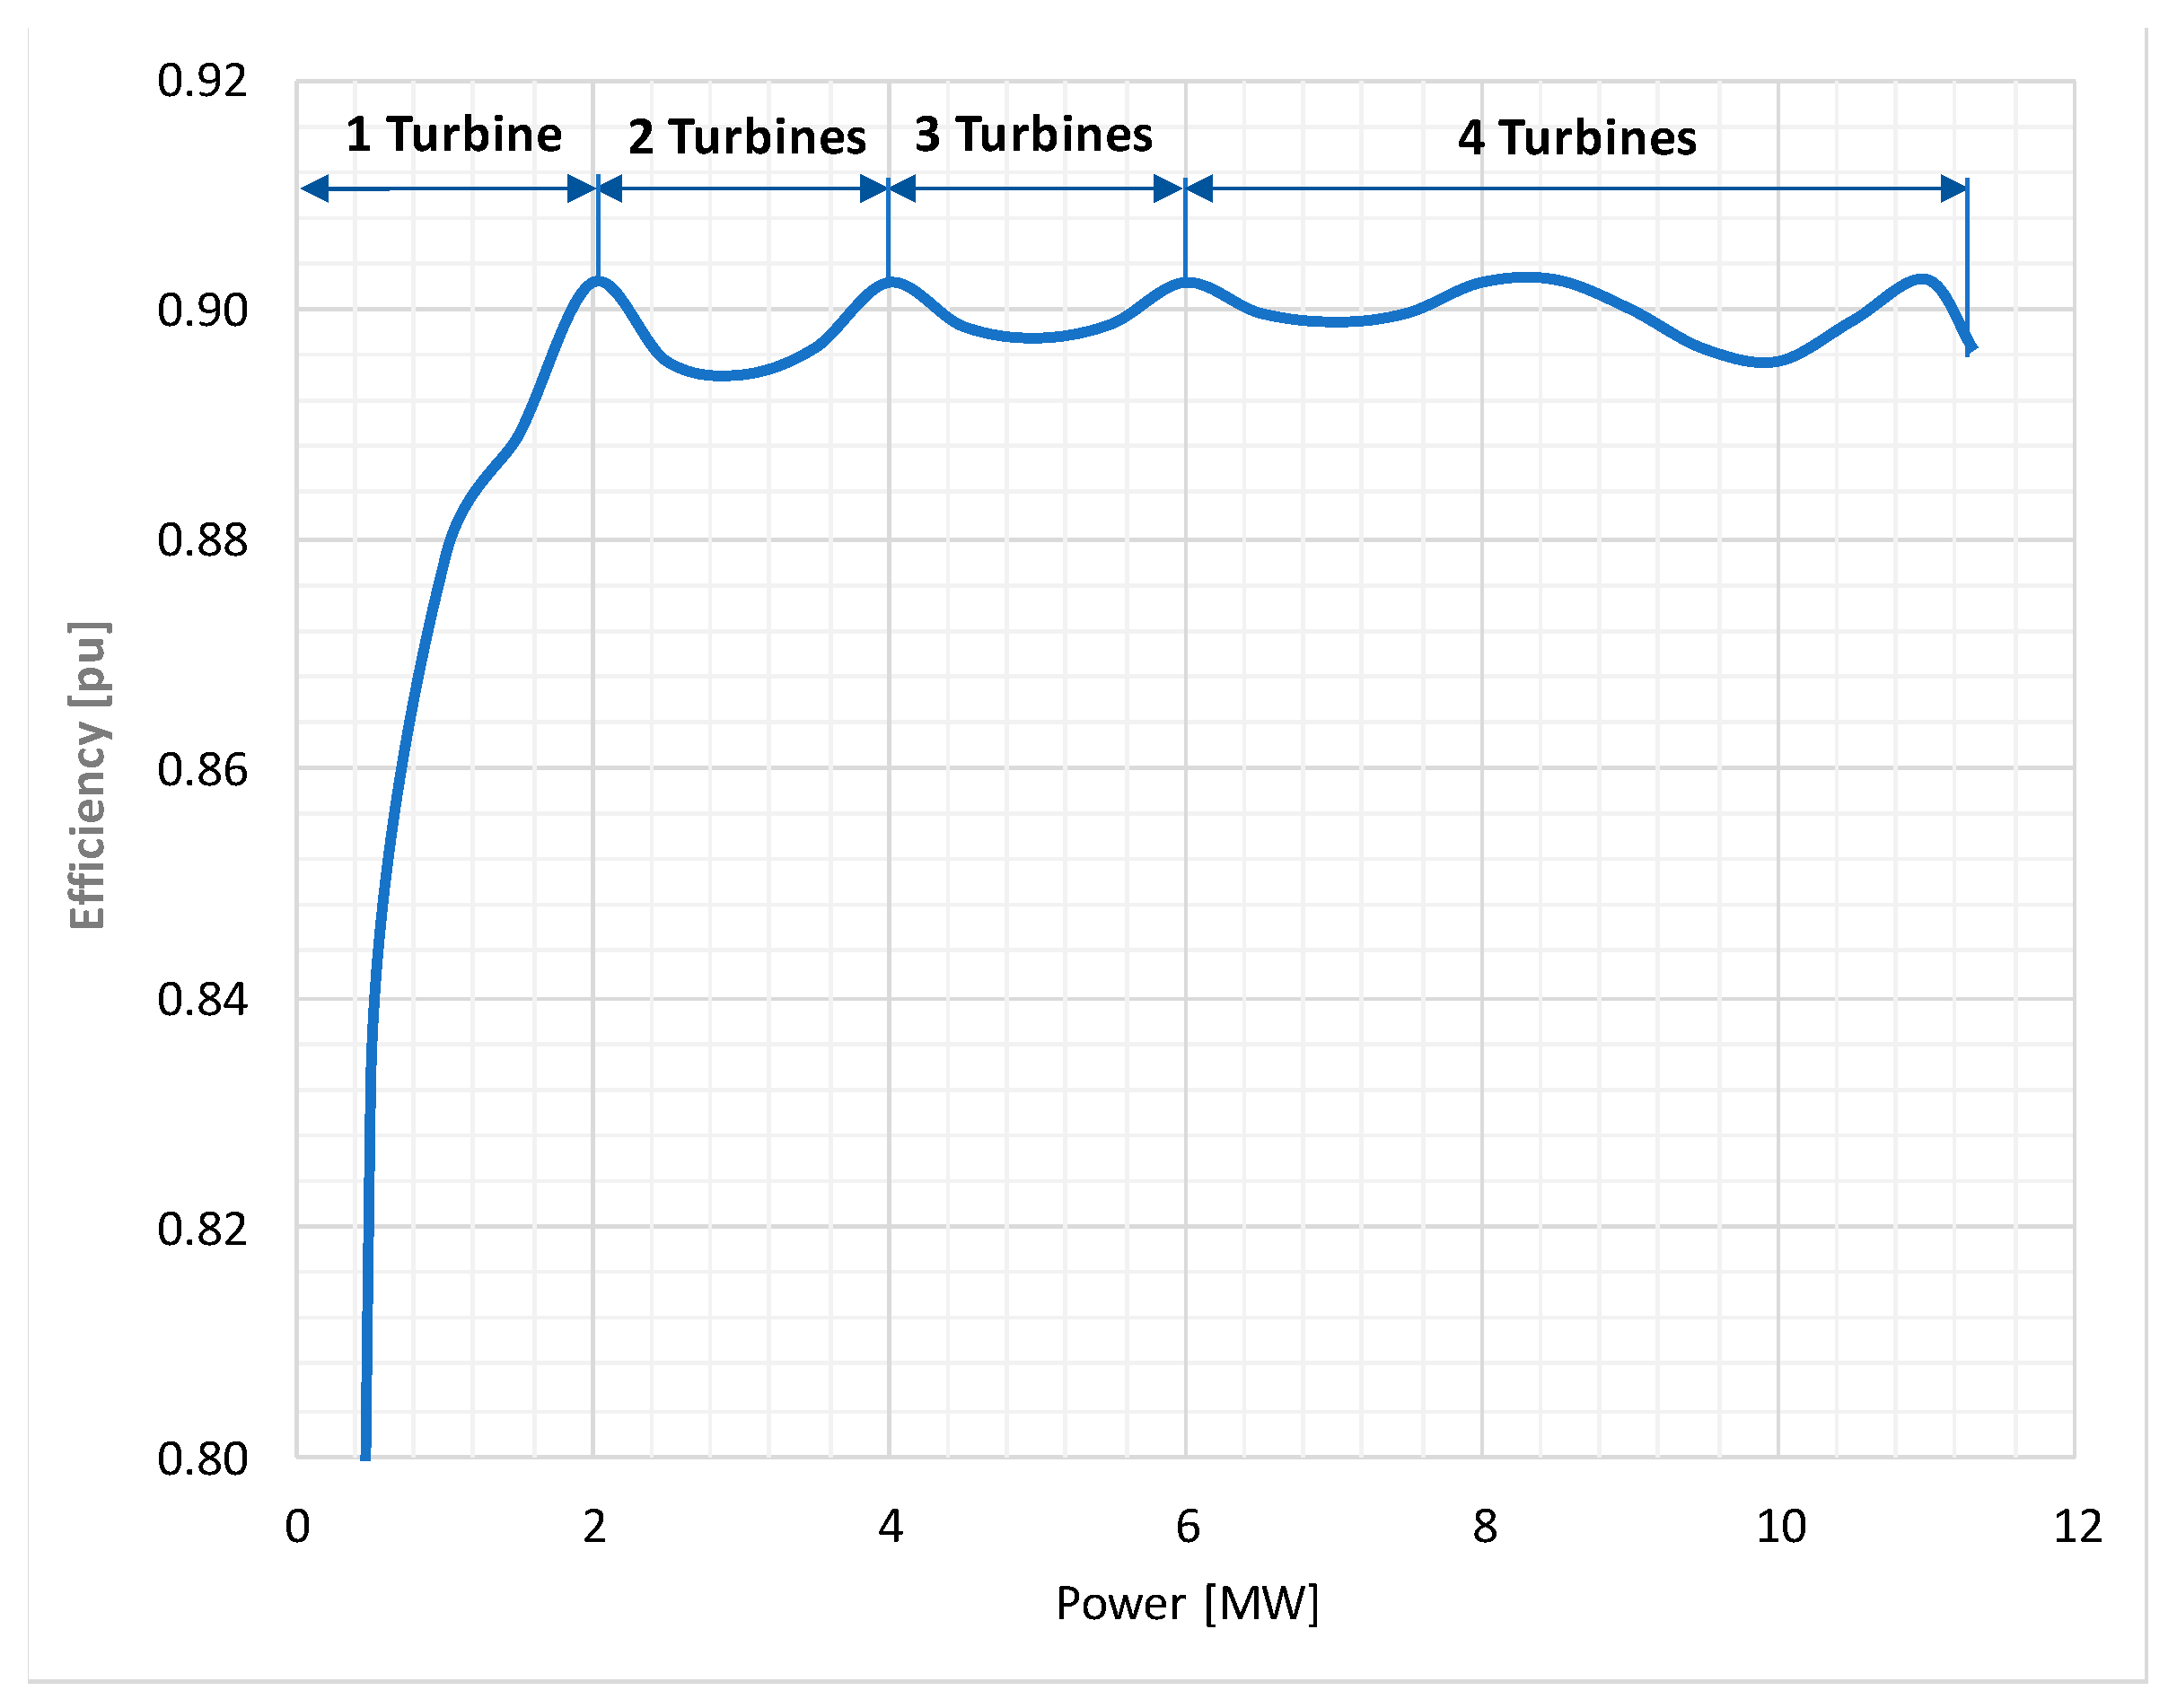
For turbining, the performance of a generic Pelton turbine with the same maximum efficiency of the turbines installed in the plant is used (shown in Figure 6). The number of turbines in operation is determined using the criterion of maximum combined performance. Using this criterion and applying the previously mentioned performance curve, a curve for the plant—shown in Figure 7—is obtained.
4.3.2. Electric Generators Model
For modeling the generators, generic performance Equations (3)–(5) have been used. The parameters of this Equation are taken from the generators installed in the Gorona plant datasheet (shown in Table A2).
where:
| POut | Output power. |
| PIn | Input power. |
| PFix | Synchronous machine fix losses. |
| PVar | Synchronous machine variable losses. |
| PCu1 | Stator windings losses. |
| PCu2 | Rotor windings losses. |
| PFe | Iron core losses. |
| PAdd | Additional losses. |
| Pfw | Friction and windage losses. |
| FdP | Power factor. |
| SN | Rated power. |
Since each generator is in the same shaft of its turbine, the generators’ activating sequence is the same one as of the turbines. Therefore, the overall performance of the generators depend on the turbines operating point.
4.3.3. Main Transformers Model
The last component of the turbining process is the main transformer that connects each generator to the bars of the electrical substation. To calculate the performance of this machine, the well-known Equation (6) is used. Its parameters are in Table A3.
where:
| POut | Output power. |
| PIn | Input power. |
| P0 | No-load losses. |
| PSc | Load losses. |
| FdP | Power factor |
| SN | Rated power |
The activation sequence of the transformers is the same as the turbines and generators.
4.3.4. Power Plant Model
Finally, the overall performance of turbining, depending on the power required in the substation bars, can be calculated by applying sequentially the performance of all machines involved.
With this overall performance, it is also possible to calculate the water volume from the upper reservoir turbined and transferred to the lower one. In this way, the evolution of the hydraulic storage for the next 10 min can be calculated.
Therefore, in order to implement the whole model of the power plant, a relation between the water volume turbined and the power demanded is applied.
4.4. Pumping Station
4.4.1. Pumps Model
In the Gorona station, there are two types of pumps: fixed speed 500 kW-rated power pumps and variable speed 1500 kW-rated power pumps.
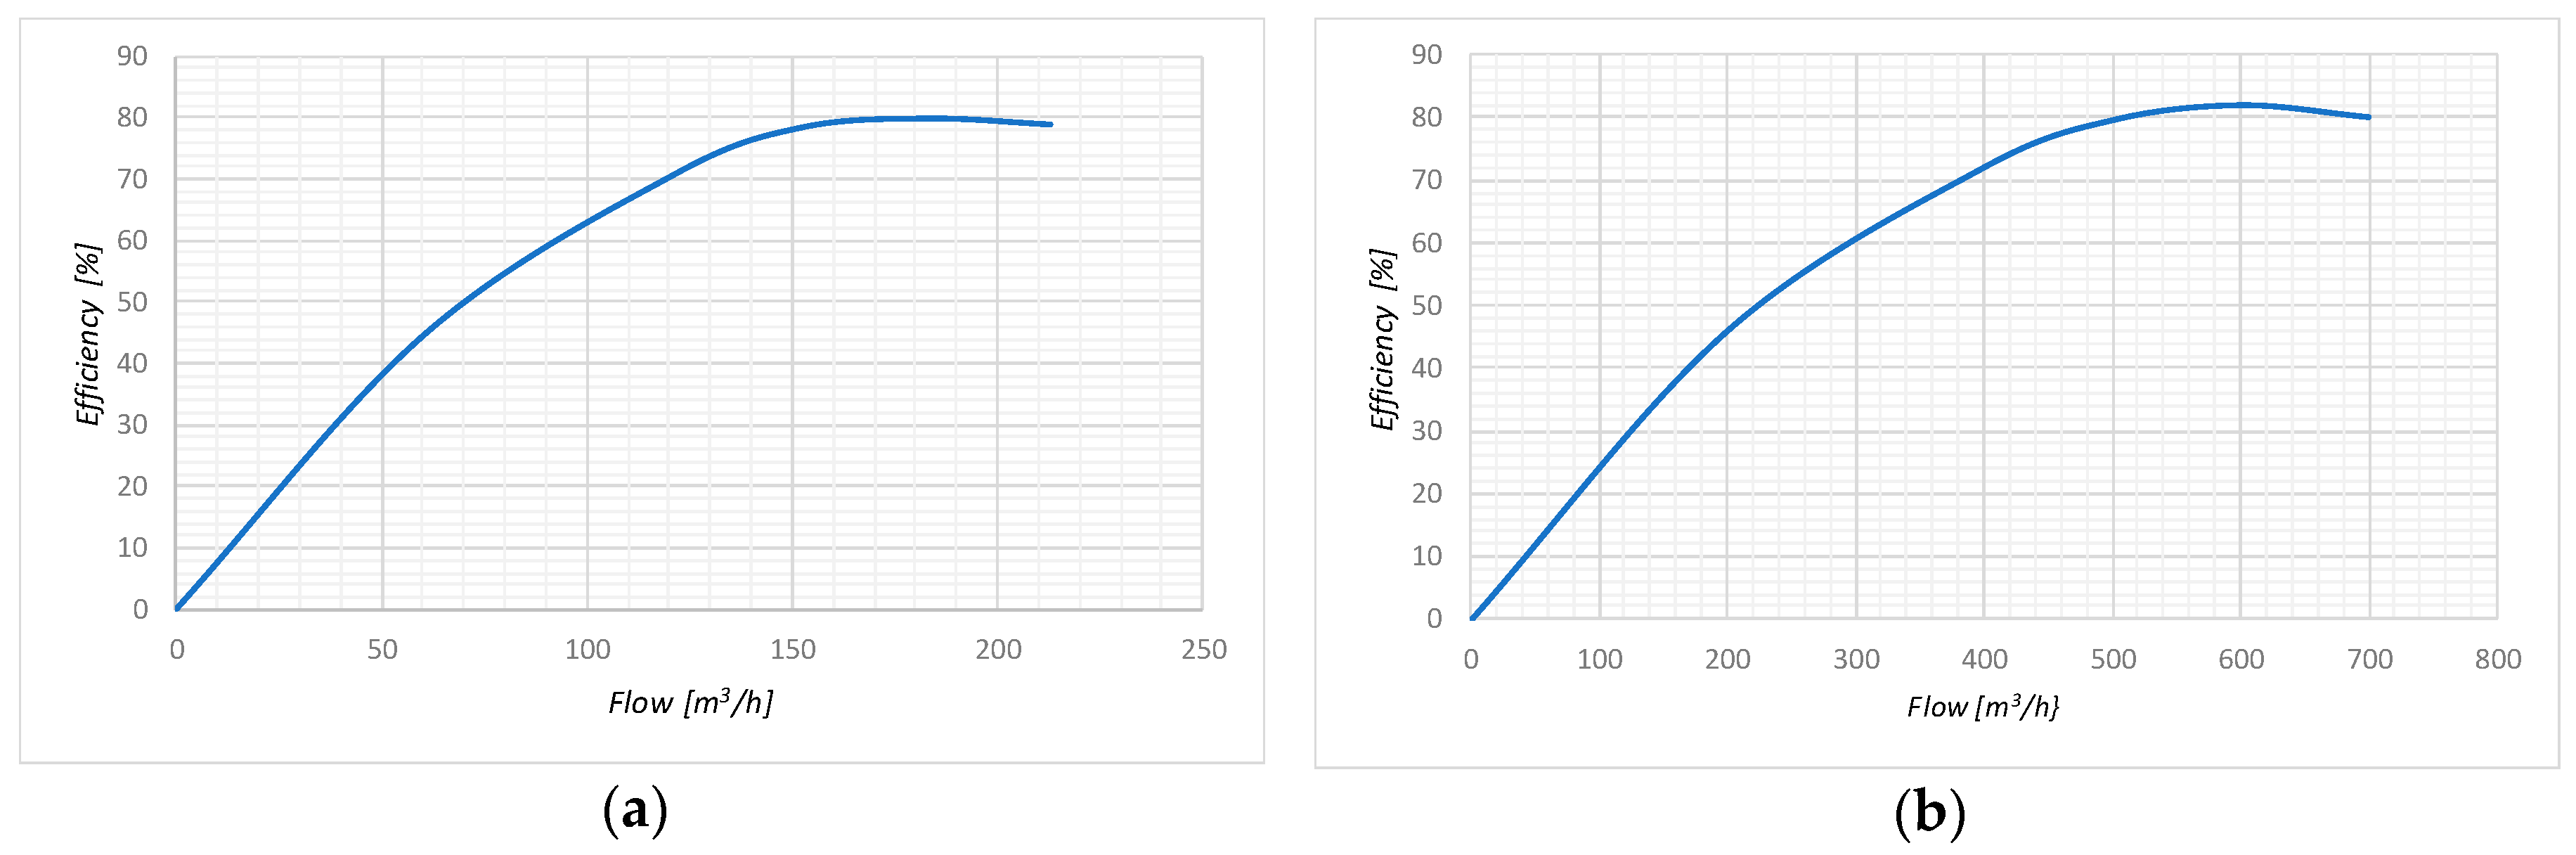
For fixed pumps, as they always work at rated speed and power, their performance is the specified in the manufacturer’s data sheet. While for variable speed pumps, taking the operating points from the diagrams provided by the manufacturer, their performance, for each operating point, could be obtained. In this way, taking values from the pump manufacturer’s curve, a performance curve for the whole pump set can be calculated (Figure 8).
As in the case of turbining, pump operation is only possible if there is enough water stored in the lower reservoir. If this is the case, the activation sequence of the pumps has to take into account that fixed pumps can only be off (zero power consumption) or on (rated power consumption), while variable speed ones can consume any level of power between a minimum and a maximum.
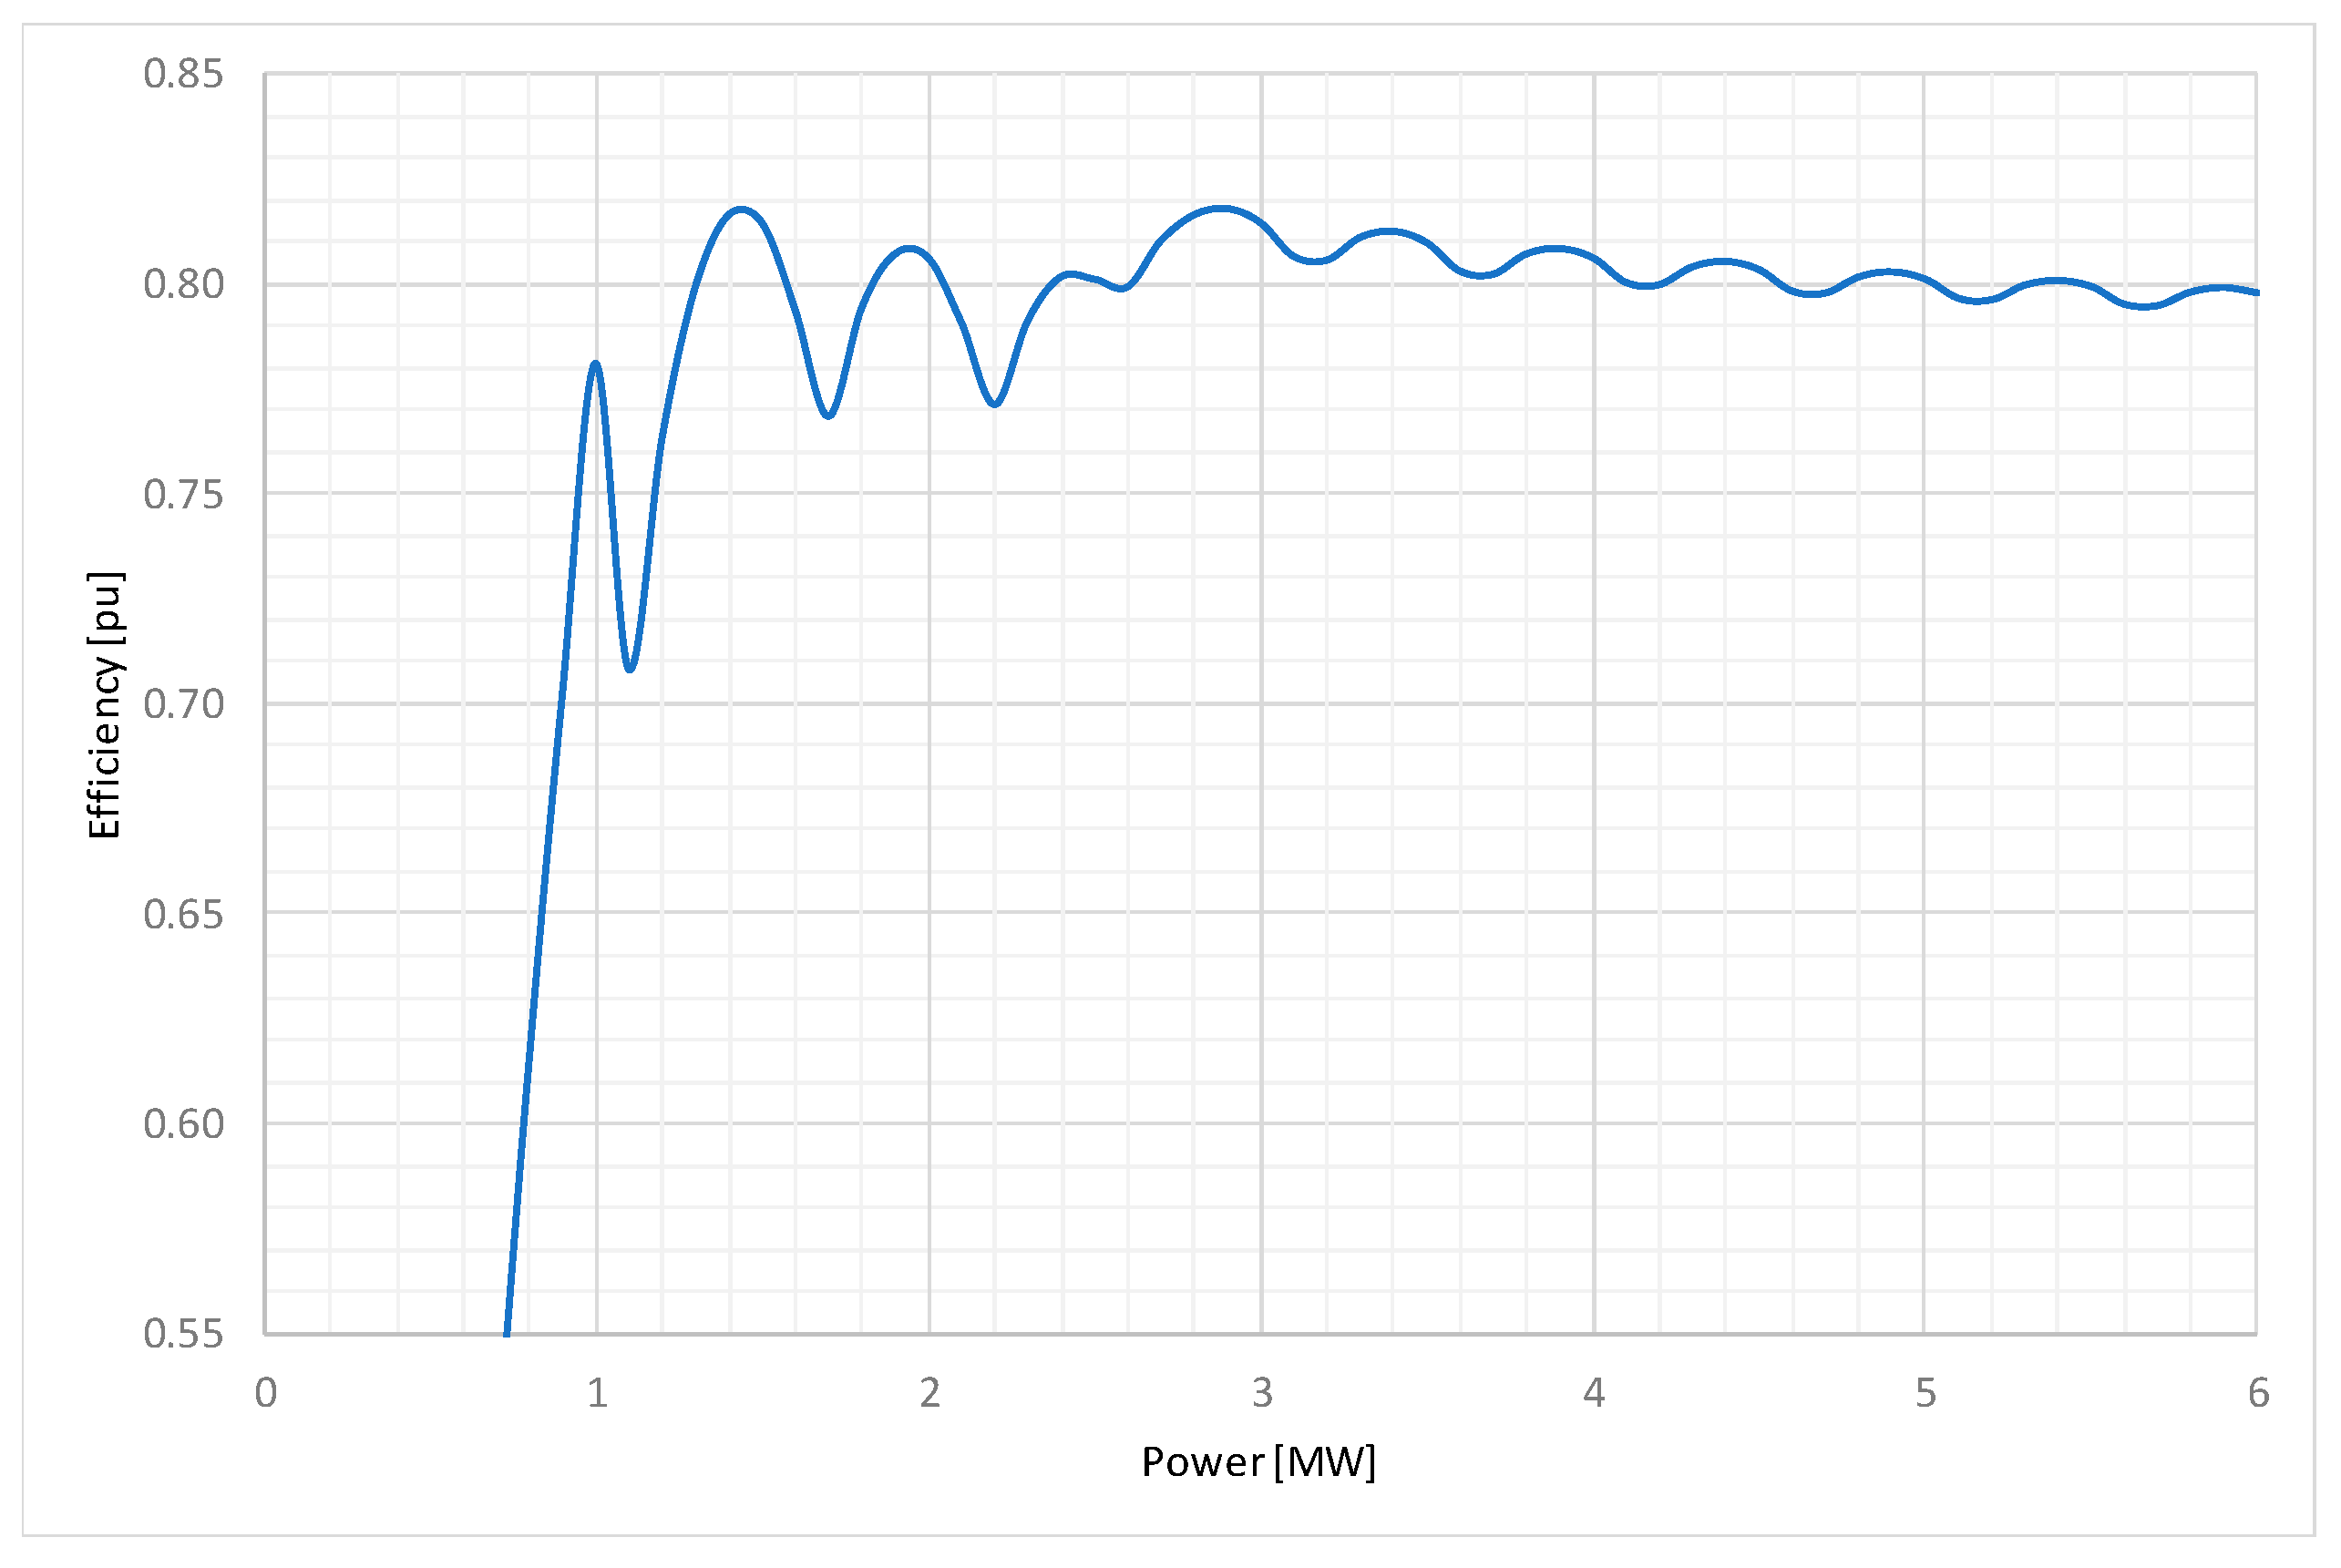
Therefore, if there are enough water for pump operation, the sequence of activation will start with a variable speed pump up to its rated power is reached. Then, a fixed speed pump is started while the variable one reduces its consumption. This process continues until all pumps are in operation at rated power, or the required power consumption is reached. Figure 9 shows the efficiency evolution of the pump station depending on the power required for frequency regulation [24].
4.4.2. Electric Motors Model
600 kW motors (Table A7) drive the fixed speed pumps and 1600 kW motors (Table A4) drive the variable speed ones. Both types of motors have a known performance for their rated power according to the manufacturer’s specifications. As fixed speed motors will work at constant load, they will exhibit constant efficiency. Regarding variable speed motors, as they are driven by a converter (Table A5) that varies frequency and voltage they will work at constant efficiency too. Therefore, all motors will work at constant efficiency.
As was the case with turbines and generators, each motor is in the same shaft as its pump. Therefore, they have the same activation sequence as that of the pumps.
4.4.3. Main Transformer Model
The pump station transformer is modelled as the hydropower transformers. The transformer data are in Table A8.
4.4.4. Pumping Station Model
As in the turbining process, pump power implies that some water volume will be pumped from the lower reservoir to the upper reservoir for each 10 min period.
The performance of the different pumping machines is applied along the range of operating power to obtain the overall performance of the entire process. In the same way as in turbining, there is a curve that relates pumping power with hydraulic storage variation.
4.5. Diesel Power Plant Model
Due to the aim of this study, the operation of the hybrid wind–hydro power plant, the diesel power plant is taken as a generation source that helps in covering the electrical demand. This is so because the performance of the diesel power plant as a whole is not relevant to evaluate the performance of the hybrid wind–hydro power plant. Only the energy values of the wind farm and the hydroelectric power plant in a specified time period is analyzed. The energy delivered by the diesel power plant is only used to provide the power needed to cover the demand.
5. Results and Discussion
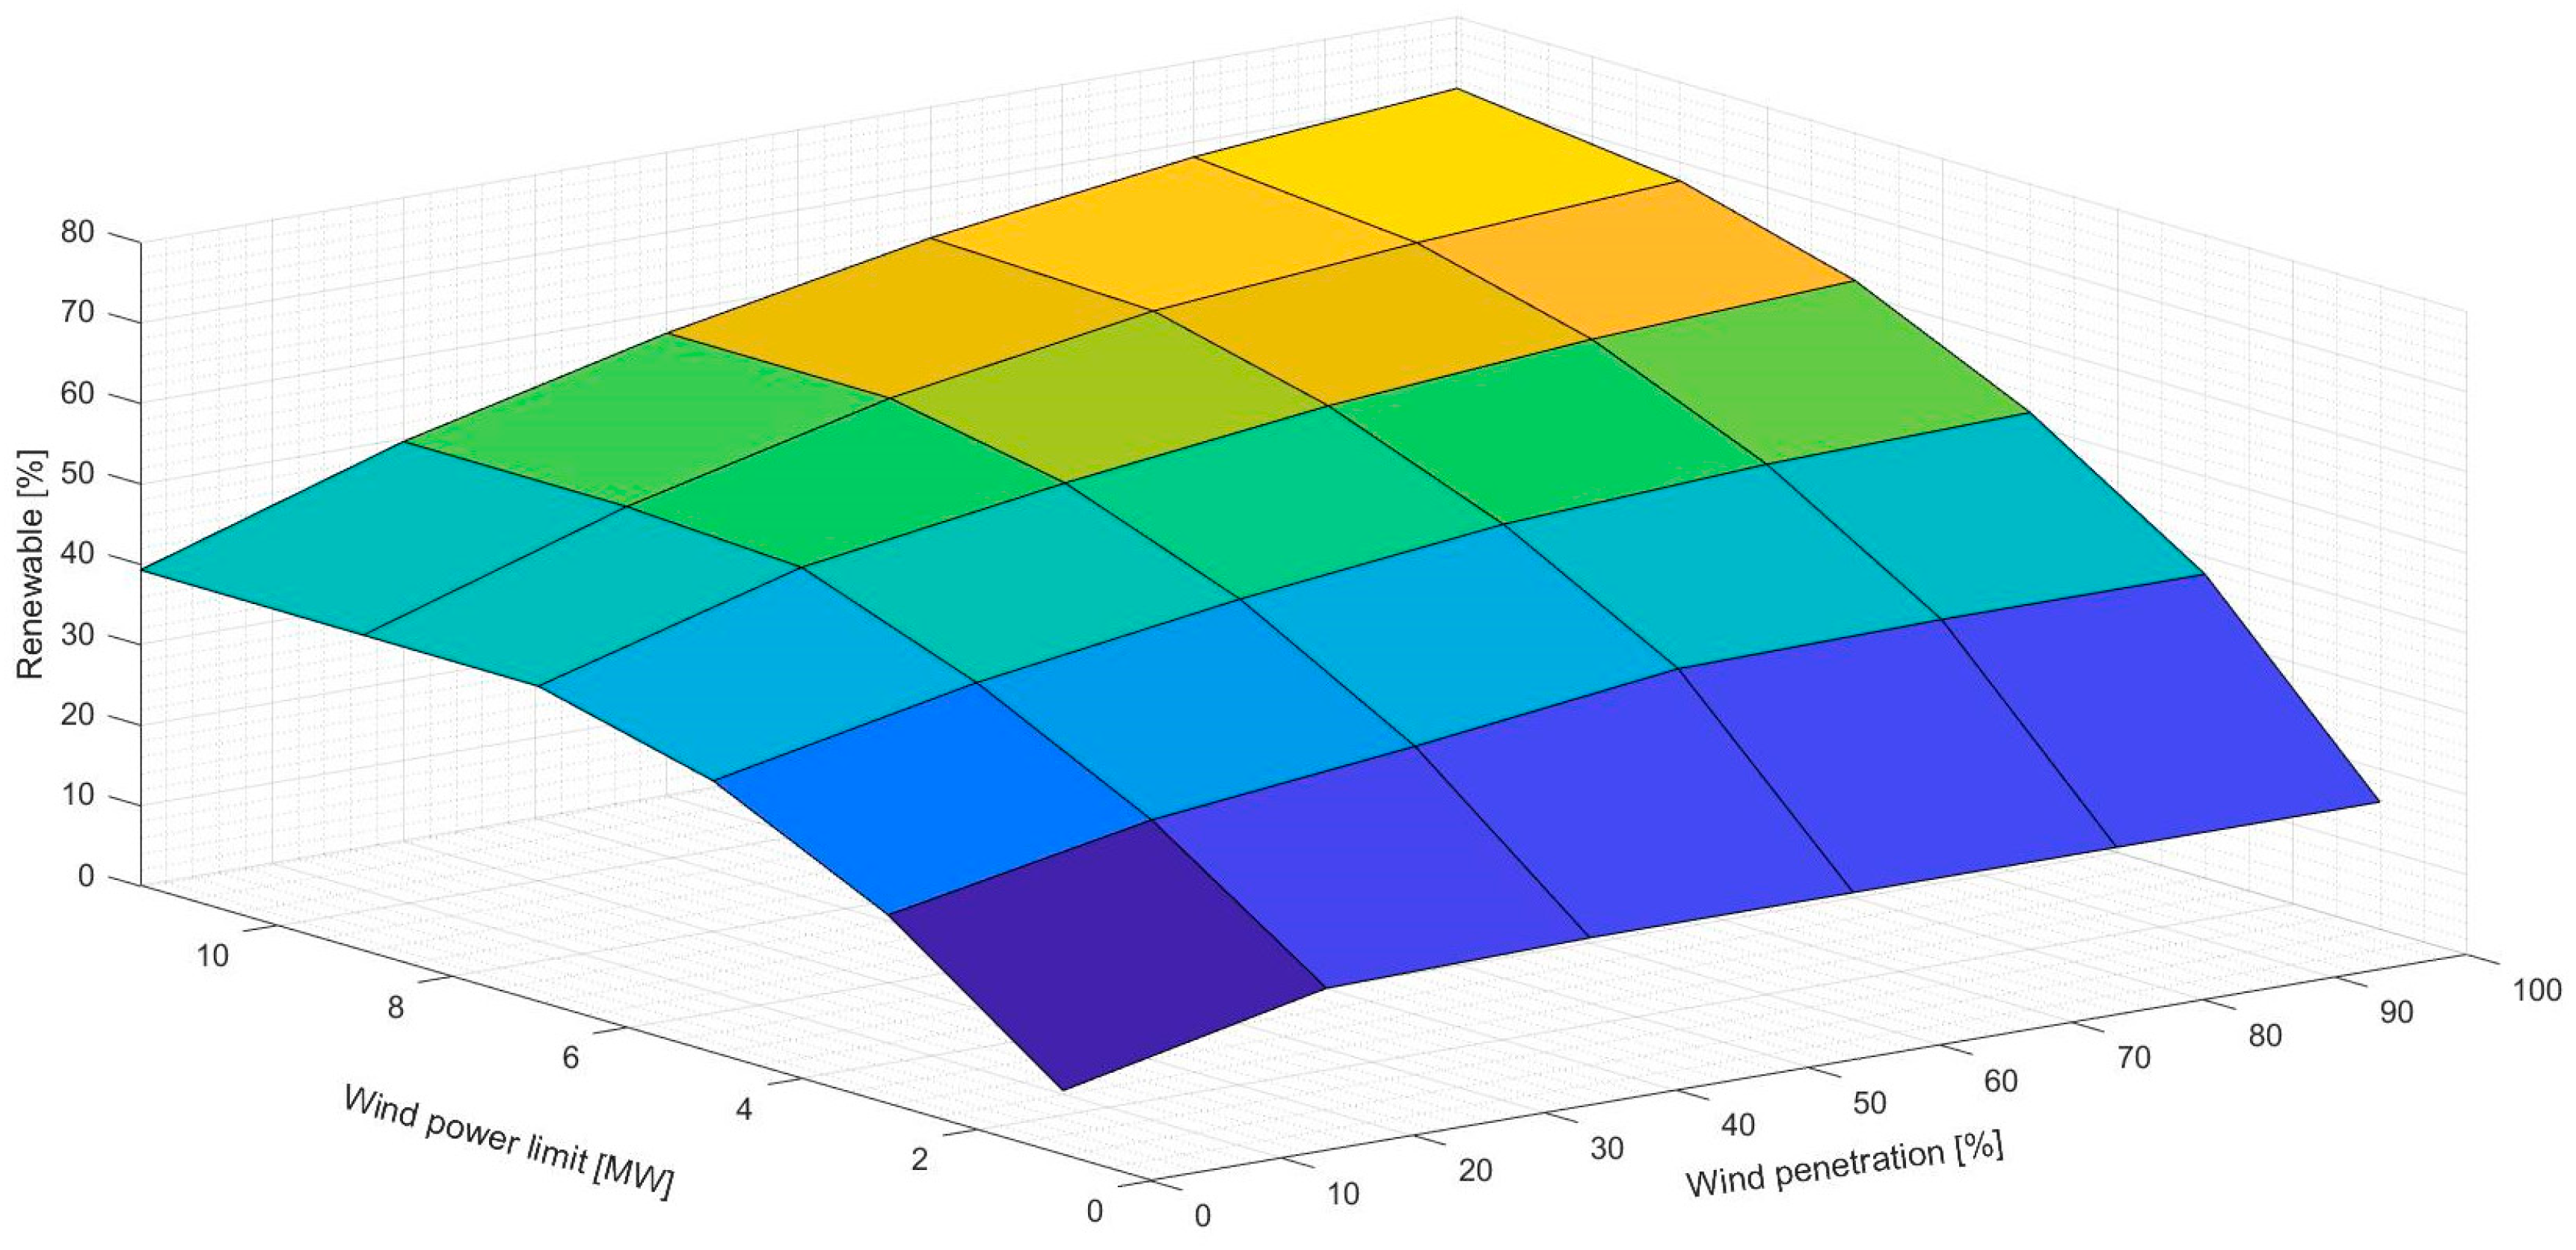
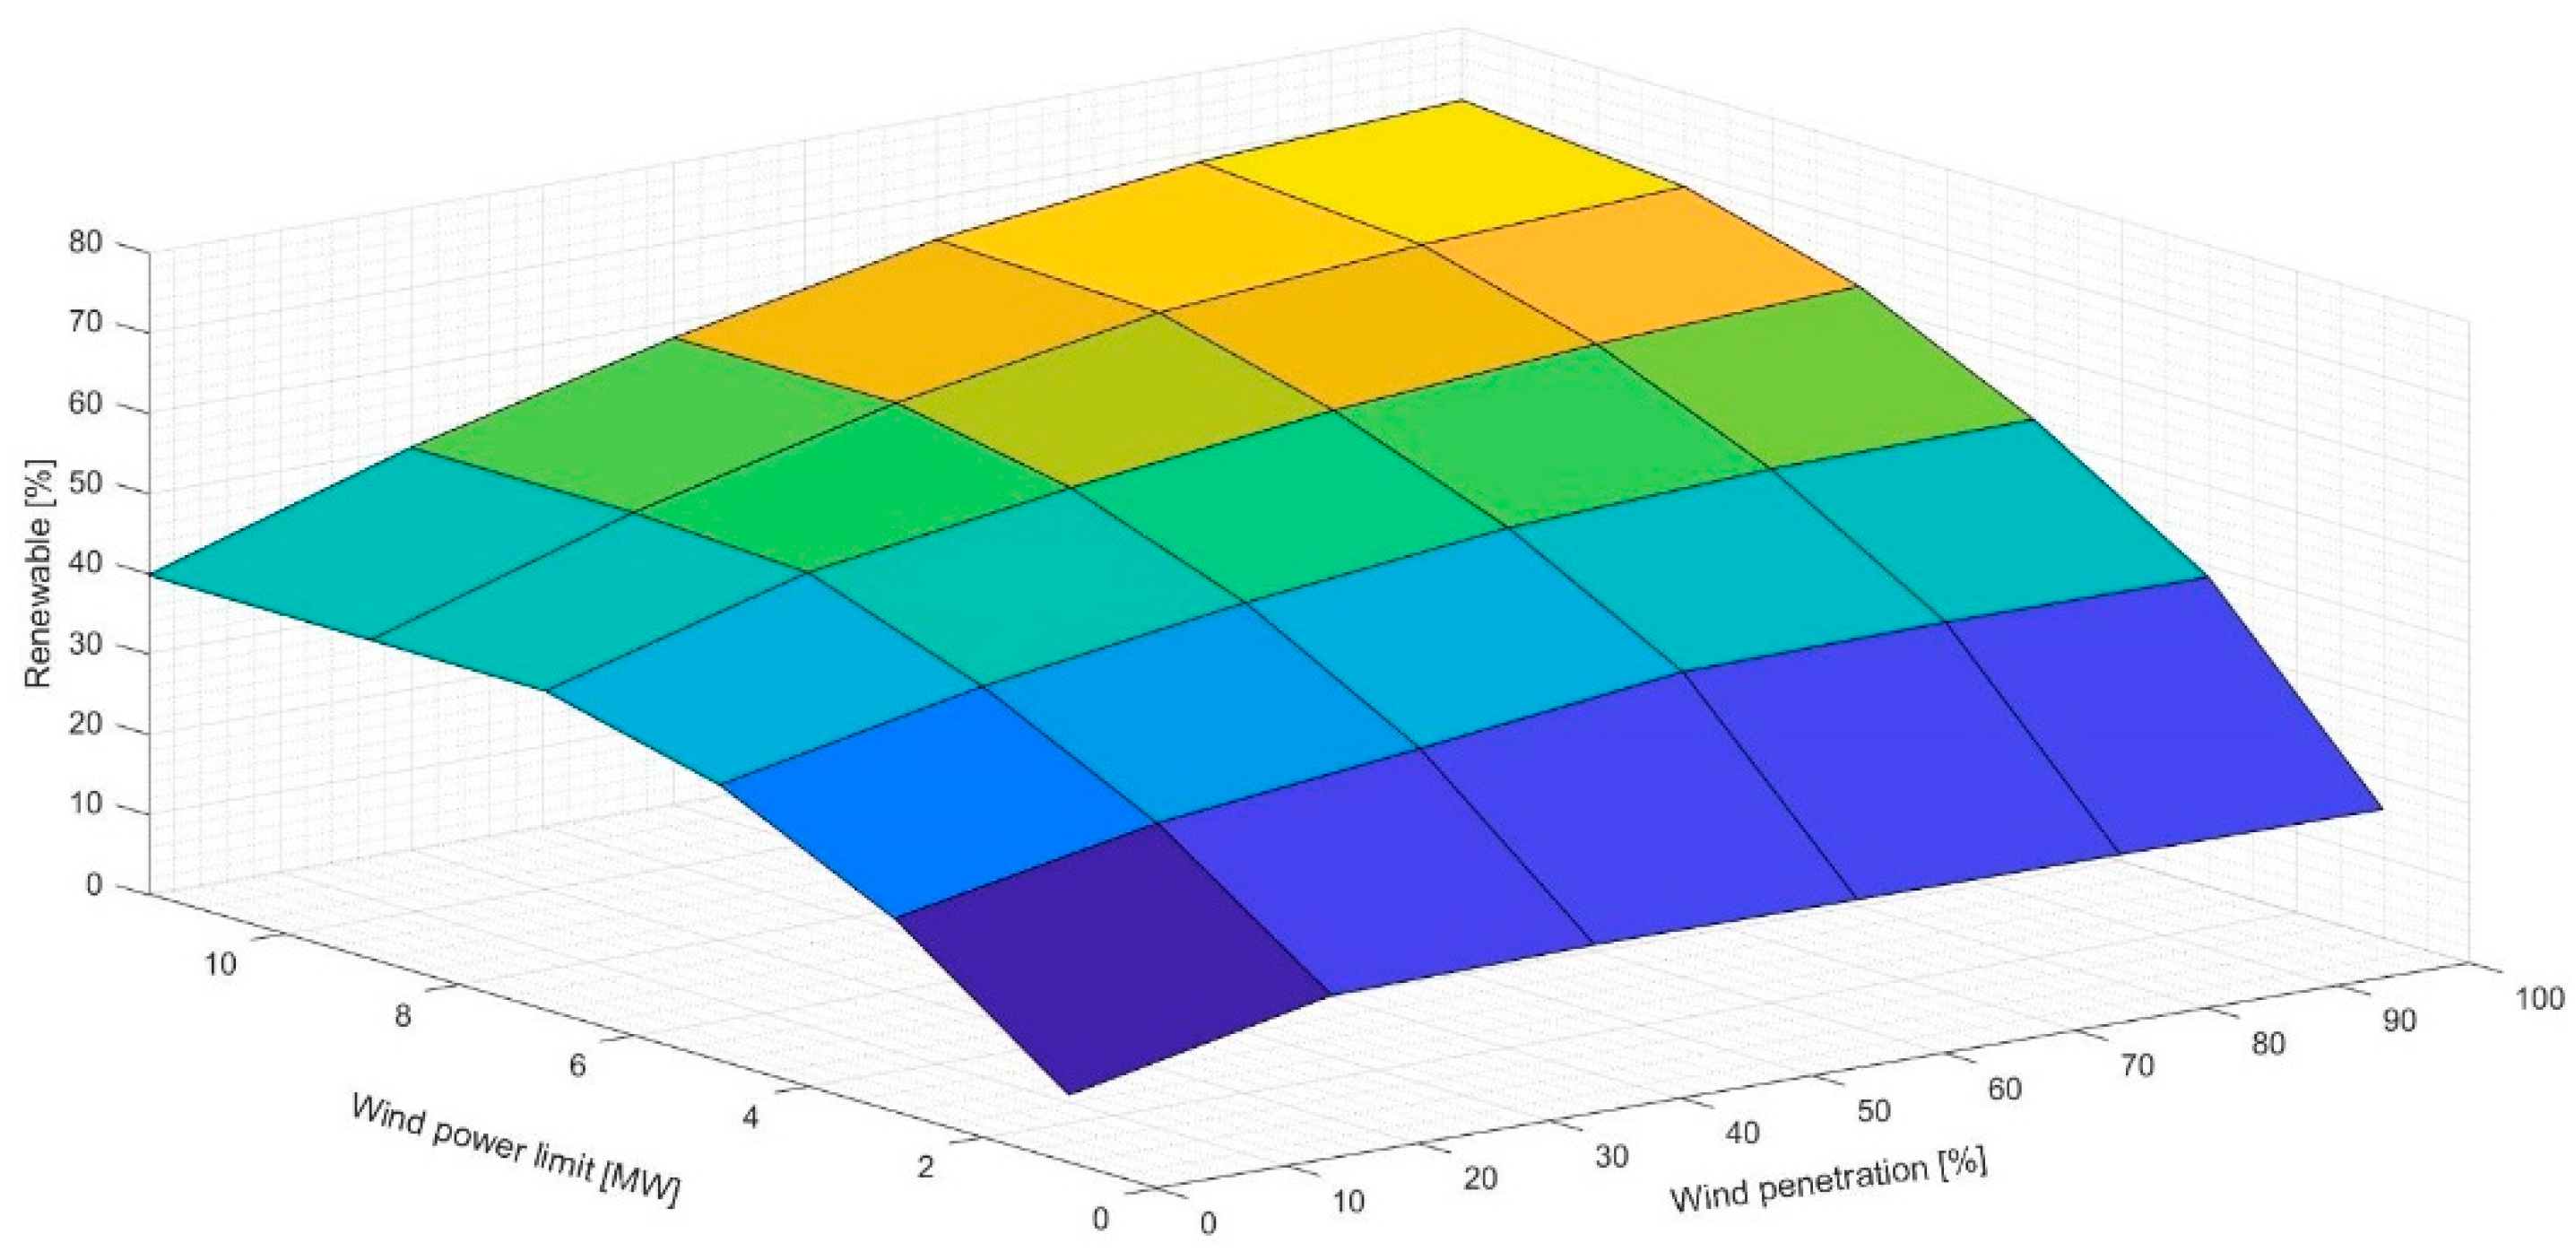
Using the aforementioned simulation models, the performance of the wind–hydro El Hierro power plant has been simulated. To this aim, wind data corresponding to years 2016 and 2017 have been used. As wind data is available every 10 min, and a year has 6 × 24 × 365 = 52,560 10-min periods, simulating an entire year requires running the models 52,560 times. In Figure 10 and Figure 11, the percentage of load demand covered by renewable energy in 2016 and 2017, respectively, is shown. This percentage increases when there is no limit on the power that the wind farm can generate, and also increases when wind penetration is not limited. In both years, the maximum possible renewable load coverage is slightly over 70%.
In those years, the percentage of load demand actually covered by renewable energy has increased. In 2016, it was 40.62%, while it was 46.26% in 2017. Figure 3 shows that in 2016, wind penetration was limited to around 70% and the maximum wind power was around 7.2 MW. Applying this limit to Figure 10 the maximum percentage of demand covered by renewable energy is around 50%, which is in reasonable agreement with the actual value. It should be noted that some factors were not considered in the calculations as penstock losses or evaporation in the upper reservoir. In 2018, this percentage increases again up to 56.62%. Therefore, the power system operation is increasingly approaching theoretical performance.
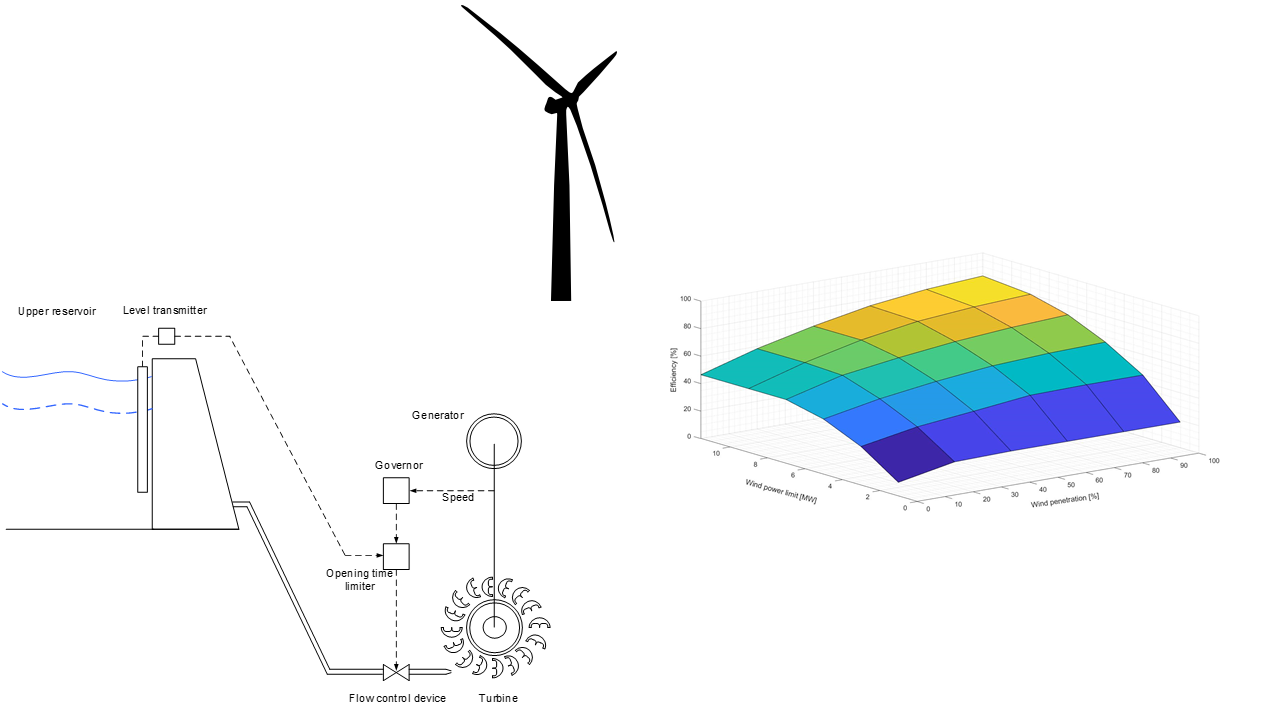
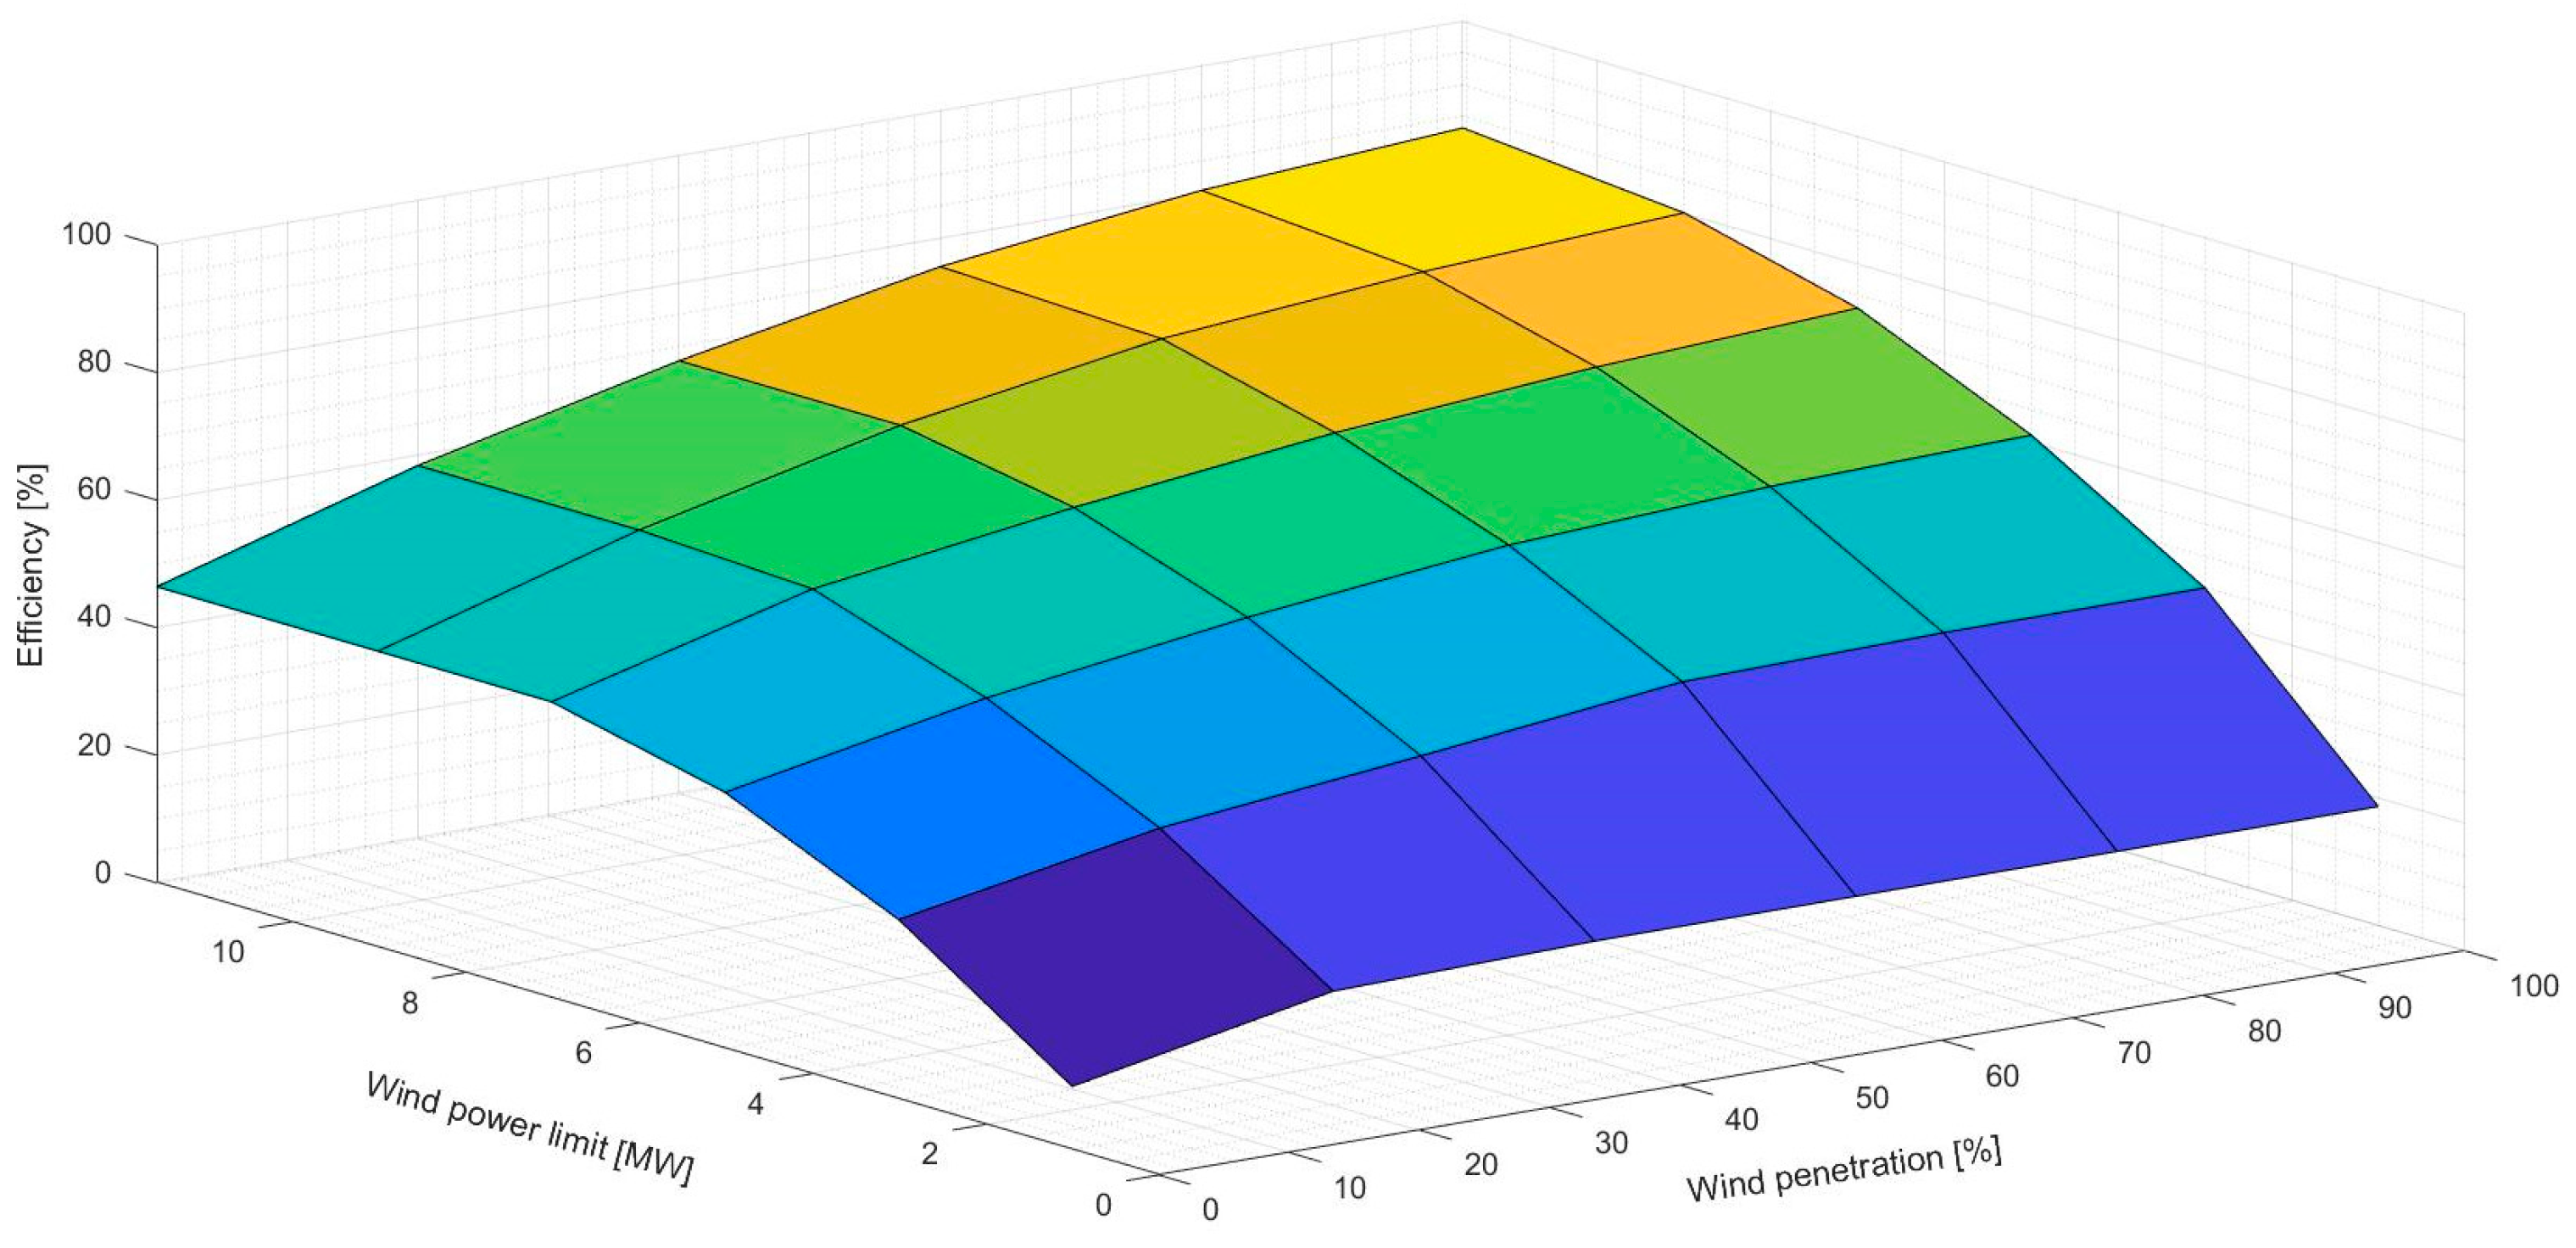
Regarding the operating efficiency, its value for 2017 wind data is shown in Figure 12. As it was the case in load demand coverage, the efficiency increases when the wind power limit increases and, also, when wind penetration increases. Maximum operating efficiency is achieved when none of these limits apply. In that case, operating efficiency reaches 80%. In Section 3.2, a 40% operating efficiency using the isolated wind strategy was estimated. This means that an unrestricted wind operation achieves a twofold efficiency increase over an isolated wind operation.
As shown in Figure 4, nowadays this power system is close to achieving this operating efficiency.
6. Conclusions
This paper presents a model of an isolated power system located in El Hierro Island—a UNESCO biosphere reserve. This model is based on the analysis of energy flows with the aim of evaluating the operating efficiency of a renewable power plant. This power plant is composed of a wind farm and a pumped storage hydropower plant. For every component of the power system, a model that takes into account its energy performance has been presented.
In addition, a definition of operating efficiency adapted to this renewable power plant has been proposed. Operating efficiency is defined through the comparison of the net energy put on the power system by the hybrid power plant with the electrical energy that its wind farm will put in an infinite bus. Therefore, if the wind farm was connected to an infinite bus, its operating efficiency would be 100%. In a small isolated power system, such as El Hierro Island, a storage system is needed and, so, the operating efficiency is always less than 100%.
In order to analyze this operating efficiency, several power system operational strategies have been presented. Several tens of thousands of simulations have been conducted to evaluate the yearly operating efficiency of the renewable power plant depending on the strategy followed. In addition, the percentage of demand covered by the renewable power plant has been also evaluated.
The results of the simulations show that the operating efficiency of the wind–hydro power plant is heavily dependent on the power system operational strategy followed. This efficiency increases when lighter restrictions are imposed on the wind generation. In fact, a twofold increase in efficiency can be achieved between the best (80%) and worst (40%) strategies.
Consequently, the non-restricted wind operational strategy is recommended. Along the operational history of the plant, several of these strategies were used. As the operator’s confidence increased, the wind generation restrictions have been reduced. Nowadays, non-restricted wind generation is mostly applied. In fact, there are some periods when the energy supply is drawn 100% from renewable sources.
The percentage of demand covered by this power plant along its operational history has been compared with simulation results showing a reasonable agreement. In addition, as wind generation restrictions have been reduced, the percentage of demand covered by this power plant has increased. The yearly demand coverage by renewable energy was 40.6% in 2016. It has increased to 46.26% in 2017 and to 56.6% in 2018. Nowadays, there are some periods of 100% demand covered by this renewable power plant.
Author Contributions
Conceptualization, C.A.P. and J.A.S.-F.; methodology, F.B.; software, F.B.; validation, C.A.P., J.A.S.-F. and C.N.; formal analysis, F.B.; investigation, C.A.P. and J.A.S.-F.; resources, C.N.; data curation, F.B.; writing—original draft preparation, C.A.P. and J.A.S.-F.; writing—review and editing, C.A.P., J.A.S.-F. and C.N.; visualization, F.B.; supervision, C.N. All authors have read and agreed to the published version of the manuscript.
Funding
This research was funded by Universidad Politécnica de Madrid, grant number RP1604330010.
Conflicts of Interest
The authors declare no conflict of interest
Appendix A

Table A1.
Pelton turbines performance data.
| Pelton Turbines | 4 | |
|---|---|---|
| Rated Power | 2854 | kW |
| Rated Flow | 0.5 | m3/s |
| Gross Head | 658 | m |
| Net Head | 651 | m |
| Rated speed | 1000 | rpm |
| Number of jets per runner | 1 | |
| Type | Horizontal | |
| Efficiency | Figure 6 |
Table A2.
Hydro generator performance data.
| Hydro Synchronous Generators | 4 | |
|---|---|---|
| Rated apparent power | 3300 | kVA |
| Rated Power Factor | 0.8 | |
| Rated voltage (±5.0%) | 6 | kV |
| Frequency | 50 | Hz |
| Rated speed | 1000 | rpm |
| Stator windings losses. PCu1 | 23.31 | kW |
| Rotor windings losses. PCu2 | 10.88 | kW |
| Additional losses. PAdd | 2.78 | kW |
| Friction and windage losses. Pfw | 18.85 | kW |
| Iron core losses. PFe | 27.35 | kW |
Table A3.
Hydro generator transformers performance data.
| Hydro Generators Transformers | 4 | |
|---|---|---|
| Rated apparent power | 3300 | kVA |
| Secondary rated voltage | 20 | kV |
| Primary rated voltage | 6 | kV |
| Frequency | 50 | Hz |
| No-load losses | 3.5 | kW |
| Load losses | 28 | kW |
Table A4.
Variable speed drive motors performance data.
| Induction Motor | 2 | |
|---|---|---|
| Rated power | 1600 | kW |
| Rated Voltage | 690 | kV |
| Speed range | 0–2979 | rpm |
| Frequency | 50 | Hz |
| Efficiency | 96.3 | % |
| Power factor | 0.88 |
Table A5.
Variable speed driver performance data.
| Frequency Converters | 2 | |
|---|---|---|
| Rated power | 1750 | kW |
| Rated voltage | 690 | V |
| Losses at 1500 kW | <2 | % |
| Losses at 500 kW | <2 | % |
| Input transformer efficiency | >99 | % |
| Global efficiency | ≥97 | % |
Table A6.
Variable speed pumps performance data.
| Variable Speed Pumps | 2 | |
|---|---|---|
| Head | 690 | m |
| Rated flow | 690 | m3/h |
| Minimum flow | 221 | m3/h |
| Rated speed | 2830 | rpm |
| Efficiency | Figure 8b |
Table A7.
Fixed speed motors performance data.
| Induction Motor | 6 | |
|---|---|---|
| Rated power | 600 | kW |
| Rated Voltage | 6 | kV |
| Rated speed | 2981 | rpm |
| Frequency | 50 | Hz |
| Efficiency at | ||
| 100% | 96.6 | % |
| 75% | 96.5 | % |
| 50% | 95.8 | % |
| Power factor at | ||
| 100% | 0.92 | |
| 75% | 0.92 | |
| 50% | 0.89 |
Table A8.
Pumping station main transformer performance data.
| Pumping Station Transformer | 1 | |
|---|---|---|
| Rated apparent power | 7200 | kVA |
| Primary rated voltage | 20 | kV |
| Secondary rated voltage | 6.1 | kV |
| Frequency | 50 | Hz |
| No-load losses | 4.6 | kW |
| Load losses | 38 | kW |
Table A9.
Fix speed pumps performance data.
| Variable Speed Pumps | 2 | |
|---|---|---|
| Head | 690 | m |
| Rated flow | 210 | m3/h |
| Rated speed | 2965 | rpm |
| Efficiency | Figure 8a |
References
- Zou, C.; Zhao, Q.; Zhang, G.; Xiong, B. Energy revolution: From a fossil energy era to a new energy era. Nat. Gas Ind. B 2016, 3, 1–11. [Google Scholar] [CrossRef] [Green Version]
- Hardisty, P.E.; Clark, T.S.; Hynes, R.G. Life Cycle Greenhouse Gas Emissions from Electricity Generation: A Comparative Analysis of Australian Energy Sources. Energies 2012, 5, 872–897. [Google Scholar] [CrossRef]
- International Energy Agency Tracking Clean Energy Progress 2017. Available online: https://www.iea.org/publications/freepublications/publication/TrackingCleanEnergyProgress2017.pdf (accessed on 15 February 2019).
- Kies, A.; Schyska, B.; von Bremen, L. Curtailment in a Highly Renewable Power System and Its Effect on Capacity Factors. Energies 2016, 9, 955. [Google Scholar] [CrossRef]
- de Oliveira Costa Souza Rosa, C.; Alonso Costa, K.; Silva Christo, E.; Braga Bertahome, P. Complementarity of Hydro, Photovoltaic, and Wind Power in Rio de Janeiro State. Sustainability 2017, 9, 1130. [Google Scholar] [CrossRef] [Green Version]
- Ioakimidis, C.S.; Genikomsakis, K.N. Integration of Seawater Pumped-Storage in the Energy System of the Island of São Miguel (Azores). Sustainability 2018, 10, 3438. [Google Scholar] [CrossRef] [Green Version]
- Kuang, Y.; Zhang, Y.; Zhou, B.; Li, C.; Cao, Y.; Li, L.; Zeng, L. A review of renewable energy utilization in islands. Renew. Sustain. Energy Rev. 2016, 59, 504–513. [Google Scholar] [CrossRef]
- Sperling, K. How does a pioneer community energy project succeed in practice? The case of the Samsø Renewable Energy Island. Renew. Sustain. Energy Rev. 2017, 71, 884–897. [Google Scholar] [CrossRef]
- Kumar, S.R.; Gafaro, F.; Daka, A.; Raturi, A. Modelling and analysis of grid integration for high shares of solar PV in small isolated systems—A case of Kiribati. Renew. Energy 2017, 108, 589–597. [Google Scholar] [CrossRef]
- Yoo, K.; Park, E.; Kim, H.; Ohm, J.Y.; Yang, T.; Kim, K.J.; Chang, H.J.; Pobil, A.P. Optimized Renewable and Sustainable Electricity Generation Systems for Ulleungdo Island in South Korea. Sustainability 2014, 6, 7883–7893. [Google Scholar] [CrossRef] [Green Version]
- Ramírez Díaz, A.; Ramos-Real, F.J.; Marrero, G.A.; Perez, Y. Impact of Electric Vehicles as Distributed Energy Storage in Isolated Systems: The Case of Tenerife. Sustainability 2015, 7, 15152–15178. [Google Scholar] [CrossRef] [Green Version]
- Rojas, E.G.; Sadri, H.; Krueger, W. Case study of MW-sized power generation at St. Eustatius island combining photovoltaics, battery storage, and gensets. Prog. Photovolt. 2019. [Google Scholar] [CrossRef]
- Taibi, E.; del Valle, C.F.; Howells, M. Strategies for solar and wind integration by leveragingflexibility fromelectric vehicles: The Barbados case study. Energy 2018, 164, 65–78. [Google Scholar] [CrossRef]
- Iglesias, G.; Carballo, R. Wave resource in El Hierro—An island towards energy self-sufficiency. Renew. Energy 2011, 36, 689–698. [Google Scholar] [CrossRef]
- Canary Government. Anuario Energético de Canarias 2016; Consejería de Economía, Industria, Comercio y Conocimiento: Santa Cruz de Tenerife, Spain, 2017.
- Merriam Webster Dictionary. Available online: https://www.merriam-webster.com/dictionary/efficiency (accessed on 27 October 2019).
- Wang, C.N.; Nguyen, T.D.; Yu, M.C. Energy Use Efficiency Past-to-Future Evaluation: An International Comparison. Energies 2019, 12, 3804. [Google Scholar] [CrossRef] [Green Version]
- Maheshwari, Z.; Ramakumar, R. Smart Integrated Renewable Energy Systems (SIRES): A Novel Approach for Sustainable Development. Energies 2017, 10, 1145. [Google Scholar] [CrossRef]
- Duong, M.Q.; Pham, T.D.; Nguyen, T.T.; Doan, A.T.; Tran, H.V. Determination of Optimal Location and Sizing of Solar Photovoltaic Distribution Generation Units in Radial Distribution Systems. Energies 2019, 12, 174. [Google Scholar] [CrossRef] [Green Version]
- Merino, J.; Veganzones, C.; Sanchez, J.; Martinez, S.; Platero, C. Power System Stability of a Small Sized Isolated Network Supplied by a Combined Wind-Pumped Storage Generation System: A Case Study in the Canary Islands. Energies 2012, 5, 2351–2369. [Google Scholar] [CrossRef] [Green Version]
- Martínez-Lucas, G.; Sarasúa, J.; Sánchez-Fernández, J. Frequency Regulation of a Hybrid Wind-Hydro Power Plant in an Isolated Power System. Energies 2018, 11, 239. [Google Scholar] [CrossRef] [Green Version]
- Platero, C.A.; Nicolet, C.; Sánchez, J.A.; Kawkabani, B. Increasing wind power penetration in autonomous power systems through no-flow operation of Pelton turbines. Renew. Energy 2014, 68, 515–523. [Google Scholar] [CrossRef] [Green Version]
- Platero, C.; Sánchez, J.; Nicolet, C.; Allenbach, P. Hydropower Plants Frequency Regulation Depending on Upper Reservoir Water Level. Energies 2019, 12, 1637. [Google Scholar] [CrossRef] [Green Version]
- Sarasúa, J.; Martínez-Lucas, G.; Platero, C.; Sánchez-Fernández, J. Dual Frequency Regulation in Pumping Mode in a Wind-Hydro Isolated System. Energies 2018, 11, 2865. [Google Scholar] [CrossRef] [Green Version]
Figure 1.
El Hierro power system simplified one-line diagram.

Figure 2.
El Hierro power system daily generation and demand 25/11/2015. Source REE data.

Figure 3.
El Hierro power system daily generation and demand 19/02/2016. Source REE data.

Figure 4.
El Hierro power system daily generation and demand 06/08/2019. Source REE data.

Figure 5.
Wind turbine Enercon E-70 power curve.

Figure 6.
Pelton turbine efficiency curve.

Figure 7.
Power plant turbines efficiency curve.

Figure 8.
Pumps efficiency curves. (a) Fix speed pumps (b) Variable speed pumps.

Figure 9.
Pumping station efficiency curve.

Figure 10.
Annual demand covered by renewable energy for 2016.

Figure 11.
Annual demand covered by renewable energy for 2017.

Figure 12.
Operational efficiency for 2017.

© 2020 by the authors. Licensee MDPI, Basel, Switzerland. This article is an open access article distributed under the terms and conditions of the Creative Commons Attribution (CC BY) license (http://creativecommons.org/licenses/by/4.0/).
Share and Cite
MDPI and ACS Style
Briongos, F.; Platero, C.A.; Sánchez-Fernández, J.A.; Nicolet, C. Evaluation of the Operating Efficiency of a Hybrid Wind–Hydro Powerplant. Sustainability 2020, 12, 668. https://doi.org/10.3390/su12020668
AMA Style
Briongos F, Platero CA, Sánchez-Fernández JA, Nicolet C. Evaluation of the Operating Efficiency of a Hybrid Wind–Hydro Powerplant. Sustainability. 2020; 12(2):668. https://doi.org/10.3390/su12020668
Chicago/Turabian StyleBriongos, Francisco, Carlos A. Platero, José A. Sánchez-Fernández, and Christophe Nicolet. 2020. "Evaluation of the Operating Efficiency of a Hybrid Wind–Hydro Powerplant" Sustainability 12, no. 2: 668. https://doi.org/10.3390/su12020668
Note that from the first issue of 2016, this journal uses article numbers instead of page numbers. See further details here.