Abstract
According to the Ellen MacArthur Foundation, 73% of used clothing is landfilled or incinerated globally and greenhouse gas (GHG) emissions from fabric manufacturing in 2015 amounted to 1.2 billion tons. It must be reduced in the future, especially by reusing and recycling used clothing. Based on this perspective, researchers calculated the energy consumption and GHG emissions associated with reusing and recycling used clothing globally with a life cycle assessment (LCA). However, no study was conducted so far to estimate the total GHG emission reductions in Japan by reusing and recycling used clothing. In this study, the amount of used clothing currently discharged from households as combustible and noncombustible waste and their fiber types were estimated using literature. Then, the methods for reusing and recycling of used clothing were categorized into the following 5 types based on fiber type, that is, “reuse overseas,” “textile recycling to wipers,” “fiber recycling,” “chemical recycling” and “thermal recycling.” After that, by applying LCA, the GHG emission reductions by above 5 methods were estimated, based on the annual discharged weights of each fiber type. Consequently, the total GHG emissions reductions by reusing and recycling 6.03 × 10⁸ kg of used clothing totally were estimated around 6.60 × 10⁹ kg CO2e, to range between 6.57 × 10⁹ kg CO2e and 6.64 × 10⁹ kg CO2e, which depended on the type of “chemical recycling.” The largest contribution was “reuse overseas,” which was 4.01 × 10⁹ kg CO2e corresponded to approximately 60% of the total reduction. Where, it was assumed that used clothing were exported from Japan to Malaysia which was currently the largest importing country. In this case, GHG emissions to manufacture new clothing in China, the largest country currently to export them to Japan, can be avoided, which are 29.4 kg CO2e and 32.5 kg CO2e respectively for 1 kg jeans and 1 kg T-shirts. Adding the GHG emissions for overseas transportation to this, on average, 32.0 kg CO2e per kg of used clothing was reduced by “reuse overseas,” which was 19.6 times larger than GHG emissions by incineration, 1.63 kg CO2e per kg, in which carbon neutrality for cotton was not counted. As the result, the total GHG emission reductions above mentioned, around 6.60 × 10⁹ kg CO2e, corresponds to 70% of the GHG emissions by incineration of total household garbage in Japan.
1. Introduction
According to the Ellen MacArthur Foundation [1], greenhouse gas (GHG) emissions from fabric manufacturing in 2015 amounted to 1.2 billion tons and the United Nations Framework Convention on Climate Change estimated that fashion industry GHG emissions were approximately 10% of total global GHG emissions [2]. The global population is on the rise and is expected to reach 9.7 billion by 2050 [3] and clothing sales are projected to reach 160 million tons by 2050 [1]. The discharge of used clothing is also expected to increase.
The Ellen MacArthur Foundation [1] also reported that 73% of used clothing was landfilled or incinerated worldwide. Additionally, Allwood et al. [4] estimated that approximately 13% of textiles in the UK are recycled and reused, while the remaining textiles are landfilled or incinerated. In contrast, according to the Organization for Small & Medium Enterprises and Regional Innovation, JAPAN (SMRJ), 0.864 million tons of used clothing were discharged from households in Japan in 2009 and 27.3% (0.236 million tons) of the used clothing was reused or recycled [5].
As it is essential to reduce GHG emissions by reusing and recycling used clothing, it is vital to quantify the potential reduction in GHG emissions by reusing and recycling. The energy consumption and GHG emissions associated with reusing and recycling used clothing has been estimated by researchers using life cycle assessment (LCA), which is a tool for quantitatively evaluating environmental burden across the entire product life cycle.
Sandin et al. [6] reviewed 41 studies and reports and concluded that reusing and recycling textiles typically reduced the environmental impacts compared to incinerating and landfilling and that reusing was more beneficial than recycling. According to Woolridge et al. [7], the energy consumption for reusing 100% polyester clothing was 1.8% less than that of new materials and for reusing 100% cotton clothing it was 2.6% less than that of new materials. Farrant et al. [8] conducted an LCA of used T-shirts (100% cotton) and pants (65% polyester and 35% cotton) in Sweden, which were reused or recycled into wipers and they reported that if the clothing was reused, GHG emissions were reduced by 14% for T-shirts and 23% for pants. Bartl et al. [9] reported that the reuse of 1 ton of T-shirts (100% cotton) and blouses (100% rayon) can save 182 GJ and 229 GJ of energy, respectively. Zamani et al. [10] also reported that 10 ton CO2 can be reduced per ton of textile waste (50% cotton and 50% polyester) by integrating three recycling technologies (material reuse, cotton and polyester separation using N-methylmorpholine-N-oxide and polyester recycling).
In Japan, the Ministry of Economy, Trade and Industry (METI) investigated GHG emissions related to the manufacturing or recycling of products such as jackets, blousons and dresses [11]. However, no studies have estimated the total CO2 emission reduction due to reusing and recycling used clothing in Japan, consider the annual discharge amount of used clothing.
Therefore, in this study, to clarify the current used clothing situation in Japan, the amount and fiber types of discharged clothing were estimated from Japanese literature. Then, using an LCA, the GHG emissions that can be reduced by reusing and recycling used clothing discharged as combustible and/or noncombustible wastes in Japan were calculated.
2. Research Method
First, we estimated the amount of used clothing discharged from households in Japan based on the literature. Next, we allocated the clothing into fiber types and then we assumed how they were reused or recycled based on company interviews and the characteristics of the clothing fiber materials. Finally, we calculated the GHG emission reductions by reusing and recycling each clothing type in Japan.
All subjects gave their informed consent for inclusion before they participated in the study. The study was conducted in accordance with the Declaration of Helsinki, and the protocol was approved by the Ethics Committee of Kogakuin University.
3. Basic Data of This Study
3.1. Discharge Flow of Used Clothing in Japan
SMRJ conducted a consumer survey, compiling the amount of used clothing discharged from households in 2009 and how they were discharged [5]. The results are represented in Table 1. after being rearranged based on our analysis. In 2009, 8.64 × 10⁸ kg of used clothing was discharged from households. Approximately 17.8% of this clothing (1.54 × 10⁸ kg) was reutilized as used clothing, such as modified clothing, gifts and reused clothing sold back into the market. An additional 12.3% (1.06 × 10⁸ kg) were collected as resource materials by shops and local governments or through the voluntary actions of citizens. Approximately 70% of used clothing (6.03 × 10⁸ kg) was discharged as combustible and/or non-combustible waste, which were considered to be reused and/or recycled from the viewpoint of a reduction in GHG emissions. In this study, we assumed that this amount was reused and/or recycled in Japan to calculate the potential GHG emission reductions.

Table 1.
Weights and destinations of used clothing discharged from Japanese households in 2009 (Reedit of data from SMRJ [5]).
3.2. Type of Clothing Discharged from Households
SMRJ also conducted a consumer survey regarding the types of used clothing discharged from households [5]. Based on the results, we allocated the 6.03 × 10⁸ kg of used clothing that was discharged as combustible and/or noncombustible waste by clothing type. Columns (a), (b) and (c) of Table 2 display the results of the estimated weights of each used clothing type.
Table 2.
Reusing and recycling methods, used clothing weight and greenhouse gas (GHG) emission reductions.
4. Interviews with Companies on Reusing and Recycling
4.1. Nakano & Co., Ltd.
We visited the Hadano Plant of Nakano & Co., Ltd. [16], a used clothing wholesaler and learned about the amount of clothing handled, separation system, recycling methods of each used clothing type and wiper manufacturing method. There are three sources of used clothing for Nakano & Co., Ltd.: in-store recycling, citizen collection and local government collection. Approximately 80% to 90% of the used clothing provided to Nakano & Co., Ltd. can still be worn but as many countries restrict the import of used clothing, they cannot easily be exported overseas. Presently, the reuse percentage is approximately 27.0% for the used clothing (25.7% overseas and 1.3% domestic), 22.5% is converted into wipers, 40.5% is utilized as reclaimed fiber felt and 10.0% is incinerated. Used summer, children and baby clothing are in high demand overseas. In contrast, winter clothing such as coats, sweatshirts, sweaters and suits are in lower demand in Southeast Asia and Africa. They are reprocessed into reclaimed fiber felt because they cannot be used as wipers. Reclaimed fiber felt is pressed fiber that is mechanically returned to fabric fiber. As it has excellent properties for heat insulation and cushioning, it is commonly used for automobile interior materials.
Skirts are also in low demand because of religious reasons and varying body shapes. These items are also reprocessed into reclaimed fiber felt. Used clothing, primarily that made of cotton, is exported from Japan to the Philippines, reprocessed into wipers and then re-imported into Japan due to the lower manufacturing costs in the Philippines compared to those in Japan. To reduce incineration wastes, the wiper fabric is not cut in squares but in the approximate size required after removing hard parts such as buttons and collars.
4.2. Wacoal Holdings Corp. and Japan-Waste Co., Ltd.
Wacoal Holdings Corp. collects used brassieres in their stores and reprocesses them into solid refuse paper and plastic fuel (RPF) at the facility of their partner Japan-Waste Co., Ltd. [17]. We visited both companies and learned about the collection method and energy consumption required for manufacturing RPF.
Wacoal Holdings Corp. began recycling brassieres in 2008 and they collected 2.79 × 10⁴ kg (approximately 2.79 × 10⁵ pieces) of brassieres in 2018 [18]. Recycling activities led to sales promotions as a corporate advantage and they were also beneficial to consumers because brassieres are difficult to dispose of as household garbage.
Japan-Waste Co., Ltd. [17] manufactures a variety of RPF fuels with different calorific values using plastic, paper, wood and fiber waste as the raw materials which are supplied by customers such as paper and textile companies. However, a small amount of fiber waste is currently used. The price of RPF is less than half of that of coal and manufacturing 1 kg of RPF currently requires 3.60 × 10² kJ of energy.
5. Estimations of Material Compositions of Each Used Clothing Fabric Type and GHG Emissions from Manufacturing
Although the GHG emission reduction calculation details are described in Section 6, the GHG emissions related to manufacturing each clothing type must be calculated because they can be avoided by reusing and recycling used clothing. Column (e) in Table 2 displays the GHG emissions from manufacturing each clothing type in column (b), which were defined using research by Yuan et al. [14], Levi Strauss & Co. [15], METI [11] and the Japan Environmental Management Association for Industry (JEMAI) [12,13]. These studies are indicated in column (f) as the source of the GHG emission estimations and the material composition of the closing is displayed in column (d). The material composition of the used clothing discharged from households may be different from the composition in column (d) but they were assumed to be the same for the purposes of this study.
“Polyester” is a general name for polymers whose main chains are connected by ester bonds but the polyester used in clothing is primarily polyethylene terephthalate (PET). Therefore, hereinafter, polyester is referred to as PET.
The system boundaries for the GHG emission calculations differ in the literature. Therefore, in this study, they were adjusted to be from raw material production to distribution. For example, because the data of JEMAI [12], Yuan, Z. [14] and Levi Strauss & Co. [15] include the use and disposal stages, they were excluded from this study. In addition, it must be noted that each manufacturing area is different; Yuan, Z. [14] is in China, Levi Strauss & Co. [15] is in the United States and METI [11] and JEMAI [12] are in Japan.
As the weight of a pair of jeans was unclear in Levi Strauss & Co. [15], which showed their GHG emissions, it was assumed to be 0.68 kg based on a report by the California Cotton Ginners & Growers Association [19].
6. Assuming Types of Reuse and Recycling and Calculation of GHG Emission Reductions by Them
Based on the fiber composition for each type of used clothing shown in column (d) in Table 2 and based on the interview with Nakano & Co., Ltd. [16] in Section 4.1., the recycling methods for each type of used clothing were assumed and are illustrated in column (h) in Table 2.
As much of the used clothing discharged from households can still be worn and as it is difficult to separate the fiber combinations into each material type, it was assumed in this study that the collected used clothing, such as the 6.35 × 10⁷ kg of T-shirts (1) in column (a) in Table 2, 2.01 × 10⁷ kg of jean pants/skirts, 3.50 × 10⁷ kg of child clothing and 6.83 × 10⁶ kg of infant clothing were reused in Southeast Asia where there is high demand. We categorized the above used clothing as Group 1 to calculate the GHG emission reductions in this study.
3.60 × 10⁷ kg of 100% cotton one-pieces (5) in column (a) in Table 2 and 5.53 × 10⁷ kg of underwear were assumed to be reprocessed into wipers because of their low demand in Southeast Asia and their excellent water and oil absorption capabilities. Wipers are industrial dust cloths are used to water and oil removal in factories. Therefore, cloths containing cotton or rayon are preferred. In particular, used clothing made of cotton, from which the fiber oil had been removed after repeated washing, is considered to be of suitable quality for wipers. We categorized the above used clothing as Group 2 to calculate GHG emission reductions in this study.
Cotton chemical recycling has also been studied (Nakano, S. [20]; Shikoku Bureau of Economy, Trade and Industry [21]; SMRJ [5]; Industrial Structure Council Industrial Science Technology Policy Committee Evaluation Subcommittee [22]; Japan Environment Planning. Co., Ltd. [23]). However, due to not being implemented in practice, cotton chemical recycling was not evaluated in this study. Other clothing types, specifically 1.42 × 10⁸ kg of thick coats and Japanese Kimonos (7) in column (a) in Table 2 5.43 × 10⁷ kg of light coats and blousons, 4.55 × 10⁷ kg of jackets, blazers and suits (outerwear), 6.56 × 10⁷ kg of sweaters, trainers and jerseys (outerwear) and 5.46 × 10⁶ kg of accessories (mufflers, handkerchiefs, etc.) were assumed to be reprocessed into reclaimed fiber felt because these clothing types had mixed fiber compositions and were unsuitable for reuse in Southeast Asia.
We categorized the above used clothing as Group 3 to calculate GHG emission reductions in this study.
In addition, 4.38 × 10⁷ kg of 100% PET shirts and blouses (12) in column (a) in Table 2 and 2.97 × 10⁷ kg of pants, skirts and slacks (other than jeans), were assumed to be chemically recycled or used for thermal recovery because the chemical recycling of beverage PET bottles has gained attention recently in Japan; however, much of the used clothing made of PET that is discharged from households is still incinerated as municipal waste, although it can be recycled chemically like beverage PET bottles. We categorized the above used clothing as Group 4 to calculate GHG emission reductions in this study. For this group, both chemical and thermal recycling were assumed in this study and compared the GHG emission reductions by both recycling systems. The GHG emission reduction calculations for Groups 1 to 4 are described in the following sections.
6.1. Calculation of GHG Emission Reductions in Group 1 (Reuse Overseas)
There are two ways to reuse used clothing: paid and free. For example, Fast Retailing Co., Ltd. [24] exports used clothing for free as relief goods through the United Nations International Children’s Emergency Fund. In contrast, other clothing is sorted and exported from Japan by wholesalers and sold as used clothing in Southeast Asia and Africa. According to the Ministry of Finance Trade Statistics (H. S. Code 6309) [25], 2.37 × 10⁸ kg of used clothing was exported from Japan in 2018.
According to Nakano Co., Ltd., more than 90% of reused clothing is exported overseas. In this study, it was assumed that 1.25 × 10⁸ kg of the Group 1 used clothing were reused in Malaysia (Scenario (I)), which is the scenario for overseas reuse because the largest amount clothing exported from Japan.
To compare Scenario (I), it was assumed in the non-recycled Scenario (II) that the used clothing was incinerated in Japan, which is the current situation and that 1.25 × 10⁸ kg of new clothing, the same amount exported from Japan to Malaysia in Scenario (I), were assumed to be produced in China and transported to Malaysia for the Malaysian people to wear.
In these scenarios, it was assumed that the period of use for the newly manufactured and used clothing in Malaysia were the same and that no GHGs were emitted by their incineration because they were made of cotton, which is carbon neutral. In addition, washing and drying at the use stage were excluded from the GHG calculations because they were the same in both scenarios.
Scenario (I): Collection of used clothing (Japan) → Transportation to Malaysia → Reuse (Malaysia) → Incineration (Malaysia).
Scenario (II): Collection of used clothing (Japan) → Incineration (Japan) + Manufacturing of new clothing (China) → Transportation to Malaysia → Use (Malaysia) → Incineration (Malaysia).
To compare Scenarios (I) and (II), GHG emissions due to transportation in Scenarios (I) and (II) and manufacturing of the new clothing in China in Scenario (II) were calculated because GHG emissions for the collection of used clothing were the same in both scenarios.
In Scenario (I), the used clothing was transported by container ship from the Yokohama Port in Japan to the Klang Port in Malaysia, which are 5.73 × 10³ km apart [26]. The GHG emissions for the container ship transportation were 1.00 × 10⁻² kg CO2e/ (t km) [27] (Table A1). Ground transportation in Japan and Malaysia were excluded due to the wide variety of transportation routes. Table 3 shows that the transportation GHG emissions were 7.20 × 10⁶ kg CO2e.
Table 3.
GHG emissions of transportation of used clothing from Japan to Malaysia and newly manufactured clothing from China to Malaysia.
In Scenario (II), the GHG emissions were calculated when a total of 1.25 × 10⁸ kg of T-shirts, jean pants/skirts, child clothing and infant clothing were newly manufactured in China and transported to Malaysia. Based on column (e) in Table 2, the GHG emissions from the new clothing manufacturing were 4.02 × 10⁹ kg CO2e as shown in column (g) in Table 2. In terms of transportation, the newly manufactured clothing in the Guangdong Province, the largest Chinese apparel manufacturing area, is transported from the Guangzhou Port in China to Klang Port in Malaysia. The voyage distance was 3.11 × 10³ km [26] and the GHG emissions were 3.91 × 10⁶ kg CO2e using 1.00 × 10⁻² kg CO2e/(t km) for the container ship [27] (Table A1) (Table 3). Therefore, the total GHG emissions in Scenario (II) were 4.02 × 10⁹ kg CO2e. The GHG emissions from transportation were small and it is possible to reduce the 4.01 × 10⁹ kg CO2e of emissions by reusing 1.25 × 10⁸ kg of used clothing, which is similar to the GHG emissions from manufacturing new clothing in China, which corresponds to 3.20 × 101 kg CO2e of GHGs per 1 kg of used clothing.
6.2. Calculation of Group 2 GHG Emission Reductions (Textile Recycling to Wipers)
To be more cost effective, Nakano Co., Ltd. sorted the Japanese used clothing and exported it to the Philippines. Then, after it was reprocessed into wipers, the wipers were re-imported to Japan. Here, the following two scenarios were compared.
In Scenario (I), it was assumed that 9.13 × 10⁷ kg of Group 2 100% cotton clothing, as shown in Table 2, were exported to the Philippines and reprocessed into wipers. Afterwards, they were re-imported to Japan, used and then incinerated.
In Scenario (II), it was assumed that the used clothing was incinerated in Japan, which was assumed without any energy recovery and that newly manufactured cotton cloths were used instead of the wipers manufactured in the Philippines from used clothing.
Scenario (I): Collection of used clothing (Japan) → Transportation to the Philippines → Reprocessing of wipers (the Philippines) → Transportation to Japan → Use (Japan) → Incineration (Japan).
Scenario (II): Collection of used clothing (Japan) → Incineration (Japan) + Manufacture new wipers (Japan) → Use (Japan) → Incineration (Japan).
As the used clothing and new wipers were assumed to be 100% cotton, GHGs were not emitted in their incineration because cotton is carbon neutral. Domestic transportation was also not considered.
To compare Scenarios (I) and (II), only the GHG emissions for transporting the used clothing and reprocessing wipers from the used clothing in Scenario (I) and manufacturing new wipers in Scenario (II) must be calculated.
First, for Scenario (I), when reprocessing the used clothing into wipers, used clothing parts such as buttons and collars were removed. As the yield was 72.8% [11], the remaining cotton cloths were 6.65 × 10⁷ kg. The GHG emissions of reprocessing wipers from 4.53 × 10⁻² kg CO2e/kg of used clothing were cited from Reference [11] (Table A1). Therefore, the GHG emissions of reprocessing 6.65 × 10⁷ kg of wipers were 3.01 × 10⁶ kg CO2e. As the round-trip distance is 6.54 × 10³ km [26], the GHG emissions were 5.17 × 10⁶ kg CO2e using 1.00 × 10⁻² kg CO2/ (t km) for container shipping [27] (Table A1). As a result, a total of 8.18 × 10⁶ kg CO2e emissions were calculated from wiper reprocessing from 9.13 × 10⁷ kg of used clothing and their transportation, as shown in Table 4.
Table 4.
GHG emissions for reprocessing Group 2 clothing to wipers (Scenario (I)).
For Scenario (II), as the GHG emissions from manufacturing cotton cloths (new cotton wipers) were 4.61 kg CO2e/kg, which was cited from METI [11] (Table A1), manufacturing 6.65 × 10⁷ kg of new cotton wipers, which was the same amount as that in Scenario (I), resulted in GHG emissions of 3.06 × 10⁸ kg CO2e.
Comparing these two scenarios, GHG emissions of 2.98 × 10⁸ kg CO2e can be reduced by reprocessing 9.13 × 10⁷ kg of used one-pieces and underwear. This means that 3.27 kg CO2e can be reduced per kg of used clothing.
6.3. Calculation of Group 3 GHG Emission Reductions (Fiber Recycling (Reclaimed Fiber Felt))
It was assumed that the reclaimed fiber felt was reprocessed from the Group 3 used clothing, which totaled 3.13 × 10⁸ kg, as shown in Table 2. In this study, the following two scenarios were compared.
Scenario (I): Collection of used clothing (Japan) → Reprocessing reclaimed fiber felt (Japan) → Use (Japan) → Incineration (Japan).
Scenario (II): Collection of used clothing (Japan) → Incineration (Japan) + Manufacturing new PET felt (Japan) → Use (Japan) → Incineration (Japan).
It was assumed that the reclaimed fiber felt reprocessed from the used clothing replaced the new manufacturing of PET interior material (Scenario (I)). In addition, the GHG emissions from incineration of the reclaimed fiber felt made of the used clothing in Scenario (I) (including the loss) and that from the incineration of the used clothing in Scenario (II) were not calculated because they emitted the same amount of GHG emissions. To compare the two scenarios, the GHG emissions from manufacturing the reclaimed fiber felt (Scenario (I)) and those from manufacturing and incinerating new PET felt (Scenario (II)) were calculated.
In Scenario (I), the collected used clothing was crushed using a breaker treatment and solid parts such as buttons were removed by a cyclone separator. Afterwards, the cloths were sprayed with a flame retardant and cured. Then, they were fiberized with a reclaimed fiber machine. The cloth lost during the felt production process was incinerated. As the yield of reclaimed fiber felt from used clothing was 87.0% after removing buttons and so forth [28], 2.72 × 10⁸ kg of the reclaimed fiber felt were manufactured from 3.13 × 10⁸ kg of used clothing.
NCS & Co., Ltd. [28] reported that 5.50 × 10⁻¹ kWh of electricity were required to manufacture 1 kg of reclaimed fiber felt from used clothing, of which the GHG emissions were 3.62 × 10⁻¹ kg CO2e, using 6.58 × 10⁻¹ kg CO2/kWh in Japan [27] (Table A1). Therefore, the GHG emissions for manufacturing 2.72 × 10⁸ kg of reclaimed fiber felt from the used clothing were 9.85 × 10⁷ kg CO2e.
For Scenario (II), the GHG emissions from the production of 1 kg of new PET staple was 5.56 kg CO2e/kg according to IDEA [27] (Table A1). The process data for manufacturing PET felt from the new PET staple was determined by METI [11], where the production yield of new PET felt was 98.0% and 9.30 × 10⁻² kWh of electricity was required to produce1 kg of new PET felt. This means that 1.02 kg of new PET staple was required, with GHG emissions of 5.67 kg CO2e (= 5.56 × 1.02) and the GHG emissions due to electricity consumption were 6.12 × 10⁻² kg using 6.58 × 10⁻¹ kg CO2e/kWh in Japan [27] (Table A1). The total GHG emissions for the production of 1 kg of new PET felt were 5.73 kg CO2e.
In addition, the GHG emissions from the incineration of new PET felt were calculated as follows using stoichiometry and [C10H8O4 (M = 192)] (Table A1).
(OOC-C6H4-COOCH2CH2)n + O2 → 10CO2 + 4H2O
GHG emissions per kg of PET = 440 kg CO2 ÷ 192 kg PET = 2.29 kg CO2/kg PET.
In Scenario (II), the production of 1.02 kg of the new felt, including the incinerated manufacturing loss material, resulted in GHG emissions of 2.34 (= 1.02 × 2.29) kg CO2e.
As the GHG emissions for the production and incineration of 1 kg of new PET felt were 8.07 (= 5.73 + 2.34) kg CO2e, the GHG emissions for Scenario (II), in which 2.72 × 10⁸ kg of the new PET felt were produced and incinerated, were 2.20 × 10⁹ kg CO2e.
Comparing Scenarios (I) and (II), 2.10 × 10⁹ kg CO2e can be reduced by reprocessing 3.13 × 10⁸ kg of used clothing into reclaimed fiber felt. The GHG emission reductions per kg of used clothing were 6.71 kg CO2e/kg.
6.4. Calculation of Group 4 GHG Emission Reductions (Chemical Recycling and/or Thermal Recycling (RPF))
As mentioned previously, for the Group 4 used clothing, which was made of PET and was 7.35 × 10⁷ kg in total, both chemical and thermal recycling were assumed and the GHG emission reductions in both cases were calculated.
6.4.1. Chemical Recycling
In the case of chemical recycling, it is possible to produce the same quality of PET from used clothing as new virgin products because recycled PET is obtained by repolymerizing the monomer that is derived from chemical recycling. In this study, the GHG emission reductions by chemical recycling were calculated by comparing the following two scenarios—Scenario (I) (chemical recycling) and Scenario (II) (no recycling).
Scenario (I): Collection of used clothing → Production of PET via chemical recycling (Japan).
Scenario (II): Collection of used clothing → Incineration (Japan) + Production of virgin PET (Japan).
Two methods PET chemical recycling have been developed in Japan, the Aies [29,30] and Teijin (Ethylene glycol (EG) decomposition/transesterification method) [29,31,32] methods, which are shown in Figure 1a,b.
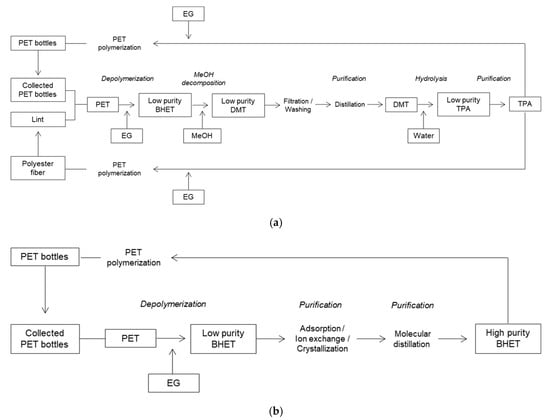
Figure 1.
(a) Aies method: chemical recycling flow of PET (Created from METI [29]). PET: polyethylene terephthalate EG: ethylene glycol. BHET: bis (2-hydroxyethyl) terephthalate and (b) Teijin method (EG decomposition/transesterification method): Chemical recycling flow of PET (Created from METI [29]). PET: polyethylene terephthalate EG: ethylene glycol. BHET: bis (2-hydroxyethyl) terephthalate DMT: dimethyl terephthalate.
While the target of the Aies method is PET beverage bottles, the Teijin method can theoretically treat fabrics with more than 80% PET because it can efficiently separate and remove other materials such as cotton, processing agents, dyes and buttons. However, it currently targets work and/or school uniforms that consist of only PET.
For Scenario (I), the GHG emissions of chemically recycled PET produced using the Aies method is 1.98 kg CO2e/kg of recycled PET [30] (Table A1).
In the Teijin method, PET is produced by recycled EG reacting with recycled DMT. The GHG emissions to produce DMT from used clothing were 1.27 kg CO2e/kg of DMT [11] and the process data from DMT to PET production was cited by PE Americas [33]. Table 5 shows the GHG emissions of the Teijin method. The calculation result of the GHG emissions to produce chemically recycled PET using the Teijin method was 2.13 kg CO2e/kg of recycled PET (Table A1); methanol was excluded because it was reused.
Table 5.
Teijin method GHG emissions (Process data from PE Americas [33]).
For Scenario (I), as chemical recycling can produce PET of the same quality as the virgin products, it can be recycled indefinitely and does not require incineration. However, for Scenario (II), the GHG emissions of 2.29 kg CO2e/kg of PET were emitted from the incineration of the used clothing, which was calculated using Equation (2). Therefore, the production of virgin PET was required and the resulting GHG emissions were 2.89 kg CO2e/kg of PET, based on IDEA [27] (Table A1). In total, 5.18 kg CO2e/kg of PET were calculated for Scenario (II).
The GHG emission reductions per kg of Group 4 used clothing, which were made of 100% PET (= Scenario (I) − Scenario (II)), using the Aies method was 3.20 (= 5.18 − 1.98) kg CO2e/kg of recycled PET and 3.06 (= 5.18 − 2.13) kg CO2e/kg of recycled PET for the Teijin method. Comparing the two methods, the Aies method has a slightly larger GHG reduction than that of the Teijin method.
6.4.2. Thermal Recycling
Thermal recycling is a recycling method where thermal energy generated by incineration is recovered and RPF is manufactured from used clothing by mixing it with paper, wood, plastic and so forth. RPF has advantages such as stable quality and sufficient handling properties for transportation and storage. RPF can be used as a substitute for coal for boilers such as those of paper companies [36]. In this study, it was assumed that a total of 7.35 × 10⁷ kg of Group 4 used clothing were reprocessed into RPF, which was the same amount of clothing chemically recycled in the Section 6.4. 1 Scenarios.
In this study, the GHG emissions in Scenario (I), where RPF derived from used clothing was incinerated as fuel, were compared those in Scenario (II), where the used clothing was incinerated as general waste without any energy recovery and the steam coal equivalent to the RPF energy was used.
Scenario (I): Collection of used clothing (Japan) → Manufacturing RPF (Japan) → Use (Incineration) (Japan).
Scenario (II): Collection of used clothing (Japan) → Incineration (Japan) + Production (import average) and use of steam coal equivalent for energy obtained by incineration of 1 kg of RPF (Japan).
As the used clothing (Scenario (I)) and RPF made from the used clothing (Scenario (II)) were considered to exhibit the same composition, the GHG emissions for both incinerations were excluded from the calculation. To obtain the GHG emission reductions by thermal recycling, the GHG emissions for the RFP manufacturing (Scenario (I)) and production and use of the steam coal equivalent to the energy obtained by the incineration of 1 kg RPF were calculated.
For Scenario (I), an interview by Nippon West Co., Ltd., described in Section 4.1, revealed that the energy required to manufacture 1 kg of RPF was 3.60 × 10² kJ and the production yield was 100%.
For Scenario (II), the energy obtained by the incineration of 1 kg of RPF was calculated. The combustion heat of PET is 2.28 × 10⁴ kJ/kg of PET [37] (Table A1) was assumed to be the same as that of RPF; therefore, the energy obtained by the incineration of RPF was 2.28 × 10⁴ kJ/kg-RPF, which must be supplied by steam coal.
To calculate the GHG emission reductions, the difference in GHG emissions between scenarios (I) and (II) can be calculated. If the RPF manufacturing energy, 3.60 × 10² kJ/kg of RPF, was supplied by steam coal, then the GHG emissions of 2.25 × 10⁴ kJ of steam coal (= (2.28 × 10⁴ kJ-RPF combustion energy) − (3.60 × 10² kJ-RPF manufacturing energy) can be calculated, which was 8.75 × 10⁻¹ kg of steam coal when using 25.7 MJ/kg [34] as the combustion heat of steam coal. As the GHG emissions for the production of 1 kg of steam coal were 2.09 × 10⁻¹ kg CO2e based on IDEA [27] (Table A1) and the GHG emissions for the combustion of 1 kg of steam coal were 2.33 kg CO2e based on MOE [34], the GHG emissions for the production and combustion of 1 kg of steam coal were considered to be 2.54 kg CO2e. Therefore, 2.22 (= 8.75 × 10−1 × 2.54) kg CO2e/kg of RPF can be reduced by utilizing RPF, which was the same as the GHG emission reductions of 1 kg of used clothing because the RPF manufacturing yield from the used clothing was 100%. The total GHG emission reductions for 7.35 × 10⁷ kg of Group 4 used clothing were 1.63 × 10⁸ kg CO2e.
For Scenario (II), it was assumed that there was no thermal recovery from incineration. However, as 68.4% of municipal waste incineration facilities in Japan utilize the residual heat [38], the GHG emission reductions per 1 kg of used clothing may be smaller than 2.22 kg CO2e/kg.
6.4.3. Comparison of Group 4 GHG Emission Reductions
In this study, the GHG emission reductions of the Group 4 used clothing were calculated and are shown in column (i) in Table 2 and they were calculated based on the GHG emission reductions for 1 kg of used clothing. The GHG emission reductions were 3.20 kg CO2e, 3.11 kg CO2e and 2.22 kg CO2e for 1 kg of used clothing using the Aies chemical recycling method, Teijin chemical recycling method and thermal recycling, respectively.
The chemical recycling GHG emission reductions were slightly larger than those of thermal recycling. In chemical recycling, the GHG emissions from the incineration of PET can be avoided, while in thermal recycling, only the GHG emissions from the incineration of steam coal that are equivalent to the energy obtained by the production and use of RPF made from used clothing can be avoided. The RFP manufacturing energy was not small enough to be ignored.
7. Conclusions
The total GHG emission reductions by reusing and recycling 6.03 × 10⁸ kg of the used clothing discharged from households as combustible and/or non-combustible waste were 6.57 × 10⁹ kg CO2e to 6.64 × 10⁹ kg CO2e, which was dependent on the recycling method. This corresponded to about 70% of the GHG emissions from incineration of household garbage in Japan. This large reduction was caused by reusing of the used clothing made of cotton. However, it can be considered to be no GHG emission due to carbon neutral. For example, reuse of the used jeans and T-shirts can reduce 2.94 × 101 kg CO2e/kg-jeans-manufacturing and 3.25 × 101 kg CO2e/kg-T-shirts-manufacturing, respectively. But, they emitted only 1.63 kg CO2e/kg when they were incinerated, which did not considered carbon neutral.
Comparing the GHG emission reductions for 1 kg of the used clothing, 3.20 × 101 kg CO2e, 3.27 × 101 kg CO2e and 6.71 × 101 kg CO2e emission reductions were calculated for reuse overseas (Section 6.1), reprocessing into wipers (Section 6.2) and reprocessing into reclaimed fiber felt (Section 6.3), respectively. As previously mentioned, the emission reductions were 3.20 kg CO2e, 3.06 kg CO2e and 2.22 kg CO2e for 1 kg of used clothing by chemical recycling utilizing the Aies method, chemical recycling utilizing the Teijin method and thermal recycling, respectively (Section 6.4).
The Japanese Basic Law for Establishing the Recycling-based Society [39] recommends naming recycling 3R, (for reduce, reuse and recycle). In this study, the reuse (reuse overseas) GHG emission reductions were greater than those of recycling (reprocessing into wipers or reclaimed fiber felt and chemical recycling) because when reusing, GHG emissions for the production of virgin materials can be avoided. When recycling, GHG emissions for the production of virgin materials cannot be avoided but the GHG emissions for the incineration of used clothing can be avoided compared to the non-recycling case. The GHG emission reductions of thermal recycling were the smallest of the recycling methods considered in this study. Therefore, we should reuse and/or recycle used clothing, with incineration as a last resort.
Of the reusing and recycling methods evaluated in this paper, the greatest GHG emission reductions per kg of used clothing were for clothing reuse. As the population of Asia and Africa is expected to increase in the future, the demand for used clothing discharged from developed countries is also expected to increase. However, many countries regulate the importation of used clothing to protect public health and local industries. Lastly, it is necessary to develop technologies for recycling various clothing materials and to collaborate with stakeholders, such as material manufacturers, apparel manufacturers and retail stores.
Author Contributions
Conceptualization, A.I.; investigation, M.I., Y.S. and T.S.; writing—original draft preparation, T.S., Y.S. and A.I.; writing—review and editing, Y.S. and A.I.; All authors have read and agreed to the published version of the manuscript.
Funding
The authors received no specific funding for this work.
Conflicts of Interest
The authors declare no conflict of interest.
Appendix A
Table A1.
GHG emissions per unit.
Table A1.
GHG emissions per unit.
| Item | GHG Emissions per Unit | Details | |
|---|---|---|---|
| Sea transportation | 1.00 × 10⁻² | kg CO2e/t km | IDEA (451200108) [27], Container ship transportation, >4000TEU |
| PET incineration | 2.29 × 100 | kg CO2e/kg | Calculated from stoichiometry |
| Cotton incineration | 1.63 × 100 | kg CO2e/kg | Calculated from stoichiometry |
| Used clothing-derived wipers manufacturing | 4.53 × 10⁻² | kg CO2e/kg | METI [11], LCA report on textile products |
| New cotton wipers manufacturing | 4.61 × 100 | kg CO2e/kg | METI [11], LCA report on textile products |
| New polyester staple production | 5.56 × 100 | kg CO2e/kg | IDEA (174213000) [27], Polyester staple |
| Electric power | 6.58 × 10⁻¹ | kg CO2e/kWh | IDEA (331128014) [27], Electric power, KYUSHU ELECTRIC POWER CO., INC., 2014 |
| Virgin polyester resin produciton by IDEA | 2.89 × 100 | kg CO2e/kg | IDEA (173526000) [27], Polyethylene terephthalate |
| Chemical recycling PET resin production by Aies method | 1.98 × 100 | kg CO2e/kg | Sugimoto, T. [30], A Recycling Technology for Waste PET Bottles: A LCI Analysis of Aies method Chemical Recycling Process |
| DMT production from waste PET products by Teijin method | 2.13 × 100 | kg CO2e/kg | METI [11], LCA report on textile products |
| RPF manufacturing energy | 7.35 × 10⁷ | kJ/kg | Hearings from Nippon West Co., Ltd. [17] |
| Heat of combustion of polyester | 2.28 × 10⁴ | kJ/kg | Okochi, F. et al. [36], Evaluation of Security from Heat of Combustion of Textiles with and without Flame Retardant Finishes |
| Thermal coal production | 2.09 × 10⁻¹ | kg CO2e/kg | IDEA (051112102) [27], Thermal coal, Import |
| Low calorific value of thermal coal | 2.57 × 101 | MJ/kg | MOE [37], List of calculation methods/emission factors in the calculation/report/publication system |
| Thermal coal use | 9.06 × 10⁻² | kg CO2e/MJ | MOE [37], List of calculation methods/emission factors in the calculation/report/publication system |
References
- Ellen MacArthur Foundation. A New Textiles Economy: Redesigning Fashion’s Future. Available online: https://www.ellenmacarthurfoundation.org/assets/downloads/publications/A-New-Textiles-Economy_Full-Report_Updated_1-12-17.pdf (accessed on 13 June 2020).
- United Nations Climate Change. UN Helps Fashion Industry Shift to Low Carbon. Available online: https://unfccc.int/news/un-helps-fashion-industry-shift-to-low-carbon (accessed on 13 June 2020).
- United Nations Department of Economic and Social Affairs. Growing at a Slower Pace, World Population is Expected to Reach 9.7 Billion in 2050 and Could Peak at Nearly 11 Billion around 2100. Available online: https://www.un.org/development/desa/en/news/population/world-population-prospects-2019.html (accessed on 13 June 2020).
- Allwood, J.M.; Laursen, S.E.; de Malvido Rodriguez, C.; Bocken, N.M.P. Well Dressed? The Present and Future Sustainability of Clothing and Textiles in the United Kingdom; Institute for Manufacturing University of Cambridge: Cambridge, UK, 2006. [Google Scholar]
- Organization for Small & Medium Enterprises and Regional Innovation, JAPAN. Textile Product 3R Related Research Business Report. Available online: https://warp.da.ndl.go.jp/info:ndljp/pid/6020255/www.smrj.go.jp/keiei/seni/info/pub/053267.html (accessed on 13 June 2020).
- Sandin, G.; Peters, G.M. Environmental impact of textile reuse and recycling—A review. J. Clean. Prod. 2018, 184, 353–365. [Google Scholar] [CrossRef]
- Woolridge, A.C.; Ward, G.D.; Phillips, P.S.; Collins, M.; Gandy, M. Life cycle assessment for reuse/recycling of donated waste textiles compared to use of virgin material: An UK energy saving perspective. Resour. Conserv. Recycl. 2006, 46, 94–103. [Google Scholar] [CrossRef]
- Farrant, L.; Olsen, S.I.; Wangel, A. Environmental benefits from reusing clothes. Int. J. Life Cycle Assess. 2010, 15, 726–736. [Google Scholar] [CrossRef]
- Bartl, A. Fiber Recycling: Potential for Saving Energy and Resources; International Solid Waste Association World Congress; Available online: https://www.iswa.org/uploads/tx_iswaknowledgebase/paper11.pdf (accessed on 13 June 2020).
- Zamani, B.; Svanström, M.; Peters, G.; Rydberg, T. A Carbon Footprint of Textile Recycling: A Case Study in Sweden. J. Ind. Ecol. 2014, 19, 676–687. [Google Scholar] [CrossRef]
- Ministry of Economy, Trade and Industry. LCA Report on Textile Products—Updated Version and Data Related to Data Correction Such as Dyeing Process; Ministry of Economy, Trade and Industry: Tokyo, Japan, 2009.
- Japan Environmental Management Association for Industry, Chiyoda-ku, Tokyo. CFP Program: CR-AO04-13002. 2014. Available online: https://www.cfp-japan.jp/ (accessed on 13 June 2020).
- Japan Environmental Management Association for Industry, Chiyoda-ku, Tokyo. CFP Program: CR-AO03-12009. 2012. Available online: https://www.cfp-japan.jp/ (accessed on 13 June 2020).
- Yuan, Z. Life cycle assessment of cotton T-shirts in China. Int. J. Life Cycle Assess. 2015, 20, 994–1004. [Google Scholar] [CrossRef]
- Levi Strauss & Co. The Life Cycle of a Jean. Available online: https://www.levistrauss.com/wp-content/uploads/2015/03/Full-LCA-Results-Deck-FINAL.pdf (accessed on 13 June 2020).
- Nakano & Co., Ltd. Available online: https://www.nakano-inter.co.jp/ (accessed on 13 June 2020).
- Japan-Waste Co., Ltd. Available online: http://www.japan-waste.co.jp/main.html (accessed on 13 June 2020).
- Wacoal Holdings Corp. We Reprocessed the Brassier Collected from the 2018 Wacoal Bra Recycling Campaign into 27.9 tons of RPF (Industrial Solid Fuel). Available online: https://www.wacoal.jp/news/newsrelease/201805/release26673.html (accessed on 11 April 2019).
- California Cotton Ginners & Growers Association. How Much Cotton Does It Take? Available online: https://ccgga.org/cotton-information/much-cotton-take/ (accessed on 13 June 2020).
- Nakano, S.; Higashiyama, Y.; Furuya, M. Development of continuous processing technology for ethanol production from cotton fiber. Hyogo Prefect. Inst. Technol. Res. Rep. 2016, 25, 45–46. [Google Scholar]
- Shikoku Bureau of Economy, Trade and Industry. Development of High-Efficiency Bioethanol Production Technology from Cotton Fiber with Advanced Weave Dyeing Technology—R & D Results Report. Available online: https://www.chusho.meti.go.jp/keiei//sapoin/portal/seika/2011/23173814015.pdf (accessed on 13 June 2020).
- Industrial Structure Council Industrial Science Technology Policy Committee Evaluation Subcommittee. Recycling Technology for Waste Clothing and Development of High Value-Added Products Ex-Post Evaluation Report. Available online: https://www.meti.go.jp/policy/tech_evaluation/e00/03/h21/358.pdf (accessed on 13 June 2020).
- Japan Environment Planning. Co., Ltd. “PLANT”. Available online: https://www.jeplan.co.jp/ja/plant/imabari_no-1_plant/ (accessed on 11 April 2019).
- Fast Retailing Co., Ltd. All-Product Recycling. Available online: https://www.uniqlo.com/jp/sustainability/recycle/ (accessed on 13 June 2020).
- Ministry of Finance Japan. Trade Statistics of Japan Country Table by Product (H.S. Code 6309). Available online: http://www.customs.go.jp/toukei/srch/index.htm?M=01&P=1,1,,,,,,,,4,1,2018,0,0,0,2,6309,,,,,,,,,,1,,,,,,,,,,,,,,,,,,,,,,20 (accessed on 13 June 2020).
- SeaRates LLC. Find the best Freight Quote. Available online: https://www.searates.com/ (accessed on 13 June 2020).
- National Institute of Advanced Industrial Science and Technology, Safety Science Research Division, Society and LCA Research Group, Japan Environmental Management Association for Industry. LCI Database IDEA Version 2.1.3. Available online: https://www.aist-riss.jp/softwares/40166/ (accessed on 13 June 2020).
- NCS & Co., Ltd. 2014 Eco-Town Advanced Model Business. Local Recycling Type Used Clothing Recycling Business Centered on Northern Kyushu Report. Available online: https://www.env.go.jp/recycle/ncsmodel%2026.pdf (accessed on 13 June 2020).
- Ministry of Economy, Trade and Industry. Survey on the Trend of Chemical Recycling of Plastics. Available online: https://www.meti.go.jp/policy/recycle/main/data/research/h16fy/160629-1_drmi_0.pdf (accessed on 13 June 2020).
- Sugimoto, T. A Recycling Technology for Waste PET Bottles: A LCI Analysis of Aies method Chemical Recycling Process. J. Jpn. Inst. Energy 2004, 83, 267–271. [Google Scholar]
- Organization for Small & Medium Enterprises and Regional Innovation. Textile Recycling Survey Report 2010; Organization for Small & Medium Enterprises and Regional Innovation: Tokyo, Japan, 2010.
- Ikeuchi, T.; Ikeda, Y.; Uchimaru, M.; Uchimaru, M.; Ohashi, Y.; Kimura, T.; Miyauchi, T.; Mori, H. Present state and issues of material separation technology for textile product waste. J. Text. Mach. Soc. Jpn. 2014, 67, 41–46. [Google Scholar]
- PE Americas. Comparative Life Cycle Assessment IngeoTM Biopolymer, PET and PP Drinking Cups. 2009. Available online: https://www.natureworksllc.com/~/media/Files/NatureWorks/What-is-Ingeo/Why-it-Matters/LCA/PEA_Cup_Lid_LCA_FullReport_ReviewStatement_121209_pdf (accessed on 13 June 2020).
- Ministry of the Environment Government of Japan. List of Calculation Methods and Ghg Emission Factors in the Calculation/Report/Publication System. Available online: https://ghg-santeikohyo.env.go.jp/files/calc/itiran2019.pdf (accessed on 13 June 2020).
- Natural Resources and Energy Agency, Ministry of Economy, Trade and Industry. Energy Consumption Statistics Survey. Available online: https://www.enecho.meti.go.jp/statistics/energy_consumption/ec001/h30/pdf/kinyu_yoryo_all.pdf (accessed on 13 June 2020).
- Japan Federation of Industrial Waste Management and Recycling Associations Recycling Promotion Committee. Report on Basic Survey Results Related to RPF Manufacturing—Aiming to Promote the Manufacturing and Use of RPF. Available online: https://www.zensanpairen.or.jp/wp/wp-content/themes/sanpai/assets/pdf/activities/report_RPF_22.pdf (accessed on 13 June 2020).
- Okochi, F.; Nakanishi, S. Evaluation of Security from Heat of Combustion of Textiles with and without Flame Retardant Finishes. J. Home Econ. Jpn. 1992, 43, 543–549. [Google Scholar]
- Ministry of the Environment Government of Japan. About Result (2017) of General Waste Disposal Business Fact-Finding. 2019. Available online: https://www.env.go.jp/press/201903253.pdf (accessed on 13 June 2020).
- Ministry of the Environment Government of Japan. Basic Law for Establishing the Recycling-Based Society. Available online: https://www.env.go.jp/recycle/circul/recycle.html (accessed on 13 June 2020).
© 2020 by the authors. Licensee MDPI, Basel, Switzerland. This article is an open access article distributed under the terms and conditions of the Creative Commons Attribution (CC BY) license (http://creativecommons.org/licenses/by/4.0/).