Article

The Tea Bag Index—UK: Using Citizen/Community Science to Investigate Organic Matter Decomposition Rates in Domestic Gardens

1
Department of Geography and Environmental Science, University of Reading, Reading RG6 6DW, UK
2
Department of Horticultural and Environmental Science, Royal Horticultural Society, Wisely GU23 6QB, UK
3
Department of Technical Support and Product Development, Bulrush Horticulture Ltd., Co., Londonderry BT45 8ND, UK
4
Department for Soil Health and Plant Nutrition, Austrian Agency for Health and Food Safety (AGES), 1220 Vienna, Austria
*
Author to whom correspondence should be addressed.
Sustainability 2020, 12(17), 6895; https://doi.org/10.3390/su12176895
Submission received: 29 July 2020 / Revised: 19 August 2020 / Accepted: 21 August 2020 / Published: 25 August 2020
(This article belongs to the Special Issue Citizen Science and the Role in Sustainable Development)

Abstract

:
Gardening has the potential to influence several ecosystem services, including soil carbon dynamics, and shape progression towards the UN Sustainable Development Goals, (e.g., SDG 13). There are very few citizen/community science projects that have been set up to test an explicit hypothesis. However, citizen/community science allows collection of countrywide observations on ecosystem services in domestic gardens to inform us on the effects of gardening on SDGs. The geographical spread of samples that can be collected by citizen/community science would not be possible with a team of professional science researchers alone. Members of the general public across the UK submitted soil samples and buried standardised litter bags (tea bags) as part of the Tea Bag Index—UK citizen/community science project. Participants returned 511 samples from across the UK from areas in their garden where soil organic amendments were and were not applied. The project examined the effects of application of soil amendments on decomposition rates and stabilisation of litter, and in turn, effects on soil carbon and nitrogen concentrations. This was in response to a call for contributions to a global map of decomposition in the Teatime4Science campaign. Results suggested that application of amendments significantly increased decomposition rate and soil carbon, nitrogen, and carbon: nitrogen ratios within each garden. So much so that amendment application had more influence than geographic location. Furthermore, there were no significant interactions between location and amendment application. We therefore conclude that management in gardens has similar effects on soil carbon and decomposition, regardless of the location of the garden in question. Stabilisation factor was influenced more prominently by location than amendment application. Gardening management decisions can influence a number of SDGs and a citizen/community science project can aid in both the monitoring of SDGs, and involvement of the public in delivery of SDGs.

1. Introduction

There is great opportunity for gardening and green infrastructure to contribute to the UN Sustainable Development Goals (SDGs) through the provision of a wide range of ecosystem services [1,2,3,4]. Gardening and soil management in gardens can: (i) purify water (SDG 6—Clean Water and Sanitation), (ii) improve air quality (SDG 3—Good Health and Wellbeing, SDG 11—Sustainable Cities and Communities), (iii) provide space for recreation (SDG 3 and 11), (iv) growing food (SDG 2—Zero Hunger, SDG 12—Responsible Consumption and Production), (v) improve habitat connectivity for the protection of biodiversity aboveground (SDG 15—Life on Land), (vi) influence soil biodiversity (SDG 15), and (vii) provide climate mitigation and adaptation (SDG 13—Climate Action) [5,6,7,8].
Soil carbon (C) is commonly referred to as one of the most important indicators of soil quality [9]. It governs an array of soil’s physical, chemical, and biological processes [10,11]. Soil C fate and behaviour, however, are also influenced, in turn, by the physical, chemical, and biological properties of the soil [12,13]. Soil C, contained within soil organic matter (SOM), holds approximately three times more C than the atmosphere or terrestrial vegetation [14] and accounts for 80% of the terrestrial C pool [15]. Therefore, maintenance of soil C stocks is critical to a balanced global C cycle. The importance of soil C was recognised during the 21st Conference of the Parties to the United Nations Framework Convention on Climate Change (COP21) in Paris, 2015. During COP21, the ‘4 per Mille Soils for Food Security and Climate’ action agenda was developed. This initiative was established as a voluntary action plan for partners in both the public and private sectors to increase agricultural soil C by 0.4% per annum [16].
It has been estimated that domestic gardens in the UK cover a total area of 432,924 ha, or 1.8% of the total UK land surface [17] and up to 22–27% of land cover in cities in the UK [18]. The potential importance of domestic gardens for C storage is increasingly being recognised [19]. Domestic garden soils are estimated to hold 40 t C ha−1 in the top 30 cm, and 60–145 t C ha−1 in the top 100 cm [20,21]. Although this may seem negligible, and less than other ecosystems such as woodland [22], gardens are often the most substantial piece of land that members of the public control and engage with soil management directly.
In order to deliver on SDGs, we need the public to become more engaged with their soils. Within private dwellings, management decisions are made on an individual basis, outside of policy that commercial landowners are subject to. Individuals have a duty to take at least some steps to reduce their carbon footprint, be it for their own sake or instrumentally promoting collective action [23]. Discussion of management practices in the garden, and their effects on the global C cycle, offer a valuable tool for community engagement, as gardeners often have a direct and personal interest in their own soil [24].
Projects using citizen science, or community science (CS), can be used to engage stakeholders and the general public in soils and climate change mitigation [6]. Both within their personal property, and in wider green infrastructure such as green spaces and community gardens [25]. CS projects can also provide much needed monitoring of SDGs [26], with the greatest inputs from CS being observed in SDGs 3, 6, 11, and 15 [27]. CS is defined, in this context, as volunteer participation in the collection and/or processing of biodiversity and/or environmental data as part of a scientific enquiry in order to understand the natural environment, through activities such as biological monitoring and the collection or interpretation of environmental observations [28,29]. The use of CS in environmental research and monitoring has increased significantly in recent years, even though it has existed for centuries [25]. This is largely due to the numerous research and educational benefits CS projects have to offer both participants and researchers. Particularly as resources available for research do not match the requirements and the scale of the questions scientific researchers are often trying to address [30,31].
Application of organic materials, such as compost and manure, as soil amendments is commonplace in domestic garden systems. The practice is regularly advised in gardening literature, to improve fertility, soil structure, and moisture retention [32,33]. Therefore, urban garden soils may not always be as poor in quality as other urban soils surrounding them [8]. Application of organic amendments may also be contributing to elevated total soil C in these systems [21,34]. The application of organic amendments, such as manure, green waste compost, and spent mushroom compost, in horticultural systems and domestic gardens has been reported to increase soil C [35,36,37,38]. Compost production, and its potential application to commercial and domestic horticultural soils, also provides a vital alternative waste stream for refuse that may otherwise be destined for landfill [39].
Understanding the behaviour of added C, and the mechanisms governing its long-term storage in soils, is currently a topic of intense research activity [14], often in long-term agricultural field experiments [40]. However, there is relatively little knowledge about the fate of organic amendments in soils of horticultural systems, both commercial and domestic. This is, in part, due to that fact that horticultural amendments (e.g., peat, composted bark, and spent mushroom compost) differ from those commonly used in agricultural systems (e.g., crop residues, sewage sludge, and farmyard manure). One of the most straightforward methods to quantify decomposition of organic matter by the soil microbial (decomposer) community is with field based studies using litter bags [41,42]. However, preparing uniform litter bags that allow comparison between regions is difficult. The Tea Bag Index (TBI) [43] uses commercial tea bags as standardised litter bags in order to quantify decomposition rate, k, and stabilisation factor, S, of litter in soils. The TBI method is a safe, simple, easily communicated, and peer-reviewed method, making the TBI ideal for a CS project. The call for contributions to a global map of decomposition has resulted in tea bags being buried in over 2000 locations worldwide for the Teatime4Science campaign (http://www.teatime4science.org/).
Domestic gardens are not included in the current TBI database, because they are not considered representative of the surrounding natural environment [24]. Being able to conduct these experiments in gardens would broaden the scope of the database as it would allow submissions from urban areas that are currently under-represented. The benefits of participants being able to utilise their own garden deepens their engagement and removes barriers such as landowner permissions and health and safety barriers. A concern regarding CS projects is that they tend to focus on collection of large datasets, without tailoring data collection to test an explicit hypothesis [28,44]. The hypothesis of this research was that there will be within garden effects arising from the application of soil amendments on decomposition rates and stabilisation of litter, and soil C and N concentrations. Gaining an understanding of decomposition processes across the world is important for informing current climate models. This is the first time, to our knowledge, that a decomposition project such as this has taken place in gardens across the UK.

2. Materials and Methods

2.1. Tea Bag Index

The TBI method [43] uses commercially available tea bags and exploits the differential in decomposition between green tea (fast decomposition) and rooibos tea (slow decomposition) over 90 days (the bag is nondegradable). Mass loss in the tea bags is used to generate TBI parameters describing a litter decomposition rate constant (k) and a factor quantifying the extent of litter stabilisation (S). S is calculated from the ratio between the fraction of green tea that is actually decomposed after 90 days and the fraction of green tea that is hydrolysable (Hg; operationally defined as the combined total of nonpolar extractive C, water soluble C, and acid soluble C) and therefore should be decomposed based on its chemical lability. The decomposition rate constant k is estimated assuming exponential decay from the mass of rooibos tea remaining at t = 90 days and the decomposable fraction for rooibos tea (calculated from the hydrolysable fraction of rooibos tea (Hr) and S). Details of the calculations can be found in Keuskamp et al. [43].
The brand of tea bags selected for the TBI are available in a number of countries, but they are not available ‘off the shelf’ in the UK. This resulted in very few results for the UK being available. A more intensive effort would be required to get coverage for the Teatime4Science campaign in the UK, so The Tea Bag Index—UK (TBI—UK) CS project was developed in 2015. With the intention to explore the spatial variability of decomposition rate, k, stabilisation factor, S, and soil C concentration in private gardens across the UK.

2.2. Project Design

The TBI—UK project was designed as a contributory CS project defined by Pocock et al. [45]. A project designed entirely by scientists with participants primarily collecting data for submission to the scientists. The project was based on the premise that simple methods that do not require much time or expertise are best suited for mass participation in CS [45].
Participants (recruited as explained in Section 2.3) volunteered for the project via email and were posted their TBI—UK pack that consisted of:
  • A personally signed thank you note from the project director;
  • Three pairs of preweighed (on a four decimal place balance) tea bags (1 green, 1 rooibos in each pair). Each pair was tied to a colour coded labelled marker stick, enabling easy identification of returned samples, marking the burial location for participants, and standardising the depth at which tea bags were buried;
  • Three polythene sample bags for soil samples, labelled and colour coded to match their corresponding tea bag pairs;
  • An information pack, which briefly introduced the project and provided instructions on the procedure, including suggestions for where to bury them (see Supplementary Information, Figure S1);
  • A short questionnaire asking the participants to provide information on the locations where they buried the tea bags and how long they were buried. Participants were asked for the post code/GPS location of where they buried the tea bags as this was not necessarily the same as the address that they were posted to. Some participants, for example, buried their tea bags in allotments, or in the residence of family members. The questionnaire was kept very simple to promote completion and consisted of tick boxes. Participants were asked, for each of the three locations:
    • Where did you bury this pair of tea bags (lawn, flower bed, vegetable patch, etc.)
    • Do you apply any compost, manure, or similar to this area of your garden? (Yes or No)
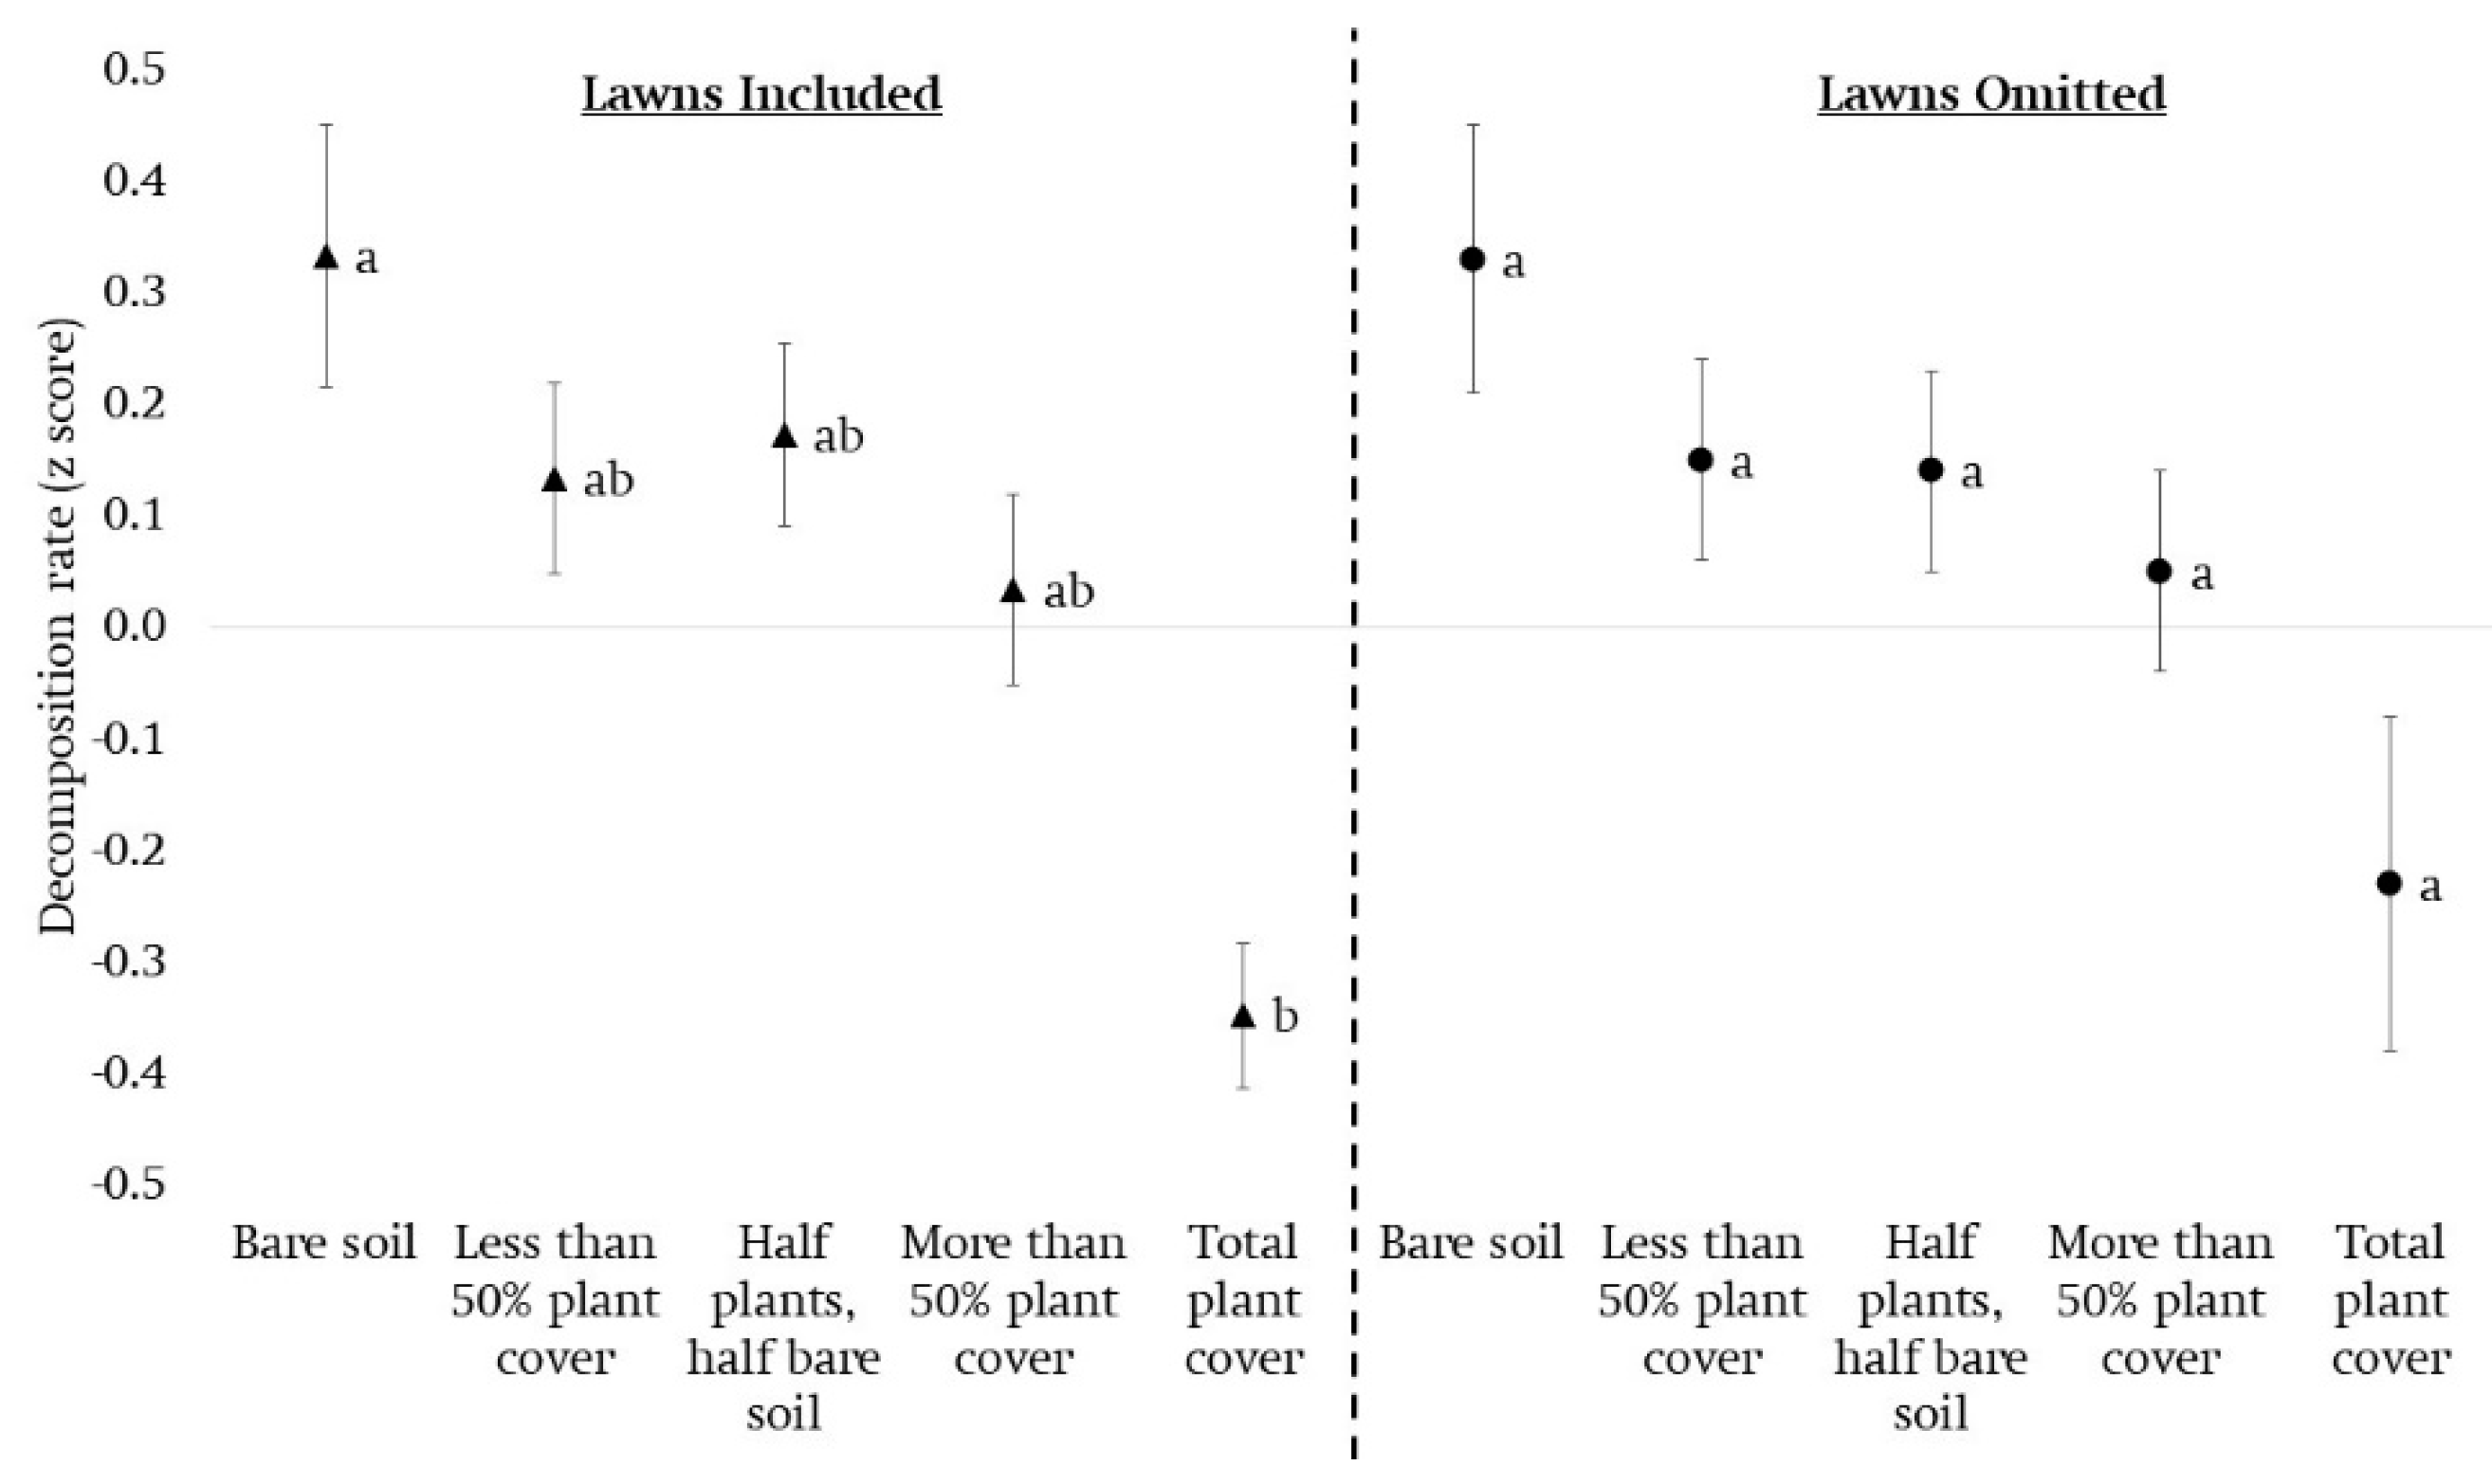
    • If we drew a rough 50 cm (1½ft) square, with the tea bags in the centre, what would the plant cover be? (Bare soil; less than 50% plant cover; half plants, half bare soil; more than 50% plant cover; or total plant cover).
Participants were asked to bury the three pairs of tea bags in three different locations around their garden for c. 90 days. Suggestions were made in their instructions that, if possible, one pair should be buried in their lawn, to provide comparisons of gardens nationally with one another to contribute to the global TBI data. Lawns were chosen as managed grass is a generally uniform environment in terms of plant cover and OM management. This was in response to a call for contributions to a global map of decomposition in the Teatime4Science campaign (http://www.teatime4science.org/). It was also suggested that one pair be buried in a location where organic soil amendments have been used to look at the effect of amendment application in the domestic garden setting. However, in order to ensure the participant was more invested in the results, the instructions made it clear that the final locations were their choice. Two weeks before the 90 days mark and after 90 days, participants were prompted with emails reminders. These included a recap of the instructions to dig up the pairs of tea bags, take a sample of the surrounding soil, lay out all samples to dry, and finally return them to the project office for analysis.
Returned tea bags were dried at 70 °C and adhered soil particles gently removed. Dry bags were then cut open and the contents were weighed. Soil samples were dried at 40 °C, ground using a disc mill, and analysed for total C and N content on a Thermo Scientific Flash 2000 CN Analyser.

2.3. Recruitment and Communication with Volunteers

A total of 438 packs (1314 pairs of tea bags) were distributed across the UK, with the majority being in England. Recruitment of volunteers was conducted via several channels including social media, written media, and outreach events. The project was organised in collaboration with the Royal Horticultural Society (RHS), a gardening charity with over 500,000 members from the British public, the majority of whom are amateur gardeners.
The project had its own FacebookTM and TwitterTM accounts which, at the time of writing, combined had over 500 followers. Links to these accounts were shared by the RHS Facebook and Twitter pages, which have a combined following of over 530,000 people. In addition, short advertisements were placed in popular amateur gardening magazines. The project website (www.teabagindexuk.wordpress.com) included background information on decomposition, details of the project, instructions for participants, promotional material, and information about the scientist running the project.
Regular dialogue was maintained with the participants throughout the project. Participants signed up to volunteer via email, with an initial reply email sent immediately thanking them for taking part. A second email was sent when their pack had been dispatched. During participation, volunteers were sent update emails ca. every two weeks with news from the project, along with photos of scientists in the lab and the field using the TBI. Participants were also encouraged to send in participation photos, which were shared with permission, in order to build up a sense of community. News bulletins were posted regularly (at least once a week) on the project Facebook and Twitter pages. An individual report of their results was sent to participants once the analysis had been completed. All participants were informed that return of samples acted as consent for the data collected from their samples to be used in our analysis. All participants records were anonymysed and contact details were deleted from our database once participants were sent their results.

2.4. Statistical Analysis

All statistical analyses were performed using Minitab Version 19. A restricted maximum likelihood (REML), mixed effects model with interactions, and Tukey’s post hoc testing were conducted on decomposition rate, stabilisation factor, soil C, N, and C:N data. Fixed factors in the REML mixed effects models were: (i) amendment application (yes or no), (ii) global environmental zone (Atlantic Central or Atlantic North) as defined by Metzger et al. [46] (selected to be comparable to upcoming unpublished TBI studies), and (iii) location in the garden (lawn or not lawn). Participant ID (reference number) was included as a random factor. Lawn samples that had no amendments applied were also examined in isolation with environmental zone as a factor using a general linear model (GLM).
We also examined the effects of amendment application and plant cover on TBI and soil C within each participant’s garden. To account for the variability between participants, all data (decomposition rate; stabilisation factor; and soil C, N, and C:N) were z transformed, Equation (1)—z transformation:
z =   x i   x ¯ S D
where z score is transformed data for a sample pair of tea bags or it’s corresponding soil sample, x i is the observation for a single pair of tea bags (decomposition rate or stabilisation factor) or it’s corresponding soil sample (soil C, N, or C:N) from a participant, x ¯ is the mean of all samples (tea bags or corresponding soil samples) returned by the participant, and SD is the standard deviation of all samples (tea bags or corresponding soil samples) returned by the participant. If a sample observation was equal to the mean of all samples returned by the participant, z = 0. If the sample observation was below the mean of all samples returned by the participant, z < 0. Finally, if the sample observation was above the mean of all samples returned by the participant, z > 0. For a z transformation to be possible, only participants who returned more than one complete pair of tea bags, with corresponding soil samples, could be included in this analysis.
For simplicity, z scores of samples were grouped according to amendment applied (yes or no) and plant cover (bare soil; less than 50% plant cover; half plants, half bare soil; more than 50% plant cover; or total plant cover). A REML mixed effects model, with interactions and Tukey’s post hoc testing, was conducted on z transformed data. Amendment applied (yes or no) and plant cover category were classed as fixed factors in the REML mixed effects model, and participant ID as a random factor.

3. Results

3.1. Sample Return

Not all participants returned all three pairs of tea bags due to loss of or damage to bags during the incubation period. In addition, some participants did not return a corresponding soil sample or questionnaire, and some sample bags split in transit. Some participants also chose to bury tea bags indoors in pot plants, or in greenhouses, so were not included in the analysis (although results were still returned to the participant). Despite this, a total of 511 complete pairs of tea bags and corresponding soil samples were returned that could be used in analysis, equating to a 39% return. In total, 138 complete pairs were returned from lawns for submission to the Teatime4Science global database (Table 1). A further 112 samples were returned from locations other than lawns, where amendments were not applied, along with 261 samples where amendments were applied in locations other than the lawn, such as flower beds and vegetable patches. Of the samples included in the analyses, 403 were from the Atlantic Central zone and 108 were from the Atlantic North, as defined by Metzger et al. [46]. Mean (±standard error) values for all UK samples returned (n = 511) were: 8.77% soil C ± 0.26, 0.48% soil N ± 0.01, soil C:N ratio of 18.42 ± 0.28, decomposition rate 0.017 ± 0.000, and stabilisation factor 0.178 ± 0.004.

3.2. Lawn Data Only

C:N of soils in lawns in the Atlantic North were significantly higher than Atlantic Central, this was the only variable that saw a significant difference between environmental zones in UK lawns (Table 1). Compared to areas elsewhere in the garden where amendments were not applied, lawns had significantly lower soil C, C:N ratio, and decomposition rate (Table 1).

3.3. All Samples

There was a significant difference in decomposition rate, total C and C:N ratio between lawn and non-lawn environments without amendments (Table 1). In response we conducted the REML mixed effects model twice, once with lawn samples included (Table 2), and once without (Table 3). Mean values of this data can be found in the Supplementary Information (Table S1). The exclusion of lawn samples had not effect on the significant differences observed (or lack of) between amendment application and environmental zone in the case of decomposition rate, total C and N, and C:N (Table 2 and Table 3). Therefore lawn samples were included in the maps created from the TBI-UK project in the sections to follow. However, stabilisation factor was significantly different between environmental zones if lawns were excluded (Table 3), which was not seen when lawns were included (Table 2).

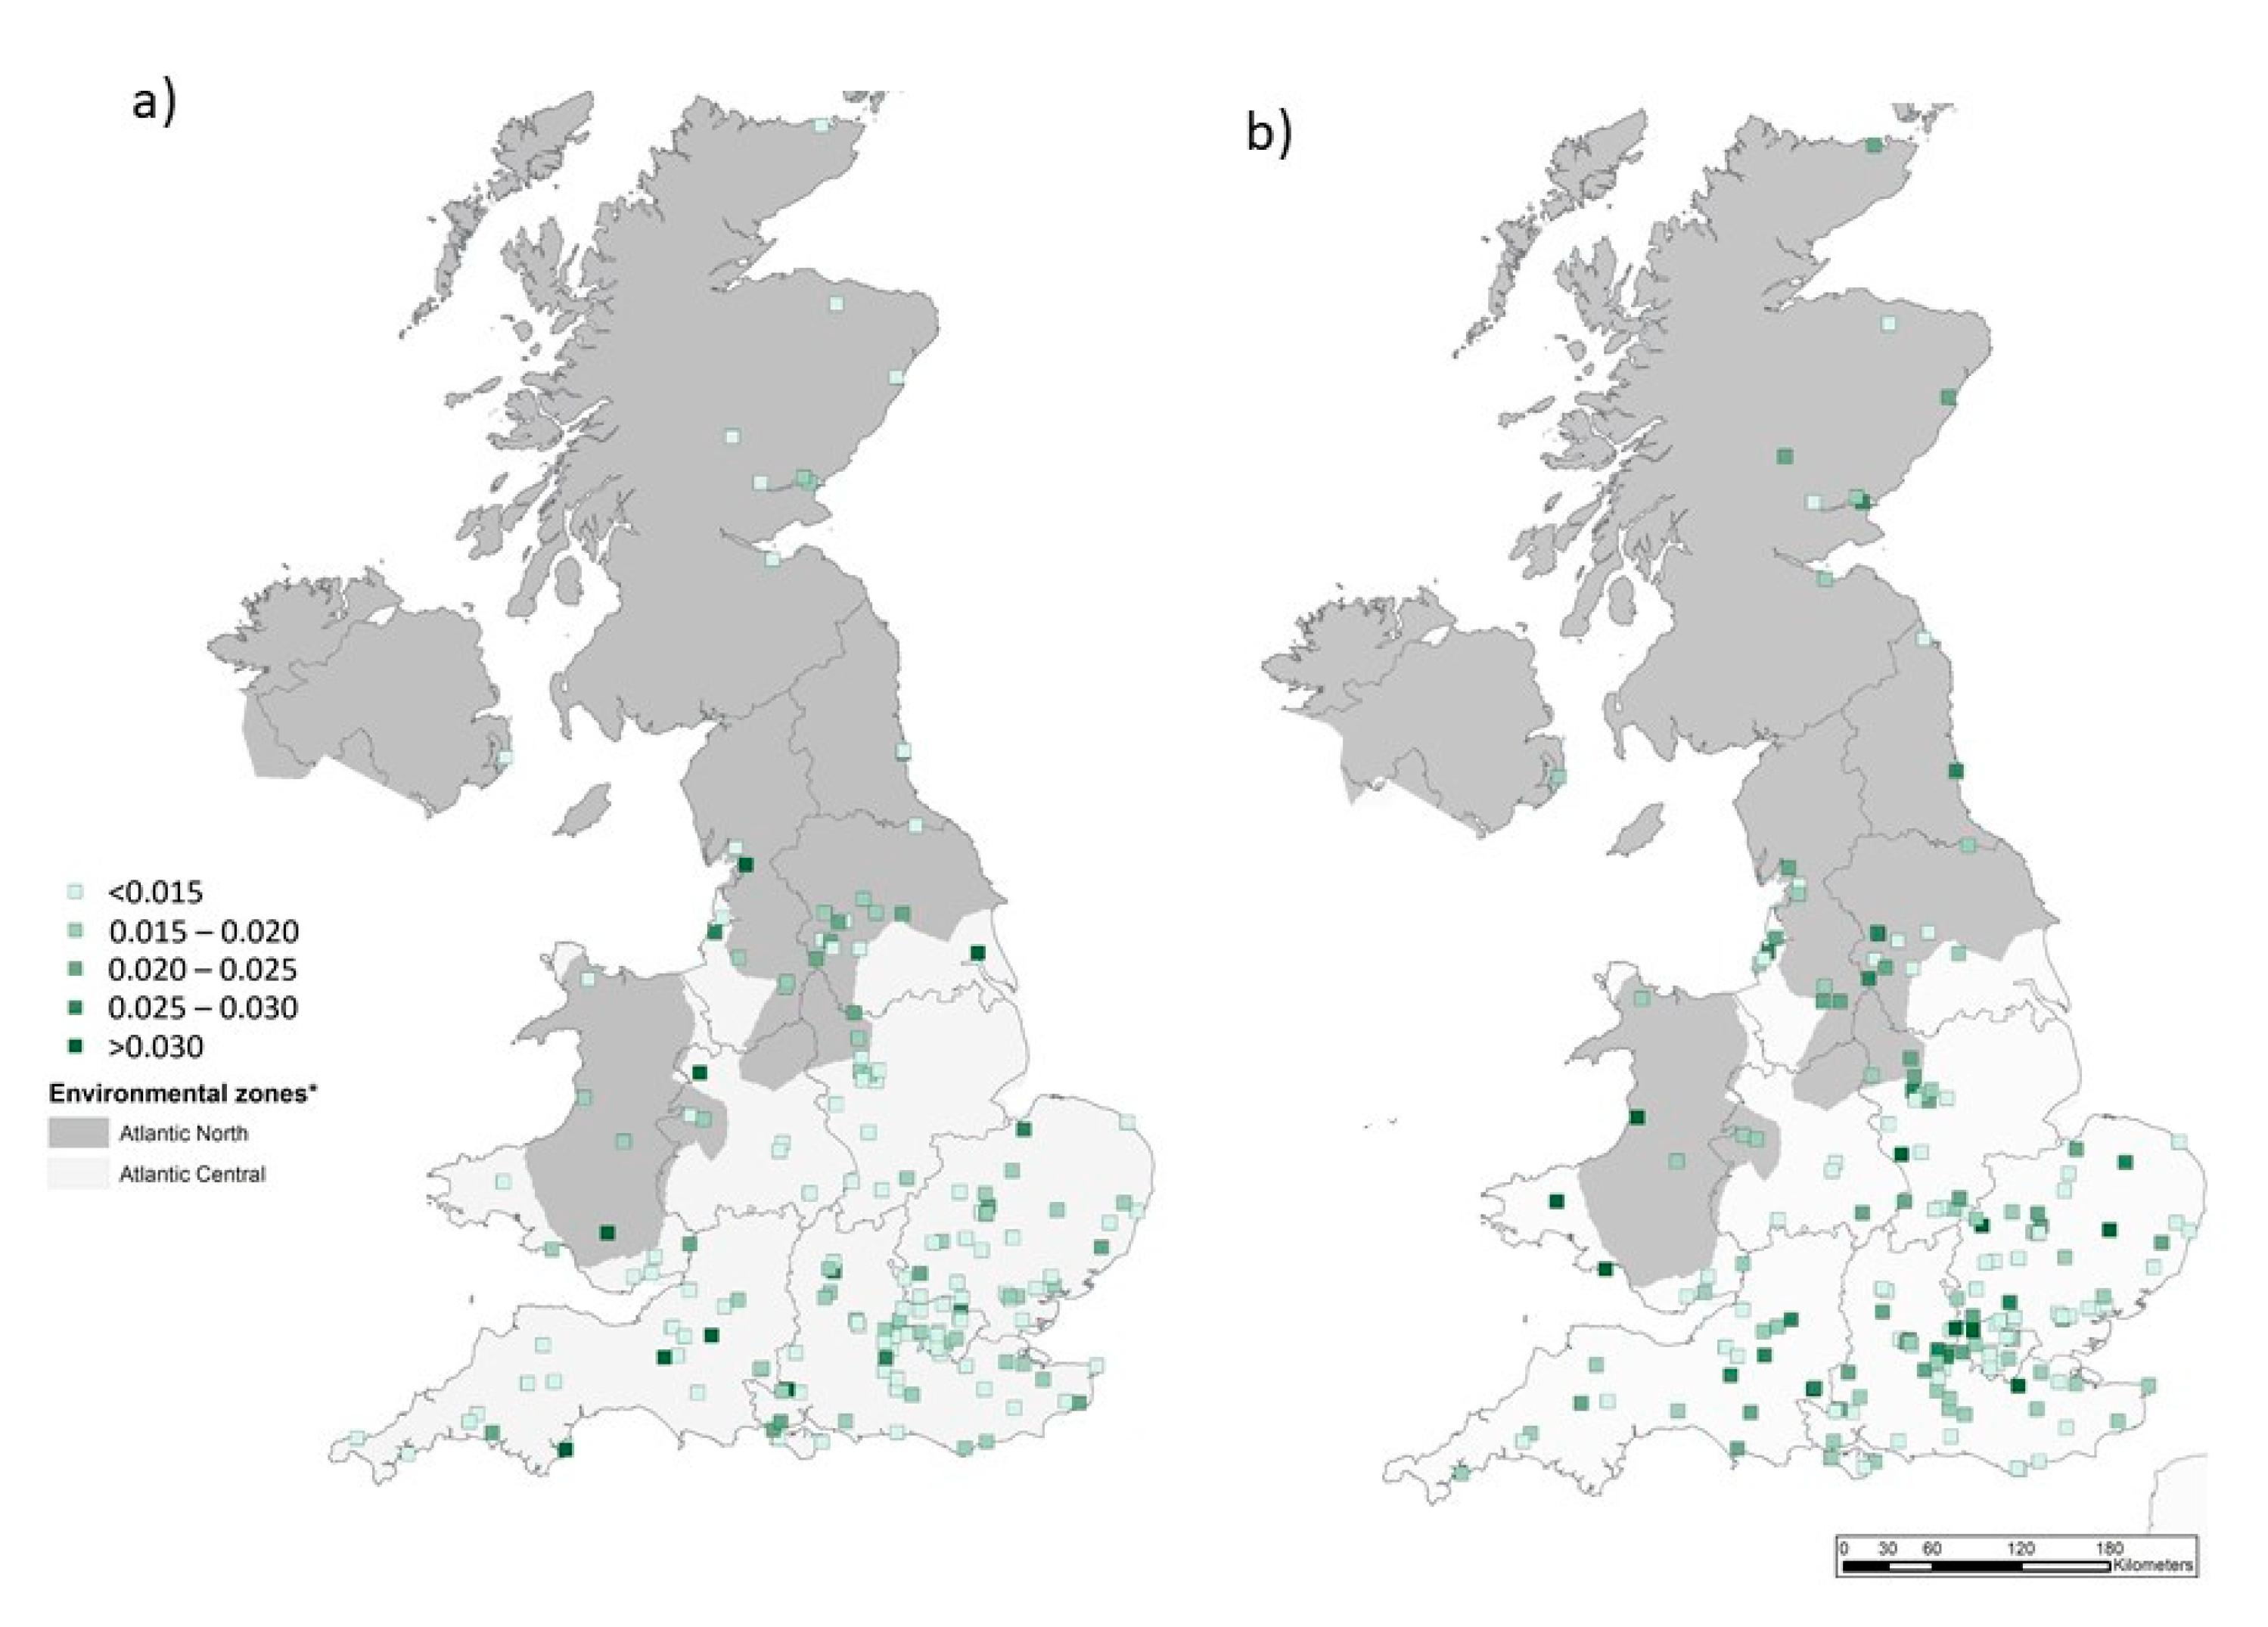
3.4. Decomposition Rate

There were no significant difference in decomposition rates across the UK environmental zones (Table 2, Figure 1) or from the samples returned with (Figure 1a) or without organic amendments applied (Figure 1b, Table 2). There were also no significant interactions between environmental zone and amendment application (Figure 1, Table 2).

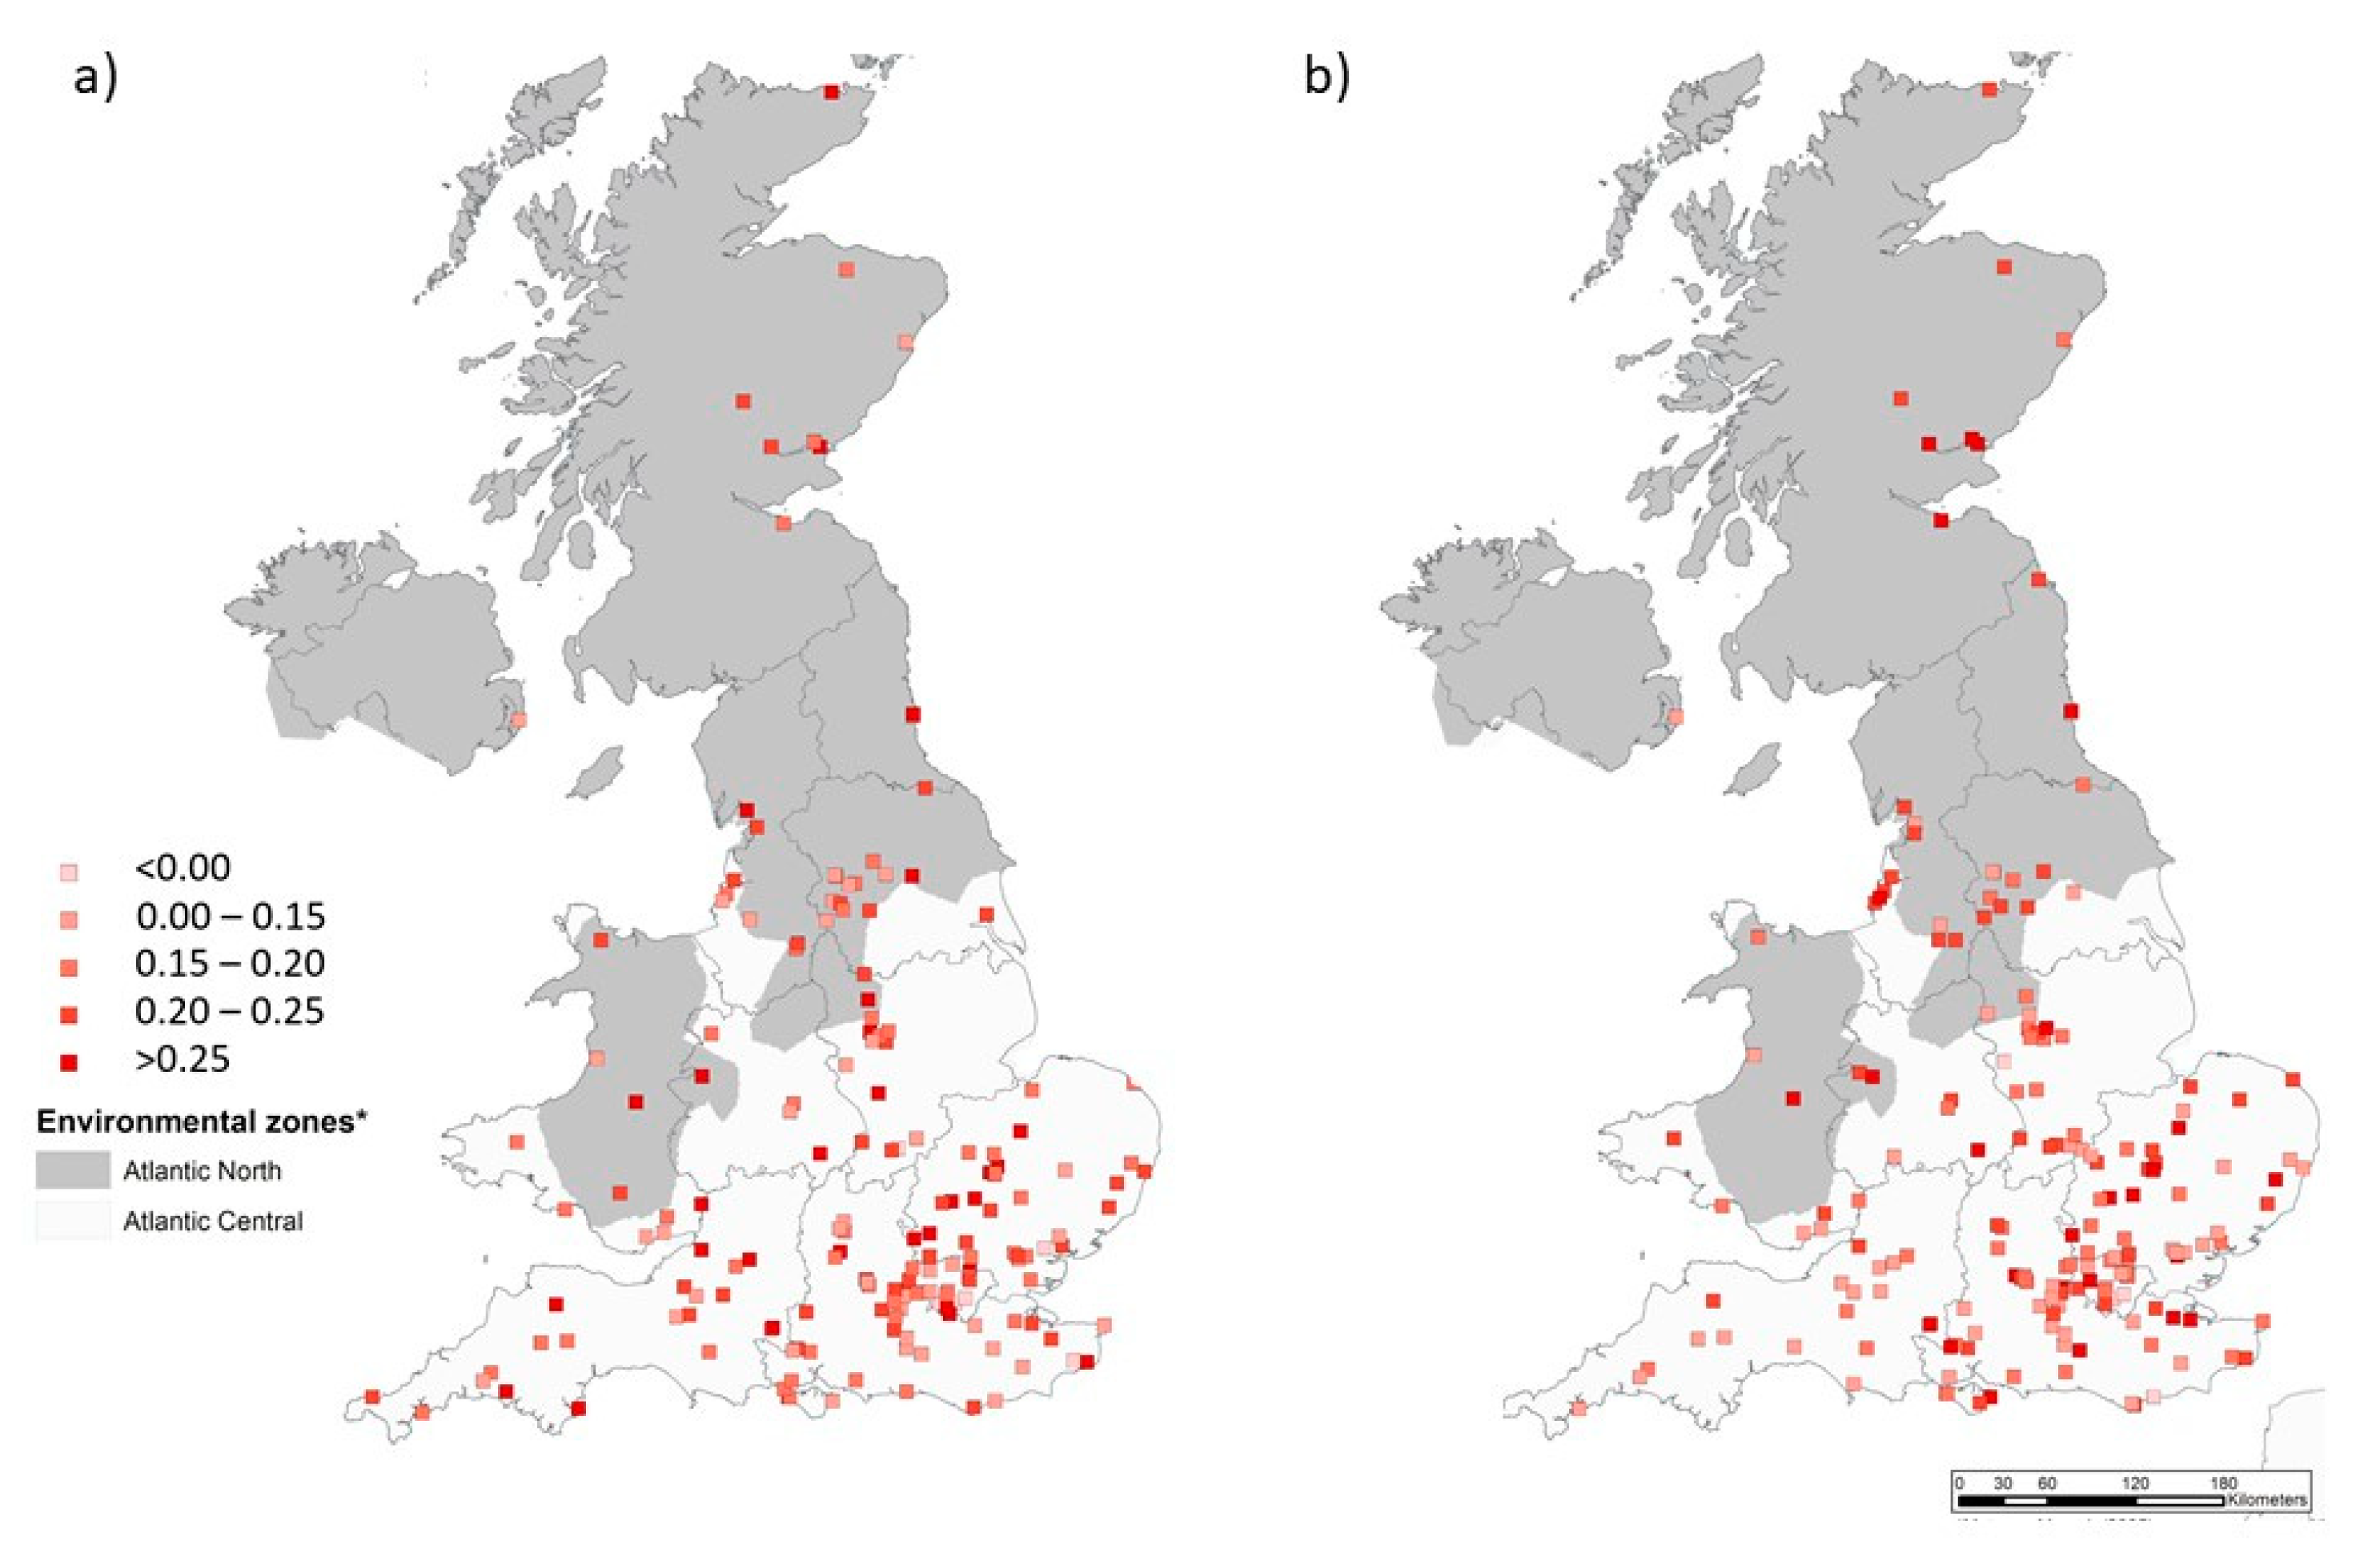
3.5. Stabilisation Factor

As with decomposition rate, there was no significant difference in stabilisation factor in the two environmental zones, when lawns were included in analysis (Figure 2). Stabilisation factor also had no significant difference in areas with (Figure 2a) or without organic amendments applied (Figure 2b, Table 2). There were no significant interactions between environmental zone and amendment application (Figure 2, Table 2). When lawns were removed from the analysis, stabilisation factor was significantly higher in the Atlantic North, compared to Atlantic Central (Table 3).

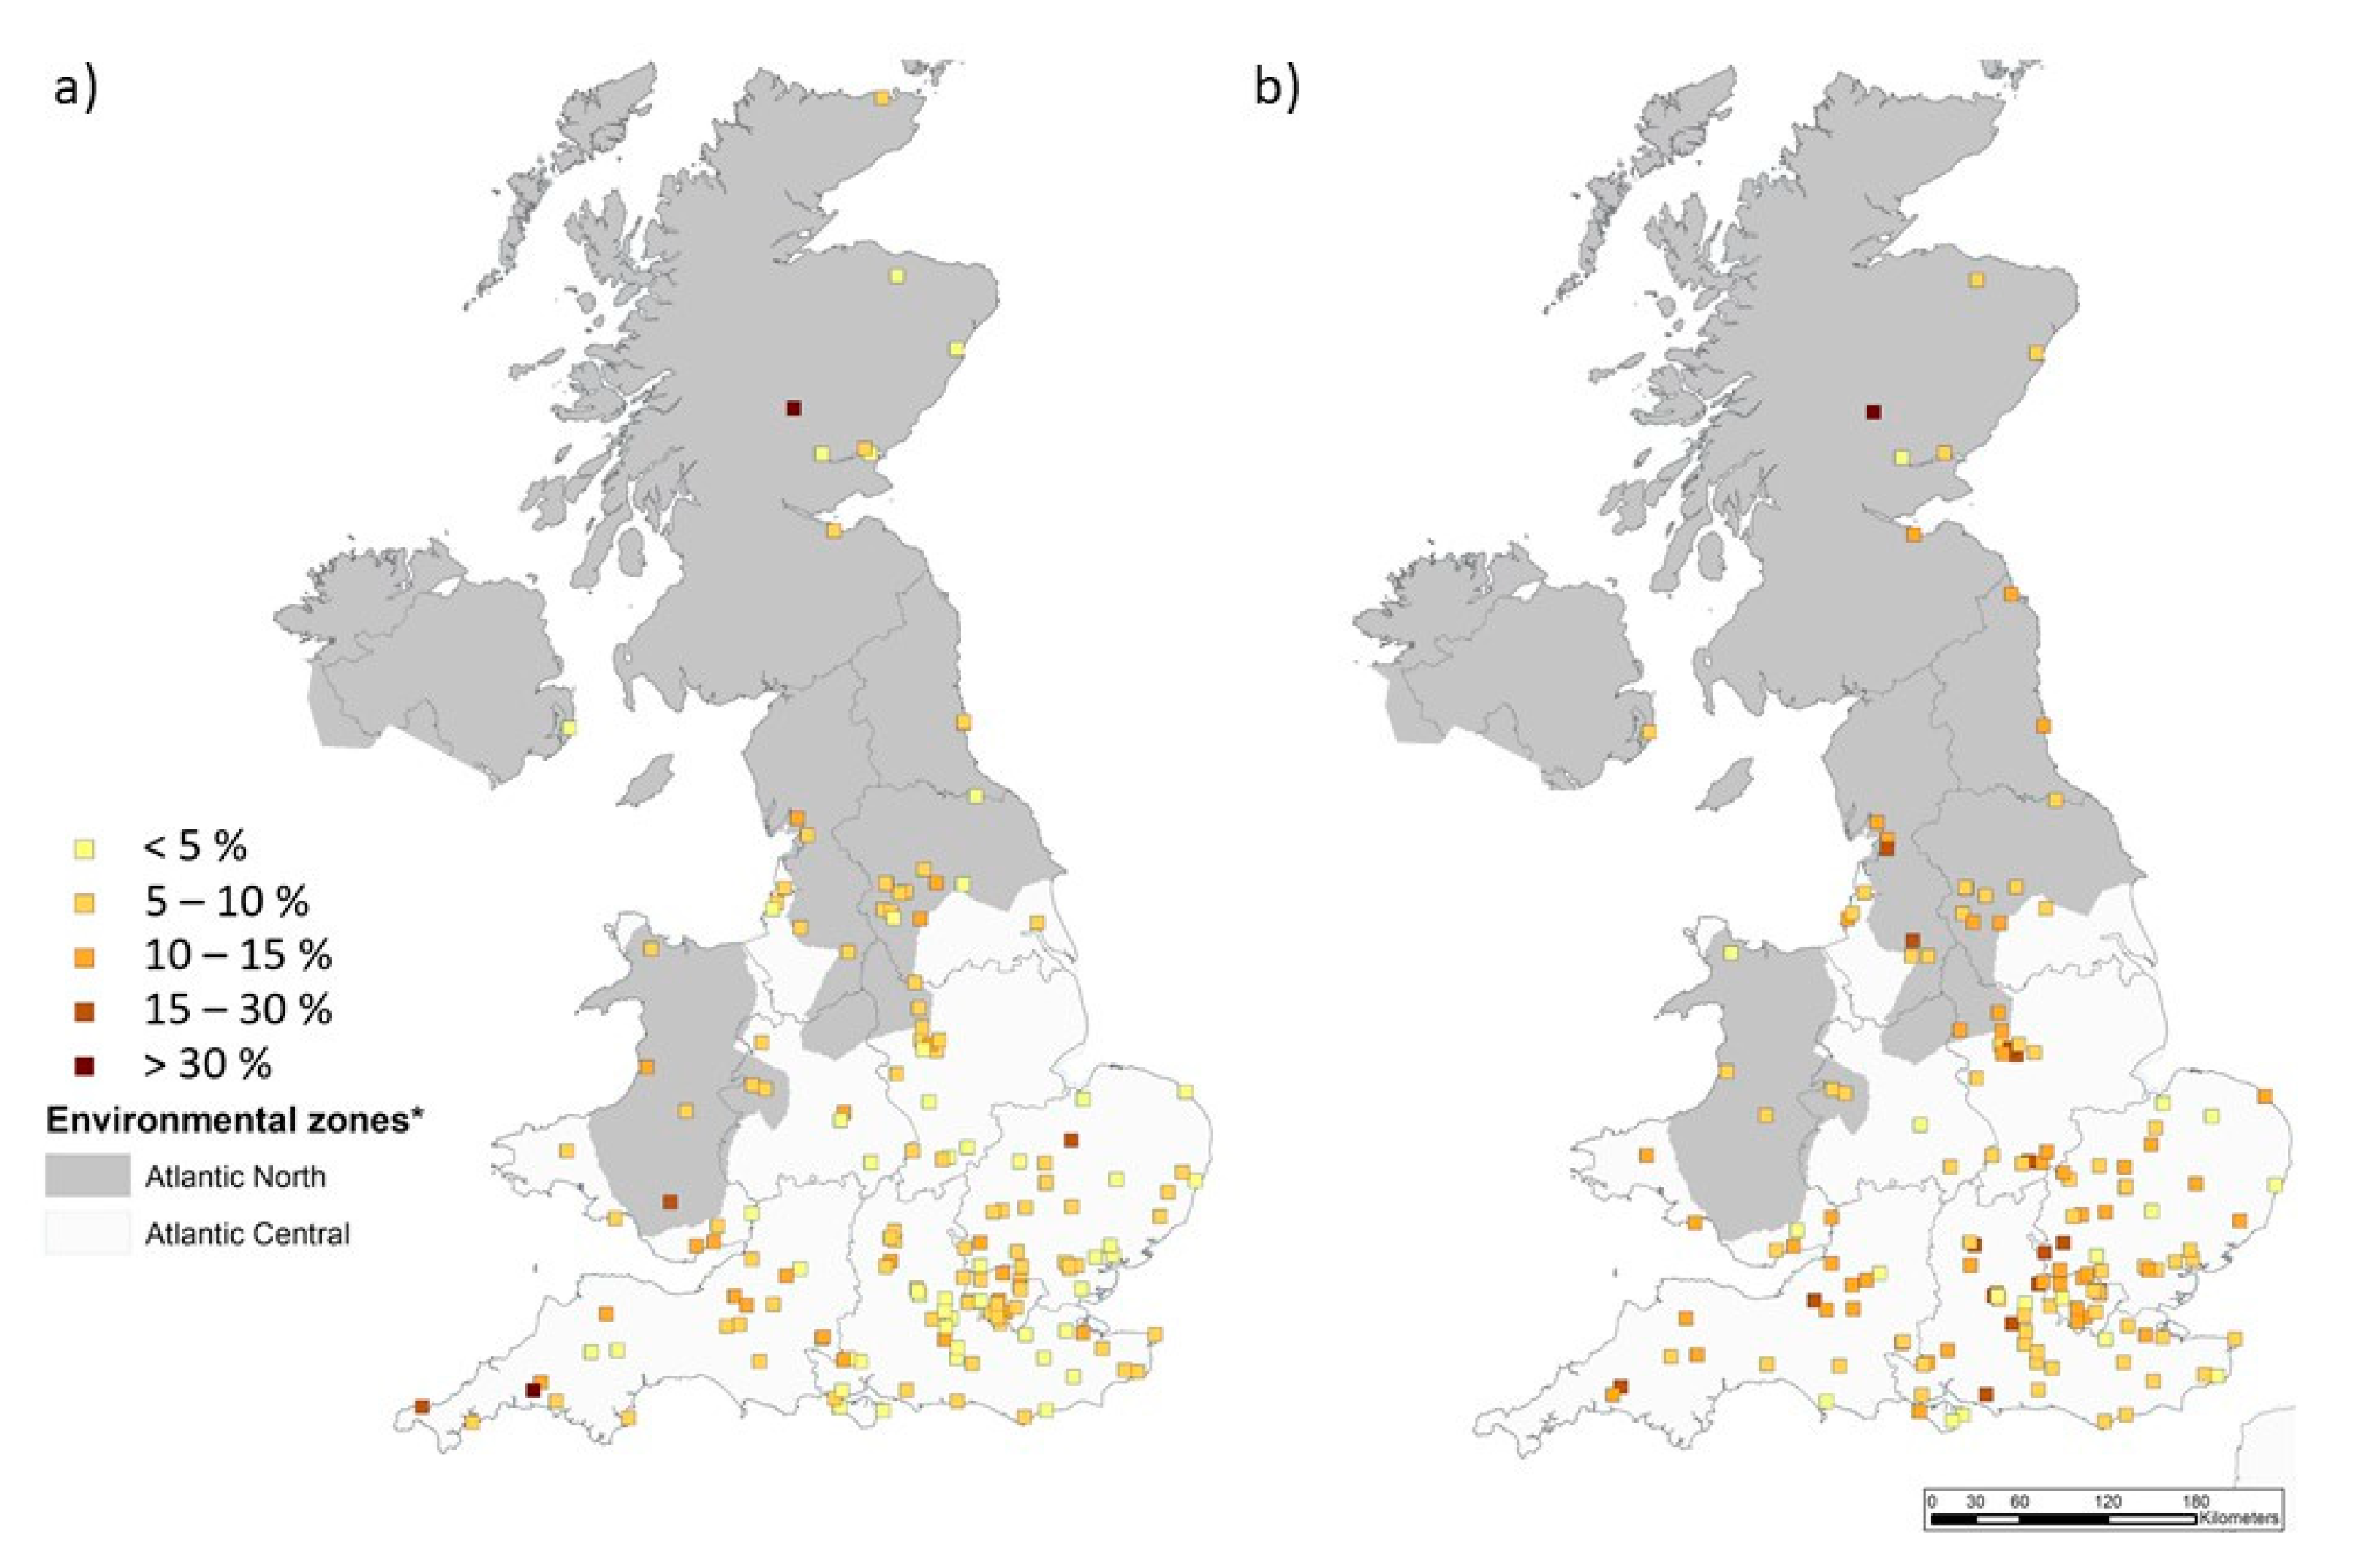
3.6. Soil Carbon and Nitrogen

Amendment application resulted in significantly higher soil C and N (Table 2). High C (Figure 3, Table 2) and N (Figure 4, Table 2) samples were spread across the UK, with no significant differences between environmental zones. Soil C:N ratio was not affected by amendment application (Table 2), but was significantly higher in the Atlantic North than Atlantic Central (Figure 5, Table 2).

3.7. Within Garden Effects

To examine within garden variation, as a result of amendment application and plant cover, z scores were calculated for each participant. These could only be calculated for participants who returned more than one complete sample, and filled in all questions on the questionnaire (plant cover information was missing for 28 participants). Despite this, 410 sample pairs (soil and teabags), from 157 participants could be included. Transforming the data into z scores helps standardise the observations taken from each garden in order to better understand the effects of amendment application, whilst taking spatial variation between gardens into account. Figure 6 depicts an example for one participant’s decomposition rate measurements.
Amendment application resulted in significantly higher decomposition rate, soil C, soil N, and soil C:N ratio, when expressed as a z score (Figure 7). The largest difference in z scores between areas with and without amendment application was observed in the soil C z score. The significant differences between samples where amendments were applied remained significant for decomposition rate, total soil C, and N content when lawns were omitted (data not shown). There was no significant difference between stabilisation factor, when expressed as z scores, from areas where amendments were or were not applied (Figure 7).
There were no significant differences between plant cover classifications for stabilisation factor, soil C, soil N, or soil C:N ratio (data not shown). Decomposition rate z score, however, was significantly lower in areas that had total plant cover, compared to bare soil (Figure 8). However, as a result of the instructions requesting participants to include a sample from their lawn, a large proportion of the samples returned were from lawn environments. In addition, there may have been some confounding between plant cover and amendments, e.g., lawns have total plant cover but applying organic amendments is rare. Overall, 113 of the 198 samples that did not have amendments applied were from lawns. When lawns were omitted from analysis, decomposition rate, although still lower in total plant cover areas than bare soil, was not significantly diffferent between plant cover classifications (Figure 8).

4. Discussion

4.1. UK Garden Soils

For CS to make a valuable contribution to scientific knowledge, data must be validated [28,30]. Repetitions of the experiment by a professional scientist in each garden was not possible, hence the need for a CS project in the first place. An examination of the results obtained by participants can, however, be compared to results obtained by professionals obtained in similar environments (e.g., temperate improved grassland) to see if the UK garden samples fall within an expected range. Based on published results included in Keuskamp et al. [47], the mean k (0.017) and S (0.178) observed in UK gardens fell within the expected range, based on measurements taken in temperate grasslands.
National scale soil analysis has been conducted in the past through the 2007 Countryside Survey, where 2614 topsoil (0–15 cm) samples were taken from 591 1km squares [48]. This mean topsoil (0–15 cm) C concentration for the UK was determined by loss on ignition with a conversion factor of 0.55. C concentrations of garden samples in our study were higher than concentrations found in improved grassland (5.9%), during the Countryside Survey. Due to logistical constraints, we were only able to analyse soil for total C, rather than organic C, so some results for soil C and C:N in our study, particularly from calcareous regions, may appear to be higher than would be expected. However, the mean total C content for UK gardens in our study (8.77%) was lower than the national average of all samples in the 2007 Countryside Survey (13.7%). This is likely a result of some high C regions identified by the Countryside Survey being poorly represented in our CS project e.g., peat regions in northern Scotland, which are sparsely populated.
Mean nitrogen content of garden soils returned during this research (0.48%) was lower than the national average for all habitat types taken during the Countryside Survey (0.71%), but was comparable to concentrations found in improved grasslands (0.45%). The mean C:N ratio observed in garden samples in our research (18.42) was higher than the observed national average for all habitat types taken during the Countryside Survey (16.0) and improved grassland (12.0). Although it was not so high to exceed the optimum C:N ratio of 25 for decomposable material according to Wang et al. [49].

4.2. Effect of Amendment Application

The results from the TBI—UK suggests that garden soils are strongly influenced by soil management with the use of amendments significantly increasing soil carbon. This agrees with results from a previous citywide study in Leicester, UK, where C storage in domestic gardens was significantly higher than in all other urban and nonurban land cover classes, deemed to be a consequence of amendment application, mulching, and plant cover [50]. A study in Melbourne, Australia, also found that mulching increased soil C density in topsoil (0–25 cm) [3]. Application of garden composts, comprising of food waste, grass clippings, plant prunings, etc. have great potential to increase soil carbon contents [51] and mitigate climate change. However, this is dependent on what the disposal methods of these materials would have been if they were not applied to land as compost. Some disposal methods of these materials have climate mitigation potential in their own right, such as anaerobic digestion generating biogas as an alternative to fossil fuel use [52].
Amendment application also significantly increased soil nitrogen and decomposition rate. Decomposition rate is determined from the proportion of rooibos tea that has been decomposed. To decompose the rooibos tea (C:N ratio∼60), microbes will have drawn in N from the surrounding environment [53]. Hence, application of amendments, which increased within garden (z score) N contents and C:N ratio of the soil, will have a significant effect on decomposition rate. The availability of N may also explain why decomposition rate was comparatively lower in areas with complete plant cover compared to bare soil. The plants may be competing with the decomposers for available N, thereby slowing decomposition. The lack of significant interactions between amendment application and environmental zone, for decomposition rate, suggests that gardening practices, such as amendment application, can influence the degree to which less easily degraded material (represented by the rooibos tea litter in the TBI) decomposes, regardless of their prevailing climate.
The stabilisation factor is a quantification of the actual decomposed fraction of the green tea compared to the hydrolysable (i.e., chemically labile) fraction of the tea, as determined by a laboratory sequential C extraction [43]. This deviation from what was decomposed, and what could be exploited, is therefore interpreted as the inhibiting effect of environmental conditions on the decomposition of the labile fraction. These could be chemical effects (e.g., the availability of elements, pH), physical/climatic effects (e.g., soil moisture, temperature), or biological (e.g., microbial community structure). In our study the stabilisation factor appeared to be more influenced by location (environmental zone) than management. This is contrary to the findings of Tresch et al. [38] in gardens in Switzerland, who found that decomposition of green tea (from which stabilisation factor is calculated) was influenced by management and was higher in ‘grass sites’ than in ‘vegetable sites’. However, significant differences in stabilisation factor between environmental zones in our study were only observed when lawns were excluded from analysis.
Although it is unlikely that the tea resembles any of the organic input into these garden systems, use of the TBI will give some indication of the decompositional environment of these garden soils, as determined by management. In addition, decomposition of tea used in the TBI have been found to be representative of other litters [53]. However, there may be some limitations of the use of tea bags associated with the mesh size allowing possible ingrowth of fungal hyphae, effecting results [38].

4.3. Use of Garden Samples in International Soil Assessments

Gardens are often absent from public and political attention [54], but we have observed that management in gardens in terms of amendment application and land use cover (lawn/not lawn) can influence both the Tea Bag Index decomposition parameters and soil characteristics. Different management techniques, such as mowing, grass clippings removal, and collection and removal of leaf litter from lawns [54,55,56], between lawn/not lawn environments can account for differences in C content in these environments. These differences in soil management and other environmental factors (e.g., urban heat island, elevated atmospheric carbon dioxide) can result in a “soil mosaic”, where soil carbon can vary widely between and within gardens [57]. This makes the inclusion of gardens in national soil assessments complicated, particularly as not all gardens are necessarily based on soil types matching the surrounding area. Landscaping, particularly in houses built recently, can often involve importing topsoil from other locations, which may lead to discrepancies between data from a garden and the surrounding native soils [58].
Soil C and N data are lacking in urban areas [59] and it is believed that further research into these soils is warranted [58]. Gardens can account for up to one fifth of the total land area in urban areas [18], so the inclusion of gardens can increase the urban sampling opportunity. In addition, existing literature strongly focuses on gardens in an urban context, rather than rural gardens [54], so the potential of the inclusion of gardens is not limited to urban areas.
It is uncertain, at this stage, how representative the results from these garden systems are of all UK soils. The TBI is currently being used in the UK in natural ecosystems by other researchers, along with soil carbon analysis; when these data are made available, the garden values obtained during this project can be compared to the surrounding environment. If garden data are included in future Teatime4Science campaigns the TBI method will be opened up to a new audience across the globe, such that a wider community can participate.

4.4. Engaging with the Community

Urban ecosystems, including community gardens, allotments, and domestic household gardens, have increasing potential to mitigate climate change (SDG 13). Therefore, engaging with the people who own or manage these areas is becoming increasingly important in delivering on this SDG [60]. The project website has had over 30,000 views from 164 countries (25 June 2020), supporting findings that CS provides an excellent platform for the public to engage with the environment and local environmental issues, as well as enhancing the connectivity between soil and participant [24,45,61]. A large number of participants were recruited via the RHS social media and in gardening magazines, suggesting they were keen gardeners who already have an ‘intimate relationship’ with the soil in their gardens [24]. Therefore, the project may benefit from including samples from gardens that are not managed to the same degree. Martin [62] observed that people with higher levels of engagement in science are more likely to volunteer for CS projects. A different recruitment strategy, perhaps involving schools or students to make sure participants, who may not be keen gardeners, would be required to ensure less intensively managed gardens are not overlooked.
Tweddle et al. [29] stated that contributory projects, such as this one, do not involve the participants in the same way as collaborative or cocreated projects. The focus of contributory projects is primarily on the scientists’ needs rather than those of the participants, pulling into question how much keen gardeners gain/learn from a project as they are already engaged in soil management. However, just because they are engaged in the subject of soil management does not necessarily mean that participants are engaged in the science behind it, or aware of the wider impacts. Projects such as ours may be able to bridge this gap.
Participants returned 511 complete pairs of tea bags and corresponding soil samples, equating to a 39% return. This needs to be considered in planning and budgeting of future projects as recruitment of volunteers will need to be more than double the number of samples you wish to be returned. There is limited information available on the return rate of CS projects such as this one, but surveys distributed by the Open Air Laboratories (OPAL) reported a 10% return [63]. This suggests that CS project that ask volunteers for more intensive sampling, rather than more simple questionnaires, can do so without a reduction in volunteer numbers. However, maintaining volunteer engagement throughout the lifespan has been recognised as a hindrance to CS projects [61], but is vital to ensure participants submit a completed observation. Therefore, regular communication and feedback to participants in CS projects is a must to prompt and motivate volunteers to make a record, as well as encouraging future participation [28,45].
The advances in digital communications technology, particularly social media, has made communicating with the public faster and easier. However, communicating with participants is often the most costly component of a CS project in terms of time, and one that cannot be overlooked [45]. Honest regular communication, however, means that participants understand that feedback may not be immediate, and they may be more accommodating of that fact.

4.5. Further Research and Considerations

Although we recognise this analysis is simplified, this was appropriate to communicate with the participants to obtain feedback. However, should a CS project examining garden soil be conducted in the future there are some points that may need to be considered.
Firstly, we did not determine from participants how long it had been since they applied amendments, or whether they had information on the actions of previous householders. Without knowledge of previous householders, we cannot guarantee that our ‘no amendments’ samples have never had amendments applied. This makes it difficult for us to make the distinction between the effects of applied C and N in soil amendments on decomposition, and effects of background soil C and N that is intrinsic to location. Due to the volume of samples, and a desire to keep the demands on the participants simple, the amount of soil data obtained was limited to one SDG (SDG 13). More specifically SDG target 13.3 to “improve education, awareness raising and human and capacity on climate change mitigation …” [64]. However, with more resources there is potential for more extensive observations to examine the gardens in the context of other SDGs. For example, compost production and use in gardens and green spaces provides an alternative waste stream for refuse that may otherwise be destined for landfill [39], which could be explored in line with SDG Target 11.6—to reduce the environmental impacts of cities through waste management and SDG Target 12.5—to reduce waste generation [64]. Further laboratory analysis of soil samples, including pH and heavy metal contents, will help to monitor concentration of potentially harmful elements in garden soils in order to address SDG Target 3.9—to reduce the number of illnesses from soil and water pollution and contamination [64]. Our study has focused on organic amendments, but gathering information on how the participants use synthetic fertilisers and pesticides would also allow us to monitor whether chemicals are being used in an environmentally sound manner, and the role of gardening to reduce chemical release to soil and water (SDG Target 12.4 [64]). Understanding of chemical use is of interest because use of chemicals in gardens is outside of policy that commercial landowners are subject to. Analysis of nutrient contents and other soil quality indicators will also allow us to assess the extent of land degradation in urban areas, for example, to aid assessment of SDG target 15.3 [64]. More in depth on-site observations by participants could also be conducted, for example, earthworm counts as an indicator of soil quality could also contribute to SDG Target 15.3.
The inclusion of deployment of temperature and moisture probes with the TBI packs is also a possibility, such as those distributed during the GROW sensing network (www.growobservatory.org). This would aid in interpretation of the factors affecting decomposition in domestic garden systems and further enhance gardener engagement, as well as creating potential opportunities for collaboration between different CS efforts examining soil properties and soil biology/biodiversity. Although we have concentrated on soil carbon here, it is important to note that the application of organic amendments has also been associated with emissions of other potent greenhouse gases from soil, such as nitrous oxide and methane [65,66]. This trade-off between soil carbon accumulation from application of soil amendments and greenhouse gas emissions will need to be considered when examining the contribution of gardening practice to climate change mitigation.
CS allows countrywide observations on ecosystem services to be made that would not be possible with a team of professional scientists alone [67]. Permissions for access to homeowners’ land has been highlighted as a barrier to projects examining garden soils [56], which would possibly be overcome if the homeowners could conduct the sampling themselves. However, the ad hoc nature of CS data collection, in terms of location and timings, may render it unsuitable for certain projects that require statistical design or targeted sampling [45]. This was reflected in our study as only 21% of the samples returned were from the Atlantic North region. This is likely a result of higher population density in England compared to Scotland, Wales, and Northern Ireland [68]. The area covered by domestic gardens positively correlates with population density and housing density [18]. The TBI—UK team was also based in England. In the future, UK CS projects may need to consider different recruitment strategies for different countries of the UK.

5. Conclusions

The samples collected during the TBI—UK project suggest that decomposition rate and resultant soil C and N concentration is increased by amendment application. This increase was observed both when decomposition rate, soil C, and N were analysed as a national average, and at the small scale when examining within garden differences using z scores. The collection of data through a CS project not only allows samples to be analysed from a wide geographical spread, but also engages the community in the collection of the data potentially making them more invested in the results. The combination of monitoring and education makes CS a useful tool in the delivery of SDG target 13.3. Particularly as the TBI—UK results suggest that an individuals’ management decision (in this case amendment application) has a greater influence on garden soil carbon contents, than where they are in the country.

Supplementary Materials

The following are available online at https://www.mdpi.com/2071-1050/12/17/6895/s1. Figure S1: Joining information booklet sent to participants, Figure S2: Results information, Table S1: Mean tea bag index and soil carbon from returned samples.

Author Contributions

Conceptualization, all authors; methodology, all authors; formal analysis, S.D.; investigation, S.D.; data curation, S.D.; writing—original draft preparation, S.D.; writing—review and editing, all authors.; visualization, S.D. and T.S.; supervision, P.D.A., L.J.S., and C.D.C.; funding acquisition, P.D.A., L.J.S., and C.D.C. All authors have read and agreed to the published version of the manuscript.

Funding

This research was supported by an Industrial Co-Operative Award in Science and Engineering (CASE), jointly funded by the Biotechnology and Biological Sciences Research Council (BBSRC), the Royal Horticultural Society (RHS), and the Department for Environment, Food, and Rural Affairs (Defra).

Acknowledgments

The authors would like to thank all the participants in the TBI—UK project, without whom this work would not be possible. We would like to thank Michael Schwarz (AGES) for their help with the generation of maps used in the work, and University of Reading undergraduate students for their help weighing samples.

Conflicts of Interest

The authors declare no conflict of interest.

References

  1. Calvet-Mir, L.; Gómez-Baggethun, E.; Reyes-García, V. Beyond food production: Ecosystem services provided by home gardens. A case study in Vall Fosca, Catalan Pyrenees, Northeastern Spain. Ecol. Econ. 2012, 74, 153–160. [Google Scholar] [CrossRef]
  2. Camps-Calvet, M.; Langemeyer, J.; Calvet-Mir, L.; Gómez-Baggethun, E. Ecosystem services provided by urban gardens in Barcelona, Spain: Insights for policy and planning. Environ. Sci. Policy 2016, 62, 14–23. [Google Scholar] [CrossRef]
  3. Livesley, S.J.; Dougherty, B.J.; Smith, A.J.; Navaud, D.; Wylie, L.J.; Arndt, S.K. Soil-atmosphere exchange of carbon dioxide, methane and nitrous oxide in urban garden systems: Impact of irrigation, fertiliser and mulch. Urban Ecosyst. 2010, 13, 273–293. [Google Scholar] [CrossRef]
  4. Cameron, R.W.F.; Blanuša, T.; Taylor, J.E.; Salisbury, A.; Halstead, A.J.; Henricot, B.; Thompson, K. The domestic garden—Its contribution to urban green infrastructure. Urban For. Urban Green. 2012, 11, 129–137. [Google Scholar] [CrossRef]
  5. Beumer, C. Show me your garden and I will tell you how sustainable you are: Dutch citizens’ perspectives on conserving biodiversity and promoting a sustainable urban living environment through domestic gardening. Urban For. Urban Green. 2018, 30, 260–279. [Google Scholar] [CrossRef]
  6. Keesstra, S.D.; Bouma, J.; Wallinga, J.; Tittonell, P.; Smith, P.; Cerdà, A.; Montanarella, L.; Quinton, J.N.; Pachepsky, Y.; Van Der Putten, W.H.; et al. The significance of soils and soil science towards realization of the United Nations sustainable development goals. Soil 2016, 2, 111–128. [Google Scholar] [CrossRef] [Green Version]
  7. Bouma, J. Soil Security in Sustainable Development. Soil Syst. 2019, 3, 5. [Google Scholar] [CrossRef] [Green Version]
  8. Tresch, S.; Frey, D.; Bayon, R.L.; Mäder, P.; Stehl, B.; Fliessbach, A.; Moretti, M. Direct and indirect effects of urban gardening on aboveground and belowground diversity influencing soil multifunctionality. Sci. Rep. 2019, 9, 1–13. [Google Scholar] [CrossRef] [Green Version]
  9. Ghosh, S.; Wilson, B.; Ghoshal, S.; Senapati, N.; Mandal, B. Organic amendments influence soil quality and carbon sequestration in the Indo-Gangetic plains of India. Agric. Ecosyst. Environ. 2012, 156, 134–141. [Google Scholar] [CrossRef]
  10. Olk, D.C.; Gregorich, E.G. Overview of the Symposium Proceedings, “Meaningful Pools in Determining Soil Carbon and Nitrogen Dynamics”. Soil Sci. Soc. Am. J. 2006, 70, 967–974. [Google Scholar] [CrossRef] [Green Version]
  11. Pérez-Piqueres, A.; Edel-Hermann, V.; Alabouvette, C.; Steinberg, C. Response of soil microbial communities to compost amendments. Soil Biol. Biochem. 2006, 38, 460–470. [Google Scholar] [CrossRef]
  12. Gerzabek, M.H.; Haberhauer, G.; Kandeler, E.; Sessitsch, A.; Kirchmann, H. Response of organic matter pools and enzyme activities in particle size fractions to organic amendments in a long-term field experiment. Dev. Soil Sci. 2002, 28, 329–344. [Google Scholar]
  13. González, M.; Gomez, E.; Comese, R.; Quesada, M.; Conti, M. Influence of organic amendments on soil quality potential indicators in an urban horticultural system. Bioresour. Technol. 2010, 101, 8897–8901. [Google Scholar] [CrossRef] [PubMed]
  14. Schmidt, M.W.I.; Torn, M.S.; Abiven, S.; Dittmar, T.; Guggenberger, G.; Janssens, I.A.; Kleber, M.; Kögel-Knabner, I.; Lehmann, J.; Manning, D.A.C.; et al. Persistence of soil organic matter as an ecosystem property. Nature 2011, 478, 49–56. [Google Scholar] [CrossRef] [PubMed] [Green Version]
  15. Leifeld, J.; Kögel-Knabner, I. Soil organic matter fractions as early indicators for carbon stock changes under different land-use? Geoderma 2005, 124, 143–155. [Google Scholar] [CrossRef]
  16. Minasny, B.; Malone, B.P.; McBratney, A.B.; Angers, D.A.; Arrouays, D.; Chambers, A.; Chaplot, V.; Chen, Z.-S.; Cheng, K.; Das, B.S.; et al. Soil carbon 4 per mille. Geoderma 2017, 292, 59–86. [Google Scholar] [CrossRef]
  17. Davies, Z.G.; Fuller, R.A.; Loram, A.; Irvine, K.N.; Sims, V.; Gaston, K.J. A national scale inventory of resource provision for biodiversity within domestic gardens. Biol. Conserv. 2009, 142, 761–771. [Google Scholar] [CrossRef] [Green Version]
  18. Loram, A.; Tratalos, J.; Warren, P.H.; Gaston, K.J. Urban domestic gardens (X): The extent & structure of the resource in five major cities. Landsc. Ecol. 2007, 22, 601–615. [Google Scholar] [CrossRef]
  19. Davies, Z.G.; Dallimer, M.; Edmondson, J.L.; Leake, J.R.; Gaston, K.J. Identifying potential sources of variability between vegetation carbon storage estimates for urban areas. Environ. Pollut. 2013, 183, 133–142. [Google Scholar] [CrossRef]
  20. Bradley, R.I.; Milne, R.; Bell, J.; Lilly, A.; Jordan, C.; Higgins, A. A soil carbon and land use database for the United Kingdom. Soil Use Manag. 2005, 21, 363–369. [Google Scholar] [CrossRef]
  21. Edmondson, J.L.; Davies, Z.G.; McHugh, N.; Gaston, K.J.; Leake, J.R. Organic carbon hidden in urban ecosystems. Sci. Rep. 2012, 2, 1–7. [Google Scholar] [CrossRef] [PubMed]
  22. Alonso, I.; Weston, K.; Gregg, R.; Morecroft, M. Carbon Storage by Habitat: Review of the Evidence of the Impacts of Management Decisions and Condition on Carbon Stores and Sources. In Natural England Research Report NERR024; Natural England: Sheffield, UK, 2012; ISBN 9781783540136. [Google Scholar]
  23. Fragnière, A. Climate Change and Individual Duties. Interdiscip. Rev. Clim. Chang. 2016, 7, 798–814. [Google Scholar] [CrossRef]
  24. Rossiter, D.G.; Liu, J.; Carlisle, S.; Xing Zhu, A. Can citizen science assist digital soil mapping? Geoderma 2015, 259–260, 71–80. [Google Scholar] [CrossRef]
  25. Ryan, S.F.; Adamson, N.L.; Aktipis, A.; Andersen, L.K.; Austin, R.; Barnes, L.; Beasley, M.R.; Bedell, K.D.; Briggs, S.; Chapman, B.; et al. The role of citizen science in addressing grand challenges in food and agriculture research. Proc. R. Soc. B Biol. Sci. 2018, 285, 1–10. [Google Scholar] [CrossRef]
  26. Fritz, S.; See, L.; Carlson, T.; Haklay, M.; Oliver, J.L.; Fraisl, D.; Mondardini, R.; Brocklehurst, M.; Shanley, L.A.; Schade, S.; et al. Citizen science and the United Nations Sustainable Development Goals. Nat. Sustain. 2019, 2, 922–930. [Google Scholar] [CrossRef]
  27. Fraisl, D.; Campbell, J.; See, L.; Wehn, U.; Wardlaw, J.; Gold, M.; Moorthy, I.; Arias, R.; Piera, J.; Oliver, J.L.; et al. Mapping citizen science contributions to the UN sustainable development goals. Sustain. Sci. 2020, s11625, 1–17. [Google Scholar] [CrossRef]
  28. Silvertown, J. A new dawn for citizen science. Trends Ecol. Evol. 2009, 24, 467–471. [Google Scholar] [CrossRef]
  29. Tweddle, J.C.; Robinson, L.D.; Pocock, M.J.O.; Roy, H.E. Guide to Citizen Science: Developing Implementing and Evaluating Citizen Science to Study Biodiversity and the Environment in the UK; Natural History Museum and NERC Centre for Ecology & Hydrology for UK-EOF: Wallingford, UK, 2012. [Google Scholar]
  30. Tregidgo, D.J.; West, S.E.; Ashmore, M.R. Can citizen science produce good science? Testing the OPAL Air Survey methodology, using lichens as indicators of nitrogenous pollution. Environ. Pollut. 2013, 182, 448–451. [Google Scholar] [CrossRef]
  31. Tulloch, A.I.T.; Possingham, H.P.; Joseph, L.N.; Szabo, J.; Martin, T.G. Realising the full potential of citizen science monitoring programs. Biol. Conserv. 2013, 165, 128–138. [Google Scholar] [CrossRef] [Green Version]
  32. Reid, K. Improving Your Soil: A Practical Guide to Soil Management for the Serious Home Gardener; Firefly Books Ltd.: Richmond Hill, ON, Canada, 2014. [Google Scholar]
  33. Murphy, E. Building Soil: A Down-To-Earth Approach; Cool Springs Press: Minneapolis, MN, USA, 2015. [Google Scholar]
  34. Alexander, P.D.; Nevison, I.M. The long-term effects of repeated application of the same organic material to soil in a horticultural context. Acta Hortic. 2015, 1076, 143–150. [Google Scholar] [CrossRef]
  35. Ryals, R.; Kaiser, M.; Torn, M.S.; Berhe, A.A.; Silver, W.L. Impacts of organic matter amendments on carbon and nitrogen dynamics in grassland soils. Soil Biol. Biochem. 2014, 68, 52–61. [Google Scholar] [CrossRef]
  36. Lima, D.L.D.; Santos, S.M.; Scherer, H.W.; Schneider, R.J.; Duarte, A.C.; Santos, E.B.H.; Esteves, V.I. Effects of organic and inorganic amendments on soil organic matter properties. Geoderma 2009, 150, 38–45. [Google Scholar] [CrossRef]
  37. Medina, E.; Paredes, C.; Bustamante, M.A.; Moral, R.; Moreno-Caselles, J. Relationships between soil physico-chemical, chemical and biological properties in a soil amended with spent mushroom substrate. Geoderma 2012, 173–174, 152–161. [Google Scholar] [CrossRef]
  38. Tresch, S.; Moretti, M.; Le Bayon, R.C.; Mäder, P.; Zanetta, A.; Frey, D.; Fliessbach, A. A gardener’s influence on urban soil quality. Front. Environ. Sci. 2018, 6, 1–17. [Google Scholar] [CrossRef]
  39. Rinaldi, S.; De Lucia, B.; Salvati, L.; Rea, E. Understanding complexity in the response of ornamental rosemary to different substrates: A multivariate analysis. Sci. Hortic. 2014, 176, 218–224. [Google Scholar] [CrossRef]
  40. Sandén, T.; Spiegel, H.; Stüger, H.P.; Schlatter, N.; Haslmayr, H.P.; Zavattaro, L.; Grignani, C.; Bechini, L.; D’Hose, T.; Molendijk, L.; et al. European long-term field experiments: Knowledge gained about alternative management practices. Soil Use Manag. 2018, 34, 167–176. [Google Scholar] [CrossRef]
  41. Marschner, B.; Brodowski, S.; Dreves, A.; Gleixner, G.; Gude, A.; Grootes, P.M.; Hamer, U.; Heim, A.; Jandl, G.; Ji, R.; et al. How relevant is recalcitrance for the stabilization of organic matter in soils? J. Plant Nutr. Soil Sci. 2008, 171, 91–110. [Google Scholar] [CrossRef] [Green Version]
  42. Karberg, N.J.; Scott, N.A.; Giardina, C.P. Methods for Estimating Litter Decomposition. In Field Measurements for Forest Carbon Monitoring; Hoover, C.M., Ed.; Springer: Berlin/Heidelberg, Germany, 2008; pp. 103–111. ISBN 978-1-4020-8505-5. [Google Scholar]
  43. Keuskamp, J.A.; Dingemans, B.J.J.; Lehtinen, T.; Sarneel, J.M.; Hefting, M.M. Tea Bag Index: A novel approach to collect uniform decomposition data across ecosystems. Methods Ecol. Evol. 2013, 4, 1070–1075. [Google Scholar] [CrossRef]
  44. Elliott, K.C.; Rosenberg, J. Philosophical Foundations for Citizen Science. Citiz. Sci. Theory Pract. 2019, 4, 1–9. [Google Scholar] [CrossRef] [Green Version]
  45. Pocock, M.J.O.; Chapman, D.S.; Sheppard, L.J.; Roy, H.E. A Strategic Framework to Support the Implementation of Citizen Science for Environmental Monitoring: Final Report to SEPA; Centre for Ecology & Hydrology: Wallingford, UK, 2014. [Google Scholar]
  46. Metzger, M.J.; Bunce, R.G.H.; Jongman, R.H.G.; Mücher, C.A.; Watkins, J.W. A climatic stratification of the environment of Europe. Glob. Ecol. Biogeogr. 2005, 14, 549–563. [Google Scholar] [CrossRef]
  47. Joost, A.K.; Dingemans, B.J.; Sarneel, J.M.; Lehtinen, T.M.; Hefting, M.M. The Tea Bag Index for Decomposition: A standard decomposition reference for global comparison of scientific results. Utr. Univ. 2009, 94, 1. [Google Scholar]
  48. Emmett, B.A.; Reynolds, B.; Chamberlain, P.M.; Rowe, E.; Spurgeon, D.; Brittain, S.A.; Frogbrook, Z.; Hughes, S.; Lawlor, A.J.; Poskitt, J.; et al. Countryside Survey: Soils Report from 2007: CS Technical Report No. 9/07; Centre for Ecology & Hydrology: Wallingford, UK, 2010. [Google Scholar]
  49. Wang, W.J.; Baldock, J.A.; Dalal, R.C.; Moody, P.W. Decomposition dynamics of plant materials in relation to nitrogen availability and biochemistry determined by NMR and wet-chemical analysis. Soil Biol. Biochem. 2004, 36, 2045–2058. [Google Scholar] [CrossRef]
  50. Edmondson, J.L.; Davies, Z.G.; McCormack, S.A.; Gaston, K.J.; Leake, J.R. Land-cover effects on soil organic carbon stocks in a European city. Sci. Total Environ. 2014, 472, 444–453. [Google Scholar] [CrossRef] [PubMed] [Green Version]
  51. Powlson, D.S.; Bhogal, A.; Chambers, B.J.; Coleman, K.; Macdonald, A.J.; Goulding, K.W.T.; Whitmore, A.P. The potential to increase soil carbon stocks through reduced tillage or organic material additions in England and Wales: A case study. Agric. Ecosyst. Environ. 2012, 146, 23–33. [Google Scholar] [CrossRef]
  52. Poulton, P.; Johnston, J.; Macdonald, A.; White, R.; Powlson, D. Major limitations to achieving “4 per 1000” increases in soil organic carbon stock in temperate regions: Evidence from long-term experiments at Rothamsted Research, United Kingdom. Glob. Chang. Biol. 2018, 24, 2563–2584. [Google Scholar] [CrossRef] [PubMed] [Green Version]
  53. Duddigan, S.; Shaw, L.J.; Alexander, P.D.; Collins, C.D. Chemical Underpinning of the Tea Bag Index: An Examination of the Decomposition of Tea Leaves. Appl. Environ. Soil Sci. 2020, 2020, 6085180. [Google Scholar] [CrossRef]
  54. Dewaelheyns, V.; Elsen, A.; Vandendriessche, H.; Gulinck, H. Garden management and soil fertility in Flemish domestic gardens. Landsc. Urban Plan. 2013, 116, 25–35. [Google Scholar] [CrossRef]
  55. Livesley, S.J.; Ossola, A.; Threlfall, C.G.; Hahs, A.K.; Williams, N.S.G. Soil Carbon and Carbon/Nitrogen Ratio Change under Tree Canopy, Tall Grass, and Turf Grass Areas of Urban Green Space. J. Environ. Qual. 2016, 45, 215–223. [Google Scholar] [CrossRef]
  56. Jo, H.K.; McPherson, E.G. Carbon storage and flux in urban residential greenspace. J. Environ. Manag. 1995, 45, 109–133. [Google Scholar] [CrossRef] [Green Version]
  57. Pouyat, R.V.; Yesilonis, I.D.; Nowak, D.J. Carbon Storage by Urban Soils in the United States. J. Environ. Qual. 2006, 35, 1566–1575. [Google Scholar] [CrossRef] [Green Version]
  58. Rawlins, B.G.; Vane, C.H.; Kim, A.W.; Tye, A.M.; Kemp, S.J.; Bellamy, P.H. Methods for estimating types of soil organic carbon and their application to surveys of UK urban areas. Soil Use Manag. 2008, 24, 47–59. [Google Scholar] [CrossRef] [Green Version]
  59. Lorenz, K.; Lal, R. Biogeochemical C and N cycles in urban soils. Environ. Int. 2009, 35, 1–8. [Google Scholar] [CrossRef] [PubMed]
  60. Cleveland, D.A.; Phares, N.; Nightingale, K.D.; Weatherby, R.L.; Radis, W.; Ballard, J.; Campagna, M.; Kurtz, D.; Livingston, K.; Riechers, G.; et al. The potential for urban household vegetable gardens to reduce greenhouse gas emissions. Landsc. Urban Plan. 2017, 157, 365–374. [Google Scholar] [CrossRef]
  61. Paul, K.; Quinn, M.S.; Huijser, M.P.; Graham, J.; Broberg, L. An evaluation of a citizen science data collection program for recording wildlife observations along a highway. J. Environ. Manag. 2014, 139, 180–187. [Google Scholar] [CrossRef]
  62. Martin, V.Y. Citizen science as a means for increasing public engagement in science: Presumption or possibility? Sci. Commun. 2017, 39, 142–168. [Google Scholar] [CrossRef]
  63. Lakeman-Fraser, P.; Gosling, L.; Moffat, A.J.; West, S.E.; Fradera, R.; Davies, L.; Ayamba, M.A.; van der Wal, R. To have your citizen science cake and eat it? Delivering research and outreach through Open Air Laboratories (OPAL). BMC Ecol. 2016, 16, 57–70. [Google Scholar] [CrossRef] [Green Version]
  64. UN General Assembly. Work of the Statistical Commission pertaining to the 2030 Agenda for Sustainable Development (A/RES/71/313). Gen. Assem. 2017, 71, 1–25. [Google Scholar]
  65. Charles, A.; Rochette, P.; Whalen, J.K.; Angers, D.A.; Chantigny, M.H.; Bertrand, N. Global nitrous oxide emission factors from agricultural soils after addition of organic amendments: A meta-analysis. Agric. Ecosyst. Environ. 2017, 236, 88–98. [Google Scholar] [CrossRef]
  66. Thangarajan, R.; Bolan, N.S.; Tian, G.; Naidu, R.; Kunhikrishnan, A. Role of organic amendment application on greenhouse gas emission from soil. Sci. Total Environ. 2013, 465, 72–96. [Google Scholar] [CrossRef]
  67. Kaartinen, R.; Hardwick, B.; Roslin, T. Using citizen scientists to measure an ecosystem service nationwide. Ecology 2013, 94, 2645–2652. [Google Scholar] [CrossRef]
  68. UK Government Office for National Statistics. Overview of the UK Population; UK Government Office for National Statistics: London, UK, 2019.
Figure 1. Decomposition rate, k, as determined by the tea bag index: (a) samples where organic amendments have not been applied (with lawns included, n = 250); (b) samples where organic amendments have been applied (n = 261). See Table 2 for results from restricted maximum likelihood (REML) mixed effects model, and Table S1 for mean values according to amendment application and environmental zone. * Environmental zones defined by Metzger et al. [46].
Sustainability 12 06895 g001
Figure 2. Stabilisation factor, S, as determined by the tea bag index: (a) samples where organic amendments have not been applied (with lawns included, n = 250); (b) samples where organic amendments have been applied (n = 261). See Table 2 for results from restricted maximum likelihood (REML) mixed effects model, and Table S1 for mean values according to amendment application and environmental zone. * Environmental zones defined by Metzger et al. [46].
Sustainability 12 06895 g002
Figure 3. Total soil carbon of returned soil samples: (a) samples where organic amendments have not been applied (with lawns included, n = 250); (b) samples where organic amendments have been applied (n = 261). See Table 2 for results from restricted maximum likelihood (REML) mixed effects model, and Table S1 for mean values according to amendment application and environmental zone. * Environmental zones defined by Metzger et al. [46].
Sustainability 12 06895 g003
Figure 4. Total soil nitrogen of returned soil samples: (a) samples where organic amendments have not been applied (with lawns included, n = 250); (b) samples where organic amendments have been applied (n = 261). See Table 2 for results from restricted maximum likelihood (REML) mixed effects model, and Table S1 for mean values according to amendment application and environmental zone. * Environmental zones defined by Metzger et al. [46].
Sustainability 12 06895 g004
Figure 5. C:N ratio of returned soil samples: (a) samples where organic amendments have not been applied (with lawns included, n = 250); (b) samples where organic amendments have been applied (n = 261). See Table 2 for results from restricted maximum likelihood (REML) mixed effects model, and Table S1 for mean values according to amendment application and environmental zone. * Environmental zones defined by Metzger et al. [46].
Sustainability 12 06895 g005
Figure 6. Example of within garden variation of decomposition rate and z transformation from one participant (participant ref: 242).
Sustainability 12 06895 g006
Figure 7. Effect of amendment application on within garden variation of Tea Bag Index and soil analysis. Expressed as a z score calculated from the mean of all samples returned by the participant. Error bars represent standard error (amendment application n = 212, no amendments n = 198). Treatments that are labelled with the same lower case letter were not significantly different according to REML mixed effect model with Tukey’s post hoc testing (p > 0.05).
Sustainability 12 06895 g007
Figure 8. Decomposition rate z score, under different plant cover classes according to REML mixed effects model, with lawns included and lawns omitted. Treatments that are labelled with the same lower case letter in the same section were not significantly different according to Tukey’s post hoc testing (p > 0.05).
Sustainability 12 06895 g008
Table 1. Mean tea bag index and soil sample analysis for lawn samples in the two environmental zones. Significant difference in environmental zones, according to general linear modelling (GLM) are shown in bold. Lawn samples are also compared to samples elsewhere in the garden (not lawn) that did not have amendments applied. Significant differences in lawn/not lawn samples, according to general linear modelling, are shown in bold.
Decomposition Rate, kStabilisation Factor, STotal Soil C (%)Total Soil N (%)C:N
Lawns only (no amendments applied)Atlantic Central
(n = 106)
0.014 ± 0.0010.187 ± 0.0076.39 ± 0.290.41 ± 0.0215.80 ± 0.43
Atlantic North
(n = 32)
0.015 ± 0.0010.203 ± 0.0147.29 ± 0.660.39 ± 0.0318.34 ± 0.84
GLM p-value (environmental zone as a factor)0.6310.5060.3970.808<0.01
No amendments appliedLawn (n = 138)0.014 ± 0.0010.191 ± 0.0076.59 ± 0.270.62 ± 0.2116.26 ± 0.41
Not lawn (n = 112)0.017 ± 0.0010.175 ± 0.0087.94 ± 0.500.42 ± 0.0219.06 ± 0.64
GLM p-value (location in garden as a factor)<0.050.530<0.050.693<0.01
Table 2. Summary of results from restricted maximum likelihood (REML), mixed effects model for all returned tea bag index—UK samples (n = 511). Modelled using environmental zone, location in garden (lawn/not lawn), and amendment application as fixed factors, with interactions. Values displayed are the p values for all samples (n = 511) from REML tests of mixed effects (significant values in bold).
p-Value from REML Mixed Effect Model
TermLevelsDecomposition Rate, kStabilisation Factor, STotal Soil C (%)Total Soil N (%)C:N
Environment ZoneAtlantic Central; Atlantic North0.2960.1320.0740.729<0.05
Location in GardenLawn; Not lawn<0.050.6540.2510.869<0.05
Apply Amendments?Yes; No0.1600.576<0.05<0.050.587
Environmental Zone × Location in Garden 0.7450.9400.1820.6350.553
Environmental Zone × Apply Amendments? 0.9020.6150.9170.7710.896
Table 3. Summary of results from restricted maximum likelihood (REML), mixed effects model with lawn samples excluded (n = 373). Modelled using environmental zone, location in garden (lawn/not lawn), and amendment application as factors, with interactions. Values displayed are the p values for all samples (n = 511) from REML tests of mixed effects (significant values in bold).
p-Value from REML Mixed Effect Model
TermLevelsDecomposition Rate, kStabilisation Factor, STotal Soil C (%)Total Soil N (%)C:N
Environment ZoneAtlantic Central; Atlantic North0.205<0.050.5350.396<0.05
Apply Amendments?Yes; No0.2210.937<0.05<0.050.806
Environmental Zone × Apply Amendments? 0.9420.9890.9850.7310.567

