Article

Multi-Criteria Decision Method for Sustainable Watercourse Management in Urban Areas

by
Priscila Celebrini de Oliveira Campos
1,*,
Tainá da Silva Rocha Paz
2,
Letícia Lenz
1,
Yangzi Qiu
3,
Camila Nascimento Alves
1,
Ana Paula Roem Simoni
4,
José Carlos Cesar Amorim
1,
Gilson Brito Alves Lima
2,
Maysa Pontes Rangel
4 and
Igor Paz
1,*
1
Instituto Militar de Engenharia, 80 Praça General Tibúrcio, Praia Vermelha, Rio de Janeiro 22290-270, Brazil
2
Department of Production Engineering, Universidade Federal Fluminense, 152-470 R. Passo da Pátria, São Domingos, Niterói 24210-240, Brazil
3
Hydrology, Meteorology and Complexity (HMCO), Ecole des Ponts ParisTech, University of Paris-Est, 77455 Champs-sur-Marne, France
4
Department of Civil Engineering, Centro Universitário Redentor, 25 BR 356, Itaperuna 28300-000, Brazil
*
Authors to whom correspondence should be addressed.
Sustainability 2020, 12(16), 6493; https://doi.org/10.3390/su12166493
Submission received: 14 July 2020 / Revised: 1 August 2020 / Accepted: 3 August 2020 / Published: 12 August 2020
(This article belongs to the Special Issue Urban Stormwater Management by Green Infrastructure)

Abstract

:
The rapid urban growth followed by disordered occupation has been generating significant impacts on cities, bringing losses of an economic and social nature that directly interfere with the well-being of the population. In this work, a proposal for local urban infrastructure problems associated with watercourse management is presented, comparing Sustainable Drainage System (SuDS) techniques and Low-Impact Development (LID) concepts with alternative traditional interventions. The study addresses sustainable alternatives to cope with the urbanization of the Cehab’s open channel, which is an important urban watercourse tributary of the Muriaé River, at the municipality of Itaperuna, Rio de Janeiro—Brazil. The multi-criteria decision-making method called Technique for Order Preference by Similarity to Ideal Solution (TOPSIS) was applied here. The results highlighted the better performance of sustainable techniques when compared to the traditional ones, with an overall advantage of the geogrids and geocells for this case study. The obtained TOPSIS coefficients-C for these techniques were higher (0.59488, for Reach 1; and 0.68656, for Reach 2) than those for the others. This research, therefore, presented an important urban watercourse management methodology that can be further applied to guide sustainable investments and help the decision-making associated with the development of territories.

1. Introduction

Accompanied by the development of society and cities, the concepts of urban infrastructure have been adjusted through time. The advance in the urbanization process has resulted in changes in land use and occupation. Furthermore, due to the close relationship between urban and drainage infrastructure, the impacts could also be largely observed in the hydrological cycle [1,2,3,4,5,6,7]. Practices such as the suppression of existing vegetation and increased soil waterproofing, as a consequence, have contributed to the reduction of local infiltration conditions, excessively increasing the rainwater volume to be drained by the surface [8,9].
The conventional drainage systems are characterized to adopt techniques with basic principles of meander straightening (rectification) that tend to accelerate the flow in the channels, mostly conducted for local flood control [10,11]. These systems are considered as focusing on the drainage network itself, shortening along-channel distances and increasing the steepness of the slopes in order to drain local excess rainwater. Although these techniques reduce flood elevations in a given area, they create some detrimental effects (e.g., increasing settlement and flooding downstream, reducing fish habitat, and increasing degradation of the channel bed) [11,12,13]. For this reason, the dependence on the constant increase in the capacity of channels and pipes is not considered efficient for the control and management of the system. Such perspective of drainage projects directly influences the increase in the speed of surface runoff and maximum discharges, tends to reduce the restitution of groundwater and increase the constant floods, especially on the downstream course. As a sequence, numerous measures to balance the changes imposed by urban growth in the water cycle have been developed, enabling changes in the path of sustainability to the traditional concept.
Nowadays, the issue of a sustainable city, where water occupies a prominent place, is increasingly becoming a concern of citizens and managers [10,14]. Sustainability is usually expressed by its “three pillars”: social, economic, and environmental [15,16,17]. In his review, Keivani [18] highlighted the main challenges of urban sustainability. Some of them are the huge intra-urban inequalities that cities are prone to (social); the severe challenges for sustainable economic growth that cities are faced with [16] (economic); the impacts of the greenhouse gases (GHG) released on the world climate and the impacts of climate change on living conditions due to extreme events and natural hazards such as heatwaves, hurricanes, and floods [3,6,7,19] (environmental); and the consequences of urban form and spatial development on the sustainable development [4,5] (environmental and economic). The main concern is to maximize these three sustainable dimensions, albeit the intrinsic conflicts among them and the commonly required trade-offs [20,21,22].
The sustainability of the urban environment must take into account key elements interconnected to the progress of the city, forming a complex and multidisciplinary scenario. In that regard, the United Nations established Sustainable Development Goal 6 (SDG 6, Ensure availability and sustainable management of water and sanitation for all), which considers eight global targets that should be accounted for by decision-makers while dealing with water and sanitation issues [23]. This goal demonstrates the attention given by the 2030 Agenda to the dependence of social development and economic prosperity on the management of water resources and water-related ecosystems. The impacts, therefore, of an urban drainage system not properly conceived can result in a considerable change in the ecosystem and the quality of life of the community.
Thus, some concepts emerged as alternatives to add value and quality to the environment and the community, such as the Sustainable Drainage Systems (SuDS) [24] and the Low Impact Development (LID), which address the use of techniques to increase the storage and infiltration, improve rainwater use and destination, and decrease surface flow [3,25,26,27]. In the same context, Nature-Based Solutions (NBS), which are broadly defined as solutions to societal challenges that are inspired and supported by nature, seek sustainable techniques as alternatives to respect the natural aspects of the environment, minimizing the effects of urbanization on the hydrological cycle [24]. They can be used as a sustainable and successful strategy to restore and rehabilitate degraded ecosystems [28,29]. Keesstra et al. [30] showed the potential of NBS as a cost-effective long-term solution for hydrological risks and land degradation, promoting desirable soil and landscape functions of catchment systems. Additionally, as stated in Raymond et al. [24], NBS can have environmental, social, and economic co-benefits.
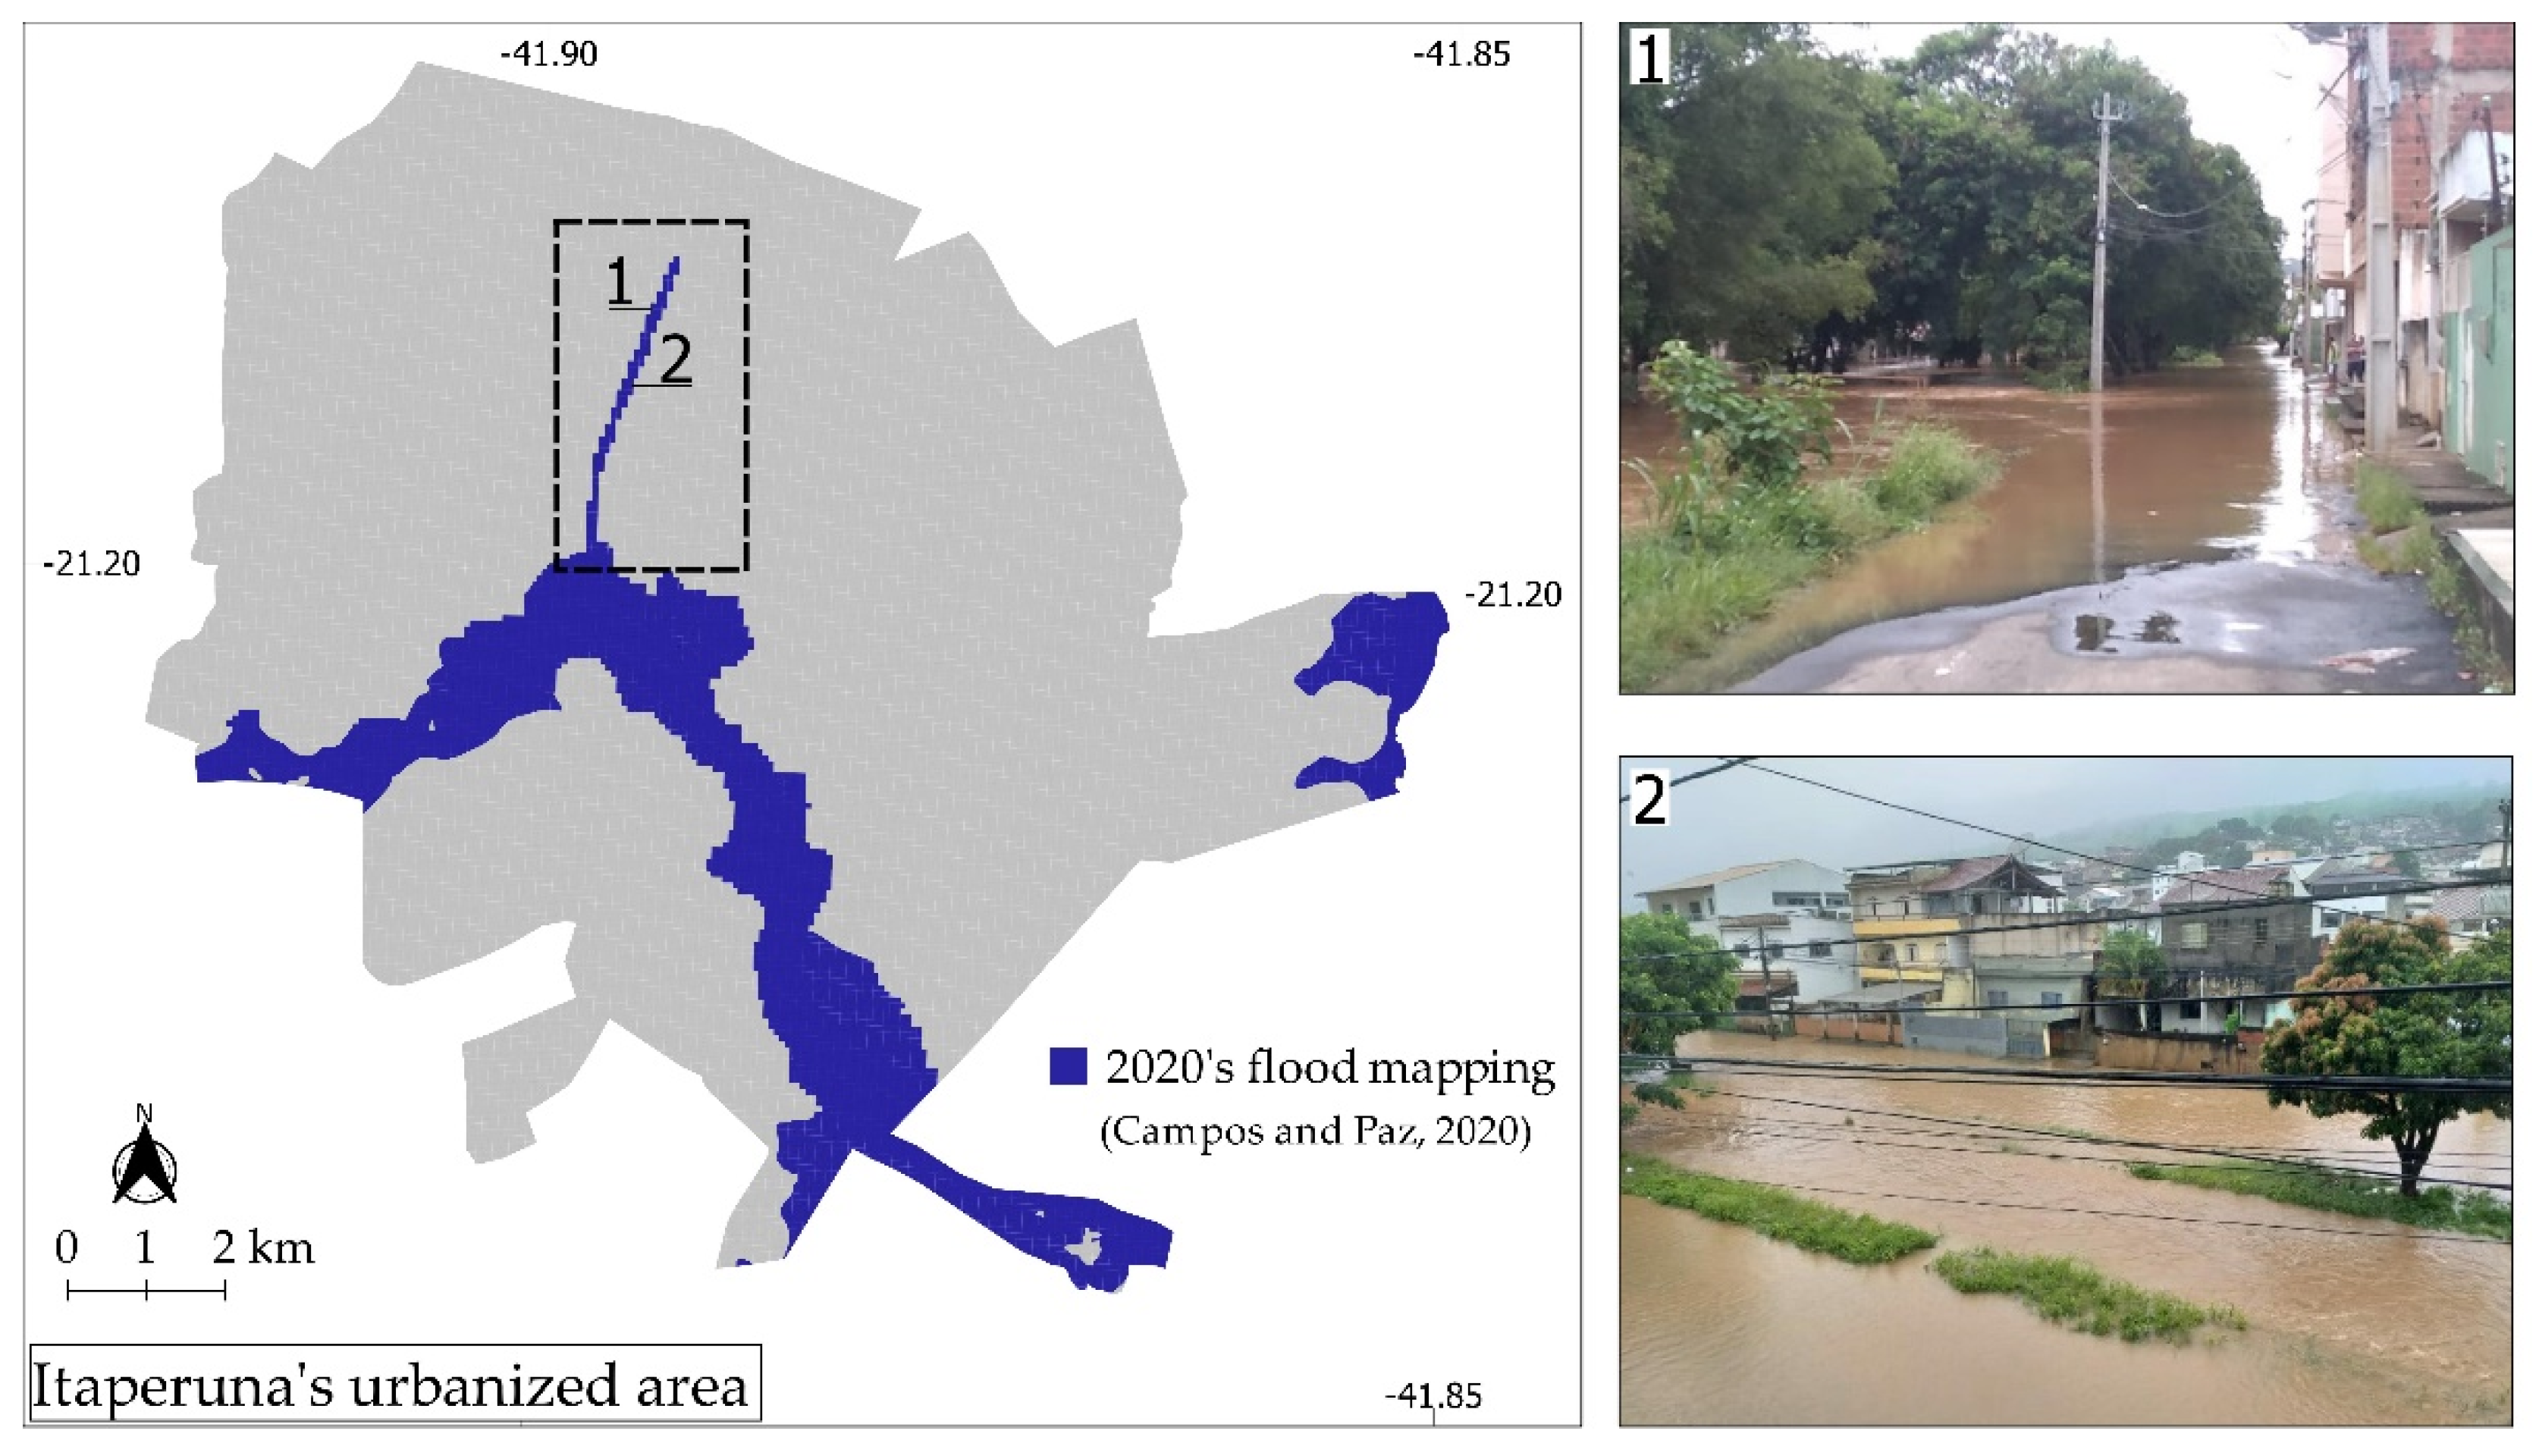
In connection with this, this research approached the Cehab’s open channel as the case study, located in the center of the urbanized area of the municipality of Itaperuna, in the Northwest region of the state Rio de Janeiro—Brazil, with approximately 100,000 inhabitants [31], inside the Muriaé River catchment [19]. This watercourse is frequently subject to floods (associated with the urbanization), affecting the local population which urgently requires an engineering intervention, as diagnosed by Campos and Paz [19].
This work aims to present an application of a multi-criteria decision methodology to the sustainable watercourse management in urban areas, which will support organizational decisions related to investments in sustainability measures. The use of the Technique for Order Preference by Similarity to Ideal Solution (TOPSIS) [32] was proposed as Multi-Criteria Decision Method (MCDM) model to analyze the sustainability of possible watercourse interventional techniques. The main goals of this study are to develop and implement a sustainable approach to the diagnosis of the watercourses and their riverside conditions, and the selection and implementation of the more sustainable engineering interventions in the watercourses, especially those flowing through consolidated urban areas.
Thereby, the core contributions expected from the presented approach are to guide sustainable investments and help the decision-making associated with the development of territories, by indicating the best choice(s) among the possible (traditional or sustainable) interventional techniques, based on sustainability indicators related to the economic, environmental, and social dimensions. Finally, although the present research has been applied to a Brazilian case study, it should be noted that this approach can be replicated to other regions, in developing and/or developed countries, with the help of sustainability indexes.

2. Materials and Methods

2.1. Case Study

The municipality of Itaperuna is located in the Northwest region of the Rio de Janeiro state, in Brazil, with a semi-urbanized 1105.341 km2 area and an estimated population of 103,224 inhabitants in 2019 [31]. The entire municipality territory is placed inside the Muriaé River basin, which has a total area of 8126 km2 and whose main river (the Muriaé River, about 300 km long) crosses the urbanized center of Itaperuna [33,34].
The historical deforestation process of the Muriaé River basin and the following irregular occupation of the riverbanks of the Muriaé River and its tributaries, especially in urban areas (such as the urbanized area of Itaperuna), have negatively affected the local population [34].
In this work, we chose as a case study the Cehab’s open channel, also known as Porto Alegre Channel. It consists of the main element of urban macro drainage located in the urban area of the municipality of Itaperuna. The watercourse extends through the districts of Governador Roberto Silveira and Presidente Costa e Silva (Figure 1) about 1740 m long, located in the main route of communication between the central region and other neighborhoods of the municipality.
The case study region is considered mostly residential, with some commercial establishments and places for public use by the extension of the watercourse’s riparian areas. The channel presents, at some points, streambank instability and settlement in the stream bed, causing the accumulation of stilling water. The urban environment found in the riparian area of the channel undeniably resulted in the degradation of the urban landscape, public health problems, and difficulties in urban traffic of pedestrians and drivers. Besides, the studied area has been an issue of recurrent floods (also related to the urbanization and consequent occupation of the channel’s and main streambanks). Figure 2 displays the flood mapping of the urbanized area of Itaperuna during the major event of January 2020 [19], in which it is possible to identify the case study watercourse been affected.
Therefore, in view of the devaluation imposed by the current situation, it is necessary to develop a project proposal that contemplates new pavements for the roads and containment of the streambanks, an increase of the green area and aesthetic values, resulting, consequently, in the improvement of the quality of life.

2.2. Conceptual Framework

The proposed methodology of this work consists of analyzing the sustainability of possible interventional engineering techniques to be applied at watercourses, especially those flowing through consolidated urban areas. Figure 3 presents the conceptual framework idealized in this work.
Firstly, a diagnosis of the watercourse and its riverside conditions was performed. Then, the sustainability indicators (criteria) were defined and the possible interventional techniques (alternatives) were listed. Thus, we elaborated on the decision matrix, in order to finally apply the TOPSIS multi-criteria decision method. Once the results of the method application were obtained, we could rank the techniques and discuss and make considerations about them.

2.3. Diagnosis of Watercourse and Riverside Conditions

The analysis of the impacts of interventional measures on a watercourse has to be preceded by a detailed diagnosis of the watercourse and its riverside conditions. For this preliminary assessment, we subdivided the watercourse in reaches with homogeneous characteristics, in order to consider the entire length of each reach separately. Figure 4 displays the framework of the methodology applied to perform the diagnosis of watercourse and riverside conditions.
The analysis consists of an overall evaluation subdivided into four steps. Firstly, we analyzed the local vulnerability to the flood occurrences according to the frequency of the events: rare, corresponding to a flood with more than ten years to occur; occasional, between two and ten years; common, once a year; and very common, described as an event with more than once a year of frequency. Subsequently, the next topic evaluated the watercourse geometry according to the preservation of the natural sinuosity and shape or the interventional occurrence that altered the original form, identifying the analyzed reach as free surface flow or closed-section, with a natural or coated bed, and natural or coated streambank; followed by the assessment of the potential manifestation of streambank erosion/landslide and stream bed silting. Then, the potential of watercourse pollution was verified, which affects water quality. Lastly, we analyzed the existence of occupation in both streambanks up to 30 m of the stream riparian area.

2.4. Multi-Criteria Analysis

The Multi-Criteria Decision Methods (MCDM) are capable of assisting decision-makers in problems that present several alternatives and criteria [35,36]. These methods make it possible to order, compare, or choose the best solution [37,38]. In this context, several methods have been developed, such as Analytic Hierarchy Process (AHP) [39], VlseKriterijumska Optimizcija I Kaompromisno Resenje (VIKOR) [40], Elimination et Choix Traduisant la Réalité (ELECTRE) [41], Data Envelopment Analysis (DEA) [42], Technique for Order Preference by Similarity to Ideal Solution (TOPSIS) [32], Preference Ranking Organization Method for Enrichment Evaluation (PROMETHEE) [43], an acronym in Portuguese for Interactive Multi-Criteria Decision-Making (TODIM) [35], among others.
According to Alamanos et al. [44], Bianchini [45], Paz [46], Hamurcu and Eren [47], the TOPSIS method is widely used, because the logic of application of the method is understandable by using a mathematical approach that allows the identification of human logic through a simple calculation process, and maintains the same number of steps independent of the number of alternatives and criteria. This method has been applied to sustainability studies involving environmental, social, or economic dimensions, making it possible to evaluate different alternatives concerning the different criteria [37,38].
The TOPSIS method was developed by Hwang and Yoon [32] and has aimed to order the alternatives from the evaluation of their performance in relation to the similarity with the ideal solution. In this sense, as exposed by Chung et al. [48], for this method, the best alternative is the one closest to the Positive Ideal Solution (PIS) and farthest from the Negative Ideal Solution (NIS). According to Silva et al. [49], PIS is a solution that maximizes benefit criteria and minimizes cost criteria, while NIS is a solution that minimizes benefit criteria and maximizes cost criteria, with PIS being composed of the best possible values of benefit criteria, while NIS is composed of the worst possible cost values. In this case, it was defined as the benefit criteria as those related to a positive impact (the bigger, the better) and cost criteria as those with negative impact (the smaller, the better).
Regarding the above, following Hwang and Yoon [32], Silva et al. [49], Caiado et al. [50], and Sirá et al. [51], the steps for applying the TOPSIS method are described as follows:
  • Elaborate the decision matrix considering m alternatives and n criteria, in which x i j represents the performance of the alternative i according to the criterion j :
    X m n = [ x 11 x 1 n x m 1 x m n ]
  • Normalize the values of the decision matrix in the range from 0 to 1:
    y i j = x i j / i = 1 m x i j 2 ;   j = 1 ,   2 ,   ,   n
  • Calculate the weighting of the normalized decision matrix, in which w j is the weight of the criterion j :
    r i j = w j y i j ;   i = 1 ,   2 ,   ,   m   and   j = 1 ,   2 ,   ,   n
  • Determine the Positive Ideal Solution (PIS) and Negative Ideal Solution (NIS):
    PIS = { M a x j r i j |   j = 1 , 2 , , n } = { r 1 + , r 2 + , , r n + }
    NIS = { M i n j r i j |   j = 1 , 2 , , n } = { r 1 , r 2 , , r n }
    where r i j is the element of the decision matrix corresponding to the alternative i and the criterion j; and, considering J + as the set of benefit criteria (the bigger, the better) and J as the set of cost criteria (the smaller, the better), r j + and r j are defined as:
    r j + = { max r i j ,   j J + min r i j ,   j J
    r j = { min r i j ,   j J + max r i j ,   j J
  • Calculate the distance of each alternative to the Positive Ideal Solution ( D i + , in Equation (8)) and the Negative Ideal Solution ( D i in Equation (9)):
    D i + = j = 1 n ( r i j r j + ) 2 ;   i = 1 ,   2 ,   ,   m
    D i = j = 1 n ( r i j r j ) 2 ;   i = 1 ,   2 ,   ,   m
  • Calculate the approximation coefficient ( C i ), which varies between 0 and 1:
    C i = D i / ( D i + + D i )
  • Sort the alternatives downwards concerning the result of the approximation coefficient.
Finally, after firstly defining the criteria (sustainability indicators) and the possible alternatives (interventional techniques), and then applying the TOPSIS method to sort the alternatives according to the chosen criteria, we can define which interventional techniques would be best suited for each watercourse.

2.5. Criteria: Sustainability Indicators

In this multi-criteria methodology, we have used the concept of sustainability indicators as criteria to support watercourse management decisions associated with interventional measures (especially in urban areas). These indicators are therefore related to the three pillars of sustainability: the economic, environmental, and social dimensions [15,16,17]. In that regard, Table 1 displays the criteria employed in this study, followed by their descriptions. The impact column presents the behavior of each indicator where ▲ means the bigger, the better and ▼ means the smaller, the better. The weights given for each criterion were adapted from those obtained by Cardoso [52], which realized detailed research with a multidisciplinary group of specialists.
where:
  • ENV1: This indicator refers to the preservation and the restoration of the natural conditions of the watercourse, concerning the evaluation of several items, such as: the recovery of their riparian areas; integration of the stream as a natural environmental element (maintenance of its open channel and the natural coating of its bed and banks); and planting of native plant species to recover part of the original character of the local landscape [53,54]. In summary, minimal anthropic intervention in the watercourse is expected, in order to keep its appearance as close as possible to the natural and recapture the characteristics of the watercourse previous to the urbanization process.
  • ENV2: The permeabilization indicator assesses the use of nature coatings (e.g., vegetation-based uncovered soil) on stream bed and streambanks that favor the water infiltration [1,5,25].
  • ENV3: Recovery degraded areas, such as the banks of the watercourse through planting adequate vegetation to withstand flood events and to protect the soil from erosive processes [54], besides the landscape treatment of the riparian buffer zone to the recuperation of such areas [5,55,56,57,58,59].
  • ENV4: Evaluation of the stabilization potential of streambanks, aiming at the protection of the slope against erosion, landslides, or another form of mass wasting [54,60,61,62,63,64].
  • ENV5: The indicator of the increased diversity of habitats and biomass both in the watercourse and in its riverside areas [65] can be analyzed according to the use of suitable coatings in its bed and banks, recovery of the degraded area, as well as the creation of riparian protection zones [56,57,65,66].
  • ENV6: This indicator addresses the vulnerability of local flood and the impacts on the riparian areas of watercourse [1,45,67,68,69].
  • ENV7: This item assesses the impact of the implemented techniques to the acceleration of the water flow and, consequently, the anticipation of the flood peaks downstream [70,71,72,73].
  • ENV8: Proliferation of insects resulting from the increase of the natural coatings, vegetation, and native species [52].
  • SEC1: Necessity of the expropriation and removal of the resident population in the intervention area, generating a negative impact on the riparian community area [52].
  • SEC2: Assessment of improving the aesthetics characteristics along the river corridor and the creation of leisure areas to the riparian community [52,55,73,74].
  • SEC3: The financial valuation could be analyzed through the concept of the valorization of the area, given the recovery of degraded areas, the sanitary condition incorporated to eliminate the local pollution, the creation of leisure areas, and equipment for the population [52,69,73,75].

2.6. Alternatives: Interventional Techniques

All changes that occur in a drainage basin, regarding climatic conditions, vegetation cover, and lithology, have repercussions, directly or indirectly, on watercourses [76]. Modifying agents, which cause changes in watercourses, are natural events or anthropic activities that occur separately or simultaneously. Individually or in combination, these disturbances cause tensions in the flow of the river that could modify the watercourse structure and impair its ability to perform hydraulic functions [77]. An occurrence of a disturbance in the watercourse or riparian areas typically produces a cause-effect chain, which can permanently change one or more characteristics of a stable system [78].
The effects of the interventional measures may cause local impacts or at points far from the origin. Activities of rectification of watercourses, construction of dams, forest management, construction and maintenance of roads, agricultural planting and irrigation, as well as urban invasion, are forms of disturbances and can have dramatic effects on the geomorphology and hydrology of a watershed and the morphology and hydraulics of a watercourse. The modification of the flow hydraulics, for example, directly affects the system, causing an increase in the intensity of disturbances caused by floods [77,78].
Stabilization structures have been intended to protect the streambanks and control erosive processes. In order to contain erosion and prevent or mitigate its consequences, techniques with conventional coating applications are commonly used in streambank stabilization, such as riprap, gabion, concrete plates, among others, acting as a rigid protection structure [79]. Another technique traditionally used is rectification, in which the watercourse is ground to reduce its meander and minimize the natural erosion process. However, in redefining the main stream bed and limiting its floodplain, rectification is an aggressive practice that destroys the balance of waterways and causes numerous physical and ecological impacts [57].
In recent decades, these traditional methods of streambank stabilization are being reassessed in the context of the resulting environmental impacts [77]. In addition to affecting the ecological integrity of watercourses, harming biodiversity variability, these methods often transfer erosion problems to other areas of the river. Little attention is paid to the side effects or impacts that these practices will have on upstream and/or downstream areas. Considering, therefore, the harmful effects of heavy engineering used in the rectification of natural watercourses, environmentally sensitive alternatives to conventional watercourse interventional techniques were sought in response to concerns about their environmental impacts, here called sustainable techniques [79].
In the Sustainable Drainage Systems (SuDS), fundamental aspects are considered for the implementation of sustainable techniques such as increasing storage and infiltration, improving rainwater use and destination, decreasing surface flow, and the valorization of urban land, seeking to better interact and further strengthen urban growth to socio-environmental perspectives [1,26,27]. To present itself as parallel as possible to natural behavior, the concept of Low Impact Development (LID) emerged in the United States in the 1980s. This concept addresses the use of techniques to increase the local capacity of interception, infiltration, and evaporation of rainwater, and even decrease the volume of surface flow [3,25,26,27]. Therefore, a LID project must be guided by some basic principles, such as preserving the natural drainage path, conserving the urban environment to conditions prior to urbanization, and minimizing impermeable surfaces [26,27].
Regarding the above, Table 2 presents a summary of the conventional and sustainable interventional techniques analyzed in this work, followed by their descriptions.
where:
  • T1: Induced natural meandering techniques aim to return the degraded river to its prior undisturbed condition [73,80]. The main objective of these techniques is to preserve the natural channel state, avoiding direct physical channel modification, or to promote natural meandering (when already in disturbed/non-natural conditions), in order to foster the stream’s ecological properties [81,82]. According to Modi et al. [63], the natural meandering can be induced by reconnecting the floodplain to the channel’s former course, widening the meander belt width to allow construction of a new channel at the existing elevation, changing stream types through in-stream morphological alterations and stabilizing the current incised channel in place. Nevertheless, Kondolf [80,83] verified that for historically non-meandering rivers, the creation of single-thread meandering channels had threatened channel stability. Therefore, in these cases, constructing riparian buffers is more effective than imposing meandering forms [73].
  • T2: Implementing riparian buffer zone (defined as the vegetative zone linking the terrestrial and aquatic environments [59,84]) and river corridor (defined as the land riparian to lakes or streams [85]) consists of the most effective means for protecting channel resources [86] through techniques focused on replenishing and augmenting the ecological quality and biotic diversity of these areas [73]. The riparian vegetation impacts positively on water quality, wildlife habitat, flood reduction, aesthetic impression, and financial valuation of the riparian regions [57,58,87,88]. The vegetation acts as a partial filter from surface runoff, removing the sediment and contaminants that would otherwise enter the stream without any form of treatment [57,58]. Aside from that, riparian vegetation also provides habitat for wildlife, and its tree foliage helps control stream temperatures for aquatic habitat [58,89]. Further, vegetated buffers contribute to flood peaks’ reduction by storing floodwaters [90]. Finally, in an aesthetical issue, the vegetation may also provide financial benefits [91], and it is observed that the riparian inhabitants will mostly prefer vegetative cover than visually intrusive concrete or stone riprap [56,92].
  • T3: Vegetation-based techniques [93,94] offer a natural healing process to the stream [64,95], positively impacting (as previously mentioned in the description of the group of techniques T2) on water quality, wildlife habitat, flood reduction, the aesthetic value of a stream and financial valuation of the riparian regions [57,58,64,87,88,95,96,97]. Furthermore, the physical vegetative coverage on streambanks protects the soil according to the combined effects of roots, stems, and foliage [61]. These effects are also related to improving streambank stabilization through soil–root interaction [61], decreasing flow velocities and dissipating flow energy by redistributing the flow pattern and direction [57], and reducing surface erosion [60,61]. Nevertheless, according to Schwarz et al. [60] and Vaverková et al. [61], vegetation’s use on streambanks may have both adverse and beneficial effects, depending on the circumstances, which highlights the need for not using a single perspective [57].
  • T4: Techniques related to constricting lateral channel dimensions and raising the stream bed, such as dams and embankments, normally aim to protect existing properties or infrastructure near streams [57]. Nevertheless, the impacts of increased runoff due to urbanization remain a problem to be solved. These engineering techniques are highly contested by the local population, especially regarding their usefulness, as they are usually more effective in the short term and have no long-term viability, not eliminating the risk of flooding [98,99,100,101,102]. Besides altering discharge and sediment fluxes, dams and embankments also contribute to the massive avulsion of the channel, leading to flooding in the lower regions [70,71,72,73]. Moreover, dams alter ecological habitats by imposing a barrier between upstream and downstream species [103,104].
  • T5: Impermeable stabilization structures, such as concrete mats and cell steel sheet piling, are categorized, according to Mondal and Patel [73] and Keown [105], as hard armoring-based measures, which are implemented to reinforce streambank shear strength. However, the use of such techniques reduces bank roughness and removes vegetation, which affects the natural stream’s ability, respectively, to dissipate flow energy (enhancing the flood and erosion downstream susceptibility) and to cool water temperature (making it more difficult for fish to survive and reproduce due to loss of riparian habitat, reduced diversity, etc.) [57,65,106].
  • T6: Permeable structures, such as gabion walls and riprap, are also categorized [73,105] as hard armoring-based measures implemented to reinforce streambank shear strength. Similarly to the group of techniques T5, these permeable structures also remove partially the vegetation, which diminish the stream’s ability to cool water temperature (impacting the riparian habitat, diversity, and fish reproduction) [57,65,106]. Nevertheless, differently from techniques T5, this group of techniques is characterized by being porous and draining coatings due to the voids index generated by the irregular contact between the stones.
  • T7: Geogrids and geocells are engineering techniques normally associated with the application of vegetation cover used to stabilize slopes, control surface erosion, and protect against flooding [107]. The first group corresponds to three-dimensional meshes made of organic and synthetic filaments, arranged in a crossed or interlaced manner. The geocells are cell confinement systems, made up of three-dimensional cells in different formats (e.g., honeycomb). They are used to simultaneously improve drainage and compaction capacity, reducing runoff and favoring water infiltration, in addition to preventing the direct action of erosive agents. However, if they are not well-executed, they do not integrate into the landscape, making it a strange element [108].
  • T8: The engineering technique of closed cross-section is usually executed below road lanes, to preserve traffic lanes and increase the flow of vehicles, however, in contrast to the natural environment, resulting from the drowning of the cross-section, and also increasing internal pressures on the channel walls. This hard-engineered channelization approach destroys the basic physical equilibrium of natural streams and has increased its ill effects, promoting numerous adverse physical and ecological impacts [57,109].
In the end, for each criterion, the alternatives will be valued according to the established impact levels of their implementation relative to the current watercourse conditions diagnosed. The methodology assumes a gradation scale to convert qualitative to quantitative indexes for the impact level evaluation of the criteria analyzed, as displayed in Table 3.
Table 3 illustrates that the impact level 1 means that the analyzed technique will promote a high reduction of the local conditions according to the analyzed criterion; 7 means a high increase; 4 means that the technique will not alter the local conditions according to that indicator; and the other values are intermediate impacts (2 and 3, for moderate and low reductions, respectively; 5 and 6, for low and moderate increases, respectively).

3. Results and Discussion

The Cehab’s open channel corresponds to a watercourse in an urban area, subject to the recurrent occurrence of floods that have impacted the local ecosystem and affected the population as diagnosed by Campos and Paz [19]. Therefore, an engineering intervention is urgent for this channel, in order to improve the watercourse management. In this context, this work brought a multi-criteria methodology to indicate which interventional technique (conventional or sustainable) would be better-suited for the studied channel.
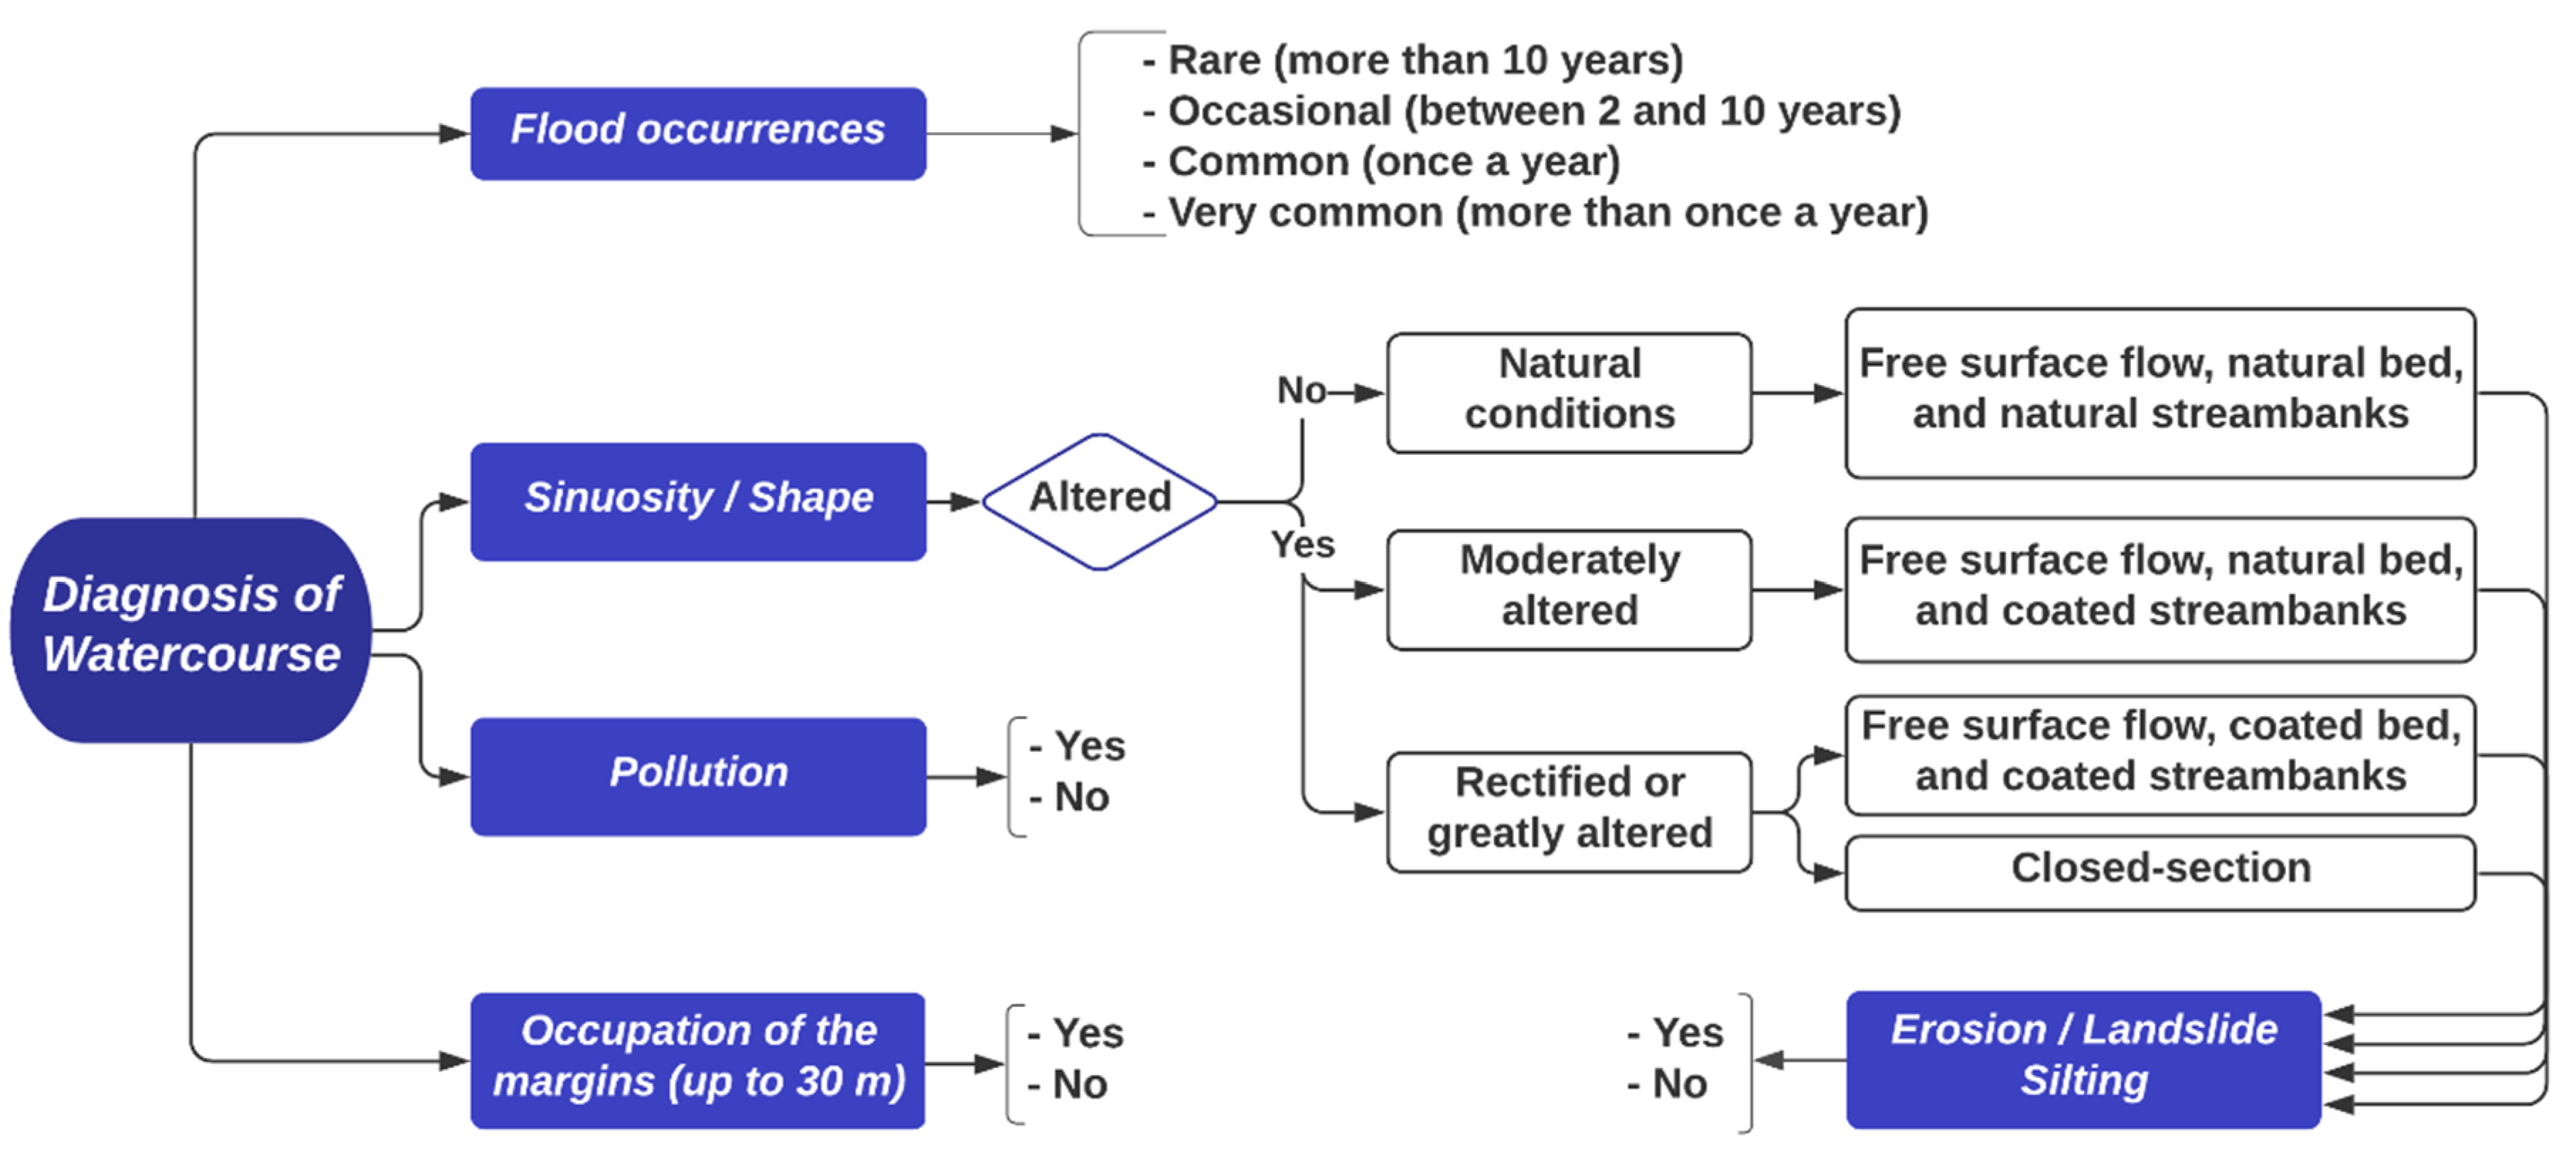
Firstly, we have performed the diagnosis of the case study watercourse conditions, which revealed a channel with irregular geometry along its whole length. In Cehab’s open channel, it was observed different streambanks’ surface conditions along the channel, and, thus, we subdivided it into two mostly homogeneous reaches, according to their physical characteristics (Table 4). The first reach extends from upstream up to 770 m, whereas the second part of the channel was considered from 770 m up to downstream at 1740 m (Figure 5).
In Reach 1, both streambanks are still found in a natural condition (Figure 5), with advanced erosion of the streambanks since there is no protection or containment of the slopes. As it approaches downstream, at Reach 2, the channel presents a free surface flow with moderated alterations of sinuosity and shape, with natural bed and coated streambanks, covered by a conventional rough concrete wall. The slopes of the watercourse are subject to the efforts resulting from the loading of traffic on the adjacent roads; as a consequence, at some points in the watercourse, we noticed landslides of the streambanks due to the lack/inefficiency of the containment structure.
Moreover, over the years, the channel bed has been subject to the actions of the silting caused by the deposition of sediments at the bottom of the stream. The resulted elevation of the channel bed has impacted the water flow, also triggering the accumulation of stilling water and consequently, creating an appropriate environment for the birth of vegetation inside the stream.
In that regard, the following analysis consisted of the evaluation of the interventional measures of each reach through the multi-criteria indexes. According to the aforementioned in Section 2.3, the first step of the TOPSIS method was the elaboration of the decision matrix with the actual values of the criteria for each of the eight alternatives. Table 5 and Table 6 present the decision matrix (Equation (1)), built considering the impact levels presented in Table 3, for Reach 1 and Reach 2, respectively.
After the elaboration of the decision matrices, the second and third stages of application of the TOPSIS method consisted of the normalization of the matrix and the weighting of the criteria, according to the weights established in Table 1, illustrated in Section 2.5. Table A1 and Table A2 present the normalized and weighted matrices for Reach 1 and Reach 2, respectively. These Tables were obtained applying the normalization and weighting methodologies, presented in Section 2.4 (see Equations (2) and (3)), to the corresponding decision matrices (Table 5 and Table 6, respectively).
Sequentially, the fourth step was to determine the positive ideal solution (PIS) and the negative ideal solution (NIS) for each criterion, according to Equations (4)–(7). Thus, Table 7 displays PIS and NIS for Reach 1, while Table 8 presents PIS and NIS for Reach 2.
The fifth step consisted of calculating the distance of each alternative to the positive ideal solution (D+), Equation (8), and to the negative ideal solution (D−), Equation (9). After calculating the distances, the sixth step featured with the calculation of the approximation coefficient (C) using Equation (10). This coefficient varies between 0 and 1, with 0 being the alternative with the worst solution and 1 being the alternative with the best solution. Finally, the seventh stage consisted of ranking the analyzed alternatives (interventional techniques). These three steps are represented in Table 9 and Table 10, for Reach 1 and Reach 2, respectively.
From Table 9, which presents the multi-criteria analysis results for Reach 1, we could identify that the interventional technique T7 (geogrids or geocells) was the most indicated to be implemented (considering current conditions), followed by the techniques T2 (riparian buffer zone/river corridor), T6 (permeable structures—gabion walls and riprap), T3 (vegetation-based—seeding, hydroseeding, live stakes, crib wall), T4 (constricting lateral channel dimensions and raising the stream bed—dams and embankments), T1 (induced natural meandering), T5 (impermeable stabilization structures—concrete mats and cell steel sheet piling), and T8 (closed cross-section). On the other hand, for Reach 2, Table 10 displays that the most indicated interventional technique was T7, followed by the techniques T6, T3, T2, T8, T5, T4, T1. It became clear, therefore, that the methodology results changed according to the current conditions of the studied watercourse, where, except for the fact that technique T7 was the best ranked to be implemented for both reaches, the order of the interventional techniques best suited for each reach was relatively different. Additionally, one could also note that the differences between the coefficients-C obtained for the first- and second-ranked techniques presented distinctions in the analysis of both reaches: for Reach 1, the coefficient-C difference between techniques T7 (first-ranked) and T2 (second-ranked) was approximately 0.025; whereas, for Reach 2, the coefficient-C difference between techniques T7 (also first-ranked) and T6 (second-ranked) was more than twice the value for Reach 1 (approximately 0.05). This also means that the advantage of the choice of T7 (as first-ranked, in comparison to the other techniques) for Reach 2 is more relevant than for Reach 1.
It is should be pointed out that, still with regards to the coefficients-C presented in Table 9 and Table 10, the average value of the coefficients estimated for Reach 1 (0.52828) was smaller than that for Reach 2 (0.56769), and the higher coefficient-C for Reach 1 (0.59488) was also smaller (0.68656). These results demonstrate that an engineering intervention in Reach 2 is more urgent than in Reach 1. Moreover, the standard deviations of the coefficients-C for Reach 1 (0.04212) was less than half of that for Reach 2 (0.08505), which corroborates the previously mentioned more relevant advantage of the choice of technique T7 for Reach 2 than for Reach 1. In the next section, Figure 6 brings a graphical representation of the ranking of interventional techniques for each watercourse reach.
Firstly, we noticed that the interventional technique T7 (geogrid or geocells) was the most indicated to be implemented (considering current conditions) for the whole watercourse (Reaches 1 and 2). This technique would be a good option, especially considering the good impacts on both environmental and socioeconomic indicators (see Table 5 and Table 6). According to the hydraulic perspective, the geogrid and geocells are well-indicated to sustainably rebuild the banks (when necessary), providing steep slopes due to the preservation of the cross-section under stable conditions and the potential for erosion of the streambanks [57,107,110]. Furthermore, some authors suggested that its implementation tends to delay the peak flow rate in the watercourse, to decrease the flow energy, and to improve the rainwater infiltration process into the soil [107,108].
It is also important to mention that the interventional technique T2 (riparian buffer and river corridor) presents the highest normalized and weighted values for almost all positive impact criteria (ENV1, ENV2, ENV3, ENV5, SEC2, and SEC3; see Table A1 and Table A2), except for ENV4 (which is also a positive criterion). This is ratified by the attributed PIS values, which correspond exactly to the normalized and weighted values of these criteria in both Reach 1 (0.047, for ENV1; 0.046, for ENV2; 0.037, for ENV3; 0.030, for ENV5; 0.032, for SEC2; and 0.025, for SEC3—see Table 7) and Reach 2 (0.036, for ENV1; 0.041, for ENV2; 0.030, for ENV3; 0.037, for ENV4; 0.025, for ENV5; 0.026, for SEC2; and 0.022, for SEC3—see Table 8). However, it requires an important area adjacent to the watercourse, which is commonly a restriction in unplanned urban areas (such as this case study). Therefore, the implementation of this technique would require the removal of the resident population (which corresponds to the socioeconomic indicator SEC1). This space restriction similarly affects the implementation of technique T1. Feldman and Gesleir [111] argued that human vulnerability to displacement (including of the riparian areas) is sensitive and complicated. Thus, since the increase of the width of the watercourse cross-section implies the expropriation of the riparian community for this case study, the techniques suitable to be implemented are those restricted to the interventions on the stream bed and streambanks.
Moreover, we could still observe from Figure 6 that both reaches presented the same four techniques in the first positions, which represent the alternatives that suit the thresholds of the local socio-economic conditions. They have, in common, good conditions of protection and containment of the streambanks (in particular, the T7 and T6 techniques), water infiltration capacity, recovery of green areas, increase in species, and financial valuation and aesthetics. The techniques T6 and T3 are both (in this order) well-ranked (3rd and 4th, respectively, for Reach 1; 2nd and 3rd, respectively, for Reach 2). Thus, if we did not consider technique T2 (due to the width restriction), we could identify that the techniques T7, T6, and T3 (in this order) are the alternatives that better suit the thresholds of the local socio-economic conditions [107], being the most sustainable watercourse interventional techniques to be implemented in this case study.

4. Conclusions

The advance in the urbanization process resulted in changes in land use and occupation, such as the suppression of existing vegetation and the increased soil impermeabilization, contributing to the increase in the volume and speed of surface runoff, resulting in flawed and/or insufficient drainage systems. The absence of sustainable planning in urban areas allowed the extension of urbanization to the lowland sites of watercourses. In that regard, the drainage systems emerged in order to solve/mitigate such problems. The conventional (or traditional) urban drainage systems focus on the drainage network, mostly conducted for local flood control, tending to accelerate the flow in the channels. Although these techniques reduce local flood elevations, they are not considered efficient for flood control and watercourse management. The impacts, therefore, of an urban drainage system not properly conceived can result in a considerable change in the ecosystem and the quality of life of the community. Thus, the concepts of Sustainable Drainage Systems (SuDS) and Low Impact Development (LID) appeared as alternatives to respect the natural aspects of the environment [26], minimizing the effects of urbanization on the hydrological cycle.
This research addressed a methodology to help the decision-making process associated with sustainable watercourse management in urban areas by selecting the best interventional techniques to be implemented. Cehab’s open channel, located in the urban area of the intermediate-sized municipality of Itaperuna (in the Northwest region of the state of Rio de Janeiro—Brazil), was used as a case study. This watercourse is frequently subject to floods (associated with the urbanization), affecting the local population, which urgently requires an engineering intervention. In that regard, a primary diagnosis of the watercourse and riverside conditions made possible the development of a set of traditional and sustainable techniques to meet local interventional requests. These techniques were then analyzed based on sustainability indicators accounting for the environmental, social, and economic dimensions. Thus, we employed the Multi-Criteria Decision Method (MCDM) called Technique for Order Preference by Similarity to Ideal Solution (TOPSIS), which is based on the evaluation of benefits and costs, to analyze the possible watercourse interventional techniques from a sustainable point of view [44], and to rank them in order to indicate which technique would be better-suited for each reach of the studied watercourse. The multi-criteria analysis for Reach 1 (which presents both banks in natural condition but with advanced erosion) presented the interventional technique T7 as the most indicated to be implemented, followed by the techniques T2, T6, T3, T4, T1, T5, and T8. For Reach 2 (which presents both banks covered by a conventional concrete wall), the results also displayed the technique T7 as the most indicated, however, followed by the techniques T6, T3, T2, T8, T5, T4, T1. This evidences the variety of results according to the current conditions of the studied watercourse.
Finally, this research demonstrated that the multi-criteria methodology developed here can be used to guide sustainable investments, helping decision-makers, based on the sustainability indexes. Furthermore, this methodology has a relatively fast implementation and can be further applied to other watercourse management in urbanized areas, especially in developing countries, performing a primary analysis to define the suitable techniques that could be applied to watercourse interventions.

Author Contributions

Conceptualization, P.C.d.O.C. and I.P.; methodology, P.C.d.O.C., T.d.S.R.P., G.B.A.L. and I.P.; software, P.C.d.O.C., T.d.S.R.P., G.B.A.L. and I.P.; validation, P.C.d.O.C., T.d.S.R.P. and I.P.; formal analysis, P.C.d.O.C., T.d.S.R.P., L.L., Y.Q., C.N.A., A.P.R.S., J.C.C.A., G.B.A.L., M.P.R. and I.P.; investigation, P.C.d.O.C., T.d.S.R.P. and I.P.; resources, P.C.d.O.C., T.d.S.R.P., M.P.R. and I.P.; data curation, P.C.d.O.C., T.d.S.R.P. and I.P.; writing—original draft preparation, P.C.d.O.C., T.d.S.R.P. and I.P.; writing—review and editing, P.C.d.O.C., T.d.S.R.P., L.L., Y.Q., C.N.A., A.P.R.S., J.C.C.A., G.B.A.L., M.P.R. and I.P.; visualization, P.C.d.O.C., T.d.S.R.P and I.P.; supervision, P.C.d.O.C. and I.P.; project administration, P.C.d.O.C. and I.P.; funding acquisition, P.C.d.O.C., L.L. and C.N.A. All authors have read and agreed to the published version of the manuscript.

Funding

This study was financed in part by the Coordenação de Aperfeiçoamento de Pessoal de Nível—Brasil (CAPES)—Finance Code 001.

Acknowledgments

The authors would like to thank the Municipal Secretary of Planning of Itaperuna for providing the watercourse data.

Conflicts of Interest

The authors declare no conflict of interest.

Appendix A

Table A1. Normalized and weighted decision matrix applied to Reach 1, according to the selected alternatives (techniques) and environmental (ENV1–ENV8) and socio-economic (SEC1–SEC3) criteria.
IDENV1ENV2ENV3ENV4ENV5ENV6ENV7ENV8SEC1SEC2SEC3
T10.0470.0460.0370.0220.0300.0800.0160.0460.0900.0180.014
T20.0470.0460.0370.0220.0300.0480.0330.0460.0900.0320.025
T30.0270.0370.0210.0220.0170.0640.0330.0260.0520.0180.014
T40.0140.0180.0110.0320.0090.0320.0490.0130.0520.0140.014
T50.0070.0090.0050.0380.0040.0320.0490.0130.0520.0140.014
T60.0140.0280.0110.0380.0090.0320.0410.0200.0520.0140.014
T70.0270.0460.0270.0380.0220.0640.0330.0260.0520.0180.014
T80.0070.0090.0050.0380.0040.0320.0570.0070.0520.0140.014
Weight0.0800.0950.0650.0900.0530.1450.1150.0800.1800.0520.045
Table A2. Normalized and weighted decision matrix applied to Reach 2, according to the selected alternatives (techniques) and environmental (ENV1–ENV8) and socio-economic (SEC1–SEC3) criteria.
IDENV1ENV2ENV3ENV4ENV5ENV6ENV7ENV8SEC1SEC2SEC3
T10.0360.0410.0300.0180.0250.0930.0120.0400.0840.0150.013
T20.0360.0410.0300.0370.0250.0400.0240.0400.0840.0260.022
T30.0310.0350.0260.0180.0210.0400.0240.0280.0720.0220.019
T40.0210.0300.0170.0270.0140.0530.0480.0230.0480.0150.013
T50.0210.0240.0170.0370.0140.0530.0480.0230.0480.0150.013
T60.0260.0300.0210.0370.0140.0400.0360.0230.0480.0180.013
T70.0310.0410.0260.0370.0210.0400.0240.0280.0600.0220.019
T80.0160.0180.0090.0370.0070.0130.0730.0060.0480.0110.013
Weight0.0800.0950.0650.0900.0530.1450.1150.0800.1800.0520.045

References

  1. Li, J.; Deng, C.; Li, H.; Ma, M.; Li, Y. Hydrological Environmental Responses of LID and Approach for Rainfall Pattern Selection in Precipitation Data-Lacked Region. Water Resour. Manag. 2018, 32, 3271–3284. [Google Scholar] [CrossRef]
  2. Aryal, S.K.; Ashbolt, S.; McIntosh, B.S.; Petrone, K.P.; Maheepala, S.; Chowdhury, R.K.; Gardener, T.; Gardiner, R. Assessing and Mitigating the Hydrological Impacts of Urbanisation in Semi-Urban Catchments Using the Storm Water Management Model. Water Resour. Manag. 2016, 30, 5437–5454. [Google Scholar] [CrossRef]
  3. Wang, M.; Zhang, D.Q.; Su, J.; Dong, J.W.; Tan, S.K. Assessing hydrological effects and performance of low impact development practices based on future scenarios modeling. J. Clean. Prod. 2018, 179, 12–23. [Google Scholar] [CrossRef]
  4. Alberti, M.; Booth, D.; Hill, K.; Coburn, B.; Avolio, C.; Coe, S.; Spirandelli, D. The impact of urban patterns on aquatic ecosystems: An empirical analysis in Puget lowland sub-basins. Landsc. Urban. Plan. 2007, 80, 345–361. [Google Scholar] [CrossRef]
  5. Bhaskar, A.S.; Welty, C.; Maxwell, R.M.; Miller, A.J. Untangling the effects of urban development on subsurface storage in Baltimore. Water Resour. Res. 2015, 51, 1158–1181. [Google Scholar] [CrossRef]
  6. Oudin, L.; Salavati, B.; Furusho-Percot, C.; Ribstein, P.; Saadi, M. Hydrological impacts of urbanization at the catchment scale. J. Hydrol. 2018, 559, 774–786. [Google Scholar] [CrossRef] [Green Version]
  7. Ahn, K.H.; Merwade, V. Quantifying the relative impact of climate and human activities on streamflow. J. Hydrol. 2014, 515, 257–266. [Google Scholar] [CrossRef]
  8. Gori, A.; Blessing, R.; Juan, A.; Brody, S.; Bedient, P. Characterizing urbanization impacts on floodplain through integrated land use, hydrologic, and hydraulic modeling. J. Hydrol. 2019, 568, 82–95. [Google Scholar] [CrossRef]
  9. Doubleday, G.; Sebastian, A.; Luttenschlager, T.; Bedient, P.B. Modeling Hydrologic Benefits of Low Impact Development: A Distributed Hydrologic Model of The Woodlands, Texas. J. Am. Water Resour. Assoc. 2013, 49, 1444–1455. [Google Scholar] [CrossRef]
  10. Pickett, S.T.A.; Boone, C.G.; McGrath, B.P.; Cadenasso, M.L.; Childers, D.L.; Ogden, L.A.; McHale, M.; Grove, J.M. Ecological science and transformation to the sustainable city. Cities 2013, 32, S10–S20. [Google Scholar] [CrossRef]
  11. Talbot, T.; Lapointe, M. Modes of response of a gravel bed river to meander straightening: The case of the Sainte-Marguerite River, Saguenay Region, Quebec, Canada. Water Resour. Res. 2002, 38, 9–11. [Google Scholar] [CrossRef]
  12. Bechtol, V.; Laurian, L. Restoring straightened rivers for sustainable flood mitigation. Disaster Prev. Manag. An. Int. J. 2005, 14, 6–19. [Google Scholar] [CrossRef]
  13. Evans, R.O.; Bass, K.L.; Burchell, M.R.; Hinson, R.D.; Johnson, R.; Doxey, M. Management alternatives to enhance water quality and ecological function of channelized streams and drainage canals. J. Soil Water Conserv. 2007, 62, 308–320. [Google Scholar]
  14. Feroni, R.C.; Galvão, E.S. Sustainable development indicators assessment for the city of Anchieta-ES Brazil at different times of the local economy. Int. J. Sustain. Dev. World Ecol. 2020. [Google Scholar] [CrossRef]
  15. Azapagic, A.; Perdan, S. An integrated sustainability decision-support framework Part I: Problem structuring. Int. J. Sustain. Dev. World Ecol. 2005, 12, 98–111. [Google Scholar] [CrossRef]
  16. Li, W.; Yi, P.; Zhang, D. Sustainability Evaluation of Cities in Northeastern China Using Dynamic TOPSIS-Entropy Methods. Sustainability 2018, 10, 4542. [Google Scholar] [CrossRef] [Green Version]
  17. Tang, J.; Zhu, H.; Liu, Z.; Jia, F.; Zheng, X. Urban Sustainability Evaluation under the Modified TOPSIS Based on Grey Relational Analysis. Int. J. Environ. Res. Public Health 2019, 16, 256. [Google Scholar] [CrossRef] [Green Version]
  18. Keivani, R. A review of the main challenges to urban sustainability. Int. J. Urban. Sustain. Dev. 2010, 1, 5–16. [Google Scholar] [CrossRef]
  19. Campos, P.C.O.; Paz, I. Spatial Diagnosis of Rain Gauges’ Distribution and Flood Impacts: Case Study in Itaperuna, Rio de Janeiro—Brazil. Water 2020, 12, 1120. [Google Scholar] [CrossRef] [Green Version]
  20. Matthew, R.A.; Hammill, A. Sustainable development and climate change. Int. Aff. 2009, 85, 1117–1128. [Google Scholar] [CrossRef]
  21. Butler, D.; Farmani, R.; Fu, G.; Ward, S.; Diao, K.; Astaraie-Imani, M. A New Approach to Urban Water Management: Safe and Sure. Procedia Eng. 2014, 89, 347–354. [Google Scholar] [CrossRef] [Green Version]
  22. Butler, D.; Ward, S.; Sweetapple, C.; Astaraie-Imani, M.; Diao, K.; Farmani, R.; Fu, G. Reliable, resilient and sustainable water management: The Safe & SuRe approach. Glob. Chall. 2017, 1, 63–77. [Google Scholar] [CrossRef] [PubMed]
  23. UNWater. Sustainable Development Goal 6 Synthesis Report on Water and Sanitation 2018 Sustainable Development Goal 6 Synthesis Report on Water and Sanitation; UNWater: New York, NY, USA, 2018. [Google Scholar]
  24. Raymond, C.M.; Frantzeskaki, N.; Kabisch, N.; Berry, P.; Breil, M.; Nita, M.R.; Geneletti, D.; Calfapietra, C. A framework for assessing and implementing the co-benefits of nature-based solutions in urban areas. Environ. Sci. Policy 2017, 77, 15–24. [Google Scholar] [CrossRef]
  25. Williams, E.S.; Wise, W.R. Hydrologic impacts of alternative approaches to storm water management and land development. J. Am. Water Resour. Assoc. 2006, 42, 443–455. [Google Scholar] [CrossRef]
  26. Gülbaz, S.; Kazezyılmaz-Alhan, C.M. Hydrological Model of LID with Rainfall-Watershed-Bioretention System. Water Resour. Manag. 2017, 31, 1931–1946. [Google Scholar] [CrossRef]
  27. Ahiablame, L.M.; Engel, B.A.; Chaubey, I. Effectiveness of low impact development practices: Literature review and suggestions for future research. Water. Air. Soil Pollut. 2012, 223, 4253–4273. [Google Scholar] [CrossRef]
  28. Temmerman, S.; Meire, P.; Bouma, T.J.; Herman, P.M.J.; Ysebaert, T.; De Vriend, H.J. Ecosystem-based coastal defence in the face of global change. Nature 2013, 504, 79–83. [Google Scholar] [CrossRef]
  29. Laughlin, D.C. Applying trait-based models to achieve functional targets for theory-driven ecological restoration. Ecol. Lett. 2014, 17, 771–784. [Google Scholar] [CrossRef] [Green Version]
  30. Keesstra, S.; Nunes, J.; Novara, A.; Finger, D.; Avelar, D.; Kalantari, Z.; Cerdà, A. The superior effect of nature based solutions in land management for enhancing ecosystem services. Sci. Total Environ. 2018, 610–611, 997–1009. [Google Scholar] [CrossRef] [Green Version]
  31. Brazilian Institute of Geography and Statistics. Instituto Brasileiro de Geografia e Estatística Portal; IBGE Cidades: Rio de Janeiro, Brazil, 2019. Available online: https://cidades.ibge.gov.br/brasil/rj/itaperuna/panorama (accessed on 6 April 2020).
  32. Hwang, C.-L.; Yoon, K. Multiple Attribute Decision Making. Lecture Notes in Economics and Mathematical Systems; Springer: Berlin/Heidelberg, Germany, 1981; Volume 186, ISBN 978-3-540-10558-9. [Google Scholar]
  33. CPRM—Companhia de Pesquisa de Recursos Minerais. Bacia Rio Muriaé; Serviço Geológico do Brasil: Rio de Janeiro, Brazil, 2019. [Google Scholar]
  34. CEIVAP—Comitê de Integração da Bacia Hidrográfica do Rio Paraíba do Sul. Plano de Recursos Hídricos da Bacia Paraíba do Sul Resumo; Fundação COPPETEC: Rezende, Brazil, 2019. [Google Scholar]
  35. Lourenzutti, R.; Krohling, R.A. TODIM Based Method to Process Heterogeneous Information. Procedia Comput. Sci. 2015, 55, 318–327. [Google Scholar] [CrossRef] [Green Version]
  36. Deepa, N.; Ganesan, K.; Srinivasan, K. Chang Realizing Sustainable Development via Modified Integrated Weighting MCDM Model for Ranking Agrarian Dataset. Sustainability 2019, 11, 6060. [Google Scholar] [CrossRef] [Green Version]
  37. Zhang, W.; Ju, Y.; Liu, X. Interval-valued intuitionistic fuzzy programming technique for multicriteria group decision making based on Shapley values and incomplete preference information. Soft Comput. 2017, 21, 5787–5804. [Google Scholar] [CrossRef]
  38. Talukder, B.W.; Hipel, K. The PROMETHEE Framework for Comparing the Sustainability of Agricultural Systems. Resources 2018, 7, 74. [Google Scholar] [CrossRef] [Green Version]
  39. Saaty, T.L. Fundamentals of Decision Making; the Analytic Hierarchy Process, 1st ed.; RWS Publications: Pittsburgh, PA, USA, 2000; ISBN 9780962031762. [Google Scholar]
  40. Opricovic, S.; Tzeng, G.-H. Compromise solution by MCDM methods: A comparative analysis of VIKOR and TOPSIS. Eur. J. Oper. Res. 2004, 156, 445–455. [Google Scholar] [CrossRef]
  41. Roy, B. Classement et Choix en Présence de Points de vue Multiples (la méthode Electre). Rev. Française d’Informatique Rech. Opérationnelle 1968, 2, 57–75. [Google Scholar]
  42. Charnes, A.; Cooper, W.W.; Rhodes, E. Measuring the efficiency of decision making units. Eur. J. Oper. Res. 1978, 2, 429–444. [Google Scholar] [CrossRef]
  43. Brans, J.P.; Vincke, P.; Mareschal, B. How to select and how to rank projects: The Promethee method. Eur. J. Oper. Res. 1986, 24, 228–238. [Google Scholar] [CrossRef]
  44. Alamanos, A.; Mylopoulos, N.; Loukas, A.; Gaitanaros, D. An Integrated Multicriteria Analysis Tool for Evaluating Water Resource Management Strategies. Water 2018, 10, 1795. [Google Scholar] [CrossRef] [Green Version]
  45. Bianchini, A. 3PL provider selection by AHP and TOPSIS methodology. Benchmarking An. Int. J. 2018, 25, 235–252. [Google Scholar] [CrossRef]
  46. Paz, T.S.R. Desenvolvimento de painel de indicadores para suporte à decisão de investimentos em sustentabilidade; Fluminense Federal University: Niterói, Brazil, 2019. [Google Scholar]
  47. Hamurcu, M.; Eren, T. Strategic Planning Based on Sustainability for Urban Transportation: An Application to Decision-Making. Sustainability 2020, 12, 3589. [Google Scholar] [CrossRef]
  48. Chung, E.-S.; Abdulai, P.; Park, H.; Kim, Y.; Ahn, S.; Kim, S. Multi-Criteria Assessment of Spatial Robust Water Resource Vulnerability Using the TOPSIS Method Coupled with Objective and Subjective Weights in the Han River Basin. Sustainability 2016, 9, 29. [Google Scholar] [CrossRef] [Green Version]
  49. do Silva, M.; Lima, G.B.A.; Gomes, C.F.S.; Rangel, L.A.D.; Caiado, R.G.G. A SMARTS-Choquet’s approach for multicriteria decision aid applied to the innovation indexes in sustainability dimensions. Soft Comput. 2019, 23, 7117–7133. [Google Scholar] [CrossRef]
  50. Caiado, R.G.G.; Lima, G.B.A.; Gaviáo, L.O.; Quelhas, O.L.G.; Paschoalino, F.F. Sustainability Analysis in Electrical Energy Companies by Similarity Technique to Ideal Solution. IEEE Lat. Am. Trans. 2017, 15, 675–681. [Google Scholar] [CrossRef]
  51. Širá, E.; Vavrek, R.; Kravčáková Vozárová, I.; Kotulič, R. Knowledge Economy Indicators and Their Impact on the Sustainable Competitiveness of the EU Countries. Sustainability 2020, 12, 4172. [Google Scholar] [CrossRef]
  52. Cardoso, A.S. Desenvolvimento de Metodologia Para Avaliação de Alternativas de Intervenção em Cursos de Água em Áreas Urbanas; Federal University of Minas Gerais: Belo Horizonte, Brazil, 2008. [Google Scholar]
  53. Roni, P.; Hanson, K.; Beechie, T. Global Review of the Physical and Biological Effectiveness of Stream Habitat Rehabilitation Techniques. North. Am. J. Fish. Manag. 2008, 28, 856–890. [Google Scholar] [CrossRef]
  54. Giupponi, L.; Borgonovo, G.; Giorgi, A.; Bischetti, G.B. How to renew soil bioengineering for slope stabilization: Some proposals. Landsc. Ecol. Eng. 2019, 15, 37–50. [Google Scholar] [CrossRef]
  55. Arsénio, P.; Rodríguez-González, P.M.; Bernez, I.S.; Dias, F.; Nunes Bugalho, M.; Dufour, S. Riparian vegetation restoration: Does social perception reflect ecological value? In Proceedings of the River Research and Applications, John Wiley and Sons Ltd., Hong Kong, China, 2 February 2019. [Google Scholar]
  56. Liu, Z.; Lin, Y.; De Meulder, B.; Wang, S. Can greenways perform as a new planning strategy in the Pearl River Delta, China? Landsc. Urban. Plan. 2019, 187, 81–95. [Google Scholar] [CrossRef]
  57. Li, M.-H.; Eddleman, K.E. Biotechnical engineering as an alternative to traditional engineering methods. Landsc. Urban. Plan. 2002, 60, 225–242. [Google Scholar] [CrossRef]
  58. Kenwick, R.A.; Shammin, M.R.; Sullivan, W.C. Preferences for riparian buffers. Landsc. Urban. Plan. 2009, 91, 88–96. [Google Scholar] [CrossRef]
  59. Agouridis, C.T.; Wightman, S.J.; Forestry, C.D.B.; Gumbert, A.A. Planting a Riparian Buffer; University of Kentucky: Lexington, KY, USA, 2010. [Google Scholar]
  60. Schwarz, M.; Preti, F.; Giadrossich, F.; Lehmann, P.; Or, D. Quantifying the role of vegetation in slope stability: A case study in Tuscany (Italy). Ecol. Eng. 2010, 36, 285–291. [Google Scholar] [CrossRef]
  61. Vaverková, M.D.; Radziemska, M.; Bartoň, S.; Cerdà, A.; Koda, E. The use of vegetation as a natural strategy for landfill restoration. Land Degrad. Dev. 2018, 29, 3674–3680. [Google Scholar] [CrossRef]
  62. Kundzewicz, Z.W. Non-structural Flood Protection and Sustainability. Water Int. 2002, 27, 3–13. [Google Scholar] [CrossRef] [Green Version]
  63. Modi, A.; Tare, V.; Medhi, H.; Rai, P.K. A framework for the hydrological assessment of at-site bankfull discharge-width for (semi-) incised Ganga river in Middle Ganga plains. J. Hydrol. 2020, 586, 124912. [Google Scholar] [CrossRef]
  64. Maffra, C.R.B.; Sutili, F.J. The use of soil bioengineering to overcome erosion problems in a pipeline river crossing in South America. Innov. Infrastruct. Solut. 2020, 5, 24. [Google Scholar] [CrossRef]
  65. Simpson, P.; Newman, J.R.; Keirn, M.A.; Matter, R.M.; Guthrie, P.A. Manual of Stream Channelization Impacts on Fish and Wildlife. In FWS/OBS-82/24 US Fish. and Wildlife Service Contract No. 14-16-0009-80-066; The Service: Washington, DC, USA, 1982. [Google Scholar]
  66. Sun, Z.; Chang, N.B.; Opp, C.; Hennig, T. Evaluation of ecological restoration through vegetation patterns in the lower Tarim River, China with MODIS NDVI data. Ecol. Inform. 2011, 6, 156–163. [Google Scholar] [CrossRef]
  67. Teufl, B.; Weigelhofer, G.; Fuchsberger, J.; Hein, T. Effects of hydromorphology and riparian vegetation on the sediment quality of agricultural low-order streams: Consequences for stream restoration. Environ. Sci. Pollut. Res. 2013, 20, 1781–1793. [Google Scholar] [CrossRef]
  68. Zeedyk, W.D.; Clothier, V. Let the Water Do the Work: Induced Meandering, an Evolving Method for Restoring Incised Channels; Chelsea Green Publishing, Ed.; Chelsea Green Publishing: Chelsea, VT, USA, 2014; ISBN 1603585699. [Google Scholar]
  69. Qiu, Z.; Prato, T.; Boehm, G. Economic valuation of riparian buffer and open space in a suburban watershed. J. Am. Water Resour. Assoc. 2006, 42, 1583–1596. [Google Scholar] [CrossRef]
  70. Devkota, L.; Crosato, A.; Giri, S. Effect of the barrage and embankments on flooding and channel avulsion case study Koshi River, Nepal. Rural Infrastruct. 2012, 3, 124–132. [Google Scholar]
  71. Pal, S.; Let, S. Flood intensity and potential flood loss estimation in Dwarka River Basin of Eastern India. Int. J. Geol. Earth Environ. Sci. 2012, 2, 116–122. [Google Scholar]
  72. Poeppl, R.E.; Keesstra, S.D.; Keiler, M.; Coulthard, T.; Glade, T. Impact of dams, dam removal and dam-related river engineering structures on sediment connectivity and channel morphology of the Fugnitz and the Kaja Rivers. In Proceedings of the 5th Symposium for Research in Protected Areas, Mittersill, Austria, 10–12 June 2013; pp. 607–613. [Google Scholar]
  73. Mondal, S.; Patel, P.P. Examining the utility of river restoration approaches for flood mitigation and channel stability enhancement: A recent review. Environ. Earth Sci. 2018, 77, 195. [Google Scholar] [CrossRef]
  74. Hawley, R.J. Making Stream Restoration More Sustainable: A Geomorphically, Ecologically, and Socioeconomically Principled Approach to Bridge the Practice with the Science. Bioscience 2018, 68, 517–528. [Google Scholar] [CrossRef] [PubMed]
  75. Amigues, J.P.; Boulatoff, C.; Desaigues, B.; Gauthier, C.; Keith, J.E. The benefits and costs of riparian analysis habitat preservation: A willingness to accept/willingness to pay contingent valuation approach. Ecol. Econ. 2002, 43, 17–31. [Google Scholar] [CrossRef]
  76. Christofoletti, A. Geomorfologia, 2nd ed.; Blucher, Ed.; Edgard Blücher: São Paulo, 1980; ISBN 8521201303. [Google Scholar]
  77. Lenz, L. Alternativas Sustentáveis Para Estabilização de Margens de Cursos D’água Brasileiros; Instituto Militar de Engenharia: Rio de Janeiro, Brazil, 2020. [Google Scholar]
  78. Bernard, J.M.; Tuttle, R.W. Stream Corridor Restoration: Principles, Processes, and Practices. In Proceedings of the Engineering Approaches to Ecosystem Restoration, Denver, CO, USA, 22–27 March 1998; American Society of Civil Engineers: Reston, VA, USA, 1998; pp. 320–325. [Google Scholar]
  79. Lyn, D.; Newton, J. Approaches to the Design of Biotechnical Streambank Stabilization: Volume I—A Guide to the Literature; Transportation Research Program Publication: West Lafayette, Indiana, 2015. [Google Scholar]
  80. Kondolf, G.M. River Restoration and Meanders. Ecol. Soc. 2006, 11, 18. [Google Scholar] [CrossRef]
  81. Smith, R.F.; Hawley, R.J.; Neale, M.W.; Vietz, G.J.; Diaz-Pascacio, E.; Herrmann, J.; Lovell, A.C.; Prescott, C.; Rios-Touma, B.; Smith, B.; et al. Urban stream renovation: Incorporating societal objectives to achieve ecological improvements. Freshw. Sci. 2016, 35, 364–379. [Google Scholar] [CrossRef] [Green Version]
  82. MacBroom, J.G. River Restoration Education. In Proceedings of the World Environmental and Water Resources Congress 2011, Palm Springs, CA, USA, 22–26 May 2011; American Society of Civil Engineers: Reston, VA, USA, 2011; pp. 2613–2617. [Google Scholar]
  83. Kondolf, G.M. The Espace de Liberté and Restoration of Fluvial Process: When Can the River Restore Itself and When Must we Intervene? In River Conservation and Management; John Wiley & Sons, Ltd.: Chichester, UK, 2012; pp. 223–241. [Google Scholar]
  84. Malanson, G.P. Riparian Landscapes; Cambridge University Press: New York, NY, USA, 1996; ISBN 0521566835. [Google Scholar]
  85. Vermont Agency of Natural Resources. Riparian Buffers and Corridors: Technical Papers; Vermont Agency of Natural Resources: Waterbury, VT, USA, 2005. [Google Scholar]
  86. Hawes, E.; Smith, M. Riparian Buffer Zones: Functions and Recommended Widths. Available online: http://www.fao.org/sustainable-forest-management/toolbox/cases/case-detail/en/c/231042/ (accessed on 16 June 2020).
  87. Musser, S.R.; Grafe, J.; Ortega-Achury, S.L.; Ramirez-Avila, J.J. Influence of Riparian Vegetation on Stream Health and Water Quality. In Proceedings of the World Environmental and Water Resources Congress 2019, Pittsburgh, PA, USA, 19–23 May 2019; American Society of Civil Engineers: Reston, VA, USA, 2019; Volume 21, pp. 59–67. [Google Scholar]
  88. Borin, M.; Bigon, E. Abatement of NO3-N concentration in agricultural waters by narrow buffer strips. Environ. Pollut. 2002, 117, 165–168. [Google Scholar] [CrossRef]
  89. de la Fuente, B.; Mateo-Sánchez, M.C.; Rodríguez, G.; Gastón, A.; Pérez de Ayala, R.; Colomina-Pérez, D.; Melero, M.; Saura, S. Natura 2000 sites, public forests and riparian corridors: The connectivity backbone of forest green infrastructure. Land Use Policy 2018, 75, 429–441. [Google Scholar] [CrossRef]
  90. O’Donnell, J.; Fryirs, K.A.; Leishman, M.R. Seed banks as a source of vegetation regeneration to support the recovery of degraded rivers: A comparison of river reaches of varying condition. Sci. Total Environ. 2016, 542, 591–602. [Google Scholar] [CrossRef]
  91. Ottomano Palmisano, G.; Govindan, K.; Loisi, R.V.; Dal Sasso, P.; Roma, R. Greenways for rural sustainable development: An integration between geographic information systems and group analytic hierarchy process. Land Use Policy 2016, 50, 429–440. [Google Scholar] [CrossRef]
  92. Tisserant, M.; Janssen, P.; Evette, A.; González, E.; Cavaillé, P.; Poulin, M. Diversity and succession of riparian plant communities along riverbanks bioengineered for erosion control: A case study in the foothills of the Alps and the Jura Mountains. Ecol. Eng. 2020, 152, 105880. [Google Scholar] [CrossRef]
  93. Krzeminska, D.; Kerkhof, T.; Skaalsveen, K.; Stolte, J. Effect of riparian vegetation on stream bank stability in small agricultural catchments. Catena 2019, 172, 87–96. [Google Scholar] [CrossRef]
  94. Pollen, N.; Simon, A.; Collision, A.J. Advances in assessing the mechanical and hydrologic effect of riparian vegetation on streambank stability. Riparian Veg. Fluv. Geomorphol. 2004, 8, 125–139. [Google Scholar]
  95. Rey, F.; Bifulco, C.; Bischetti, G.B.; Bourrier, F.; De Cesare, G.; Florineth, F.; Graf, F.; Marden, M.; Mickovski, S.B.; Phillips, C.; et al. Soil and water bioengineering: Practice and research needs for reconciling natural hazard control and ecological restoration. Sci. Total Environ. 2019, 648, 1210–1218. [Google Scholar] [CrossRef] [PubMed]
  96. McMahon, J.M.; Olley, J.M.; Brooks, A.P.; Smart, J.C.R.; Stewart-Koster, B.; Venables, W.N.; Curwen, G.; Kemp, J.; Stewart, M.; Saxton, N.; et al. Vegetation and longitudinal coarse sediment connectivity affect the ability of ecosystem restoration to reduce riverbank erosion and turbidity in drinking water. Sci. Total Environ. 2020, 707, 135904. [Google Scholar] [CrossRef] [PubMed]
  97. Bella, G.; Barbero, M.; Barpi, F.; Borri-Brunetto, M.; Peila, D. An innovative bio-engineering retaining structure for supporting unstable soil. J. Rock Mech. Geotech. Eng. 2017, 9, 247–259. [Google Scholar] [CrossRef] [Green Version]
  98. Mishra, D.K. The Kosi and the Embankment Story. Econ. Polit. Wkly. 2008, 43, 47–52. [Google Scholar] [CrossRef]
  99. Sinha, R.; Bapalu, G.V.; Singh, L.K.; Rath, B. Flood risk analysis in the Kosi river basin, north Bihar using multi-parametric approach of Analytical Hierarchy Process (AHP). J. Indian Soc. Remote Sens. 2008, 36, 335–349. [Google Scholar] [CrossRef]
  100. American Society of Civil Engineers. So, You Live Behind a Levee! American Society of Civil Engineers: Reston, VA, USA, 2010; Available online: https://www.lrh.usace.army.mil/Portals/38/docs/civilworks/SoYouLiveBehindaLevee.pdf (accessed on 22 June 2020).
  101. Molla, H. Embankment and Changing Micro-Topography of Lower Ajoy Basin in Eastern India. Ethiop. J. Environ. Stud. Manag. 2012, 4. [Google Scholar] [CrossRef] [Green Version]
  102. Baghel, R. River Control in India, 1st ed.; Springer International Publishing: Cham, Switzerland, 2014; ISBN1 978-3-319-04431-6. ISBN2 978-3-319-04432-3. [Google Scholar]
  103. Radspinner, R.R.; Diplas, P.; Lightbody, A.F.; Sotiropoulos, F. River Training and Ecological Enhancement Potential Using In-Stream Structures. J. Hydraul. Eng. 2010, 136, 967–980. [Google Scholar] [CrossRef]
  104. Lin, Q. Influence of Dams on River Ecosystem and Its Countermeasures. J. Water Resour. Prot. 2011, 3, 60–66. [Google Scholar] [CrossRef]
  105. Keown, M.P. Streambank Protection Guidelines for Landowners and Local Governments; US Army Engineer Waterways Experiment Station: Vicksburg, MS, USA, 1983. [Google Scholar]
  106. Abdi, R.; Endreny, T.; Nowak, D. A model to integrate urban river thermal cooling in river restoration. J. Environ. Manag. 2020, 258, 110023. [Google Scholar] [CrossRef]
  107. Mondal, S.; Patel, P.P. Implementing Vetiver grass-based riverbank protection programmes in rural West Bengal, India. Nat. Hazards 2020. [Google Scholar] [CrossRef]
  108. Pinto, A.A.S. Estabilização de Margens Fluviais. Uma Abordagem Multifuncional; Universidade do Porto: Porto, Portugal, 2017. [Google Scholar]
  109. Ourloglou, O.; Stefanidis, K.; Dimitriou, E. Assessing Nature-Based and Cassical Engineering Solutions for Flood-Risk Reduction in Urban Streams. J. Ecol. Eng. 2020, 21, 46–56. [Google Scholar] [CrossRef]
  110. Tardio, G.; Mickovski, S.B.; Stokes, A.; Devkota, S. Bamboo structures as a resilient erosion control measure. Proc. Inst. Civ. Eng. Forensic Eng. 2017, 170, 72–83. [Google Scholar] [CrossRef] [Green Version]
  111. Feldman, S.; Geisler, C. Land expropriation and displacement in Bangladesh. J. Peasant Stud. 2012, 39, 971–993. [Google Scholar] [CrossRef]
Figure 1. Hydrography of the municipality of Itaperuna, and the case study watercourse.
Sustainability 12 06493 g001
Figure 2. Flood mapping of 2020 event in Itaperuna’s urbanized area [19] and the flood occurrences in the case study watercourse.
Sustainability 12 06493 g002
Figure 3. The conceptual framework applied to the selection of interventional techniques in watercourse management.
Sustainability 12 06493 g003
Figure 4. The methodology applied to the diagnosis of watercourse and riverside conditions.
Sustainability 12 06493 g004
Figure 5. Cehab’s open channel subdivided into homogeneous reaches: Reach 1 (green line) with natural streambanks, extended from 0 m (upstream) up to 770 m (transition point); and Reach 2 (red line) with coated streambanks, from 770 m up to 1740 m (downstream).
Sustainability 12 06493 g005
Figure 6. The methodology applied to the diagnosis of watercourse and riverside conditions.
Sustainability 12 06493 g006
Table 1. Environmental (ENV1, ENV2, ENV3, ENV4, ENV5, ENV6, ENV7, and ENV8) and socio-economic (SEC1, SEC2, and SEC3) criteria, with their impacts (positive, which means the higher, the better; or negative, which means the smaller, the better), and weights (with a total sum equals to 1).
DimensionIDIndicatorImpactWeight
EnvironmentalENV1Preservation/Restoration of the natural conditions of a watercourse0.080
ENV2Permeabilization0.095
ENV3Recovery of degraded areas0.065
ENV4Streambank stabilization 0.090
ENV5Increase species diversity and biomass0.053
ENV6Local flood vulnerability 0.145
ENV7Impact on downstream floods0.115
ENV8Proliferation of insects0.080
Socio-economicSEC1Expropriation/Removal of resident population0.180
SEC2Increasing river corridor and along-channel aesthetics and leisure0.052
SEC3Financial valuation of riparian areas0.045
▲ symbolizes a positive impact, which means the bigger, the better; and ▼ symbolizes a negative impact, which means the smaller, the better.
Table 2. Watercourse interventional techniques selected based on the sustainable and traditional concepts.
IDTechniques
T1Induced natural meandering
T2Riparian buffer zone/River corridor
T3Vegetation-based (seeding, hydroseeding, live stakes, crib wall)
T4Constricting lateral channel dimensions and raising the stream bed (dams and embankments)
T5Impermeable stabilization structures (concrete mats and cell steel sheet piling)
T6Permeable structures (gabion walls and riprap)
T7Geogrids or geocells
T8Closed cross-section
Table 3. Impact levels applied for the evaluation of each criterion.
DescriptionImpact SymbolImpact Level (Index)
High Reduction− − −1
Moderate Reduction− −2
Low Reduction3
Indifference=4
Low Increase+5
Moderate Increase+ +6
High Increase + + +7
Table 4. Diagnosis of a case study watercourse condition according to the evaluation subjects, subdivided into two reaches.
Evaluation SubjectsReach 1 [0–770 m]Reach 2 [770–1740 m]
Flood occurrenceOccasional (between 2 and 10 years)Occasional (between 2 and 10 years)
SinuosityNatural conditionsModerately altered
ShapeFree surface flow, natural bed, and natural streambanksFree surface flow, natural bed, and coated streambanks
PollutionPollutedPolluted
Erosion, landslide and siltingErosion and siltingLandslide and silting
Occupation of marginsOccupation of both marginsOccupation of both margins
Table 5. Decision matrix for Reach 1 (0–770 m), with impact levels (as presented in Table 3) attributed to each interventional technique (T1, T2, T3, T4, T5, T6, T7, and T8) analyzed by each indicator (ENV1, ENV2, ENV3, ENV4, ENV5, ENV6, ENV7, ENV8, SEC1, SEC2, SEC3).
IDENV1ENV2ENV3ENV4ENV5ENV6ENV7ENV8SEC1SEC2SEC3
T175747527744
T275747347777
T344444444444
T422262262434
T511171262434
T623272253434
T745575444444
T811171271434
Table 6. Decision matrix for Reach 2 (770 m–1740 m), with impact levels (as presented in Table 3) attributed to each interventional technique (T1, T2, T3, T4, T5, T6, T7, and T8) analyzed by each indicator (ENV1, ENV2, ENV3, ENV4, ENV5, ENV6, ENV7, ENV8, SEC1, SEC2, SEC3).
IDENV1ENV2ENV3ENV4ENV5ENV6ENV7ENV8SEC1SEC2SEC3
T177727717744
T277747327777
T366626325666
T445434444444
T544444444444
T655544334454
T767646325566
T833242161434
Table 7. Positive Ideal Solution (PIS) and Negative Ideal Solution (NIS) values for Reach 1 of the studied watercourse.
CriteriaENV1ENV2ENV3ENV4ENV5ENV6ENV7ENV8SEC1SEC2SEC3
Impact
PIS0.0470.0460.0370.0380.0300.0320.0160.0070.0520.0320.025
NIS0.0070.0090.0050.0220.0040.0800.0570.0460.0900.0140.014
▲ symbolizes a positive impact, which means the bigger, the better; and ▼ symbolizes a negative impact, which means the smaller, the better.
Table 8. Positive Ideal Solution (PIS) and Negative Ideal Solution (NIS) values for Reach 2 of the studied watercourse.
CriteriaENV1ENV2ENV3ENV4ENV5ENV6ENV7ENV8SEC1SEC2SEC3
Impact
PIS0.0360.0410.0300.0370.0250.0130.0120.0060.0480.0260.022
NIS0.0160.0180.0090.0180.0070.0930.0730.0400.0840.0110.013
▲ symbolizes a positive impact, which means the bigger, the better; and ▼ symbolizes a negative impact, which means the smaller, the better.
Table 9. Multi-criteria analysis results for Reach 1: with positive (D+) and negative distances (D−), coefficient-C, and final rank.
AlternativesD+D−CRank
T10.076970.079990.509616
T20.062000.082300.570342
T30.056210.066130.540514
T40.068330.072470.514725
T50.079110.072240.477327
T60.062260.073920.542803
T70.050780.074560.594881
T80.082560.075020.476088
Average0.52828-
Standard Deviation0.04212-
Table 10. Multi-criteria analysis results for Reach 2: with positive and negative distances, coefficient- C, and final rank.
AlternativesD+D−CRank
T10.097140.073850.431908
T20.057770.087220.601574
T30.049100.081800.624893
T40.064610.064650.500127
T50.065320.065760.501696
T60.046610.081390.635872
T70.040080.087780.686561
T80.075790.096050.558945
Average0.56769-
Standard Deviation0.08505-

