Article

Towards Sustainable Private Labels—What is the Consumer Behavior Relating to Private Labels in the UK and Poland?

by
Maksymilian Czeczotko
,
Hanna Górska-Warsewicz
* and
Wacław Laskowski
Department of Food Market and Consumer Research, Institute of Human Nutrition Sciences, Warsaw University of Life Sciences (WULS), str. Nowoursynowska 166, 02-787 Warsaw, Poland
*
Author to whom correspondence should be addressed.
Sustainability 2020, 12(15), 6035; https://doi.org/10.3390/su12156035
Submission received: 9 June 2020 / Revised: 16 July 2020 / Accepted: 23 July 2020 / Published: 27 July 2020
(This article belongs to the Section Sustainable Food)

Abstract

:
Consumer behavior towards private labels (PLs) is constantly changing, accompanied by the development from generic products, offered at very low prices, towards sustainable PLs. Our study aimed to analyze the behavior of British and Polish consumers towards PLs of the retail chains. To achieve this, special attention was given to the following issues: frequency of purchasing PLs by food categories, motives for purchasing PL products, opinions of the current development of PLs, and length of the period of purchasing products under PLs. We also presented the socioeconomic features of the Polish and British consumers purchasing PL products using a correspondence graph. Our research was conducted using a sample of 500 adults from Poland and 500 adults from the UK and the Computer-Assisted Web Interviewing method (CAWI) was used. The questionnaire was addressed only to adults who declared that they purchase PL products. For a detailed analysis of consumer choices and service quality assessment, we used Pearson’s chi-square test, as well as the Kohonen’s neural network and multi-dimensional cluster analysis. We have divided the sample population into 4 clusters based on 6 factors, characterizing households: education level, income, household residence, age, gender, and period of buying PL products. Our study indicates that Polish consumers are more likely to pay attention to lower prices for PLs, while British consumers point quality compared to manufacturers’ brands. In the opinion of Polish consumers, an improvement in quality is only just beginning. This means that PLs available on the British market are characterized by a higher stage of development towards sustainable PLs.

1. Introduction

Consumer attitudes towards private labels (PLs) have changed significantly in recent years [1,2,3], with the development of PLs. Initially, PLs were treated as a cheap and low-cost substitute, [4] of acceptable, but low quality [5,6] being an alternative to the producer’s brand [4]. Currently, PLs as products of comparable or even higher quality than national brands are purchased not only by highly price-sensitive customers [5,6]. It provides an opportunity for retail chains to develop sustainable PLs [7].
Products categorized as PLs are produced, distributed, and sold under a retailer’s brand, which may be the retailer’s name or a name used exclusively [8] as well as the retailer umbrella brand [9,10]. Private Label Manufacturer’s Association (PLMA) has defined PL as a product that encompasses all merchandise sold under a retailer’s brand. Many PLs are owned and marketed by retailers under their store brand name or a new brand name [4]. According to Nielsen’s Report, a new retail revolution in the development of PL products is currently taking place [11]. This is since PLs have established market position as branded products and compete with leading producer and national brands in terms of quality [12] and sustainability [7]. Retailers are introducing PLs to all segments, from premium to the economic segment to meet consumer expectations. At the same time, international retailers are perceived as trendsetters concerning lifestyle, consumer behavior, consumer experience, digital preferences, etc. [13]. By well-planned marketing strategies aimed at attracting consumers [10], PLs become a tool for creating and achieving competitive advantage [14] and for building consumer loyalty to retailers [15,16].
The development of PLs is expressed in generations. The first generation was characterized by undifferentiated basic products, with generic names and sold at a low price. The main strength of these products was the low prices significantly lower than the producers’ brands. These products were highly profitable due to low production costs. In the second generation, PLs were of slightly better quality and have the name of a retail chain. They were distinguished by their packaging, although the quality was still lower than that of the market leader. The third generation of PLs has its names, which are copies of existing products of producers’ brands. They are similar to leading brands in terms of price and quality and they focus on the image and characteristics of the product concerning price. The fourth generation of PLs are innovative and diverse. Different sub-brands are developed for various product segments in terms of price and quality. They are at the same level or higher than the leading brands. These products usually do not compete on price but on quality and functional characteristics [17]. The fourth generation of PLs is currently being developed towards sustainable PLs. The offering of sustainable PLs enables retailers to respond to new market requirements by adopting new values (environmental and social awareness, defense of workers’ rights, health) and thus strengthen their image in relation to national brands [7].
The largest PL markets are located in Western Europe [18]. The UK is one of the strongest PL markets and is considered to be the most advanced and sophisticated PL country in the world with over 47% market share (in volume) [19,20,21]. The development of PLs started in 1977, the sales concept assumed basic packaging and the lack of graphics on labels to provide consumers with the lowest possible price by avoiding expenditure on advertising, packaging, and marketing [22]. Nowadays, the trend has shifted towards more high-quality products and a more differentiated market [23]. One of the most characteristic features of the British food market is that PLs are present in practically every product category [23]. The British consumers are aware of the three PL levels (economy, standard, and premium) and their line extensions [24]. Most often the PL price level in the UK is around 78% compared to national brands, regardless of the brand category [25]. According to industry observers, many countries are drifting towards the UK model [26], focusing on developing three levels of PLs. The success of PLs in the UK can be attributed to the fact that 74% of the food retail market is held by the top four retailers [27]. Empirical and industry literature indicate that the level of concentration in the retail market is directly related to the PLs’ share of total retail sales [28,29]. The high concentration in food retail is a key factor in the high market share of PLs in the UK [30].
However, in Central and Eastern Europe, the development of PLs has been ongoing since the 1990s and Poland is perceived as a leader [20], with the number of PLs increasing over the last 20 years [11]. Initially, PLs were introduced as economy brands characterized by a lower price (by ca. 40–50% than producer brands) and a small assortment diversity [31]. The dynamic development of PLs increased by market shares and the strengthening of the competitive position of particular retail chains. This influenced retailers’ decision to introduce PLs in new product categories, i.e., with higher added value [32]. Currently, PLs are available in almost every product category, thus constituting an important element of competition [11]. According to the data of PMR Market Experts Ltd., market research agency, the PLs’ market in Poland was worth nearly PLN 50 billion in 2018. For comparison, in 2010 the market was worth less than PLN 24.6 billion, and in 2014 was worth PLN 41.6 billion. This proves a significant development of PLs in Poland as a result of increased consumer trust and continuous improvement in retailers’ offers [33]. At the same time, the evolution of PLs’ perception has been observed through the price–quality strategy, product types, and differentiation. Trade researchers present three types of PLs: economy PLs (low-quality or generics), standard PLs (mid-quality), and premium PLs (top-quality) [34]. A very important stage in PL development was the introduction of premium PLs that were positioned in higher price–quality segments [35].
Therefore, our study aimed to analyze the behavior of British and Polish consumers towards PL products. We have analyzed five issues such as frequency of purchasing PLs by food product category, motives for purchasing products offered under PLs, consumers’ opinions on PL development, and length of the period of purchasing products under PLs. Special attention has been paid to the motives for purchasing products offered under PLs and consumers’ opinions on PL development, which indicates the PL development towards sustainable PLs. We also presented the socioeconomic features of Polish and British consumers purchasing PLs products using a correspondence graph. This is another stage of the authors’ research. So far the Polish market has been analyzed concerning motives of PLs’ purchasing [36,37,38]; knowledge and understanding of PLs’ concept [36,37,38]; purchase portfolio of PLs [11,39]; strategies of PLs in the discount retail chain [33]; and the evolution of PLs and retail trade in Poland over the last 20 years [37,40,41].

2. Materials and Methods

2.1. Ethics Approval Statement

The study was conducted according to the guidelines of the Declaration of Helsinki [42]. The study protocol was approved by the Ethics Committee of the Faculty of Human Nutrition and Consumer Sciences of the Warsaw University of Life Sciences (No. 46/2017; 18.12.2017). All the participants provided their informed consent prior to participating in the research.

2.2. Data Collection

Our research was conducted on a sample of 500 adults from Poland as well as 500 adults from the UK in January 2018. We used the Computer-Assisted Web Interviewing method (CAWI), which is one of the methods in quantitative research in social sciences [43]. The questionnaires were filled by respondents in the on-line mode with the use of the communication medium in the form of the Internet network. It enables the data to be collected quickly and easily, especially for large samples in research [44]. The main advantages of such methods include the low cost of research, the possibility to apply the questionnaire in the multimedia form, possibility of direct control over the data obtained, speed of research implementation, access to numerous respondents around the world; and the possibility for respondents to remain anonymous [45].
The sample was selected using quota sampling by the international agency Kantar Millward Brown, as the partner responsible for data gathering. The inclusion/exclusion criteria were applied. The questionnaire was addressed only to adults who met the recruitment criterion, i.e., declared to purchase food products of retail chains under their PLs. The question was asked: Do you purchase food products of retail chains under private labels? Respondents who answered “no” were excluded from the survey.
The sample was representative in terms of gender, age, and region of residence of the British and Polish population. This method of sampling procedure is known as non-probability sampling which includes quota sampling. We used statistical data on the population of Poland [46] and the UK [47]. The options for answers in the income question were based on statistical data and minimum salary in Poland for the year 2018 [48]. For UK consumers, the income was analyzed taking into account the National Minimum Wage in the year 2018 for persons over 18 years [47].

2.3. Questionnaire Design

The questionnaire consisted of 9 questions (Table 1). It was designed based on literature [29,49,50,51,52,53,54,55,56,57] and our previous research [36,37,38,39,40]. This research incorporated well-established types of the questions and scales i.e., closed-ended questions and multiple-choice questions, for example, to determine the frequency of purchase of private label products, and 5-point scale describing the degree of compliance with the statement: (1) I totally disagree, (2) disagree, (3) I neither agree nor disagree, (4) agree, (5) I totally agree, developed by Rensis Likert in 1932 [58,59,60]. The questionnaire was tested by a pilot study. All problems have been identified, for example, unintelligible questions and questionnaire construction.

2.4. Statistical Analysis

The statistical analysis of the results were performed using Statistica software (version 13.3 PL; StatSoft Inc., StatSoft, Krakow, Poland). Statistical significances for nominal variables were determined using Pearson’s chi-square test. For a more comprehensive and full presentation of consumer behavior in Poland and the UK, the Kohonen’s neural network [68] and multi-dimensional cluster analysis was applied. Cluster analysis covers a wide variety of techniques for delineating natural groups or clusters in data sets It represents the process of organizing objects into groups whose members present similar features [69]. Additionally, we calculated the Cramer’s correlation for each feature to indicate the strength of association between categorical variables. For all tests, p < 0.05 was considered significant.
The results of the exploratory analysis were confronted with Multidimensional Correspondence Analysis (MCA) algorithms which distinguished sociodemographic features typical of Polish and British consumers purchasing products available under PLs. This method presents the dominant features for the country and thus characterizes the population of the countries studied [70]. To present the correspondence graph of MCA, we applied gender, age, period of purchasing of PL products, education, income; and indicative share of PL products in total food purchases.

2.5. Sample Characteristics

The characteristics of respondents are presented in Table 2. The survey was attended by respondents, mainly from secondary or higher schools with varying financial status and from different places of residence, which results from quota sampling. Among Polish respondents, there were more females (52.2%) than males, most of them aged between 36–50 (26.6%) and 51–70 (32.2%). In total, 96.8% of respondents had secondary or higher education. As far as the place of residence is concerned, about 30% live in the countryside and 19% live in cities with more than 20,000 to 99,999 people. In terms of income, about 32.8% received a total monthly income of 2501 PLN–4000 PLN for 1 person in the household. Finally, 45.8% of respondents bought private label products of retail chains from1 to 5 years. By comparison, there were more men (50.8%) than women in the UK sample population, most of them aged 26–35 (31.2%), and 51–70 years (29.7%). The largest share in the structure of the surveyed population had respondents living in rural areas (23.8%), and in cities over 100,000 to 499,000 inhabitants. They have secondary education (56.2%), and the total monthly income was £1201–£1800 (26.0%). Most people bought PLs for over 10 years (46.2%).

3. Results

3.1. The Period of Buying PLs

A comparison of answers to the question on the length of the purchasing period for PL products is shown in Table 3. The largest number of Polish consumers bought products available under PL within 1 to 5 years, followed by 5 to 10 years. Among British consumers, the largest group bought PL products for more than 10 years. The difference is noticeable among new buyers of PLs in the retail chains, i.e., up to 1 year (PL—9.6%, UK—18.8%).

3.2. Frequency of Purchasing PL Products

Table 4 presents a comparison of the frequency of PLs’ purchases from different food product groups by Polish and British consumers. In Poland, dairy products, cereals, non-alcoholic beverages were the most frequently purchased among food products available under private labels, while in the UK these were: bread, dairy products, fruit, and vegetables as well as frozen products. In both countries, consumers were the least likely to buy PL alcohol. In most cases, differences in the frequency of choice of PL products by retail chains in individual countries show a statistical significance (p < 0.05). The greatest differences were found for fresh products, i.e., fruit and vegetables, bread, meat and cold meat, and to a lesser extent frozen food, sweets, and biscuits. Cereals were the only product group that made Polish consumers more often choose PL products.

3.3. Main Factors of PL Purchase

The main factors influencing the PLs purchasing for the whole sample population and four consumer clusters are presented in Table 5 and Table 6.
The consumers categorized into Cluster no. 1 were the ones who most agreed with factors influencing the choice of products available under PLs. The two factors with the highest average values in this cluster were: the ability to buy the same product repeatedly, and the availability of PL products. Lower prices compared to the leading market brands and feeling of safety and trust for PL products were also important for consumers. Cluster no. 1 is the most numerous, comprising 44.3% of the total population, including 48.2% of Polish consumers and 40.4% of British consumers. Cluster no. 2 includes 39.3% of the total population (40.2% from the UK and 39.6% from Poland). The consumers most agreed with the statement that the factor of choice of PL products was related to lower prices compared to the leading brands of manufacturers. More than 13% (13.2%) of people from the group of British consumers and 6.6% of Polish consumers qualified to Cluster no. 3. Among these consumers, the main factor determining the choice of PL products was the lower prices in comparison with products of product brands. An average value of about 3 indicating the neutrality of factors was obtained for the following items: wide product range and high product quality.

3.4. Opinions of PL Development

Table 7 and Table 8 present opinions on the current development of the PL products for the whole sample population and four consumer clusters. Consumers in Cluster 1 are those who have the most positive opinions about the current development of products available under PLs. Three factors with the highest average values in this cluster were: better visual presentation of PL products, lower price of PL products while maintaining quality, and general improvement of PL product quality. Cluster 1 is the most numerous, accounting for 37.4% of the total population, including 43.6% of Polish consumers and 31.2% of British consumers. Cluster 2 covers 22.9% of the total population (22.2% from the UK and 23.6% from Poland). Consumers most agreed with the statement that an important factor in the development of PL is the lower price of PL products while maintaining their quality. Nearly 30% (29.8%) of people from the group of British consumers and 13.4% of Polish consumers qualified for Cluster 3. For the British, it was the largest group of responses and among these consumers, the main factor determining the choice of PL products was the lower price of PL products while maintaining their quality. However, in this group, an average value of about 3 was obtained for all responses indicating the neutrality of all factors. In Cluster 4, all factors were very important in the evaluation of current PL development.

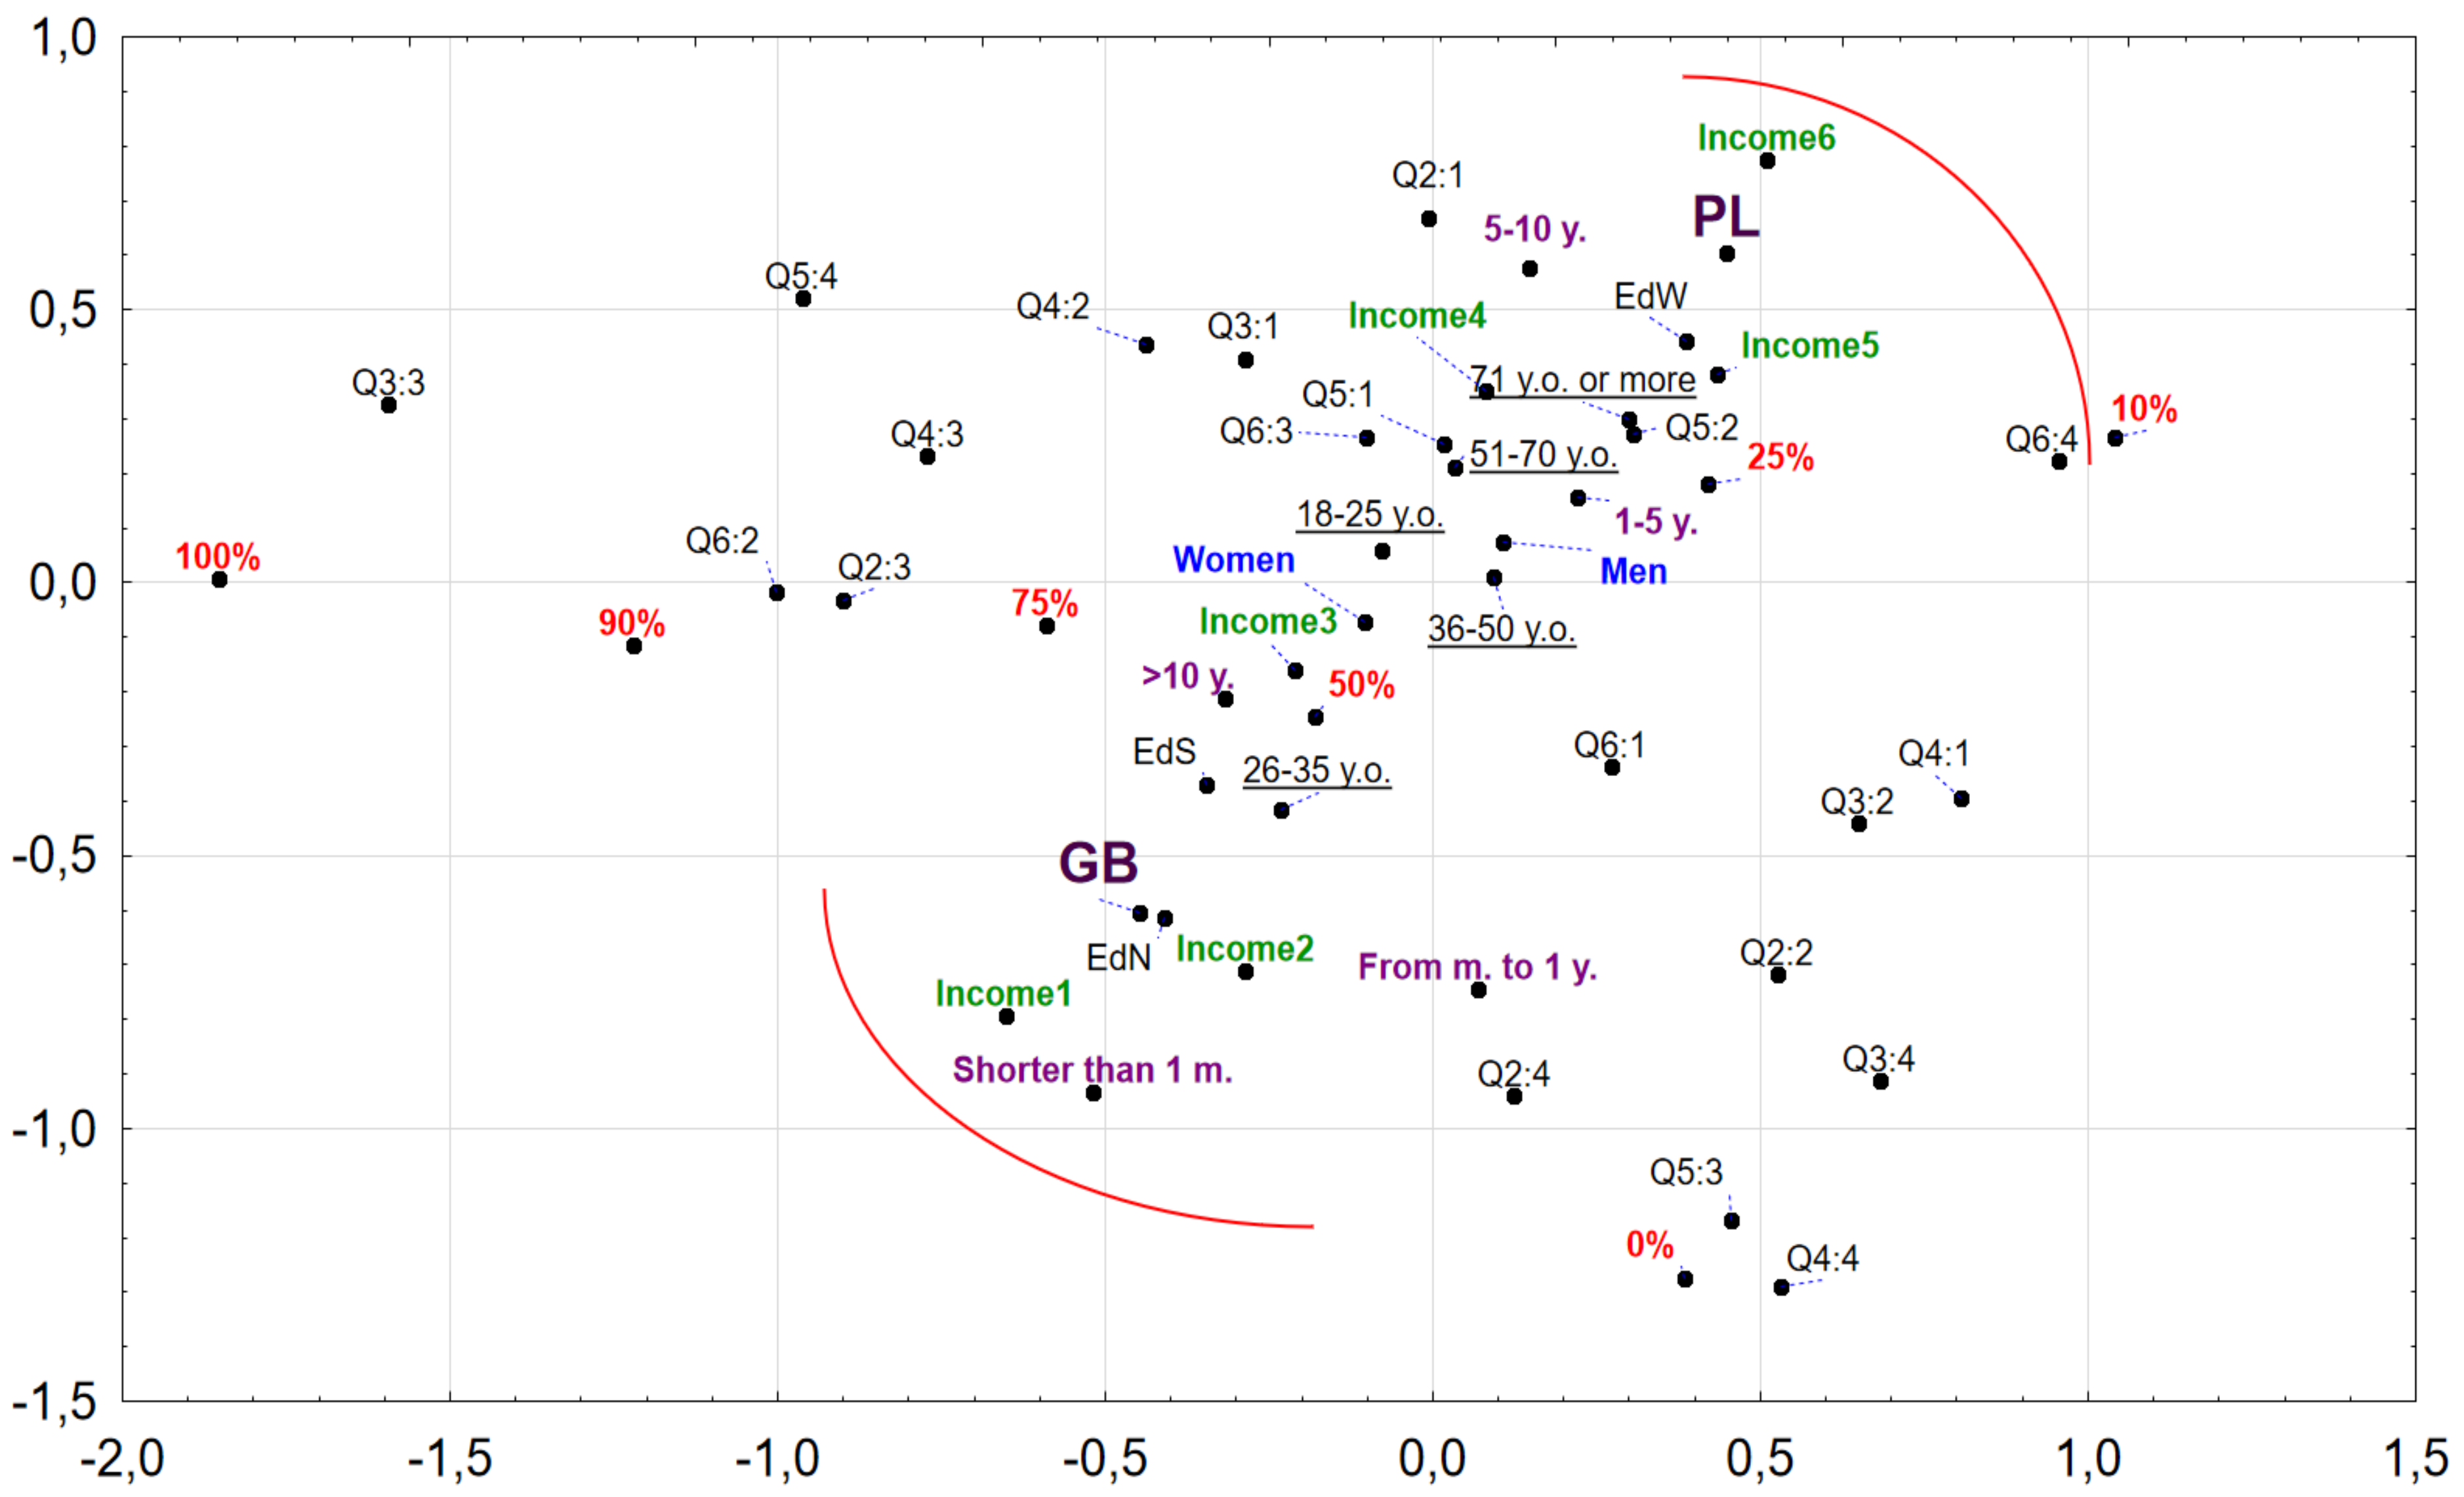
3.5. Purchase Behavior of PL Products—The Correspondence Analysis

The analysis correspondence using MCA algorithms is presented in Figure 1. Polish consumers purchasing PL brands can be described as people above 51 years (51–70 and above 71), with medium and high income (income 4 and income 5), with secondary or higher education and purchasing PLs of retail chains for over 1 year, including a large share of 5–10 years. An important element is also the share of PL products in total purchases. Polish respondents most often indicated a 25% share, i.e., every fourth product in the shopping basket is from a retailer’s assortment. British consumers are mainly people with primary and vocational education, with low incomes (income 1 and income 2), purchasing PL products for a shorter time, but the share in the shopping basket is 50%. These are young people aged 26–35 years.

4. Discussion

The purpose of our study was to analyze consumer behavior towards PL products in the UK and Poland. Special attention was given to the motives for purchasing products offered under PLs and consumers’ opinions indicating the PL development towards sustainable PLs. We also analyzed the frequency of purchasing PLs by food categories, length of the period of purchasing products under PLs, and the socioeconomic features of the Polish and British consumers.
The choice of Poland and the UK in our research was related to the stage of development of PLs. This has manifested itself, among other things, in the determination of how long consumers have been buying products available under PLs. Polish consumers usually bought PLs for less than 5 years, and British consumers for more than 10 years. This is a large time difference, however, it should be remembered that the market presence and development of PLs in Western Europe falls within the 1970s and 1980s. Whereas in Poland, until 1989, retail trade functioned as part of a centrally planned economy. The political transformation to a market economy initiated changes in retail trade, which took place in the 1990s. The first retail chains appeared in the late 1990s, only in the following years were own brands introduced and the first discount outlets were established [56]. In the initial period, PLs in Poland were basic, highly processed products, in simple packaging, and the main feature was low price while maintaining basic quality. In the UK, the transition from this type of PL assortment, called the first generation of the PL, took place much earlier [23]. The development of PLs in terms of the product offer, increasing the quality of products and increasing consumer awareness of PLs allowed for introducing premium products with their own product image, designed and created especially for a given retail chain [8]. The current stage of development of PLs is defined as the 4th generation, relating to the introduction of innovative premium products that further distinguished the main retailer brands and gain new customer segments [71]. Further development of private labels towards sustainable PLs is observed [7].
As an important element describing the consumer behavior of Polish and British towards PLs, we considered the frequency of purchasing particular categories of products under the PLs. Our research has shown that the most frequently purchased categories of PLs in Poland were dairy products, cereals as well as non-alcoholic beverages and water. Similar results were indicated by earlier studies conducted among the inhabitants of the Tri-City (northern part of Poland), in which dairy and cereal products were considered to be the most frequently chosen products of PLs [53]. However, as our research has shown, British consumers were most likely to choose fruit and vegetables, dairy products, bread, and meat and cold meat. The results obtained by us reflect the value shares of product categories available under PLs. In Western European countries, the highest value shares were observed for frozen food (43%), chilled and fresh products (39%), as well as non-alcoholic beverages (18.3%). However, these shares vary depending on the country, for example, the market share for frozen food ranged from 56.4% in Spain to 47.0% in the UK, 43.7% France, and 43.5% in Germany to 27.8% in Italy, and 24.4% in the Netherlands. In contrast, the share of chilled and fresh food ranged from 55.4% in the UK to 42.1% in Spain and 40.1% in the Netherlands to 21.8% in Italy. The share of non-alcoholic beverages ranged from 10.2% in Italy and 16.7% in Germany to 20.3% in the Netherlands and 21.4% in Spain [72]. In the US, the highest sales share in 2019 were recorded for bakery (36.6%), dairy (33.1%), and deli (23.6%), while the lowest by seafood (5.2%) and fresh foods (11.2%) [73]. On the other hand, in Slovakia, regardless of age, education, or income, the most frequently chosen categories of food were dairy products (approx. 40) and durable goods (approx. 35%). Lower results were noted for alcoholic beverages (approx. 30%) or frozen drinks (25%). For people with the lowest income, these were dairy products (46.6%), and in the richest group—durable goods like pasta or cans (39%) [74].
An important area of consumer behavior with regards to PLs was the identification of factors determining the purchase of PL products. Among the important purchase factors, the most significant were lower prices compared to the producer brands. At the same time, the importance of low prices of PL products in comparison to the prices of products available under manufacturers’ brands was more important for Polish consumers than for British consumers. This indicates that in Poland the development of PLs is at an early stage, while in the UK the development of PLs is heading towards sustainable PLs.
Comparing our results with the results of other studies, two aspects should be pointed out. Firstly, the main reason for purchasing PLs is usually an attractive, lower price [18,25,29,72,75]. This indicates an earlier stage of development of private labels [17]. Secondly, the difference between PL products and producer brands is important. According to the 2018 IRI report, the average price of PL products in Europe in the year 2017 was about 70% of the average price of producer brands. The highest rate (83.7%) was observed in Italy and the lowest in France, where it was 61.3%. In the UK it was 78.1%, but compared to 2016 it decreased by 1.3% [75]. By creating a relatively lower perception of prices, retailers tried to have a positive impact on consumer loyalty to the PLs [76].
To indicate the PL development towards sustainable PLs, price as a factor for purchasing PLs should be assessed together with consumers’ perception of the quality of these products. Our research has shown that the high quality of products available under PLs is a more important choice factor for UK consumers compared to Polish consumers. This aspect should be considered in the context of the stage of retail development, its concentration, and the market share of PLs. This determines the stages of development of PLs from the lowest price and lowest quality products to premium products [8] and sustainable PLs [7]. At the current stage of retail trade development, improving PL quality would help retailers to increase the number of customers, including those who focus mainly on quality [57] and sustainability [7]. This indicates that in the UK the development of PLs is at a higher level, which means that it is closer to sustainable PLs. This is confirmed by IPLC research on premium vs. standard offers in the largest retail chains in the UK. For example, Sainsbury’s value-added PLs represents 16.5% of SKUs (stock holding units), in Asda—29.5%, and Tesco—19.8%. Such an offer includes, among others, premium, organic, free from, and eco-friendly products [62].
An important aspect of the development towards sustainable PLs is to compare the quality of products available under PLs with those of producers. Research indicates that the quality of PLs can be compared with national brands which make it equal and very competitive, but requires retailers to maintain high quality at an attractive price to encourage consumers to buy [77]. The Tesco Finest! (premium-priced foods from Tesco—large grocery retailer from the U.K.) is a good example of a PL with a positive image in the higher segment and a range of higher quality products [4]. This is confirmed by the fact that consumers’ perception of higher quality will increase their willingness to purchase PLs [55]. Similarly, in Greece and Scotland, product quality is more important to consumers than price or packaging as a criterion for purchasing PLs [56]. At the same time, the appropriate price/quality ratio is indicated [55]. This is also confirmed by Polish studies, combining a good price/quality ratio with a wide range of PLs, availability of given products in each store of a given retail chain, or trust in retailer brands [36,49,78,79]. This aspect of the price/quality ratio also indicates the share of premium products. The Nielsen Company’s research shows that the share of premium private PLs in the US accounts for 7.2% dollar share, compared to 5.9% in 2016 [80].
Currently, the concept of quality for the development of PLs towards sustainable PLs is being analyzed in two aspects. First, in the context of quality assurance systems for the production process and the final product, and secondly, in relation to the quality perceived of products, producer brands, and PLs by consumers. In response to changing consumer expectations of retailer products, it was necessary to develop an appropriate image of PLs so that the consumer could feel confident about the quality of the food product and guarantee health safety based on appropriate food quality systems, such as ISO 9001, BRC or other certificates in a given country [81]. Quality is perceived by the consumer as the superiority of the product or brand over alternatives and the overall assessment of the brand by the consumer [82]. Moreover, consumers consider the price, packaging design, composition, and food producer in particular to be product quality [83]. In this aspect, the perception of product quality of PLs is influenced by the taste, packaging, general appearance, and variety of choice [84]. All these features affect the consumer’s perception of the product in a given place and time [85]. Product quality is often a subjective assessment and purchasing decisions are quick and spontaneous [86]. The perceived quality as an element of brand equity should also be considered, as the brand should provide consumers with a credible guarantee of quality [87]. In this aspect, perceived quality is described as the consumer’s judgment of the overall excellence or superiority of the product [77,87,88].
Food safety and perceived food safety is also an important issue in the development of PLs towards sustainable PLs. Low prices and simple packaging, observed in the first phase of PL development, made the products available under PLs highly risky. Moreover, the lack of trust, lower product knowledge, and doubtful quality have led consumers to perceived PL products as high risk in terms of food safety [89]. The design of PLs in subsequent stages required attention to production safety aspects. At the same time, the retail chains responsible to the consumer for the safety of PL products require the implementation of the contracted production processes of PL products in accordance with the relevant safety standards [90]. In turn, the growing health and nutritional awareness of consumers are reflected in perceived food safety, described as the degree to which customers feel that the consumption of the branded products is harmless to human health [91].
Our study has some limitations. The analysis focused on qualitative data in relation to the PLs of food products. This research did not address the other product categories available under PLs. Future directions of research should refer to consumers’ opinions on the quality of private label products in terms of the importance of price and other choice factors. It would also be important to compare private labels and producer brands in terms of choice motives, consumer preferences, and opinions. The analysis of determinants of perceived quality of PLs as an element of PL equity should be indicated as a very important future research direction. This is due to the growing share of private labels in the consumer purchasing structure and their development towards sustainable PLs.

5. Conclusions

Our research has shown that the consumer behavior of Polish and British consumers differs in terms of factors determining the choice of products available under PLs and opinions of PL development.
This is due to the stage of PL development towards sustainable PLs, as well as the length of time that PLs have been present on the market. PLs have been present in the English market since the 1970s, while its presence has been registered in Poland since the late 1990s.
The results of our survey are crucial for retail companies and international chains to identify the conditions for the PL development towards sustainable PLs on the one hand, and on the other hand, to identify tools that can become a sustainable-based competitive advantage on the dynamically changing retail market.

Author Contributions

Conceptualization, M.C. and H.G.-W.; methodology, M.C. and H.G.-W.; data extraction and synthesis, M.C. and W.L.; writing—original draft preparation, M.C. and H.G.-W.; writing—review and editing, M.C. and H.G.-W.; supervision, M.C. All authors have read and agreed to the published version of the manuscript. They also participated in conclusions, read, and approved the final manuscript.

Funding

The study was carried out as part of the project “Comparison of consumer conditions for the development of private label in Poland and the UK” (07/KOIEK/SGGW/2017) financed by the Polish Ministry of Science and Higher Education within funds of Institute of Human Nutrition Sciences, Warsaw University of Life Sciences (WULS) for scientific research. The Article Processing Charge was financed by the Polish Ministry of Science and Higher Education within funds of Institute of Human Nutrition, Warsaw University of Life Sciences (WULS) for scientific research.

Acknowledgments

The authors are grateful to the international agency of Kantar Millward Brown, as the partner responsible for data gathering.

Conflicts of Interest

The authors declare no conflict of interest.

References

  1. Steenkamp, J.B.E.M.; Dekimpe, M.G. The Increasing Power of Store Brands: Building Loyalty and Market Share. Long Range Plann. 1997, 30, 917–930. [Google Scholar] [CrossRef]
  2. Shukla, P.; Banerjee, M.; Adidam, P.T. The moderating influence of socio-demographic factors on the relationship between consumer psychographics and the attitude towards private label brands. J. Consum. Behav. 2013, 1–13. [Google Scholar] [CrossRef]
  3. Ailawadi, K.L.; Pauwels, K.; Steenkamp, J.-B.E. Private Label Use and Store Loyalty. J. Mark. 2008, 1–31. [Google Scholar] [CrossRef] [Green Version]
  4. Wang, J.J.; Torelli, C.J.; Lalwan, A.K. The interactive effect of power distance belief and consumers’ status on preference for national (vs. private-label) brands. J. Bus. Res. 2020, 107, 1–12. [Google Scholar] [CrossRef]
  5. Dekimpe, M.G.; Deleersnyder, B. Business cycle research in marketing: A review and research agenda. J. Acad. Mark. Sci. 2018, 46, 31–58. [Google Scholar] [CrossRef] [Green Version]
  6. Martos-Partal, M.; González-Benito, O.; Fustinoni-Venturini, M. Motivational profiling of store brand shoppers: Differences across quality tiers. Mark. Lett. 2015, 26, 187–200. [Google Scholar] [CrossRef]
  7. Gómez-Suárez, M.; Martínez-Ruiz, M.P. Handbook of Research on Strategic Retailing of Private Label Products in a Recovering Economy; IGI Global: Hershey, PA, USA, 2016. [Google Scholar]
  8. Kumar, N.; Steenkamp, J.-B.E.M. Private Label Strategy How to Meet the Store Brand Challenge; Harvard Business School Press: Brighton, MA, USA, 2007; ISBN 9781422101674. [Google Scholar]
  9. Lincoln, K.; Thomassen, L. Private Label. Turning the Retail. Brand Threat into Your Biggest Opportunity; Kogan Page: London, UK, 2008; ISBN 0749455934. [Google Scholar]
  10. De, D.; Singh, A. Consumer’s Perspective and Retailer’s Consideration Towards Purchase of Private Label Brands. Procedia Comput. Sci. 2017, 122, 587–594. [Google Scholar] [CrossRef]
  11. Górska-Warsewicz, H.; Zakowska-Biemans, S.; Czeczotko, M.; Swiatkowska, M.; Stangierska, D.; Swistak, E.; Bobola, A.; Szlachciuk, J.; Krajewski, K. Organic private labels as sources of competitive advantage-The case of international retailers operating on the Polish market. Sustainability 2018, 10, 2338. [Google Scholar] [CrossRef] [Green Version]
  12. Geyskens, I.; Keller, K.O.; Dekimpe, M.G.; de Jong, K. How to brand your private labels. Bus. Horiz. 2018, 61, 487–496. [Google Scholar] [CrossRef]
  13. Liderzy I Trendy W Handlu. Available online: https://retail360.pl/wp-content/uploads/2012/08/RTP_liderzy2017_calosc.pdf (accessed on 8 January 2020).
  14. Chan Choi, S. Defensive strategy against a private label: Building brand premium for retailer cooperation. J. Retail. Consum. Serv. 2017, 34, 335–339. [Google Scholar] [CrossRef]
  15. Collins-Dodd, C.; Lindley, T. Store brands and retail differentiation: The influence of store image and store brand attitude on store own brand perceptions. J. Retail. Consum. Serv. 2003, 10, 345–352. [Google Scholar] [CrossRef]
  16. Grewal, D.; Krishnan, R.; Baker, J.; Borin, N. The Effect of Store Name, Brand Name and Price Discounts on Consumers’ Evaluations and Purchase Intentions. J. Retail. 1998, 74, 331–352. [Google Scholar] [CrossRef] [Green Version]
  17. Laaksonen, H.; Reynolds, J. Own brands in food retailing across Europe. J. Brand Manag. 1994, 2, 37–46. [Google Scholar] [CrossRef]
  18. Nielsen Company The Rise and Rise again of Private Label. Available online: http://www.nielsen.com/us/en/insights/%20reports/2018/the-rise-and-rise-again-of-private-label.html (accessed on 9 June 2019).
  19. Private Label Market (PLMA) Private Label gains across Europe, climbing to all- time highs in seven countries. Available online: https://www.plmainternational.com/industry-news/private-label (accessed on 26 June 2018).
  20. Private Label Market (PLMA) Private Label’S Market Share Reaches All-Time High sin 9 European Countries. Available online: https://www.plmainternational.com/industry-news/private-label-today, (accessed on 22 June 2017).
  21. Private Label Market (PLMA) Market Shares Climbing to All-Time Highs in Five Countries. Available online: https://www.plmainternational.com/industry-news/ (accessed on 3 February 2020).
  22. Sogn-Grundvåg, G.; Larsen, T.A.; Young, J.A. Product Differentiation with Credence Attributes and Private Labels: The Case of Whitefish in UK Supermarkets. J. Agric. Econ. 2014, 65, 368–382. [Google Scholar] [CrossRef]
  23. Burt, S. The strategic role of retail brands in British grocery retailing. Eur. J. Mark. 2000, 34, 875–890. [Google Scholar] [CrossRef]
  24. Peter, J. Boyle and E. Scott Lathrop the value of private label brands to U.S. consumers: An objective and subjective assessment. J. Retail. Consum. Serv. 2007, 20, 80–86. [Google Scholar]
  25. IRi. Share of Private-Label-Price-Level-in-Europe-2018-by-Country. Available online: https://www.statista.com/statistics/383455/private-label-price-level-by-european-countries/ (accessed on 22 May 2020).
  26. Cotterill, R.W. The food distribution system of the future: Convergence towards the US or UK model. Agribusiness 1997, 13, 123–135. [Google Scholar] [CrossRef]
  27. Hokelekli, G.; Track, L.; Co-author, R.; Hokelekli, G.; Leuven, K.U.; Verboven, F.; Leuven, K.U. Private-Label Proliferation A New Dimension of Competition Between Private Labels and National Brands. J. Retail. Consum. Serv. 2015, 36, 38–52. [Google Scholar]
  28. Tarzijan, J.M. Private Labels and ratail market concentration. Abande 2003, 6, 1–20. [Google Scholar]
  29. Nielsen the State of Private Label around the World. Available online: https://www.nielsen.com/ssa/en/insights/report/2014/the-state-of-private-label-around-the-world/ (accessed on 12 April 2020).
  30. PWC The Private Labels Revolution. Available online: https://www.pwc.pl/en.html (accessed on 9 May 2020).
  31. Górska-Warsewicz, H. Zachowania konsumentów wobec marek w sytuacjach kryzysowych. Probl. Zarz. 2013, 11, 143–156. [Google Scholar] [CrossRef]
  32. Górska-Warsewicz, H.; Czeczotko, M. Analysis of Product Strategies of Dairy Trade Brands in Biedronka and Lidl Discounters. Probl. Zarz. 2016, 57, 138–151. [Google Scholar] [CrossRef]
  33. PMR Market Experts Private Label Retail Market in Poland 2019. Market. Analysis and Development Forecasts for 2019–2024. Available online: https://mypmr.pro/products/private-label-retail-market-in-poland-2019 (accessed on 14 May 2020).
  34. Geyskens, I.; Gielens, K.; Gijsbrechts, E. Proliferating Private-Label Portfolios: How Introducing Economy and Premium Private Labels Influences Brand Choice. J. Mark. Res. 2010, 47, 791–807. [Google Scholar] [CrossRef] [Green Version]
  35. Vroegrijk, M.; Gijsbrechts, E.; Campo, K. Battling for the Household’s Category Buck: Can Economy Private Labels Defend Supermarkets Against the Hard-Discounter Threat. J. Retail. 2016, 92, 300–318. [Google Scholar] [CrossRef]
  36. Górska-Warsewicz, H.; Czeczotko, M.; Kudlińska-Chylak, A. Consumer Behaviours towards Private Labels. Handel Wewnętrzny 2018, 2, 54–64. [Google Scholar]
  37. Czeczotko, M.; Górska-Warsewicz, H. Consumers’ knowledge of own brands in Poland. In Nauki Społeczno-Ekonomiczne. Nieprzetarte Ścieżki, Czy Utarte Szlaki; Misiuna, J., Dworakowska, M., Wosiek, R., Eds.; SGH: Warsaw, Poland, 2018; pp. 149–159. ISBN 978-83-8030-256-3. [Google Scholar]
  38. Czeczotko, M.; Kulykovets, O.; Kudlińska-Chylak, A.; Górska-Warsewicz, H. Perception of Private Labels of the Makro Cash & Carry Wholesale Network by Professional Customers from the Sector of Catering Services. Handel Wewnętrzny 2017, 3, 265–274. [Google Scholar]
  39. Czeczotko, M.; Popławski, D. Private labels of retail chains- comparative analysis of purchase portfolio 2017–2018. In Przedsiębiorczość W Nauce I Praktyce: Zarządzanie-Finanse-Rynek; Górska-Warsewicz, H., Czeczotko, M., Eds.; SGGW: Warsaw, Poland, 2019; pp. 160–167. ISBN 9788375838473. [Google Scholar]
  40. Górska-Warsewicz, H.; Czeczotko, M. Perception of Private Labels in Poland. In Internal Trade in Poland; Kłosiewicz-Górecka, U., Klonowska, U., Śmigielska, G., Radziukiewicz, M., Kasperec, S., Eds.; GUS Central Statistical Office: Warsaw, Poland, 2017; pp. 167–187. [Google Scholar]
  41. Czeczotko, M.; Kosicka-Gębska, M.; Górska-Warsewicz, H.; Kudlińska-Chylak, A.; Kulykovets, O. The Retail Trade Characteristics as a Part of a Distribution System in Poland. Przedsiębiorczość i Zarządzanie 2018, XIX, 169–182. [Google Scholar]
  42. Kong, H.; West, S. Wma Declaration of Helsinki—Ethical Principles for Scientific Requirements and Research Protocols. World Med. Assoc. 2013, 79, 29–32. [Google Scholar]
  43. Scherpenzeel, A.C.; Bethlehem, J.G. How Representative Are Online Panels. In Social and Behavioral Research and the Internet: Advances in Applied Methods and Research Strategies; Das, M., Ester, P., Kaczmirek, L., Eds.; Taylor & Francis Group: New York, NY, USA, 2011; pp. 105–132. [Google Scholar]
  44. Lubsky, A. Methodology of Social Research; Laxmi Publications: New Delhi, India, 2017. [Google Scholar]
  45. Wójcicki, T. Application of the CAWI method for the holistic support of innovation. Maint. Probl. 2012, 4, 175–186. [Google Scholar]
  46. C.S.O. Statistical Yearbook of the Republic of Poland 2018; Central Statistical Office: Warsaw, Poland, 2019.
  47. Gov.UK National MinimumWage and National Living Wage Rates. Available online: https://www.gov.uk/national-minimum-wage-rates (accessed on 26 May 2020).
  48. Statistics Poland Methodological Report. In Household Budget Survey; Statistics Poland: Warsaw, Poland, 2001. Available online: https://www.ilo.org/ilostat-files/SSM/SSM6/E/455A.html (accessed on 10 June 2020).
  49. Garczarek-Bąk, U. Retailers’ private label review in Poland and worldwide. Mark. Rynek 2016, 8, 2–14. [Google Scholar]
  50. Matysik-Pejas, R.; Sowula, M. Perception of private labels by purchasers. Eur. Policies Financ. Mark. 2013, 10, 475–483. [Google Scholar]
  51. Cyran, K. The perception of private labels of food products vs. the prospects for their development. Res. Pap. Wrocław Univ. Econ. 2016, 450, 114–124. [Google Scholar]
  52. Kot, Z.; Kaczorowska, J. Perception of Private Labels in Poland among Young Consumers. Eur. POLICIES, Financ. Mark. 2013, 10, 371–380. [Google Scholar]
  53. Rybowska, A. Consumer opinion to the products of its private label trade network operating on the polish market. Rocz. Nauk. Stowarzyszenia Ekon. Rol. Agrobiznesu 2014, 16, 3–258. [Google Scholar]
  54. Urbanek, P.; Walińska, E. Private label image branding—onditions, directions and good practices. In Ekonomia I Zarządzanie W Teorii I Praktyce; University of Łódź: Łodź, Poland, 2016; pp. 201–213. [Google Scholar]
  55. Wanjiku, M. Consumer Perception Towards Private Label. Brands of Four Key Supermarkets in Kenya. Ph.D. Thesis, University of Nairobi, Nairobi, Kenya, 2015; pp. 1–55. [Google Scholar]
  56. Veloutsou, C.; Gioulistanis, E.; Moutinho, L. Own labels choice criteria and perceived characteristics in Greece and Scotland: Factors influencing the willingness to buy. J. Prod. Brand Manag. 2004, 13, 228–241. [Google Scholar] [CrossRef]
  57. Bao, Y.; Bao, Y.; Sheng, S. Motivating purchase of private brands: Effects of store image, product signatureness, and quality variation. J. Bus. Res. 2011, 64, 220–226. [Google Scholar] [CrossRef]
  58. Joshi, A.; Kale, S.; Chandel, S.; Pal, D. Likert Scale: Explored and Explained. Br. J. Appl. Sci. Technol. 2015, 7, 396–403. [Google Scholar] [CrossRef]
  59. Awang, Z.; Afthanorhan, A.; Mamat, M.; Sultan, U.; Abidin, Z. The Likert scale analysis using parametric based Structural Equation Modeling (SEM). Comput. Methods Soc. Sci. 2016, 4, 13–21. [Google Scholar]
  60. Roopa, S.; Rani, M. Questionnaire Designing for a Survey. J. Indian Orthod. Soc. 2012, 46, 273–277. [Google Scholar] [CrossRef]
  61. Sansone, M.; Bruni, R.; Colamatteo, A. Selecting Factors Affecting the Purchase of Private Label Products. In Advances in National Brand and Private Label Marketing; Martínez-López, F., Gázquez-Abad, J., Ailawadi, K., Yagüe-Guillén, M., Eds.; Springer: Berlin/Heidelberg, Germany, 2017; pp. 117–129. ISBN 9783319597010. [Google Scholar]
  62. Opportunities in the Value-Added Private Label. Market. Available online: https://www.iplc-europe.com/wp-content/uploads/2020/01/IPLC-Research-Report-2018.pdf (accessed on 18 March 2020).
  63. Godderidge, P.; Johansson, N.; Larsson, L. Private Labels and Generation Dislo(Y)al–The Impact of Private Labels on Store Loyalty within the Swedish Grocery Retail. Industry; Cerne, A., Ed.; Lund University, School of Economics and Management: Lund, Sweden, 2016. [Google Scholar]
  64. Danziger, S.; Hadar, L.; Morwitz, V.G. Retailer Pricing Strategy and Consumer Choice under Price Uncertainty. J. Consum. Res. 2014, 41, 761–774. [Google Scholar] [CrossRef]
  65. Gangwani, S.; Mathur, M.; Shahab, S. Influence of consumer perceptions of private label brands on store loyalty–evidence from Indian retailing. Cogent Bus. Manag. 2020, 7. [Google Scholar] [CrossRef]
  66. Dobson, P.; Chakraborty, R. Private labels and branded goods: Consumers’ “horrors” and “heroes.”. In Labels, Brands and Competition Policy: The Changing Landscape of Retail. Competition; Ezrachi, A., Bernitz, U., Eds.; Oxford University Press: Oxford, UK, 2009; pp. 100–124. ISBN 0199559376. [Google Scholar]
  67. Smith, R. Employee earnings in the UK. 2018. Available online: https://www.ons.gov.uk/employmentandlabourmarket/peopleinwork/earningsandworkinghours/bulletins/annualsurveyofhoursandearnings/2018 (accessed on 15 June 2020).
  68. Kohonen, T. Self-Organizing Maps, 3th ed.; Springer: Berlin/Heidelberg, Germany, 2001; ISBN 9783540679219. [Google Scholar]
  69. Clarke, K.R.; Warwick, R. Change in Marine Communities an Approach to Statistical Analysis and Interpretation, 2nd ed.; Primer-E: Plymouth, UK, 2001. [Google Scholar]
  70. Greenacre, M.; Blasius, J. Multiple Correspondence Analysis and Related Methods. (Statistics in the Social and Behavioral Sciences Series); Taylor & Francis Group: Boca Raton, FL, USA; CRC: New York, NY, USA, 2006; ISBN 9781584886280. [Google Scholar]
  71. Ibarra Consuegra, O.; Kitchen, P. Own labels in the United Kingdom: A source of competitive advantage in retail business. Pensamiento & Gestión 2006, 21, 114–161. [Google Scholar]
  72. Eales, T. Private Label in Western Economies. Available online: https://www.iriworldwide.com/en-GB/News/Media-Coverage/Private-label-in-Europe-Tailor-your-growth-strategy-per-country,-says-IRI (accessed on 20 May 2019).
  73. Statistica.com Sales share of private labels food in USA in 2019, by category. Available online: https://www.statista.com/statistics/1100038/sales-share-of-private-label-food-us-by-category/ (accessed on 29 March 2020).
  74. Valaskova, K.; Kliestikova, J.; Krizanova, A. Consumer Perception of Private Label Products: An Empirical Study. J. Compet. 2018, 10, 149–163. [Google Scholar]
  75. Abotorabi, O. Private Label in Western Economies IRI Special Report. Available online: https://www.statista.com/statistics/1100038/sales-share-of-private-label-food-us-by-category/ (accessed on 29 March 2020).
  76. Beristain, J.J.; Zorrilla, P. The relationship between store image and store brand equity: A conceptual framework and evidence from hypermarkets. J. Retail. Consum. Serv. 2011, 18, 562–574. [Google Scholar] [CrossRef]
  77. Retnawati, B.B.; Ardyan, E.; Farida, N. The important role of consumer conviction value in improving intention to buy private label product in Indonesia. Asia Pacific Manag. Rev. 2018, 23, 193–200. [Google Scholar] [CrossRef]
  78. Kowalska, M. Development and Significance of Private Label in Poland. Stud. I Pr. Wydz. Nauk. Ekon. I Zarządzania 2015, 39, 365. [Google Scholar]
  79. Majewska, M. How Do We Perceive Private Labels. Prospects for the Development of Private Label. Market. in Poland; Private Label in Poland: Warsaw, Poland, 2014. [Google Scholar]
  80. The Rise of Premium Private Label and it’s Impact on Discount Retailers—Nielsen. Available online: https://www.nielsen.com/us/en/insights/article/2019/the-rise-of-premium-private-label-and-its-impact-on-discount-retailers/?utm_source=sfmc&utm_medium=email&utm_campaign=newswire&utm_content=9-4-19 (accessed on 1 June 2020).
  81. Roosen, J. Marketing of safe food through labeling. J. Food Distrib. Res. 2003, 34, 77–82. [Google Scholar]
  82. Calvo-Porral, C.; Lévy-Mangin, J.P. Private label brands: Major perspective of two customer-based brand equity models. Int. Rev. Retail. Distrib. Consum. Res. 2014, 24, 431–452. [Google Scholar] [CrossRef]
  83. Agyekum, C.K.; Haifeng, H.; Agyeiwaa, A. Consumer Perception of Product Quality. Microeconomics Macroecon. 2015, 3, 25–29. [Google Scholar]
  84. Koshy, A., A. Quality Perceptions of Private Label Brands. Indian Inst. Manag. 2008, 1–22. [Google Scholar]
  85. Yee, C.J.; San, N.C. Consumers’ Perceived Quality, Perceived Value and Perceived Risk Towards Purchase Decision on Automobile. Am. J. Econ. Bus. Adm. 2011, 3, 47–57. [Google Scholar]
  86. DelVecchio, D. Consumer perceptions of private label quality: The role of product category characteristics and consumer use of heuristics. J. Retail. Consum. Serv. 2001, 8, 239–249. [Google Scholar] [CrossRef]
  87. Aaker, D.A. Managing Brand Equity Capitalizing on the Value of a Brand Name; Free Press: Toronto, ON, Canada; New York, NY, USA, 1991. [Google Scholar]
  88. Umar, T.; Mat, N.K.N.; Tahir, F.A.; Alekam, J.M.E. The Practicality and Application of Aaker’s Customer Based Brand Equity Model in the Nigerian Banking Sector. Am. J. Econ. 2012, 2, 149–152. [Google Scholar] [CrossRef]
  89. Jaafar, S.N. Consumers’ Perceptions, Attitudes and Purchase Intention towards Private Label Food Products in Malaysia. Asian J. Bus. Manag. Sci. 2018, 2, 73–90. [Google Scholar]
  90. Lewis, M. Understanding the Value of Private Label Store Brands—Reasons to Buy. Available online: https://www.moneycrashers.com/private-label-store-brands/ (accessed on 14 July 2020).
  91. Bauer, H.H.; Heinrich, D.; Schäfer, D.B. The effects of organic labels on global, local, and private brands. More hype than substance. J. Bus. Res. 2013, 66, 1035–1043. [Google Scholar] [CrossRef]
Figure 1. Correspondence graph of consumers purchasing PL products. Gender: Women, Men; Age (y.o.): 18–25; 26–35; 36–50; 51–70; >71; Period of purchasing of PL products: shorter than 1 month; from month to 1 year; 1–5 years, 5–10 years, >10 years; Education: EdN-Primary and vocational; EdS-Secondary; EdW-Higher; Income: Income 1—under 1000 PLN/under £1200; Income 2—1001 PLN–1500 PLN/£1201–£1800; Income 3— 1501 PLN–2500 PLN/£1801–£2500; Income 4— 2501 PLN–4000 PLN/£2501–£3500; Income 5— 4001 PLN or more/£3500 or more; Indicative share of PL products in total food purchases: 0%; 10%; 25%; 50%; 75%; 90%; 100%; Red lines: mark the zone where most associations are concentrated, they facilitate the identification of variants of various characteristics that tend to co–occurrence with the GB and separately those that tend to co–occurrence with Poland (PL).
Sustainability 12 06035 g001
Table 1. Questionnaire structure.
QuestionCited LiteratureVariants of Answers
1.Period of purchase of PL products-choose the right answer
less than 1 month-
1 month to 1year-
1 to 5 years-
5 to 10 years-
more than 10 years-
2.Opinions of PLs regarding retail chainsnot analyzed in this paper
3.Factors for purchasing PL products:-1—totally disagree
2—disagree;
3—neither agree nor disagree;
4—agree;
5—totally agree
wide product range[29,36,49,50,51]
lower price compared to leading brands[29,49,52,53,54]
high product quality[29,36,50,52,53,54,55,56]
ability to buy the same products repeatedly[36,57]
availability of PL products in every store of a particular chain[36,49,50,51,55]
attachment to a given chain[36,55,56,57]
feeling of safety and trust to PL products[51,52,55,57]
recognisability of PLs among consumers[40,54,55,57]
4.Opinions on currently offered PL productsnot analyzed in this paper
5.Opinions on the current development of the PL product range-
improvement in the quality of PL products[29,36,52,61]1—unimportant
increase in the range of products offered under PL[61,62]2—fairly unimportant
improved visual presentation of PL products[52,61,63]3—neither important nor unimportant
lower price of PL products while retaining quality[3,61,63,64]
greater availability of PL products[36,49,50,51,55]4—fairly important
improved image/perception of PL products[61,63,65]5—very important
6.Frequency of purchasing particular categories of products sold under the PLs of retail chains:[49,53,55,66]scale:
1—I don’t buy at all;
2—I buy rarely;
3—I buy sometimes;
4—I buy often;
5—buy very often.
dairy products, grain products, sweets &biscuits, bread and bakery products, meat and meat products, fruits &vegetables, fruit &vegetable products, frozen food,
non-alcoholic beverages & water, alcohol
-
7.Indicative share of PL products in relation to total food purchases:-scale: 0%; 10%;25%; 50%;75%; 90%; 100%
8.Retail chains most frequently chosen for PLs purchase (appropriate list of stores for the country)-not analyzed in this paper
United Kingdom: Aldi; Asda; Iceland; Lidl; Mark and Spencer; Morrison’s; Sainsbury’s; Symbols & Independent; Tesco; The Co-operative; Waitrose; Ocado; Other Outlets-choose the right answer (max. 3)
Poland: Tesco; Auchan; Carrefour; Netto; Kaufland; Biedronka; Lidl; Aldi; E. Leclerc; Delikatesy Centrum; Żabka; Stokrotka; Intermarche; Polomarket, Lewiatan; Makro; Selgros-choose the right answer (max. 3)
9.Sociodemographic data:-choose the right answer
Gender: women, men-
Age (years): 18–25; 26–35; 36–50; 51–70;71+-
Education: primary and vocational, secondary, higher-
Place of residence: rural area; cities up to 19,999; cities above 20,000 to 99,999; cities above 100,000 to 499,999; cities above 500,000-
Household income
(per person; status on January 1, 2018)
United Kingdom: under £1200; £1201–£1800; £1801–£2500; £2501–£3500; £3500 or more
Poland: under 1000 PLN; 1001 PLN-1500 PLN; 1501 PLN-2500 PLN; 2501 PLN-4000 PLN; 4001 PLN or more
[46,48,67]
Table 2. Sample structure.
GroupPolandUnited Kingdom
Number of RespondentsPercentageNumber of RespondentsPercentage
Total
-500100.0500100.0
Gender
Women26152.224649.2
Men23947.825450.8
Age
18–255511.0316.2
26–359118.215631.2
36–5013326.612625.2
51–7016132.214929.8
71+6012.0387.6
Education
Primary and vocational163.25611.2
Secondary18737.428356.6
Higher29759.416132.2
Place of Residence
Rural area15030.011923.8
Cities up to 19,9998517.07615.2
Cities above20,000 to 99,9999519.08617.2
Cities above100,000 to 499,9998717.411222.4
Cities above 500.0008316.610721.4
Household Income; Poland
Under 1000 PLN469.2--
1001 PLN–1500 PLN6713.4--
1501 PLN–2500 PLN14629.2--
2501 PLN–4000 PLN16432.8--
4001 PLN or more7715.4--
Household Income; UK
Under £1200--11022.0
£1201–£1800--13026.0
£1801–£2500--10120.2
£2501–£3500--9218.4
£3500 or more--6713.4
Table 3. The period of purchasing private labels (PLs).
PeriodPoland (n = 500)UK (n = 500)p-Value *
less than 1 month4 (0.8%)33 (6.6%)<0.01
from month to 1 year43 (8.6%)61 (12.2%)
1 to 5 years229 (45.8%)120 (24.0%)
5 to 10 years154 (30.8%)55 (11.0%)
more than 10 years70 (14.0%)231 (46.2%)
* compared using chi-square test (p ≤ 0.05)
Table 4. Purchase frequency of PLs.
ProductsAverage 1/p ValueAverage for Polish and British Population
Adairy products3.630.0029 Sustainability 12 06035 i001
Bcereal products3.120.0685
Csweets and biscuits3.24<0.01
DBakery3.42<0.01
Emeat and cold meat3.24<0.01
Ffruits and vegetables3.48<0.01
Gfruit and vegetable products3.060.0730
Hnon-alcoholic beverages3.340.1109
IAlcohol2.33<0.01
Jfrozen food3.29<0.01
1/ Scale: 1—I don’t buy at all; 2—I buy rarely; 3—I buy sometimes; 4—I buy often; 5—I buy very often.
Table 5. The main reasons for buying PL products.
Factors for Purchasing PL ProductsAverage 1/p-ValueCorrelationAverage for Clusters
UKPolandWhole Population
Awide product range3.563.313.440.0000 Sustainability 12 06035 i002
Blower price compared to leading brands3.834.023.920.0003
Chigh product quality3.573.273.420.0000
Dability to buy the same products repeatedly3.713.723.710.9036
Eavailability of PL products in every store of a particular chain3.673.733.700.2393
Fattachment to a given chain3.503.623.560.0241
Gfeeling of safety and trust to PL products3.573.473.520.0518
Hrecognisability of PLs among consumers3.553.373.460.0011
1/ Scale: 1—Totally disagree; 2—Disagree; 3—Neither agree nor disagree; 4—Agree; 5—Totally agree.
Table 6. Cluster description.
SpecificationCluster 1Cluster 2Cluster 3Cluster 4Chi Square (χ2)p-ValueCramer
Correlations
Poland (n = 500)241 (48.2%)198 (39.6%)33 (6.6%)28 (5.6%)12.460.00490.112
UK (n = 500)202 (40.4%)201 (40.2%)66 (13.2%)31 (6.2%)
Total (n = 1000)443 (44.3%)399 (39.9%)99 (9.9%)59 (5.9%)
Table 7. Opinions on the current development of the PL products.
Opinions on the Current Development of the PL Product RangeAverage 1/p-ValueCorrelationAverage for Clusters
UKPolandWhole Population
Aimprovement in the quality of PL products3.814.073.940.0000 Sustainability 12 06035 i003
Bincrease in the range of products offered under PL3.733.903.810.0007
Cimproved visual presentation of PL products3.523.703.610.0007
Dlower price of PL products while retaining quality3.924.194.050.0000
Egreater availability of PL products3.723.873.800.0036
Fimproved image/perception of PL products3.673.873.770.0002
1/ Scale: 1—Unimportant; 2—Fairly unimportant; 3—Neither important nor unimportant; 4—Fairly important; 5—Very important.
Table 8. Cluster description.
SpecificationCluster 1Cluster 2Cluster 3Cluster 4Chi Square (χ2)p-ValueCramer
Correlations
Poland (n = 500)218 (43.6%)118 (23.6%)67 (13.4%)97 (19.4%)42.560.00010.2063
UK (n = 500)156 (31.2%)111 (22.2%)149 (29.8%)84 (16.8%)
Total (n = 1000)374 (37.4%)229 (22.9%)216 (21.6%)181 (18.1%)

