A Framework to Classify Environmental Inequity in Absolute and Relative Terms, and Its Application in Beijing

Key Laboratory for Urban Habitat Environmental Science and Technology, School of Urban Planning and Design, Peking University, Shenzhen 518055, China
*
Author to whom correspondence should be addressed.
Sustainability 2020, 12(11), 4757; https://doi.org/10.3390/su12114757
Submission received: 21 May 2020
/
Revised: 3 June 2020
/
Accepted: 9 June 2020
/
Published: 10 June 2020
Abstract
:Although reducing environmental inequities is widely recognized as an essential step towards sustainable cities, decision-makers frequently lack the tools to identify inequity distribution patterns and designing effective intervention policies. This study seeks to present a framework that can help decision-making processes by classifying environmental inequity districts in multiple perspectives, especially in absolute and relative terms. This framework includes four steps: (A) variable selection, (B) data normalization, (C) ranking indicators, (D) summarizing inequity classification, which then assign results to selected areas. The framework aims to classify and compare environmental inequities in multiple perspectives, and can be applied in various environmental problems, with advantages such as high acceptability and clear comprehensibility. To show the potential use of this framework, a case application in Beijing, China, was conducted to evaluate the environmental inequity of air pollution. The results suggest that decision-makers should focus on the central urban area and some southern regions of Beijing to implement various improvement policies. Based on the results from Beijing, how the framework can be used to help decision-makers, the future roles of this framework with the government and the public, as well as the framework’s limitations are further discussed.
1. Introduction
Reducing inequality in and among countries has become one of the sustainable development goals (SDGs), which includes many concerning issues, such as gender inequity, energy inequity, and environmental inequity [1]. The main concept of environmental inequity concerns the inequitable and disproportionately heavy exposure of poor, minority, and disenfranchised populations to toxic chemicals, water and air pollution, and other environmental hazards [2]. Past researches in the USA, Europe and China have shown that vulnerable people mainly suffer from environmental hazards because of poverty, race, age, or gender, which means that environmental quality is unevenly distributed across different demographic groups [3,4,5,6]. Due to the spatial-temporal differentiation of environmental governance and pollution, environmental inequity is widespread among different districts, cities, and countries [7].
A challenging problem that decision-makers may face when attempting to reduce urban environmental inequities is where to allocate available resources first [8]. And the difficulties in solving this problem arise because (1) environmental problems are seldom evenly distributed, (2) the spatial patterns of pollutants may not be easily identifiable, and (3) different populations hold different opinions and perspectives on environmental inequities [9]. It entails a spatial prioritization problem, for which previous research has provided a framework by building the highest environmental and social relevance [8]. Therefore, this study seeks to solve the problem by classifying the types of inequity districts and support policy-makers and researchers. It is necessary to develop a simple, easily acceptable classification framework to identify target areas for mitigating environmental inequities. It would require a multi-perspective evaluation standard and spatially explicit combination methods.
Therefore, the integration of multiple perspectives on environmental inequity and easily acceptable classification methods into a spatially explicit framework is an efficient approach to helping decision-making, investment in concentrating environmental problems, and the identification of difference among regions in a city. Based on such an approach, this paper presents a framework that integrates conditions and the reduction of environmental variables from multiple perspectives into a classification method, adding demographic data, which can be used by decision-makers to identify priority areas for reducing environmental inequities in different aims and a different leading standard. This framework aims to: (1) classify environmental inequities and find the priority area for inequity mitigation, (2) compare the inequities in multiple perspectives, and (3) support a relatively simple, easily acceptable, and comprehensive framework for policy-making. To show the potential use of this framework, a case study was applied in the capital city of China, Beijing. Based on the results of the case application, how the inequities were distributed in Beijing, how the framework can be well-used in the real decision-making process and future improvements are further discussed in this paper.
2. Literature Review: Concepts about Environmental Inequity
Regardless of developed regions, such as the USA and Europe, or some developing regions, such as Ghana and Chile, environmental inequity has proved to be a widespread problem [3,5,8,10,11]. In recent years, more and more attention has been paid to the environmental inequity problems of urban residents, such as pollution inequity, health inequality [6,10]. In fact, two similar concepts are widely used in current research: environmental inequity and environmental inequality [8]. Environmental inequality refers to the “unequal social distribution of environmental risks and hazards and access to environmental goods and services” [8]. A related but different concept is environmental inequity, which implies that the observed environmental inequality is judged by the public as socially unfair [11]. Therefore, the concept of inequality emphasizes the spatial distribution of “unequal environmental resources and risks”, while the concept of inequity focuses on the social fairness of that environmental distribution [12].
Different groups also have different concepts of environmental equity: developed countries and the affluent want environmental quality to correspond to investment, which is closer to the concept of “those who pay gain”, while developing countries and poverty-stricken people expect more for equal environmental quality, which is closer to the concept of environmental equality [13,14]. Based on this distinction and previous research, this study seeks to propose two kinds of inequity: absolute inequity and relative inequity [15]. The absolute environmental inequity refers to the inequity caused by the unequal social distribution of environmental risks and hazards, which is similar to the concept of environmental inequality. On the other hand, the relative environmental inequity refers to the inequity caused by disproportionate pollution with different investment. These two concepts represent two kinds of theory in the current government’s environmental protection work: (1) give priority to the regions with the most serious pollution; (2) give priority to the regions with both the most serious pollution and the highest economic investment. For example, when dealing with air pollution in the Beijing–Tianjin–Hebei Region (an economically developed region including 13 cities), the China central government invested more in Beijing and Tianjin rather than the surrounding cities with more serious pollution [13].
Urban residents are seriously concerned about the quality of their living environment. This is not only because of the physical effect of environmental pollution on human health, but also because of the psychological impact on vulnerable people due to the unfair distribution of environmental quality [14]. Residents would like to invest in houses in order to move to the place with better environmental quality, which even affects the housing prices [16,17]. However, the improvement of environmental pollution was not considered as a part of environmental quality. Previous research has found that pollution reductions have a positive impact on public health, while the impact on environmental equity was not positive [18]. Considering that residents are also concerned about pollution reduction and the government should change the priority regions based on the effect of governance, pollution reduction should also be considered in the framework for the evaluation of environmental inequity. Another important concept is forward inequity and reverse inequity used to classify regions in the framework, which represent the regions to suffer more and a smaller environmental hazard burden, respectively. Similar concepts (positive inequality and negative inequality) appeared in previous research on air pollution inequality [19]. Positive inequality means that the least advantaged groups carry a larger environmental hazard burden, while negative inequality means that the least advantaged groups carry a larger environmental hazard burden [19]. It reminds the public that the classification of benefit or loss from environmental inequity is an ideal way that is directly related to residents’ rights.
3. The Framework of Inequity Classification
The framework is intended to build a relatively simple, easily acceptable classification tool that can be applied at different evaluation standards. To use the framework in actual research, relevant environmental inequity problems and geographical characteristics need to be first investigated through surveys, research, literature, political decisions, and others. Therefore, the goal of the framework is not to identify the particular environmental inequities in cities, which need to be finished at a previous stage. The goal of the framework is to provide a step-by-step procedural framework to help researchers and policy-makers classify types of areas and make corresponding decisions or provide advice for the reduction of environmental inequities. The design and writing of the framework in this study references much from previous research [8,20]. This framework essentially has the advantages of multicriteria decision analysis method, but it is not suitable to being referred to as multicriteria decision analysis method because the concepts mentioned are not widely admitted in the area of environmental inequity [21].
Operationally, the framework of absolute inequity classification works by constructing two indicators of the pollutant: condition and reduction. The condition and reduction here refer to the pollution concentration and the difference value between two time points (increase or decrease), respectively. The reduction of pollutants is selected as one of the indicators because it can indicate the future development tendency of environmental quality to some extent. The integration of these two indicators provides a comprehensive framework for the identification of areas with higher pollutant concentration and development tendency in a certain time period. To classify environmental inequities in relative terms, the quotient of environmental variables and investment is used as the beginning variable, and the subsequent procedures are the same. The procedures for classifying environmental inequities both in absolute and relative terms include four steps: (A) variable selection, (B) data normalization, (C) ranking indicators, (D) summarizing inequity classification (Figure 1).
Step A of the framework consists of the selection of environmental variables and computing quotient in relative inequity. Environmental variables with large differences in spatial-temporal distribution and negative influence on public health are the prior choices. The chosen variables need to provide accurate spatial data at the scale which the framework is intended to be applied and the scale of all the variables need to be the same. Several environmental variables are allowed if weighted by reasonable methods and combined to one indicator. Thus, the variables or the last indicator should be able to identify the spatial distribution of environmental problems that have been previously identified as important within the study area. The framework needs numerical data for quantitative results, so the categorical data of certain variables must be transformed into numerical or ranked values to be used as valid inputs. To calculate the average benefits of each unit of investment, the numerical quotients of environmental variables and investment should be computed at the scale at which the framework is intended to be applied. The research scale of both absolute and relative inequities should be the same for valid comparisons.
Step B aims to transform the input variables and quotients in relative inequity into normalized indicators with compatible units for mathematical computations. Normalization methods include two main approaches: the reference- or threshold-based approach (e.g., z-scores), and the data distribution approach (e.g., max-min rescaling). The reference- or threshold-based approaches are more useful when there are enough empirical data or relevant studies to support the reference or threshold values. Conversely, the data distribution approaches are applicable when information is lacking for decisions on what the desirable reference or threshold values should be. Moreover, it is recommended to apply the same normalization method to all variables for consistency. If more than one variable was selected in the framework, researchers would need to aggregate the normalized variables by weighting summation methods such as expert evaluation or public participation [8].
Step C involves the ranking and classification with compatible units in the applied area. To simplify the principle of the framework as much as possible, this study seeks to use the classical concept and easy operational approach in design. Thus, the economic concept of “utility” reminds researchers to consider pollution as an “environmental utility” and to regard it as a by-product of investment, while the decrease and increase of pollution can be considered as having positive utility and negative utility, respectively. Besides, the rank method has been used to judge the inequity because the essence of inequity is a comparison between a pair of or among plenty of individuals, and it will be clearer and more acceptable. Another reason to use the ranking-based method is the advantage of avoiding an extremely skewed distribution of data with outliers, which commonly exist in cities with uneven urbanizations of developing countries.
The regional units in the study area can be classified as three types: forward inequity, reverse inequity and equity. Here, forward inequity means that the population of a region suffer a larger environmental hazard burden both in pollutant condition and reduction (they do not receive benefits from the environment), reverse inequity means that the public in a region suffer a smaller environmental hazard burden both in pollutant condition and reduction (they receive benefits from the environment), and equity in the classification of the framework means that the public suffer a larger environmental hazard burden either in pollutant condition or reduction (a balance situation). Therefore, all the compatible units or regions can be easily classified into the three types above: the most negative regions in environmental condition and reduction are forward inequity districts, while the most positive ones are reverse inequity districts, and the others will be classified as districts that not need to prioritize environmental inequity problems—equity districts. Policy-makers and researchers should pay attention to the forward inequity districts, and the residents should focus on defined types and their dynamic change of self-living neighborhoods.
Step D is intended to summarize and analyze the inequity classification in absolute and relative terms. It is also necessary to analyze the geographical distribution of inequities with demographic characteristics, important programs, and policy change in the research time period.
The classical economic concepts of the Lorenz curve and the Gini coefficient can be utilized to judge the equity of the whole city [22,23]. Indicators of compatible units in research area should be arranged from the lowest to the highest and fitted to the Lorenz curve, and the Gini coefficient should be calculated based on the integral area (Figure 2). For easier operation, the sum value of compatible units can also be used instead of the integration value if it does not fit the actual curve. The lower Gini coefficient value represents better environment equity. The Gini coefficient was calculated based on the method as follows:
where is the shaded area formed by the absolute average curve and the Lorenz curve , is the total area of the triangle under the absolute average curve .
4. Application of the Framework in Beijing
4.1. Descriptive Analysis of Applied City Beijing
As a large city with an area of approximately 16,410 km2 and a population of 26 million in 2010, Beijing features large spatial-temporal differences in pollution, and a monocentric housing price distribution [24,25]. The current most concerning environmental problem of the Chinese public and government is the long-term, severe air pollution, especially PM2.5 (fine particular matter with aerodynamic diameter ≤2.5 µm) pollution [26,27]. PM2.5 is the most significant pollutant currently in China, which has seriously threatened China’s public health and sustainable development [28]. Adequate spatial-temporal differences in air pollution are helpful in showing a clear comparison of health risks, and clear distribution of housing prices helps readers understand the house purchasing strategy in Beijing.
4.2. Implementing the Framework in Beijing
4.2.1. Step A: Select Variables and Compute Quotients
With the deepening of urbanization, PM2.5 is increasingly harmful to public residents [29,30,31]. A wide variety of public health effects are related to chronic (long-term) and acute (short-term) exposure to PM2.5 [32,33,34]. In particular, acute exposure to PM2.5 can trigger asthma, skin diseases, respiratory disorders, and mental illness in vulnerable groups like kids, women, and the elderly [35,36,37,38]. Past research in Europe, the USA and China has focused on the environmental inequity produced by PM2.5 and its nexus with demographic characteristics [6,7,35,36,37]. In Beijing, PM2.5 mainly comes from the southern and eastern industrial cities and is composed of secondary aerosols, coal combustion, vehicle, industry, biomass burning [13,38]. Although the central government has put in place a series of powerful measures in recent years to gradually improve urban air quality, there is still a certain differentiated gap in the large administrative areas and it shows a rising tendency from north to south [39,40,41].
In total, 35 air quality monitoring stations have been set up in Beijing (including 12 urban environmental assessment point, 11 suburban environmental assessment points, 7 control points and regional points, and 5 traffic pollution monitoring points) and the OK (Ordinary Kriging) interpolation model has been used many times in past research to estimate the annual concentration of PM2.5 [6,37]. In this case application, the OK interpolation model was utilized to estimate the PM2.5 annual average concentration and highest one-day concentration (μg/m3) of the unmonitored area from 2014 to 2017 in Beijing at a resolution of 30 m. Real-time monitoring data of PM2.5 from 2014 to 2017 were obtained from the Beijing Municipal Environmental Monitoring Center (http://www.bjmemc.com.cn/). The OK interpolation model can be implemented readily in ArcGIS [42]. The results of the OK interpolation model were summarized to calculate the mean values of PM2.5 concentration within the zones of the 257 census tracts. Moreover, PM2.5 concentration reduction was calculated based on the annual average values and highest one-day values from 2014 to 2017.
Housing prices were selected as location investment in relative inequity in this application. In present-day China, the most important investment is in house property, which plays a vital role in urban-rural economic development, and housing prices become one of the most controversial economic indicators [25,43,44]. In the largest Chinese cities, such as Beijing, the enormous gap in housing prices also symbolizes the gap between the rich and poor. In Beijing, housing prices are quite “monocentric” (the spatial distribution of house prices has only one center), with the characteristics of a wide price range and stable price leveled by location [24,25]. In addition, housing prices always depend more on the school districts, distance to jobs, distance to the central business district, and less on the environmental quality, especially the air quality which is difficult to judge for the public [17,45]. Previous research also suggests that a 10% increase in PM2.5 concentration causes a 2.4% reduction in local housing prices in China, and draws the attention to the role housing prices play in environmental issues [17]. Therefore, the purchasing process could account for the lack of awareness of the investment loss on environmental quality and it leads to more environmental inequity. As for relative environmental inequity, housing prices and pollution are regarded as the investment and as the by-product of investment by purchasers, respectively.
This case application involves 257 census tracts from the entire administrative area to investigate the existence of environmental inequity because of housing prices. The houses in the same census tract were assumed to be similar and the regions without transaction data (regions like these always are full of forests and mountains and are not suitable for the housing market) were assumed to be a transaction-unformed market region. Housing price was applied to represent income status and the investment for the environment quality of the purchasers in the same census tract. The inverse distance weighted (IDW) interpolation model, which is relatively simple, was applied to estimate the average housing price (Chinese Yuan/m2) based on real transaction data in the 257 census tracts in 2017 at a resolution of 30 m. Data on the housing transaction price of 197,741 dwelling units from 2017 were collected from the Fang website (http://esf.fang.com/). The IDW interpolation model can be implemented readily in ArcGIS. The results of the IDW interpolation model were summarized to calculate the mean values of housing prices within the zones of the 257 census tracts. Housing price data were divided into three types at the 33rd and 67th percentiles according to value, which refer to the low/moderate/high housing prices in Beijing. The distribution map built with housing prices in Beijing is shown (Figure S1).
The quotient values of pollution and housing price were calculated in each census tract from 2014 to 2017. The PM2.5 condition was based on the data for each year and PM2.5 reduction was based on the data for each two-year grouping. Because this framework aims for an easier, more acceptable method for the public and policy-makers, the methods below utilized some unreferenced, little biased assumptions. As a pollutant, PM2.5 has the peculiarity of negative utility, so the PM2.5 concentration was reciprocally transformed when computing the PM2.5 condition and negative PM2.5 reduction. The quotient was calculated as follows:
where is the PM2.5 concentration of census tract i in year j (j can be 2014, 2015, 2016, or 2017), is the PM2.5 reduction of census tract i for the period k (k can be 2014–2015, 2015–2016, 2016–2017, or 2014–2017), and is the average housing price in census tract i.
Two temporal resolutions (annual average and highest one-day) were set to evaluate the environmental inequity at different exposure scales. The annual average of PM2.5 represented chronic exposure, which means the average pollution value of the whole year, and the highest one-day average of PM2.5 represented acute exposure, which means the highest one-day pollution data [6]. The highest one-day concentration was selected as the acute exposure because the highest pollution often occurs at night and lasts for the whole day. The classification standard of China Environmental Monitoring Station includes six classes: excellent, standard, slight pollution, medium pollution, serious pollution, and severe pollution (0–35, 35–75, 75–115, 115–150, 150–250, ≥250 μg/m3, respectively), which is not clear enough to classify the pollution in Beijing during 2014 to 2017 [46]. Therefore, the equal interval method was utilized here to classify the pollution in Figure 3; Figure 4 and only for showing in the figures; it does not influence results. The distribution maps of PM2.5 condition and reduction in chronic and acute exposure scales are shown (Figure 3, Figure 4, Figure 5 and Figure 6).
Few studies have been conducted to estimate the environmental inequity of different residential demographics for both chronic and acute exposure [6]. In past studies, kids, the elderly, the residents lacking education, and migrant workers are vulnerable groups who are more likely to suffer environmental inequity; population density can also reveal the development of the region [3,47,48,49]. Therefore, five demographic characteristics were selected in average values, including child population proportion (%), elderly population proportion (%), education level (years), migrant population proportion (%), and population density (pop./km2), to summarize the connection between environmental inequities and demographics distribution. The smallest units in this study were the 257 census tracts. With the complex diversity of districts, the area and population in 2010 ranged from 0.35 km2 to 285.87 km2 and from 7600 to 350,000. The detailed data were derived from the population census of China in 2010. The descriptive statistics for all the data of census tracts are shown (Table S1).
4.2.2. Step B: Transform Input Variables into Normalized Indicators with Compatible Units
In this step, all variables were transformed into indicators ranging between 0 and 1 by using a max-min rescaling method. This step intended to capture the spatial distribution of each variable without making normative assumptions of particular desired threshold values. All the data, including PM2.5 concentration and housing price, were max-min normalized in (0,1) (the minimum housing prices were set as zero to avoid the divisor being zero) [8]. Given a set of matching data , i = 1, 2, …, n, the normalized data are given by
4.2.3. Step C: Rank and Classify the Compatible Units in the Applied Area
To classify the inequities in 257 census tracts, the procedures stated on the framework are directly followed, which are to first rank the indicators of condition and reduction, and second, to classify the census tracts through the rules above.
4.2.4. Step D: Summarize the Inequity Classification in Absolute and Relative Terms
In this step, a total of 257 census tracts were assigned defined types at chronic and acute exposure scales with absolute inequity and relative inequity (Figure 7 and Figure 8). The results for absolute inequity showed that forward inequity districts were mainly distributed in South Beijing, while those for relative inequity were mainly distributed in the central urban area. The reverse inequity districts were mainly distributed in North Beijing, which are actually close to the forest and natural park. Following the procedures described above, the conditions of pollution and quotient above have been used for computing the Gini coefficient of 257 census tracts in Beijing (Table 1). In addition, the average demographic values of each type of inequity district are calculated and matched for analysis (Figures S2 and S3).
5. Discussion
5.1. Interpretation of the Environmental Inequity Results in Beijing
The results show that in terms of absolute inequity, environmental governance should be given priority in the South of Beijing, while in terms of relative inequity, it should be moved to the central urban area. The differences between the two inequities suggest that decision-makers need to choose a suitable perspective according to the actual situation. For example, when facing serious pollution or explosive influenza, such as the PM2.5 in Northern China, decision-makers should use absolute inequity to find the most serious source area for effective governance. In contrast, when facing less harmful pollution, decision-makers should use relative inequity to find areas with high pollution and large economic value. Such an application method needs to be combined with a detailed pollution monitoring standard to judge the harmfulness of pollution.
One of the consensuses in the public is that people in high-income areas may invest to improve their household-level environment or move to places of high environmental quality, whereas people in low-income neighborhoods do not have the financial resources to do so [50]. The two inequity perspectives in the framework represent two different opinions regarding this situation: if it is considered as inequity caused by unequal wealth distribution, the classification of absolute inequity will be more suitable; if it is considered as inequity based on normal capital investment, the classification of relative inequity will be more suitable. Therefore, the key areas identified by the framework will be different according to different inequity perspectives. For example, in the South, peripheral census tracts were classified as forward inequity districts in the result classified by pollution (chronic), while the central census tracts were classified as forward inequity in the result classified by quotient (chronic) (Figure 7A and Figure 8A). It indicated that the government should focus on the southern, peripheral districts if targeting the improvement of overall environmental quality, or they should put more power on the central tracts if aiming at the unequal private investment of surrounding environmental quality improvement.
In contrast with previous findings, the groups that suffered more harm in Beijing are actually those living in the central urban area, who have higher rates of education [47,51]. This was mainly caused by serious air pollution and high population density in the central urban area of Beijing, which also indicated the particularity of China’s environmental inequity issue. On the one hand, the government should reduce pollution to improve public health. On the other hand, decision-makers should mitigate the psychological impact of environmental inequity by the regulation of the housing market and urban planning, to enhance the sustainable development of the city [52].
5.2. Notes on Potential Using the Framework
Environmental equity has been gaining currency for years, both as a factor for and a goal of sustainable development [53]. Thus, developing tools such as an assessment framework to help policy-makers to prioritize environmental improvement efforts is crucial for promoting more equitable and sustainable cities [8,54]. The framework for inequity classification presented in this paper is the sort of tool that helps to find the most influenced areas for reducing environmental inequities. The aim of this paper is not to show the distribution patterns of environmental quality or environmental inequities, for which diverse approaches are reported in the literature, but rather to help classify the key areas of the city and to provide advice in the decision-making process.
This framework can also be used to analyze various environmental variables, such as levels of sulfur dioxide, nitrogen dioxide, ozone; urban green space, land surface temperature. But other variables, such as indicators in water pollution or soil pollution, were difficult to apply in the framework due to the difficulty and resolution of data monitoring and sharing. These environmental problems are also difficult to obtain effective results for in other framework research [8]. Housing prices were used in the case study to represent the residents’ investment in the ambient area, while they can be replaced by variables such as residents’ income, land price, environmental governance investment. Demographic census data of each region units can also help summarize the characteristics of areas suffering from environmental inequity and provide evidence for decision-making.
Because of lacking data, the flexibility of this framework did not show in the application. However, this framework can use more than one variable by using weighting/aggregation methods, or changing the applied scales of research scales, such as the pixel region, detailed neighborhood [8]. The flexibility of the framework is necessary in order to apply it in diverse cities with the complexity of environmental inequity issues. In most metropolitan cities, including Beijing, decisions are made on multiple levels of government or organizations, each of which usually focuses on the respective destination of concern [54]. Therefore, the results from this case application can offer useful information for the demands of different decision-makers.
Similarly to environmental impact assessment, public participation is also a significant part of the decision-making regarding environmental inequity. The framework presented in this paper is relatively simple, easy to accept, and comprehensive, which are desirable characteristics of tools for linking science with the public in decision-making [8]. Before implementing policies, the government should provide the results of the framework to the public and relevant organizations to obtain more specific views and suggestions, which is fundamentally important for the fairness and transparency of the procedures, as well as for the legitimacy of the outcomes [55].
Multiple perspectives of analysis can be used in further applications, which provides different, but complementary, information for policy-makers and researchers [56]. Although spatial multicriteria decision analysis has been used in many geographical and sustainability studies, it was still a relatively novel method in environmental inequities [57]. Classification results for different perspectives would be needed in different regions, periods, stages of development, and in different populations. For example, the result at the acute exposure scale is more important when focusing on the kids, the elderly, and respiratory patients, while the result at the chronic exposure scale is more helpful when solving long-term environmental problems [6].
5.3. Limitations of the Framework
The framework in this study can classify the environmental inequity in the study area, but there are still some limitations. (1) The framework requires high quality of monitoring and statistical data for each region, which is difficult for developing regions without enough investment. Although there are some alternative methods, such as the interpolation method used in case application, it can still be a reason for the public to distrust the results. However, it can be expected that with more attention paid to the environmental quality of the government and the public, there will be more data acquisition methods and environmental monitoring stations, and more environmental indicators can be used in the actual application. (2) The framework innovatively used pollution reduction as an aspect of environmental quality, but it is affected by the selected time period. It was reflected in the case application in Beijing. For example, the final selected time period was a four-year period. During this period, the air pollution in Beijing experienced a rise during 2014–2015 and then declined during 2015–2017, especially in the peripheral areas. Therefore, the peak value of pollution in 2015 was not reflected in the region classification. However, this error can be mitigated to a certain extent by summing up the difference value every two years. (3) The framework was designed to classify the regions by pollution data, and then find the regions which need an environmental governance policy. But the specific policies need to cooperate with demographic data or other sociological research, which may not be applicable to some complex decision-making issues. For example, the framework did not consider whether the government have enough resources and powers to mitigate the problems, or to predict how the environmental inequity situation will change in the future. However, the pressure on decision-makers can be reduced by some local improvement methods, such as changing the classification standard and the proportion of inequity districts.
6. Conclusions
The increasing attention to environmental equity motivates researchers to develop tools that help policy-makers to prioritize the allocation of policy interventions in areas of different needs. The framework presented in this study can help achieve these objectives, and it can become a tool to bridge the diagnosis of environmental inequities with decision-making processes under multiple perspectives for implementing potential solutions. This framework includes four steps: (A) variable selection, (B) data normalization, (C) ranking indicators, (D) summarizing inequity classification. It has advantages such as being easily acceptable, comprehensive, and suitable for public participation and application to other environmental problems. Furthermore, the flexibility of multiple perspectives on inequities provides adequate acceptability for researchers and decision-makers. In particular, the idea of absolute inequity and relative inequity provides different ways of value orientation to environmental quality. These characteristics make this framework a useful tool that can be adopted and used by decision-makers for classifying inequities and inequity districts for urban planners and policy-makers as a means of inequity improvement. The framework was put into use in a case application in Beijing, China, to evaluate the environmental inequity of air pollution. The results suggest that decision-makers should focus on the central urban area and some southern regions in Beijing to implement improvement policies against environmental inequity.
Supplementary Materials
The following are available online at https://www.mdpi.com/2071-1050/12/11/4757/s1, Figure S1: Distribution map of housing prices in Beijing (2017), Figure S2: Kid population proportion, older population proportion, and education level for three types of equity districts in four equity classification. Each factor means average value in three types of districts in different scenarios, Figure S3: Migrant population proportion, and population density for three types of equity districts in four equity classification. Each factor means average value in three types of districts in different scenarios, Table S1: Summary of descriptive statistics about data sets, S1: Descriptive Analysis of Case Application in Beijing.
Author Contributions
J.W. and J.Z. conceived and designed the study. J.Z. performed the experiments. J.W., J.Z. and W.Z. wrote the paper. J.W., J.Z. and W.Z. reviewed and edited the manuscript. All authors have read and agreed to the published version of the manuscript.
Funding
This study was funded by Shenzhen Science and Technology Innovation Committee (JCYJ20170412150910443).
Conflicts of Interest
The authors declare no conflict of interest.
Nomenclature
| SDGs | sustainable development goals |
| PM2.5 | fine particular matter with aerodynamic diameter ≤2.5 µm |
| OK | Ordinary Kriging (interpolation model) |
| IDW | Inverse Distance Weighted (interpolation model) |
References
- Oestreich, J.E. SDG 10: Reduce inequality in and among countries. Soc. Altern. 2018, 37, 341–344. [Google Scholar]
- Landrigan, P.J.; Rauh, V.A.; Galvez, M.P. Environmental justice and the health of children. Mt. Sinai J. Med. 2010, 178–187. [Google Scholar] [CrossRef] [PubMed]
- Schweitzer, L.; Zhou, J. Neighborhood air quality, respiratory health, and vulnerable populations in compact and sprawled regions. J. Am. Plan. Assoc. 2010, 363–371. [Google Scholar] [CrossRef]
- Ji, S.; Cherry, C.R.; Zhou, W.; Sawhney, R.; Wu, Y.; Cai, S.; Wang, S.; Marshall, J.D. Environmental justice aspects of exposure to PM2.5 emissions from electric vehicle use in China. Env. Sci. Technol. 2015, 49, 13912–13920. [Google Scholar] [CrossRef] [PubMed]
- Padilla, C.M.; Deguen, S.; Lalloue, B.; Blanchard, O.; Beaugard, C.; Troude, F.; Navier, D.Z.; Vieira, V.M. Cluster analysis of social and environment inequalities of infant mortality. A spatial study in small areas revealed by local disease mapping in France. Sci. Total Env. 2013, 433–441, 454–455. [Google Scholar] [CrossRef] [PubMed] [Green Version]
- Ouyang, W.; Gao, B.; Cheng, H.; Hao, Z.; Wu, N. Exposure inequality assessment for PM2.5 and the potential association with environmental health in Beijing. Sci. Total Env. 2018, 635, 769–778. [Google Scholar] [CrossRef] [PubMed]
- Fecht, D.; Fischer, P.; Fortunato, L.; Hoek, G.; de Hoogh, K.; Marra, M.; Kruize, H.; Vienneau, D.; Beelen, R.; Hansell, A. Associations between air pollution and socioeconomic characteristics, ethnicity and age profile of neighborhoods in England and the Netherlands. Env. Pollut. 2015, 198, 201–210. [Google Scholar] [CrossRef] [PubMed]
- Fernández, I.C.; Wu, J. A GIS-based framework to identify priority areas for urban environmental inequity mitigation and its application in Santiago de Chile. Appl. Geogr. 2018, 94, 213–222. [Google Scholar] [CrossRef]
- Jenerette, G.D.; Harlan, S.L.; Buyantuev, A.; Stefanov, W.L.; Declet-Barreto, J.; Ruddell, B.L.; Myint, S.W.; Kaplan, S.; Li, X. Micro-scale urban surface temperatures are related to land-cover features and residential heat related health impacts in Phoenix, AZ USA. Landsc. Ecol. 2016, 31, 745–760. [Google Scholar] [CrossRef]
- Tessum, C.V.; Apte, J.S.; Goodkind, A.L.; Muller, N.Z.; Mullins, K.A.; Paolella, D.A.; Polasky, S.; Springer, N.P.; Thakrar, S.K.; Marshall, J.D.; et al. Inequity in consumption of goods and services adds to racial–ethnic disparities in air pollution exposure. PNAS 2019, 116, 6001–6006. [Google Scholar] [CrossRef] [PubMed] [Green Version]
- Kawachi, I.; Subramanian, S.V.; Almeida-Filho, N. A glossary for health inequalities. J. Epidemiol. Commun. Health 2002, 56, 647–652. [Google Scholar] [CrossRef] [PubMed]
- Pope, R.; Wu, J.; Boone, C. Spatial patterns of air pollutants and social groups: A distributive environmental justice study in the phoenix metropolitan region of USA. Env. Manag. 2016, 58, 753–766. [Google Scholar] [CrossRef] [PubMed]
- Jiang, L.; Bai, L. Spatio-temporal characteristics of urban air pollutions and their causal relationships: Evidence from Beijing and its neighboring cities. Sci. Rep. 2018, 8. [Google Scholar] [CrossRef] [PubMed] [Green Version]
- Van Kamp, I.; Leidelmeijera, K.; Marsmana, G.; de Hollander, A. Urban environmental quality and human well-being: Towards a conceptual framework and demarcation of concepts; a literature study. Landsc. Urban Plan. 2003, 65, 5–18. [Google Scholar] [CrossRef]
- Alicandro, G.; Sebasiani, G.; Bertuccio, B.; Zengarini, N.; Costa, G.; la Vecchia, C.; Frova, L. The main causes of death contributing to absolute and relative socio-economic inequality in Italy. Public Health 2018, 164, 39–48. [Google Scholar] [CrossRef] [PubMed]
- Chu, Y.; Liu, Y.; Lu, Y.; Yu, L. Propensity to migrate and willingness to pay related to Air pollution among different populations in Wuhan, China. Aerosol Air Qual. Res. 2017, 17, 752–760. [Google Scholar] [CrossRef] [Green Version]
- Chen, S.; Jin, H. Pricing for the clean air: Evidence from Chinese housing market. J. Clean. Prod. 2019, 206, 297–306. [Google Scholar] [CrossRef]
- Chatwin-Davies, R. Clearing the Air: The Impacts of Ambient Air Pollution on Environmental. Master’s Thesis, Carleton University, Ottawa, ON, Canada, 2018. [Google Scholar]
- Su, J.G.; Morello-Frosch, R.; Jesdale, B.M.; Kyle, A.D.; Shamasunder, B.; Jerrett, M. An index for assessing demographic inequalities in cumulative environmental hazards with application to los angeles, california. Env. Sci. Technol. 2009, 43, 7626–7634. [Google Scholar] [CrossRef] [PubMed] [Green Version]
- Liu, J.; Li, W.; Wu, J. A framework for delineating the regional boundaries of PM2 5 pollution: A case study of China. Env. Pollut. 2018, 235, 642–651. [Google Scholar] [CrossRef] [PubMed]
- De Toro, P.; Nocca, F.; Renna, A.; Sepe, L. Real estate market dynamics in the city of naples: An integration of a multi-criteria decision analysis and geographical information system. Sustainability 2020, 12, 1211. [Google Scholar] [CrossRef] [Green Version]
- Zhao, H.; Geng, G.; Zhang, Q.; Davis, S.J.; Li, X.; Liu, Y.; Peng, L.; Li, M.; Zheng, B.; Huo, H. Inequality of household consumption and air pollution-related deaths in China. Nat. Commun. 2019, 10, 43367. [Google Scholar] [CrossRef] [PubMed] [Green Version]
- Liang, H.; Dong, L.; Luo, X.; Ren, J.; Zhang, N.; Gao, Z.; Dou, Y. Balancing regional industrial development: Analysis on regional disparity of China’s industrial emissions and policy implications. J. Clean Prod. 2016, 126, 223–235. [Google Scholar] [CrossRef]
- Zheng, S.; Fu, Y.; Liu, H. Housing-choice hindrances and urban spatial structure: Evidence from matched location and location-preference data in Chinese cities. J. Urban Econ. 2006, 60, 535–557. [Google Scholar] [CrossRef]
- Zheng, S.; Kahn, M.E. Land and residential property markets in a booming economy: New evidence from Beijing. J. Urban Econ. 2008, 63, 743–757. [Google Scholar] [CrossRef]
- Gautam, S.; Patra, A.K.; Kumar, P. Status and chemical characteristics of ambient PM2.5 pollutions in China: A. review. Env. Dev. Sustain. 2019, 21, 1649–1674. [Google Scholar] [CrossRef]
- Gautam, S.; Yadav, A.; Tsai, C.J.; Kumar, P.A. A review on recent progress in observations, sources, classification and regulations of PM2.5 in Asian environments. Env. Sci. Pollut. Res. 2016, 23, 21165–21175. [Google Scholar] [CrossRef] [PubMed]
- Hao, Y.; Liu, Y. The influential factors of urban PM2.5 concentrations in China: A spatial econometric analysis. J. Clean. Prod. 2016, 112, 1443–1453. [Google Scholar] [CrossRef]
- Cutter, S.L.; Boruff, B.J.; Shirley, W.L. Social Vulnerability to Environmental. Soc. Sci. Q. 2003, 2. [Google Scholar] [CrossRef]
- Boulanger, G.; Bayeux, T.; Mandin, C.; Kirchner, S.; Vergriette, B.; Pernelet-Joly, V.; Kopp, P. Socio-economic costs of indoor air pollution: A tentative estimation for some pollutants of health interest in France. Environ. Int. 2017, 104, 14–24. [Google Scholar] [CrossRef] [PubMed]
- Liu, M.; Huang, Y.; Jin, Z.; Ma, Z.; Liu, X.; Zhang, B.; Liu, Y.; Yu, Y.; Wang, J.; Bi, J. The nexus between urbanization and PM2.5 related mortality in China. Environ. Pollut. 2017, 227, 15–23. [Google Scholar] [CrossRef]
- Zanobetti, A.; Schwartz, J. The effect of fine and coarse particulate air pollution on mortality: A national analysis. Environ. Health Perspect. 2009, 117, 898–903. [Google Scholar] [CrossRef] [PubMed] [Green Version]
- Honda, T.; Pun, V.C.; Manjourides, J.; Suh, H. Anemia prevalence and hemoglobin levels are associated with long-term exposure to air pollution in an older population. Environ. Int. 2017, 101, 125–132. [Google Scholar] [CrossRef] [PubMed]
- Kan, H.; London, S.J.; Chen, G.; Zhang, Y.; Song, G.; Zhao, N.; Jiang, L.; Chen, B. Season, sex, age, and education as modifiers of the effects of outdoor air pollution on daily mortality in Shanghai, China: The public health and air pollution in Asia (PAPA) study. Environ. Health Perspect. 2008, 116, 1183–1188. [Google Scholar] [CrossRef] [PubMed]
- Rosofsky, A.; Levy, J.I.; Zanobetti, A.; Janulewicz, P.; Fabian, M.P. Temporal trends in air pollution exposure inequality in Massachusetts. Environ. Res. 2018, 161, 76–86. [Google Scholar] [CrossRef] [PubMed]
- Li, V.O.; Han, Y.; Lam, J.C.; Zhu, Y.; Bacon-Shone, J. Air pollution and environmental injustice: Are the socially deprived exposed to more PM2.5 pollution in Hong Kong? Environ. Sci. Policy 2018, 80, 53–61. [Google Scholar] [CrossRef]
- Xu, Y.; Jiang, S.; Li, R.; Zhang, J.; Zhao, J.; Abbar, S.; Gonzales, M.C. Unraveling environmental justice in ambient PM2.5 exposure in Beijing: A big data approach. Comput. Environ. Urban Syst. 2019, 75, 12–21. [Google Scholar] [CrossRef]
- Zhang, Y.; Lang, J.; Cheng, S.; Li, S.; Zhou, Y.; Chen, D.; Zhang, H.; Wang, H. Chemical composition and sources of PM1 and PM2.5 in Beijing in autumn. Sci. Total Environ. 2018, 630, 72–82. [Google Scholar] [CrossRef] [PubMed]
- Wu, J.; Li, J.; Peng, J.; Li, W.; Xu, G.; Dong, C. Applying land use regression model to estimate spatial variation of PM2.5 in Beijing, China. Environ. Sci. Pollut. Res. 2015, 22, 7045–7061. [Google Scholar] [CrossRef] [PubMed]
- Kong, L.; Xin, J.; Liu, Z.; Zhang, K.; Tang, G.; Zhang, W.; Wang, Y. The PM2.5 threshold for aerosol extinction in the Beijing megacity. Atmos. Environ. 2017, 167, 458–465. [Google Scholar] [CrossRef]
- Yin, H.; Pizzol, M.; Xu, L. External costs of PM2.5 pollution in Beijing, China: Uncertainty analysis of multiple health impacts and costs. Environ. Pollut. 2017, 226, 356–369. [Google Scholar] [CrossRef]
- Bayraktar, H.; Turalioglu, F.S. A kriging-based approach for locating a sampling site—In the assessment of air quality. Stoch. Environ. Res. Risk Assess. 2005, 19, 301–305. [Google Scholar] [CrossRef]
- Wu, J.; Gyourko, J.; Deng, Y. Evaluating the risk of Chinese housing markets: What we know and what we need to know. China Econ. Rev. 2016, 39, 91–114. [Google Scholar] [CrossRef] [Green Version]
- Wu, J.; Gyourko, J.; Deng, Y. Evaluating conditions in major Chinese housing markets. Reg. Sci. Urban Econ. 2012, 42, 531–543. [Google Scholar] [CrossRef] [Green Version]
- Villar, J.G.; Raya, J.M. Use of a Gini index to examine housing price heterogeneity: A quantile approach. J. Hous. Econ. 2015, 29, 59–71. [Google Scholar] [CrossRef]
- Wu, Y.; Chen, C.; Du, Y.; Chen, Z.; Li, Y. Investigation of Indoor and Outdoor PM2.5 Pollution Situation in Beijing. Procedia Eng. 2017, 205, 1223–1229. [Google Scholar] [CrossRef]
- Bell, M.L.; Ebisu, K. Environmental inequality in exposures to airborne particulate matter components in the United States. Environ. Health Perspect. 2012, 120, 1699–1704. [Google Scholar] [CrossRef] [PubMed]
- Carrier, M.; Apparicio, P.; Séguin, A. Road traffic noise in Montreal and environmental equity: What is the situation for the most vulnerable population groups? J. Transp. Geogr. 2016, 51, 1–8. [Google Scholar] [CrossRef]
- Shen, Y.; Sun, F.; Che, Y. Public green spaces and human wellbeing: Mapping the spatial inequity and mismatching status of public green space in the central city of Shanghai. Urban For. Urban Green. 2017, 27, 59–68. [Google Scholar] [CrossRef]
- Azócar, G.; Romero, H.; Sanhueza, R.; Vega, C.; Aguayo, M.; Munoz, M.D. Urbanization patterns and their impacts on social restructuring of urban space in Chilean mid-cities: The case of Los Angeles, Central Chile. Land Use Policy 2007, 24, 199–211. [Google Scholar] [CrossRef]
- Barceló, M.A.; Saez, M.; Saurina, C. Spatial variability in mortality inequalities, socioeconomic deprivation, and air pollution in small areas of the Barcelona Metropolitan Region, Spain. Sci. Total Environ. 2009, 407, 5501–5523. [Google Scholar] [CrossRef] [PubMed]
- Fan, X.; Lam, K.; Yu, Q. Differential exposure of the urban population to vehicular air pollution in Hong Kong. Sci. Total Environ. 2012, 426, 211–219. [Google Scholar] [CrossRef] [PubMed]
- Moreno-Jiménez, A.; Cañada-Torrecilla, R.; Vidal-Dominguez, M.J.; Palacios-Garcia, A.; Martinez-Suarez, P. Assessing environmental justice through potential exposure to air pollution: A socio-spatial analysis in Madrid and Barcelona, Spain. Geoforum 2016, 69, 117–131. [Google Scholar] [CrossRef]
- Storper, M. Governing the large metropolis. Territ. Politics Gov. 2014, 2, 115–134. [Google Scholar] [CrossRef]
- McCall, M.K.; Dunn, C.E. Geo-information tools for participatory spatial planning: Fulfilling the criteria for ‘good’ governance? Geoforum 2012, 43, 81–94. [Google Scholar] [CrossRef]
- Kropp, W.W.; Lein, J.K. Assessing the geographic expression of urban sustainability: A scenario based approach incorporating spatial multicriteria decision analysis. Sustainability 2012, 4, 2348–2365. [Google Scholar] [CrossRef] [Green Version]
- Vieira, B.O.; Guarnieri, P.; Camara e Silva, L.; Alfinito, S. Prioritizing barriers to be solved to the implementation of reverse logistics of e-waste in brazil under a multicriteria decision aid approach. Sustainability 2020, 12, 4337. [Google Scholar] [CrossRef]
Figure 1.
The framework for classifying environmental inequities in absolute and relative terms. The four steps involved are denoted by the letters A, B, C, D.
Figure 1.
The framework for classifying environmental inequities in absolute and relative terms. The four steps involved are denoted by the letters A, B, C, D.
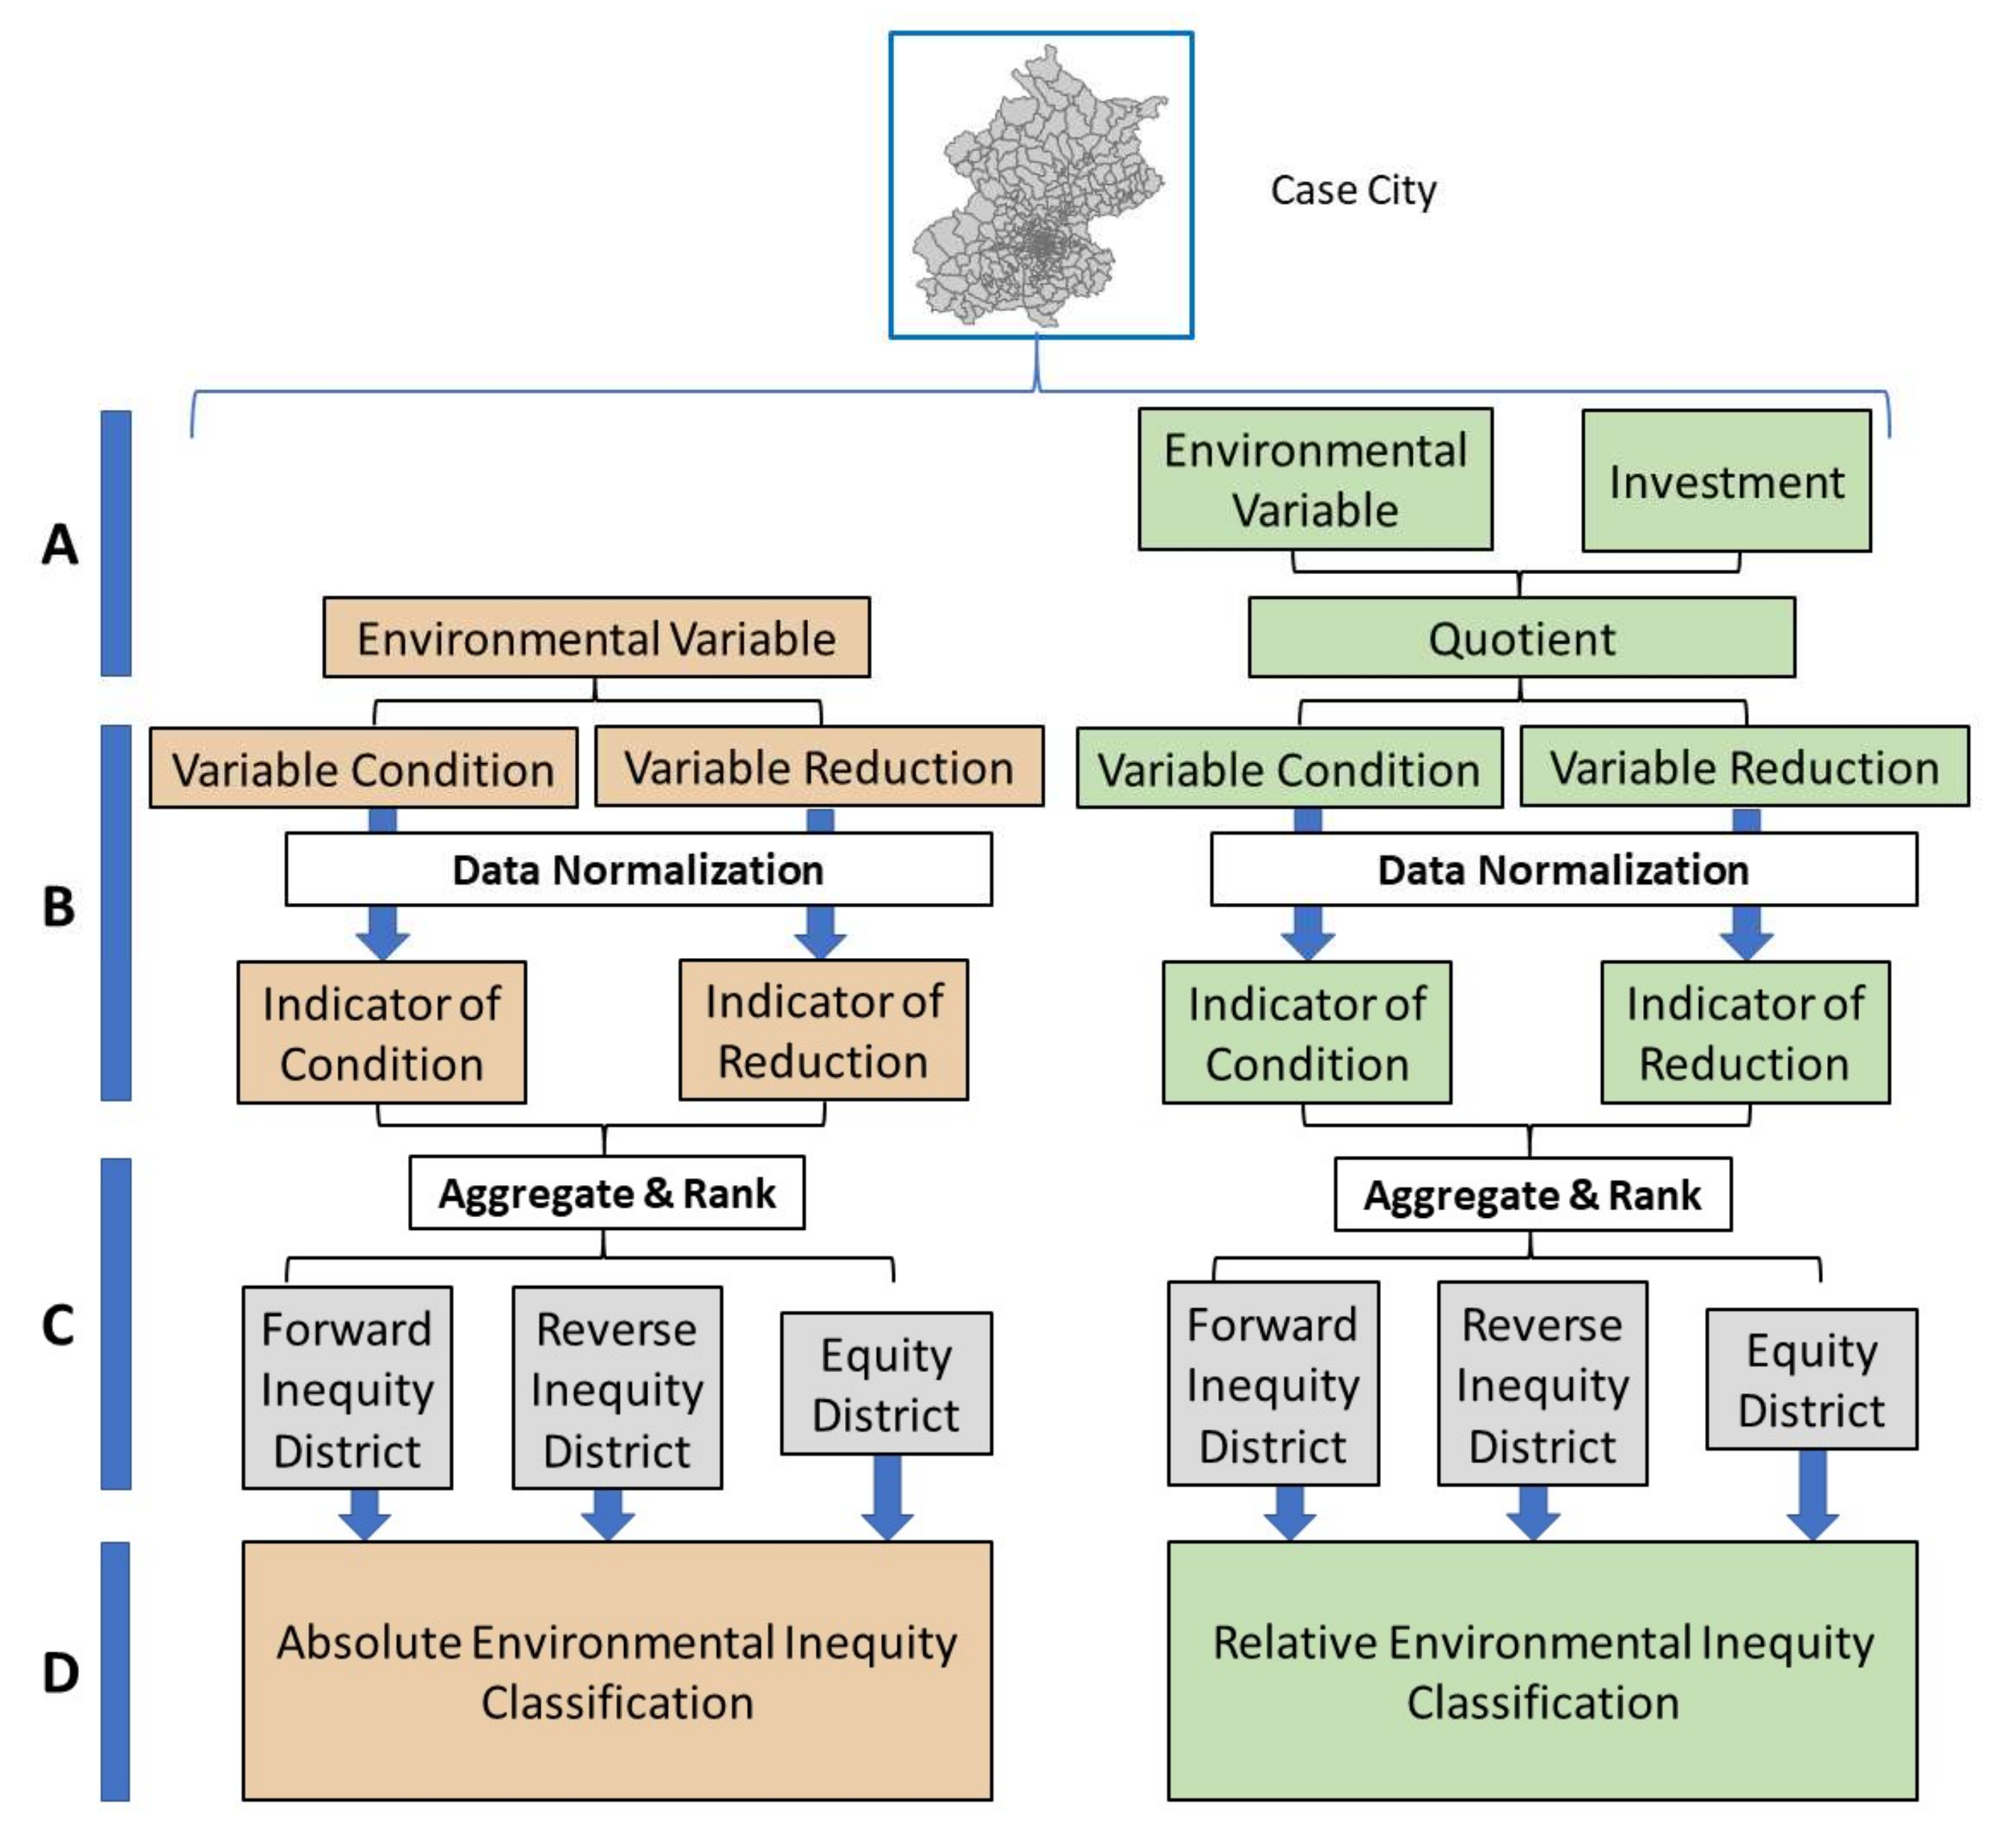
Figure 2.
The schematic diagram of the Gini coefficient and the applied method in this research. (A) The quotient value of the shaded area and the triangle area illustrates the Gini coefficient. (B) The integral sum values of all the points on the two curves are used to compute the quotient value as Gini coefficient to judge inequity in the whole city.
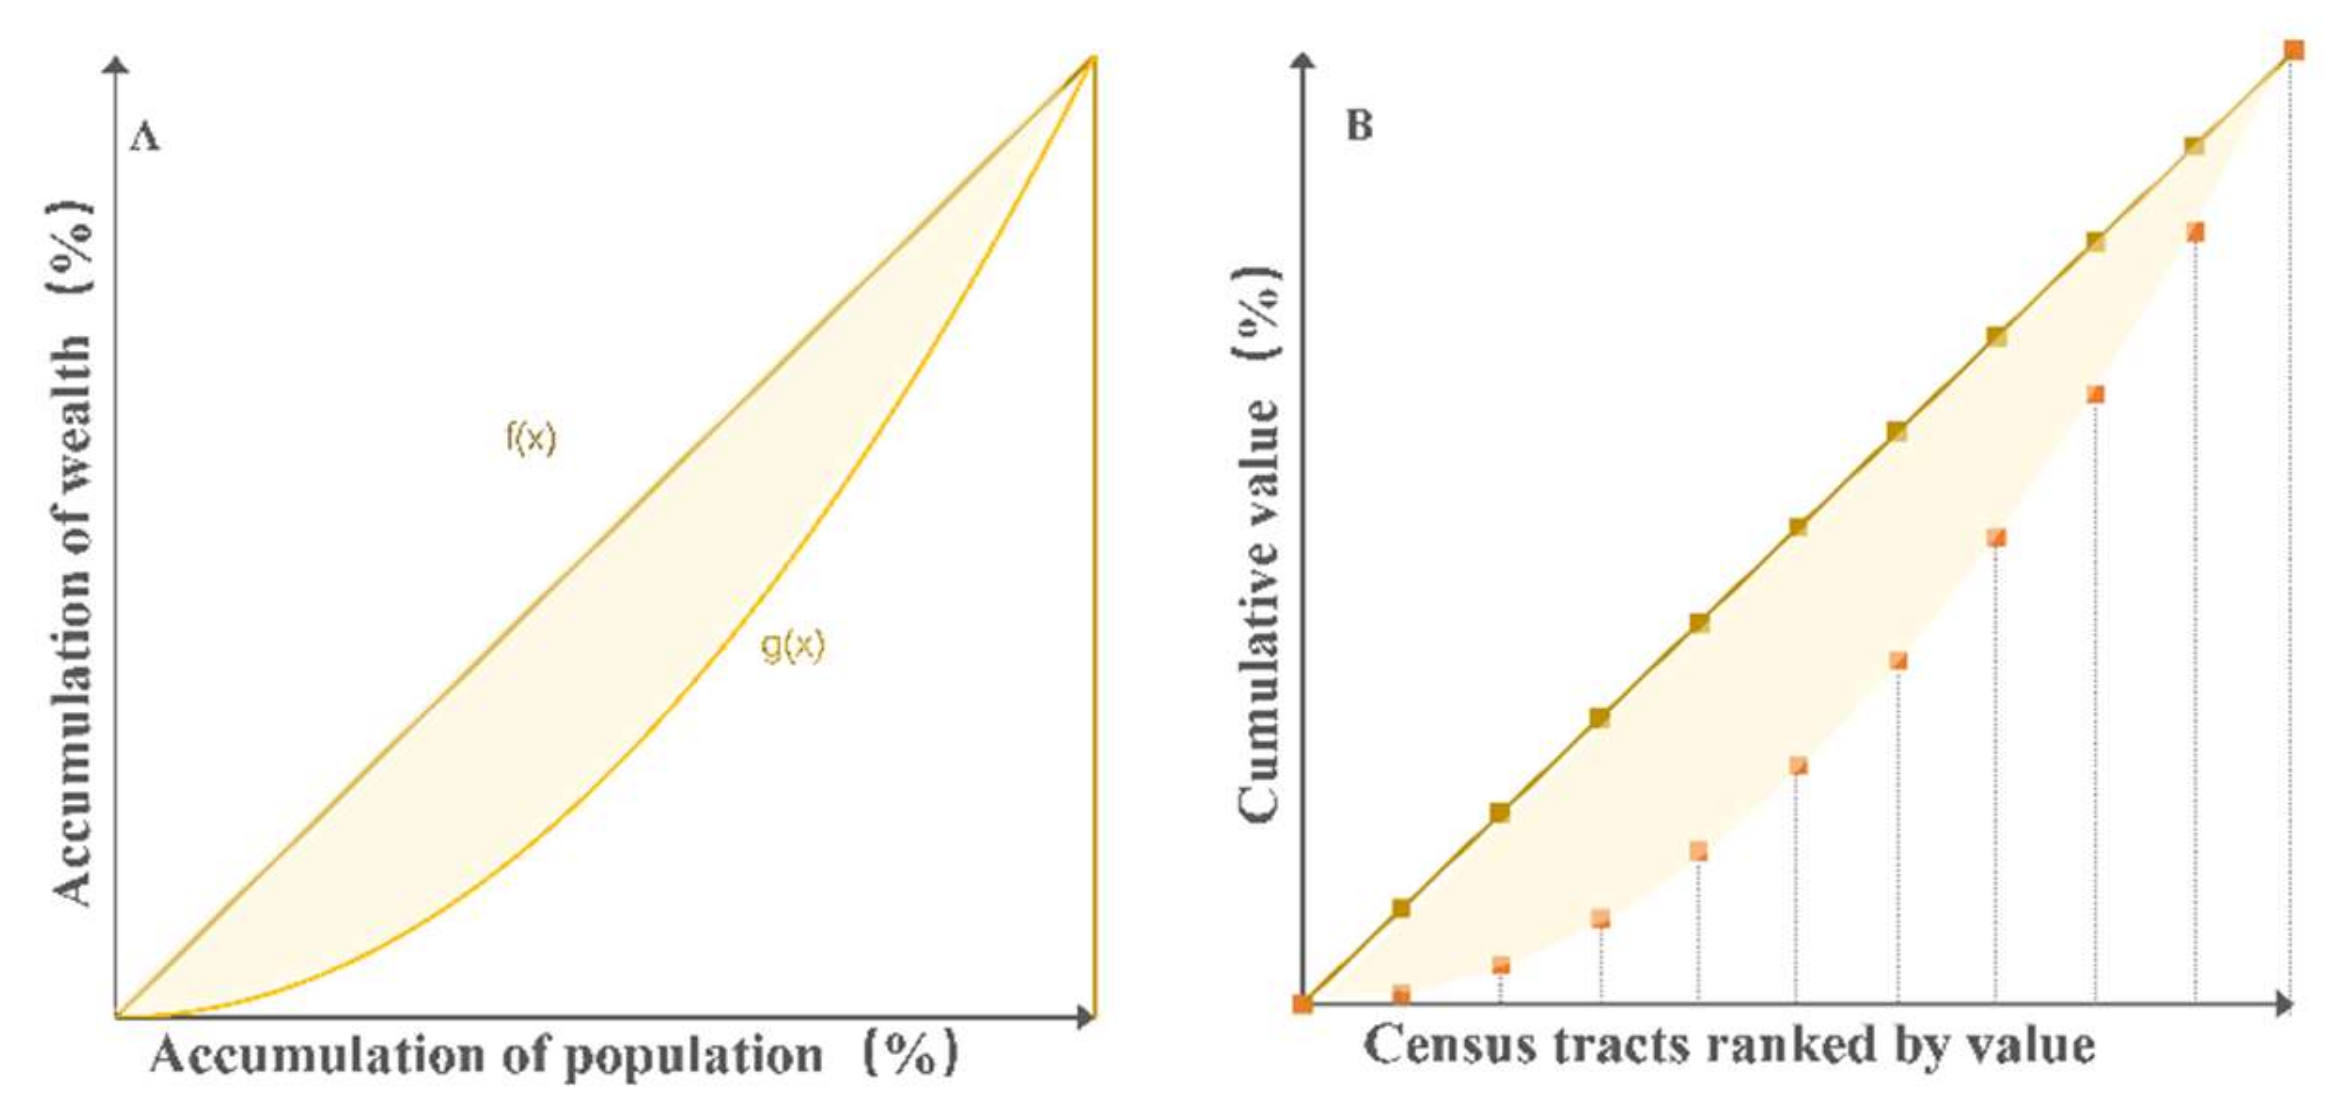
Figure 3.
The annual PM2.5 condition of 257 census tracts between 2014 and 2017 in Beijing.
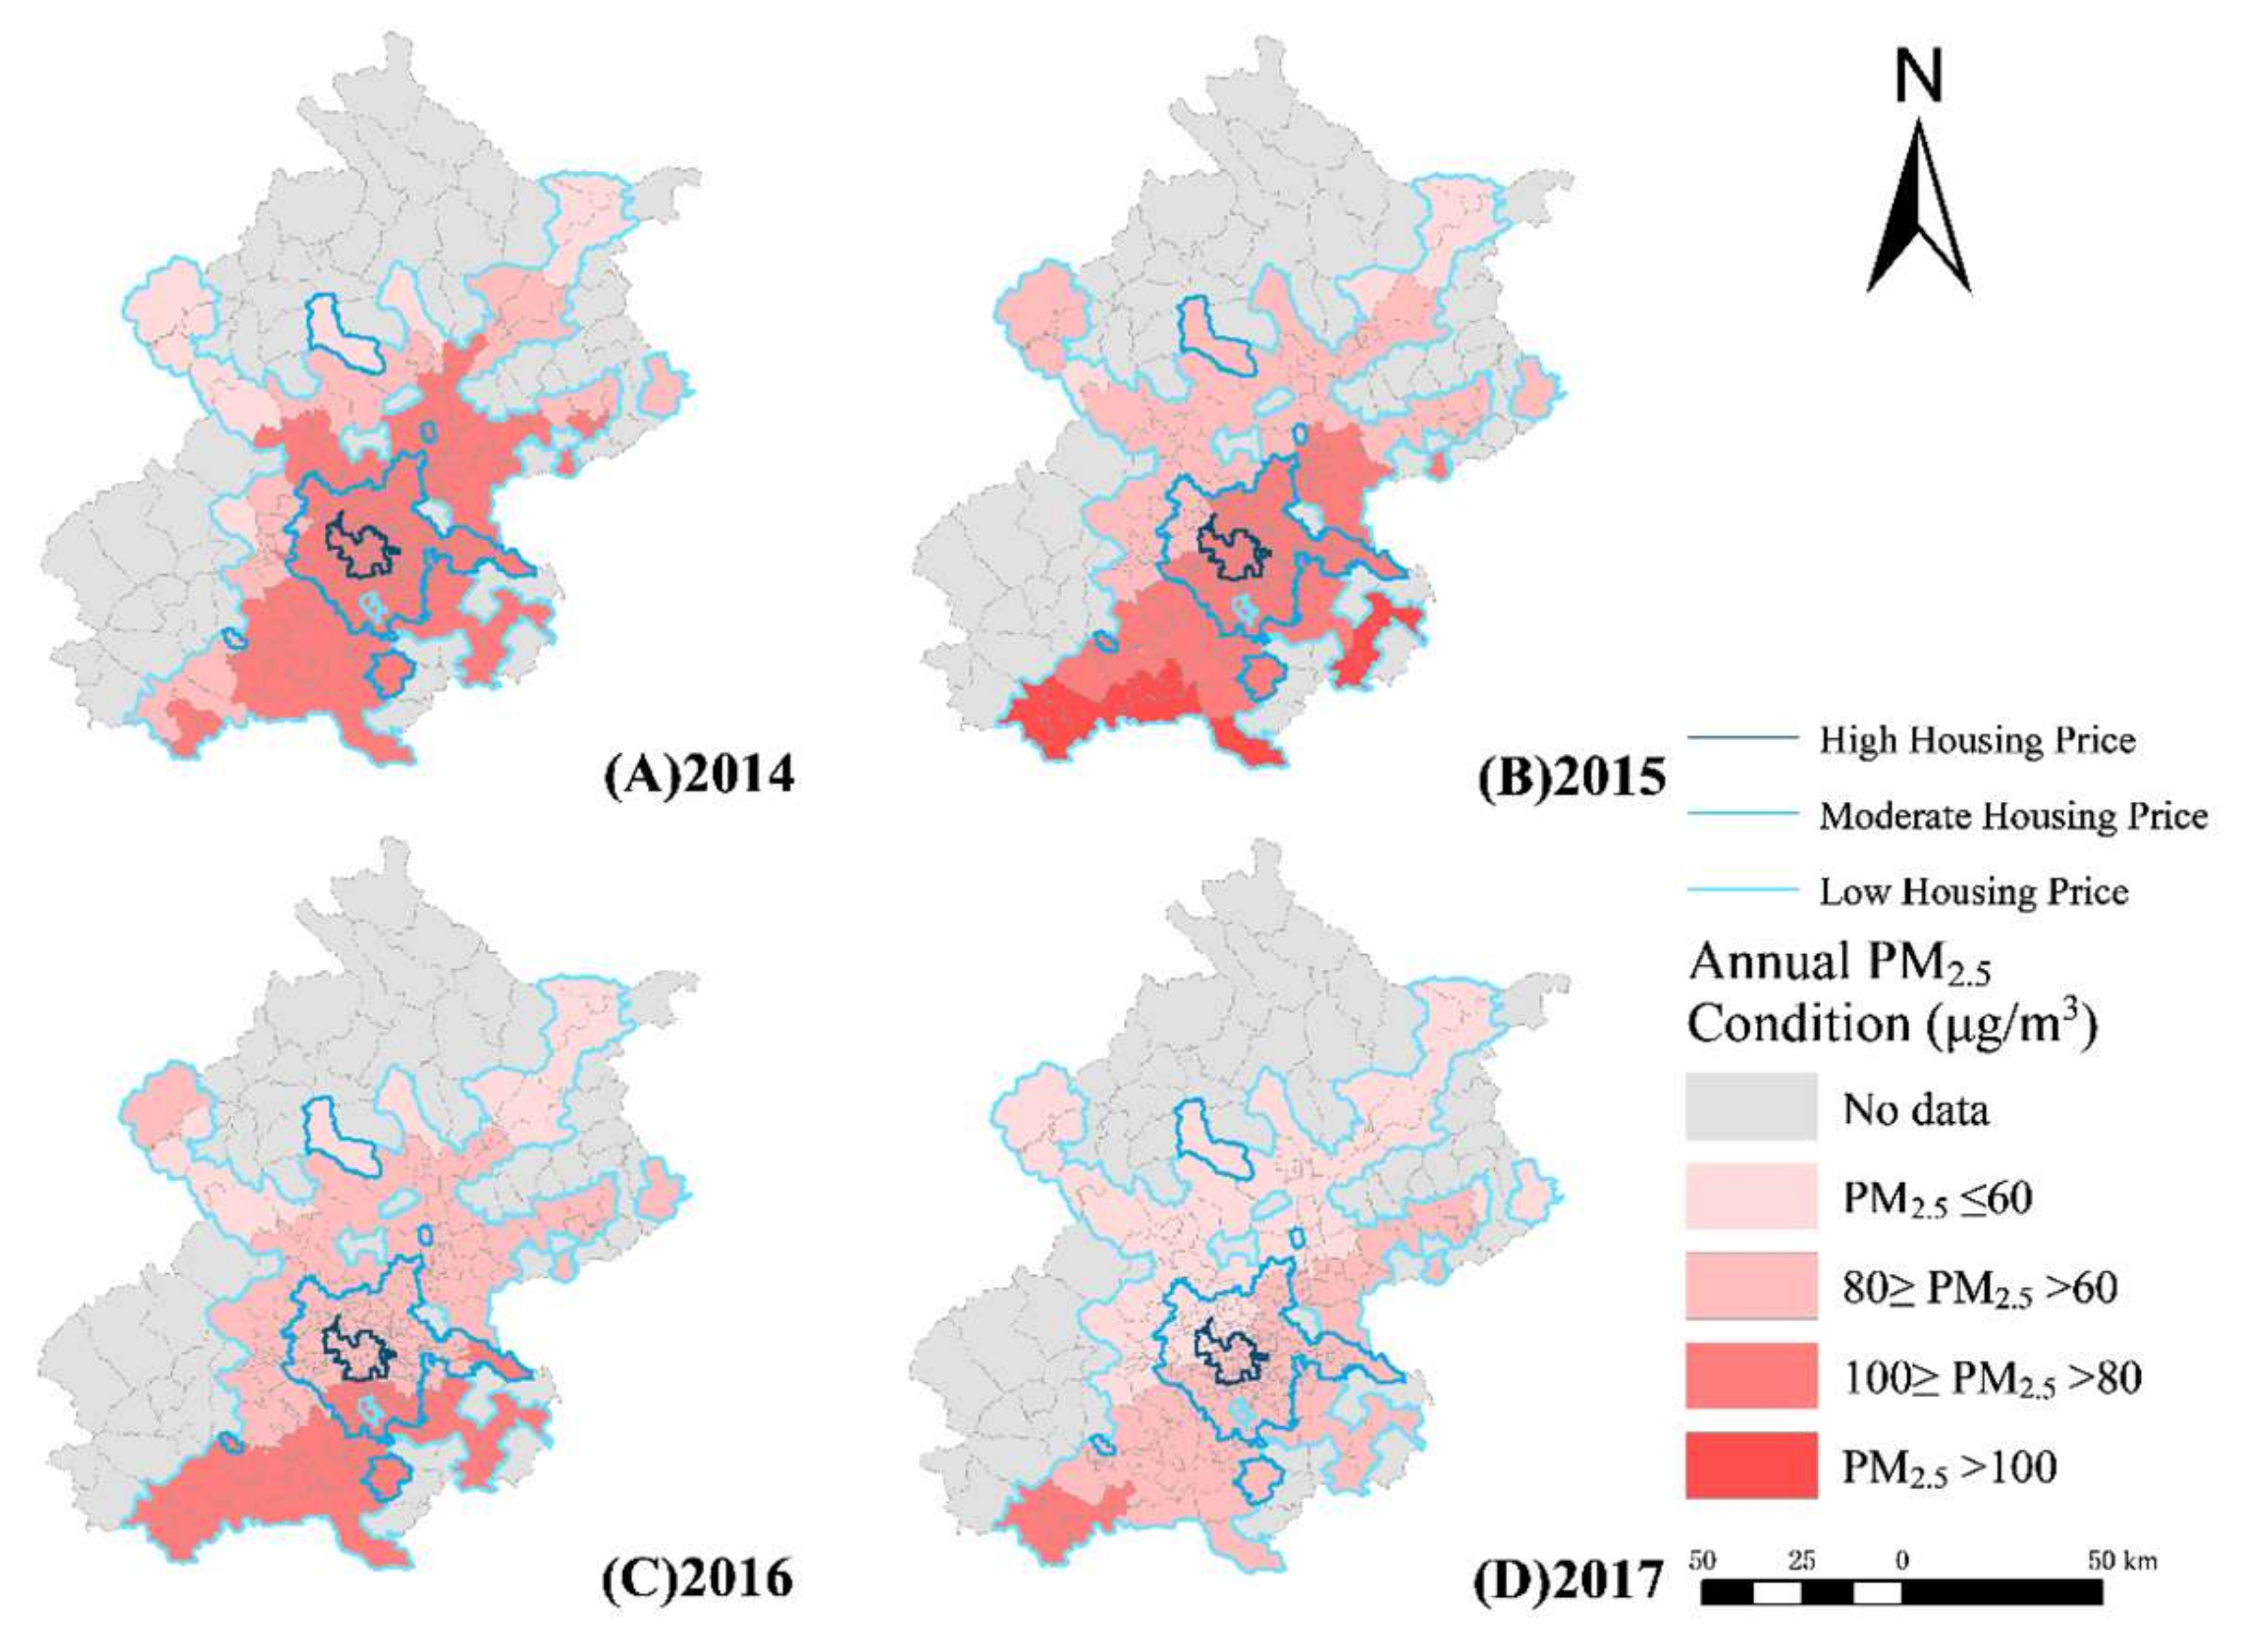
Figure 4.
The annual PM2.5 reduction of 257 census tracts between 2014 and 2017 in Beijing.
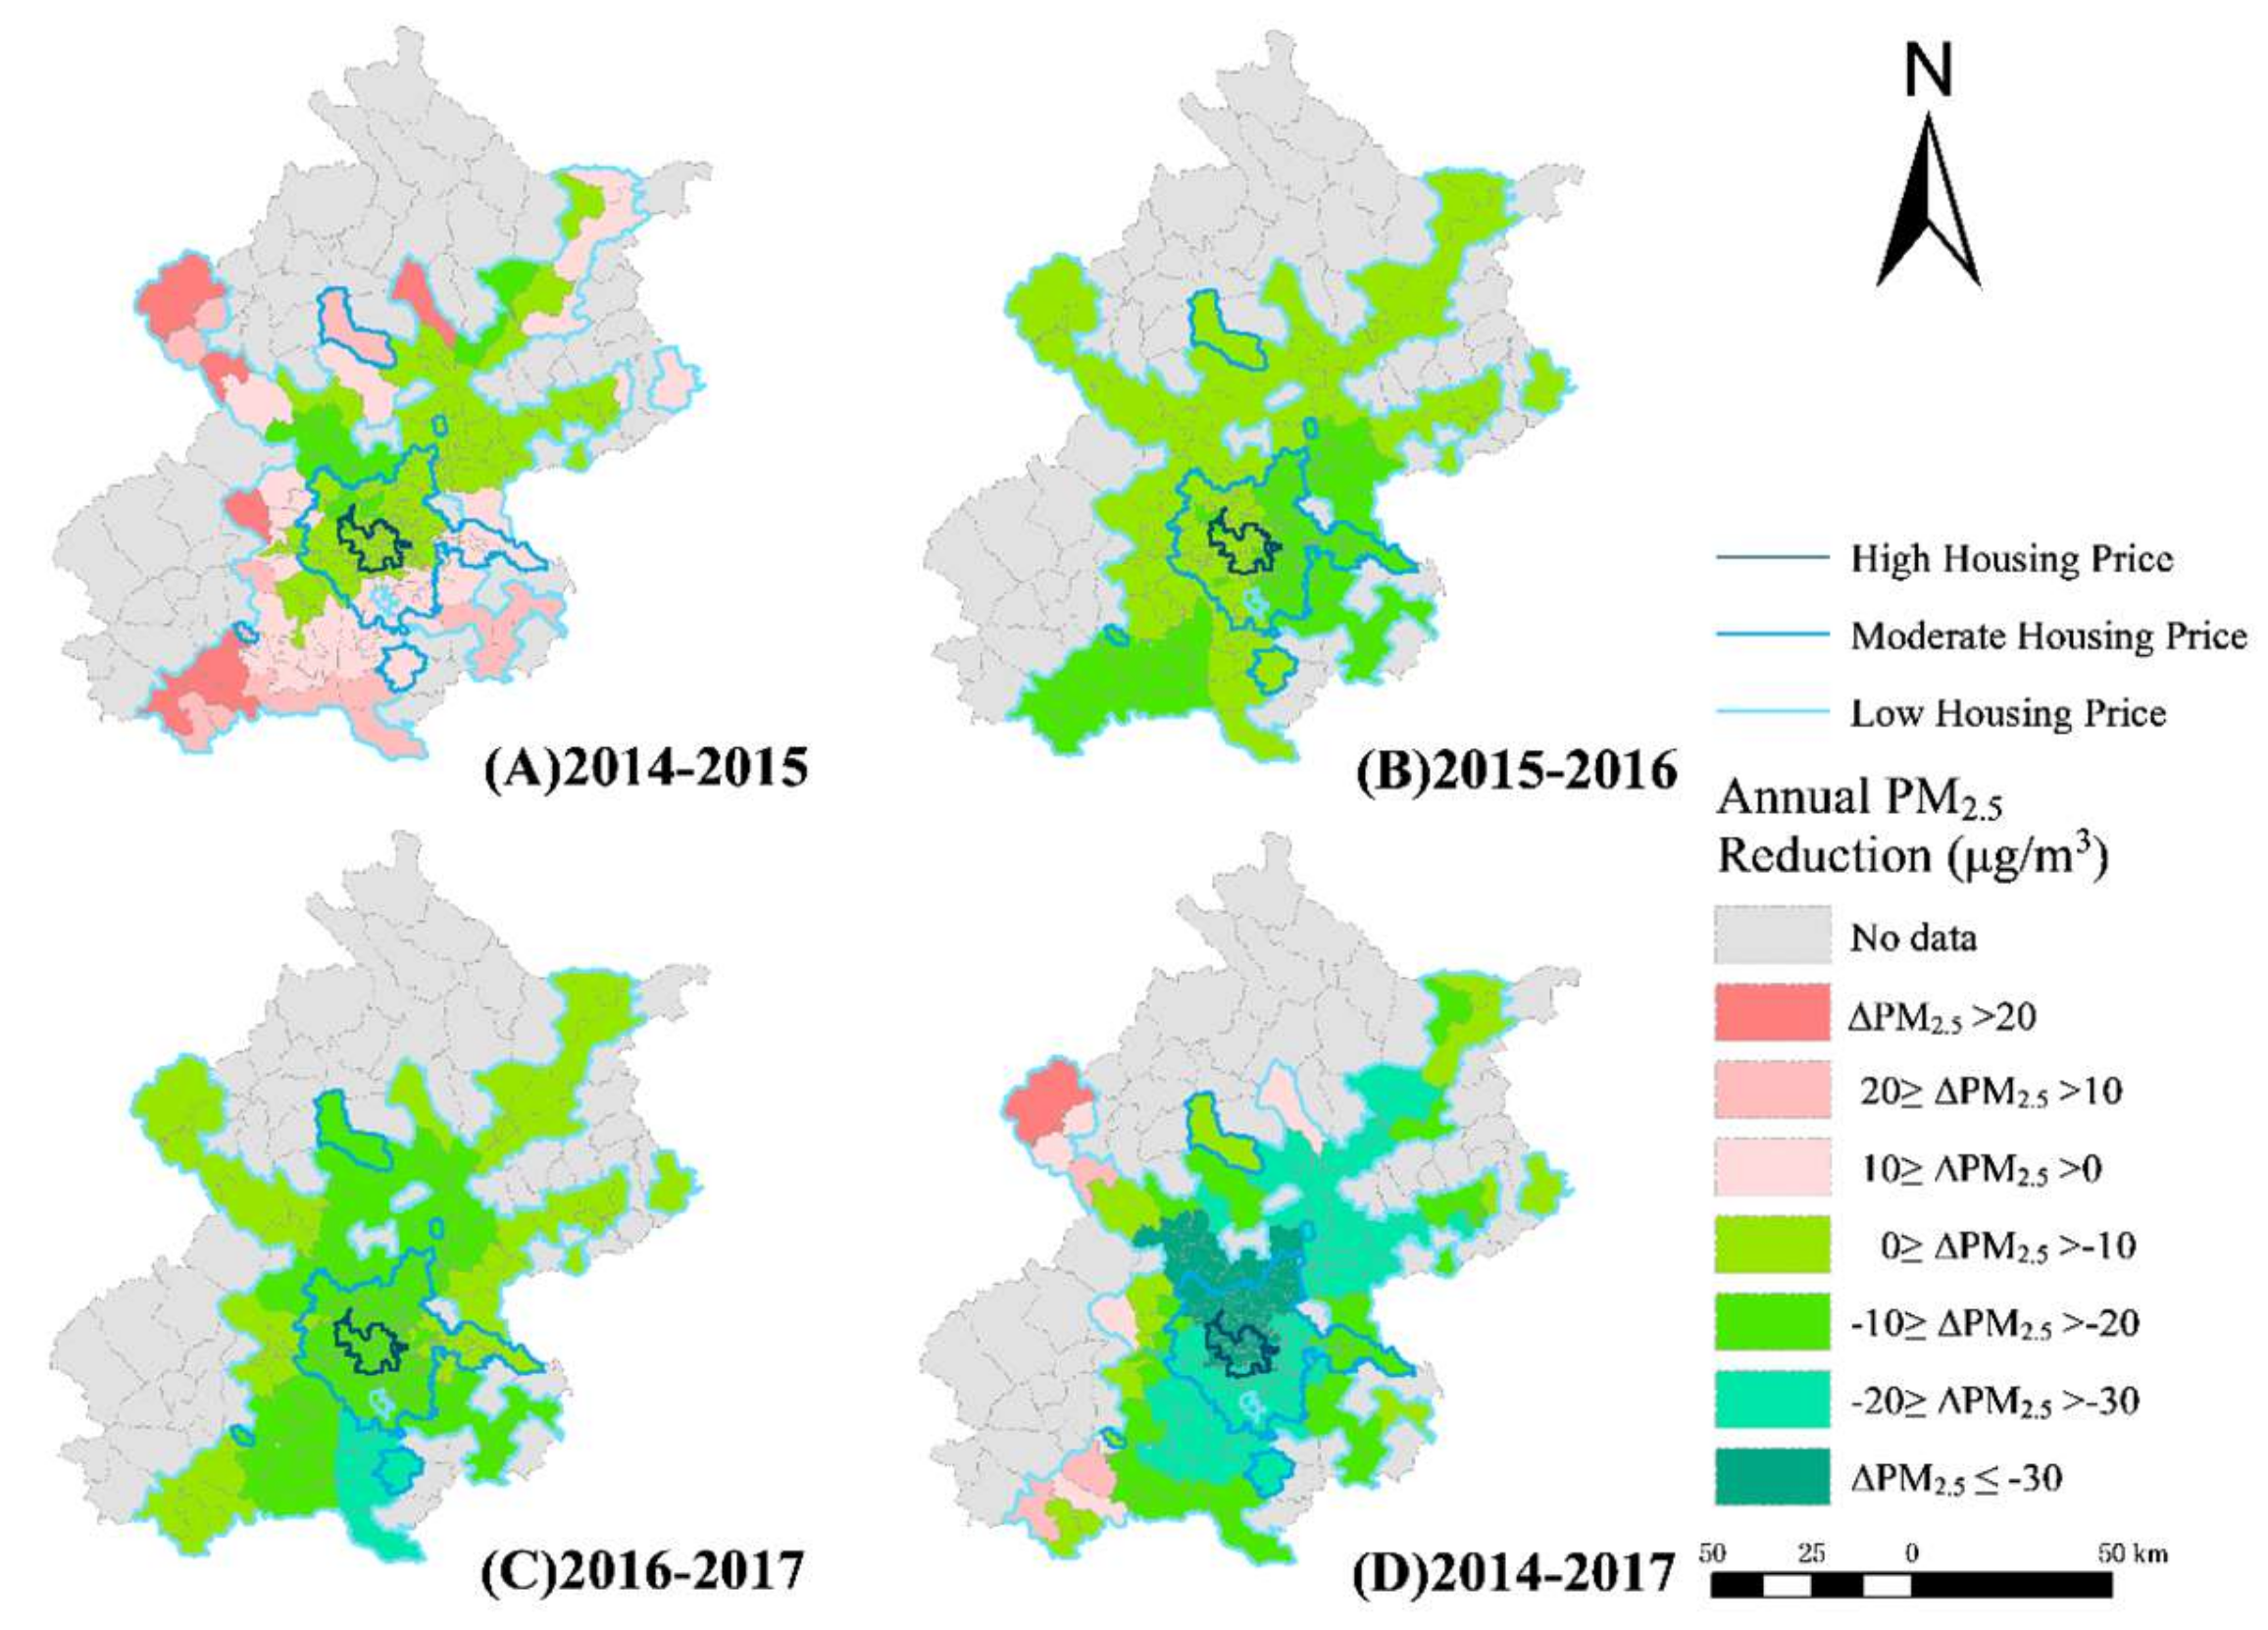
Figure 5.
The highest one-day PM2.5 condition of 257 census tracts between 2014 and 2017 in Beijing.
Figure 5.
The highest one-day PM2.5 condition of 257 census tracts between 2014 and 2017 in Beijing.
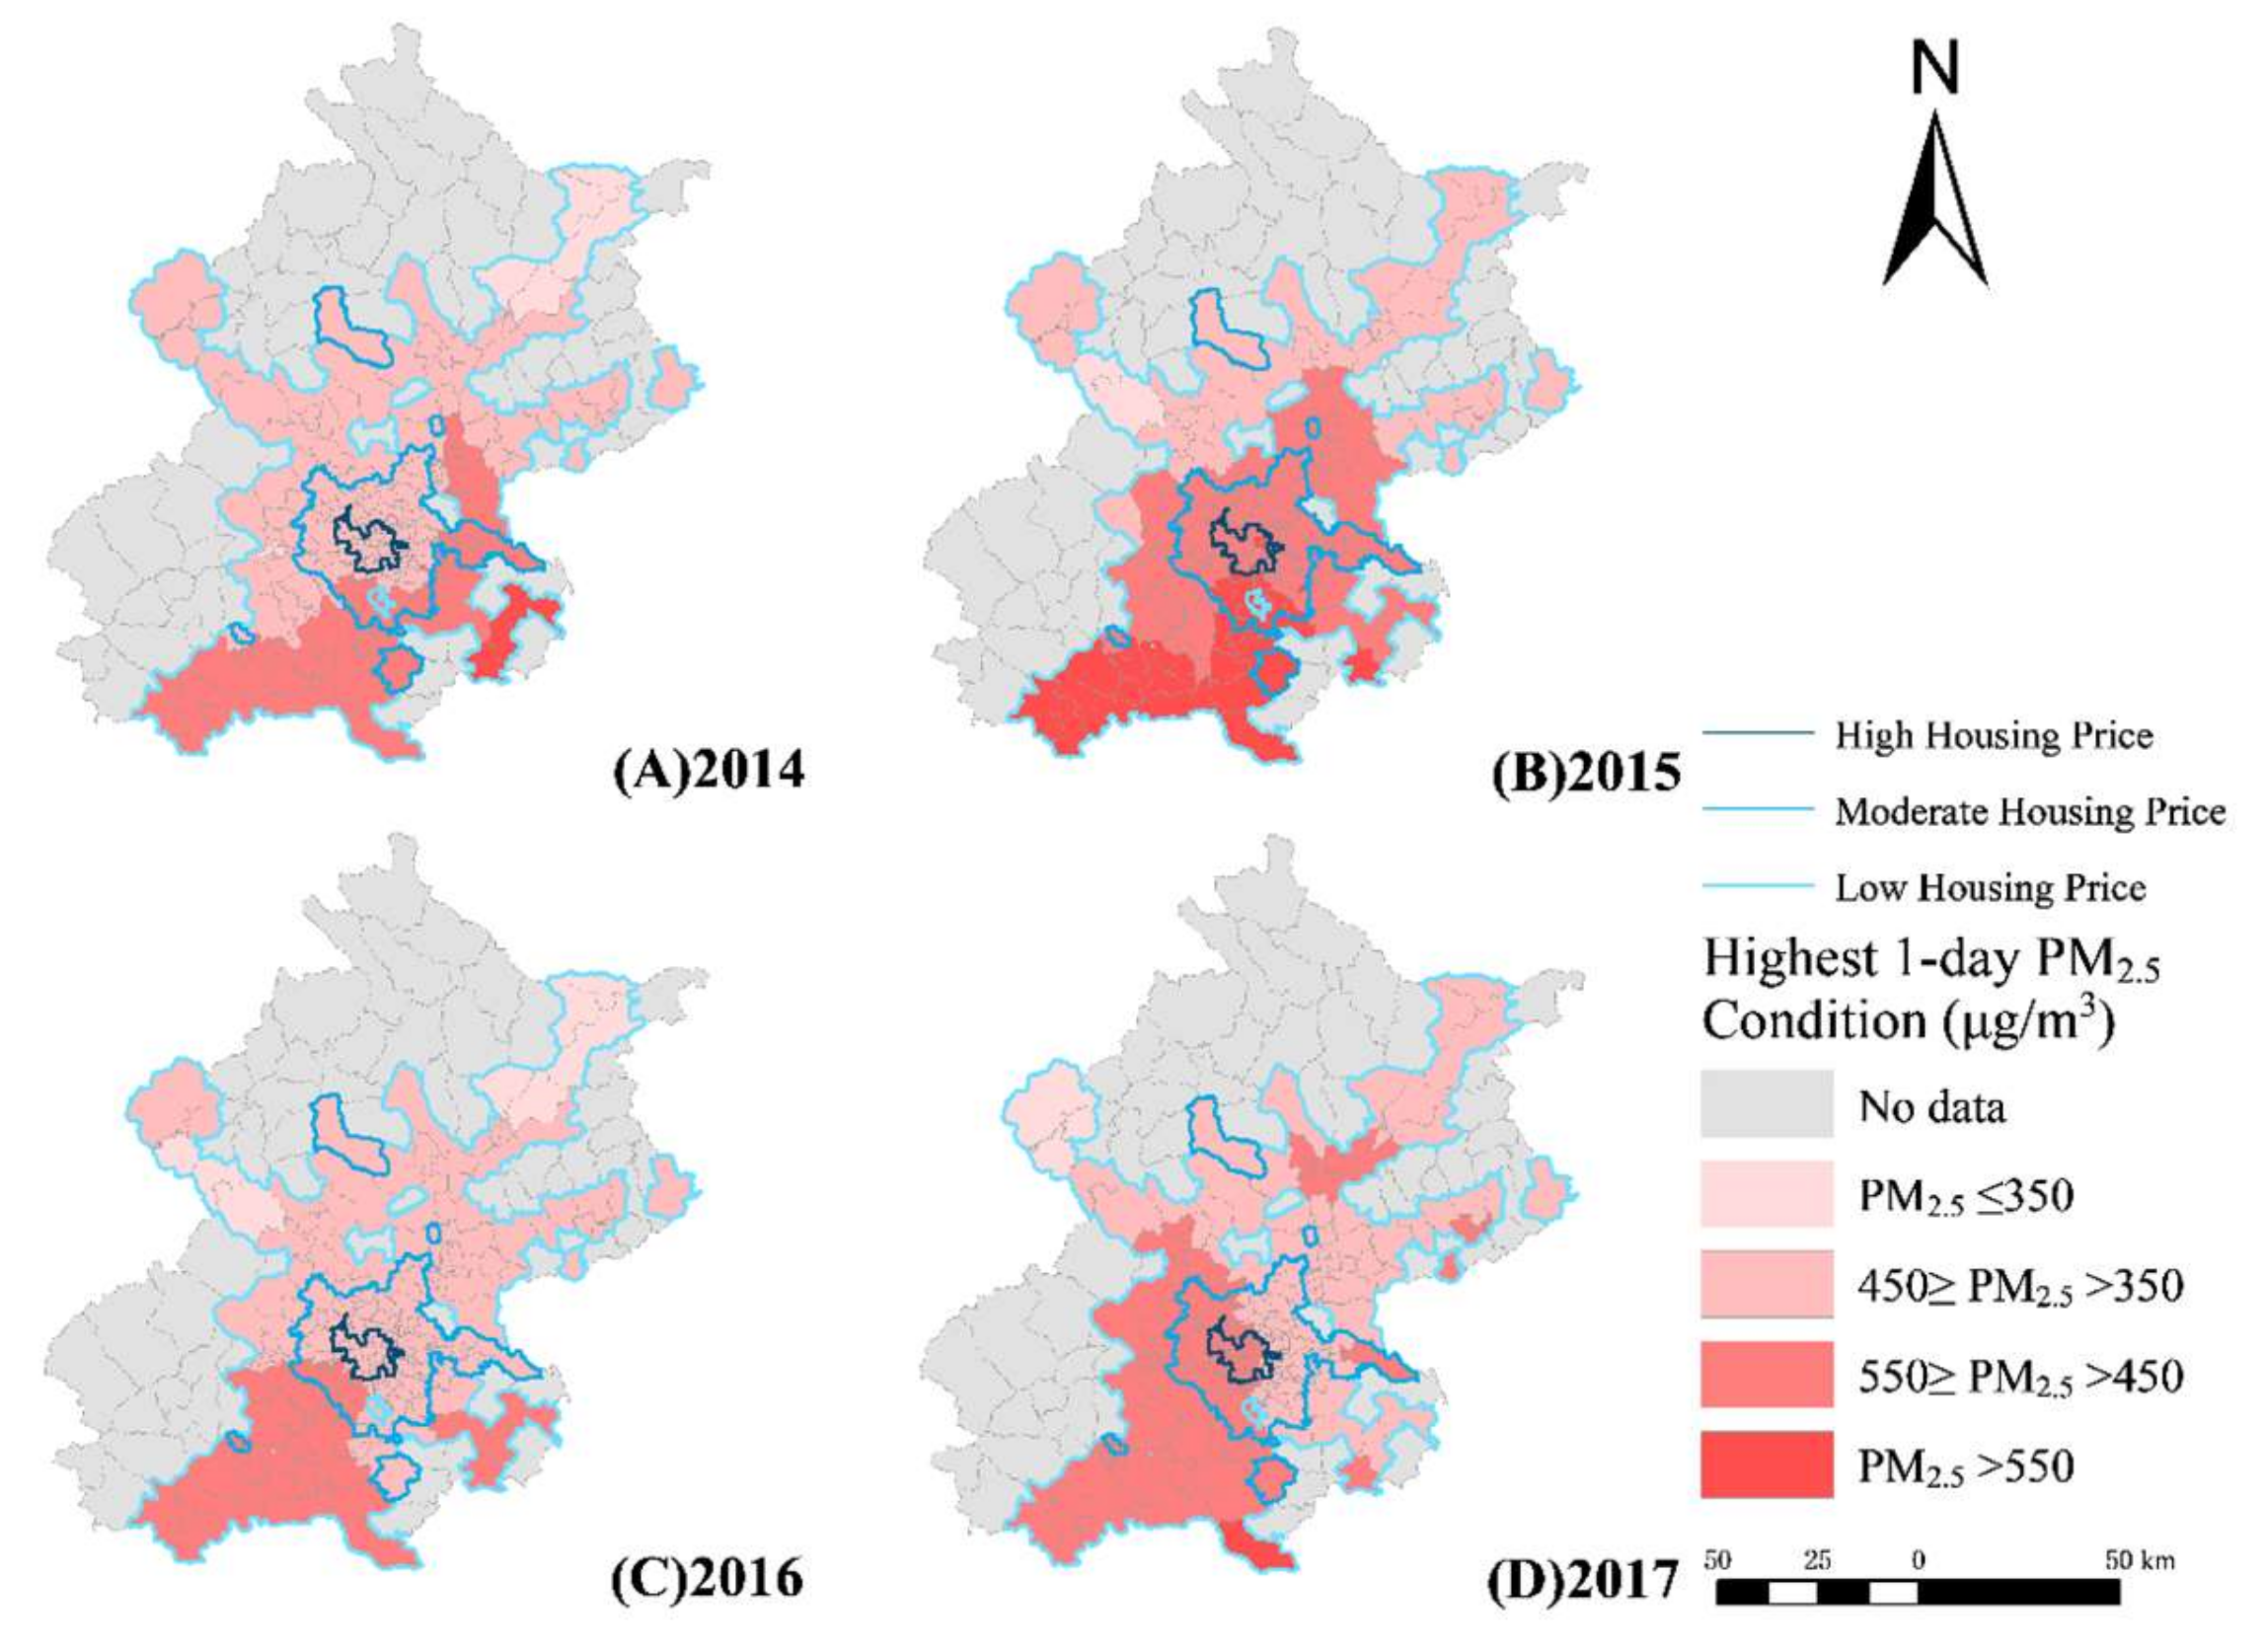
Figure 6.
The highest one-day PM2.5 reduction of 257 census tracts between 2014 and 2017 in Beijing.
Figure 6.
The highest one-day PM2.5 reduction of 257 census tracts between 2014 and 2017 in Beijing.

Figure 7.
The absolute inequity classification of 257 census tracts in Beijing based on air pollution data. The inequity types include forward inequity, equity, and reverse inequity.
Figure 7.
The absolute inequity classification of 257 census tracts in Beijing based on air pollution data. The inequity types include forward inequity, equity, and reverse inequity.
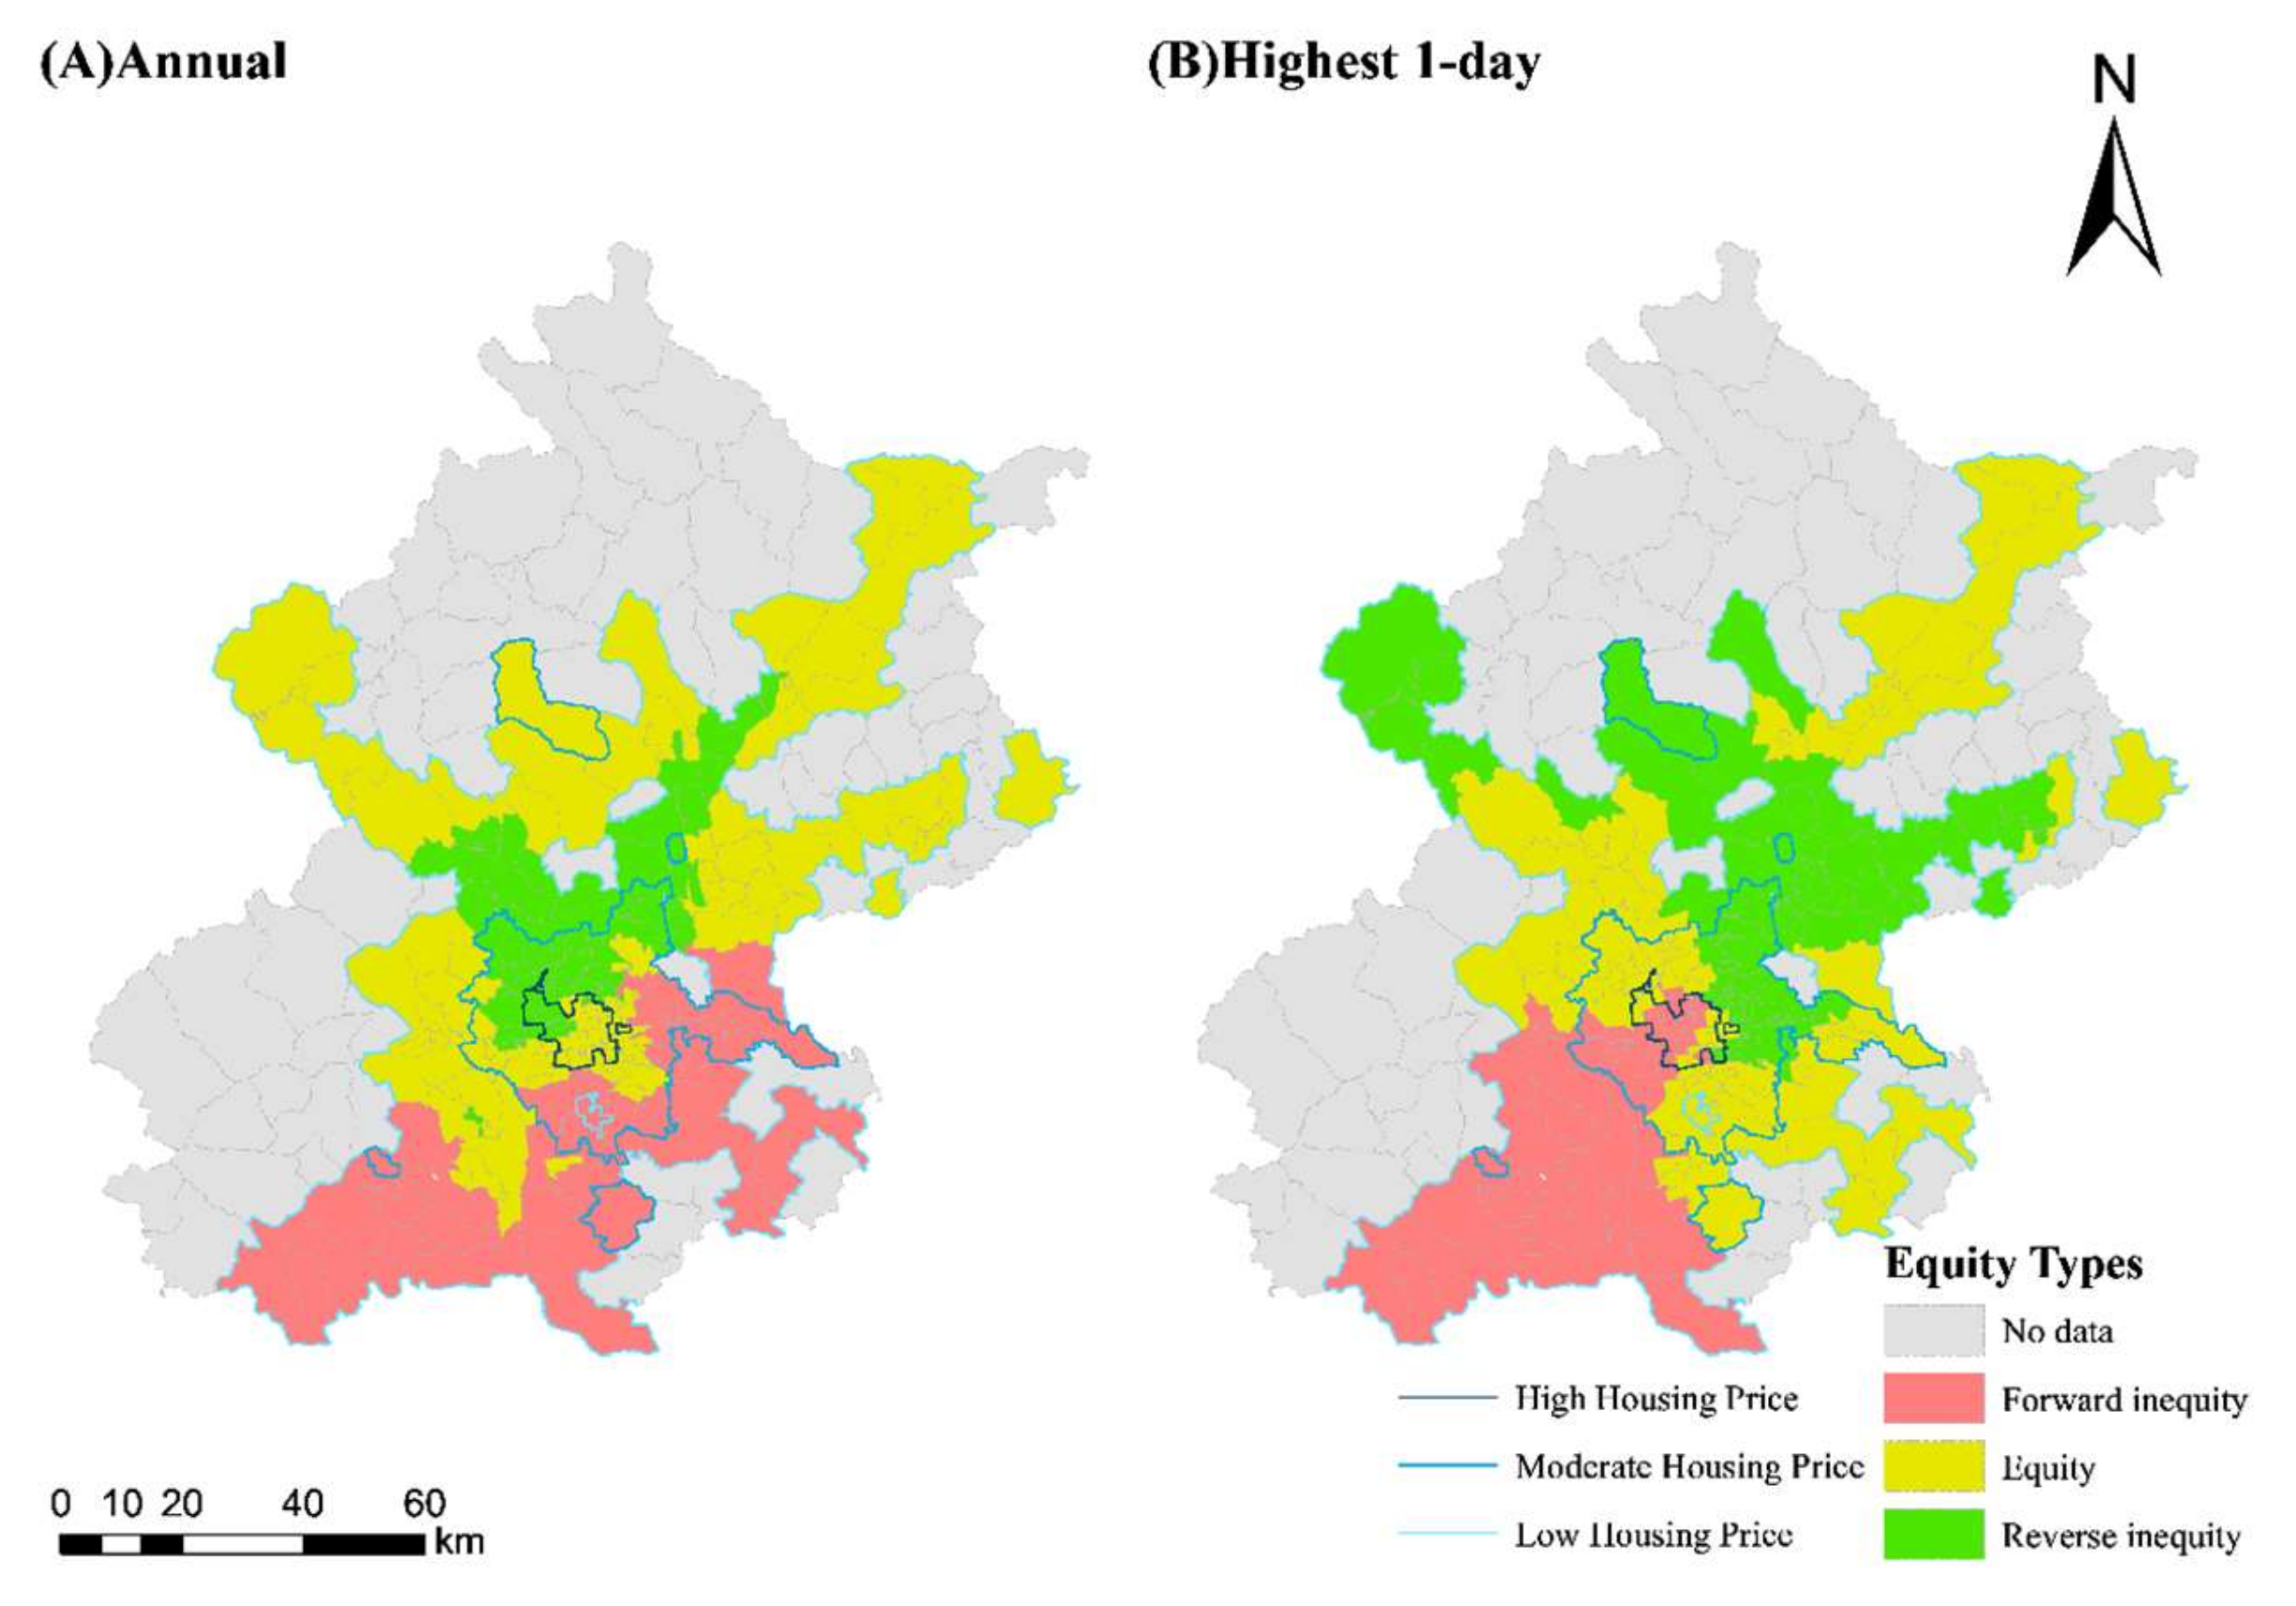
Figure 8.
The relative inequity classification of 257 census tracts in Beijing based on quotient value of air pollution and housing price. The inequity types include forward inequity, equity, and reverse inequity.
Figure 8.
The relative inequity classification of 257 census tracts in Beijing based on quotient value of air pollution and housing price. The inequity types include forward inequity, equity, and reverse inequity.


Table 1.
The Gini coefficient value of Beijing (257 census tracts) between 2014 and 2017 in different perspectives of inequity. A smaller value indicates better equity conditions.
Table 1.
The Gini coefficient value of Beijing (257 census tracts) between 2014 and 2017 in different perspectives of inequity. A smaller value indicates better equity conditions.
| By Pollution (Chronic) | By Pollution (Acute) | By quotient (Chronic) | By Quotient (Acute) | |
|---|---|---|---|---|
| 2014 | 0.090 | 0.176 | 0.788 | 0.479 |
| 2015 | 0.193 | 0.175 | 0.572 | 0.567 |
| 2016 | 0.200 | 0.192 | 0.557 | 0.468 |
| 2017 | 0.230 | 0.167 | 0.475 | 0.506 |
© 2020 by the authors. Licensee MDPI, Basel, Switzerland. This article is an open access article distributed under the terms and conditions of the Creative Commons Attribution (CC BY) license (http://creativecommons.org/licenses/by/4.0/).
Share and Cite
MDPI and ACS Style
Wu, J.; Zhou, J.; Zhang, W. A Framework to Classify Environmental Inequity in Absolute and Relative Terms, and Its Application in Beijing. Sustainability 2020, 12, 4757. https://doi.org/10.3390/su12114757
AMA Style
Wu J, Zhou J, Zhang W. A Framework to Classify Environmental Inequity in Absolute and Relative Terms, and Its Application in Beijing. Sustainability. 2020; 12(11):4757. https://doi.org/10.3390/su12114757
Chicago/Turabian StyleWu, Jiansheng, Junhao Zhou, and Wen Zhang. 2020. "A Framework to Classify Environmental Inequity in Absolute and Relative Terms, and Its Application in Beijing" Sustainability 12, no. 11: 4757. https://doi.org/10.3390/su12114757
Note that from the first issue of 2016, this journal uses article numbers instead of page numbers. See further details here.