Article

Port-Related Emissions, Environmental Impacts and Their Implication on Green Traffic Policy in Shanghai

1
Shanghai Key Laboratory of Atmospheric Particle Pollution and Prevention (LAP3), Department of Environmental Science and Engineering, Fudan University, Shanghai 200438, China
2
Shanghai Institute of Eco-Chongming (SIEC), Shanghai 200062, China
3
Big Data Institute for Carbon Emission and Environmental Pollution, Fudan University, Shanghai 200433, China
4
State Environmental Protection Key Laboratory of Vehicle Emission Control and Simulation, Chinese Research Academy of Environmental Sciences, Beijing 100012, China
5
Shanghai Academy of Environmental Science, Shanghai 200233, China
6
Shanghai International Port Group Co. Ltd., Shanghai 200080, China
7
Shanghai Urban-Rural Construction and Transportation Development Research Institute, Shanghai 200032, China
*
Authors to whom correspondence should be addressed.
Sustainability 2020, 12(10), 4162; https://doi.org/10.3390/su12104162
Submission received: 9 April 2020 / Revised: 8 May 2020 / Accepted: 12 May 2020 / Published: 20 May 2020
(This article belongs to the Special Issue Port Strategy for Sustainable Development)

Abstract

:
The port of Shanghai, as the world’s largest container port, has been experiencing rapid development in recent years, with increasing cargo throughput capacity. The combustion of diesel fuels used by internal and external port-related container trucks and in-port machineries can release various pollutants, causing air pollution. The terminals are close to the residential area, and the emissions are concentrated, which is worth paying attention to. This study aims to synthetically assess the port-related emissions and their environmental impacts. We firstly constructed an emission inventory of air pollutants in the port of Shanghai and then used the WRF-CMAQ model to estimate the influence of port-related source emissions on air quality. The results show that the annual emissions of SO2, NOX, CO, VOCS, PM, PM10, PM2.5, CO2, BC and OC caused by cargo-handling equipment were 21.88 t, 1811.22 t, 1741.72 t, 222.76 t, 61.52 t, 61.42 t, 58.41 t, 141,805.40 t, 26.80 t and 10.07 t in 2015. The emissions of NOX, CO, VOCS, PM10 and PM2.5 caused by external port-related container trucks were 18,002.92 t, 5308.0 t, 1134.57 t, 711.12 t and 640.58 t. The exhaust of external port-related container trucks was much larger than that of cargo-handling equipment, so the impact on air quality was also higher than that of the machinery. The peak annual average concentrations of PM2.5 and NOX contributed by the port-related sources were 1.75 μg/m3 and 49.21 μg/m3, respectively, which accounted for 3.08% and 36.7%, respectively, of the simulated ambient concentrations by all the anthropogenic emissions in Shanghai. Our results imply that the emission control policy to reduce the combined port-related emissions, especially for the cargo-delivery transportation phase from port to city, is key for large coastal port cities such as Shanghai.

1. Introduction

The port of Shanghai is the world’s largest container port, located in the middle of the Chinese mainland coastline, at the Yangtze River estuary. The port of Shanghai has a pivotal position in the world port industry [1,2] as an intersection for transportation along the east and west sides of the Yangtze River and along the coast [1]. As a hub of cargo transit, its establishment and operation have become a vital part of the transportation industry [3,4]. To cope with the unavoidable air pollution problems in this process, the construction of a green port must be put on the agenda as soon as possible [5,6,7,8]. Green port development focuses on the sustainable balance between environmental protection and economic interests. Green ports are guided by the green concept, in that new ports are constructed while promoting environmental health, ecological protection, the rational use of resources, low energy consumption and low pollution [9]. Green port practices have already been explored for many international ports (e.g., the ports of Long Beach and Los Angeles, the port of Sydney) [5,6,7,8,10,11]. Since 2015, when the Environmental Protection Law of the People’s Republic of China was revised [12], the Chinese government has been paying increased attention to port environmental protection and the concept of green port development. Currently, relevant research has been started on green ports both in China and abroad [1,13,14].
The machinery and handling equipment at ports are a great concern of green port projects [15]. They are mainly driven by diesel fuel with relatively low fuel quality, which may generate air pollutants [16]. Moreover, the port terminals are much closer to residential areas. Therefore, the air pollution caused by the machinery at the ports has a great impact on residents [17,18]. Three general methods are usually used for building port emission inventories. The United States Environmental Protection Agency (USEPA) has been working on tests for off-road mobile machinery and consequently developed the OFF-ROAD model. On the basis of the OFF-ROAD model, the USEPA has developed a more accurate estimation method of emissions from port-related sources [19]. However, this type of work started much later in China [20]. In China, we must refer to foreign basic parameters with respect to model application, which can cause unnecessary uncertainty.
Researchers in many countries use the second method, determining the exact production activity information, and build their methodology on the basis of machine power [21]. Agrawal et al. [22] estimated the rated power, emission factors and characteristic parameters. They then adjusted the results with fuel correction factors and control factors, thus building an emission inventory of Los Angeles in 2013. Fu et al. [23], Zhang et al. [24] and Shon et al. [25] used a similar methodology and constructed an emission inventory.
However, this method required a large amount of statistical data. Thus, the third method, based on fuel consumption [26], is much more widely used in China. This computing method ignores the discrepancies of power, length of service and other working condition parameters among different machines. Although accuracy is sacrificed to some extent, the parameters based on this method are easy to obtain. [27] estimated the fuel consumption of each piece of cargo-handling machinery and calculated the emissions according to the emission factors. Moreover, [28] used the top-down method based on the fuel consumption of unit containers and constructed an emission inventory of the Pearl River Delta in 2014.
Besides, some green port projects were more concerned about shipping-caused air pollution [29,30,31,32] and human health [33]. Previous related studies seldom combined the port land sources, cargo delivering trucks and ship emissions. In addition, they usually aimed at the establishment of emission inventories, but did not further evaluate the impact of port-related emissions on air quality and the environment. Thus, port-related air pollutant emissions and their environmental impacts are not systematically reported.
To make up for these two gaps, this study takes the largest container port as an example to estimate the port-related emissions and assesses their contributions to urban air pollution. This study focuses on the port of Shanghai and the Yangshan deep-water port, in the administrative division. Among the different terminals in the port of Shanghai, Waigaoqiao is the most important, followed by Yangshan, Wusong and Luojing. In this research, the basic data were obtained from the Shanghai Traffic Management Office. We firstly calculated the emissions of cargo-handling equipment based on fuel consumption and established a port-related emissions inventory with the combination of the emission inventory of external container trucks. We then used the WRF-CMAQ model to assess the impact of port-related emissions on air quality and made policy suggestions. The purpose of this study is to assess port-related emissions and their environmental impacts by investigating the emissions of port-related sources and providing corresponding academic support for green port construction in port cities like Shanghai.

2. Materials and Methods

2.1. Study Area and Period

As shown in Figure 1, the study area of this research is the port of Shanghai, which includes the Shanghai inland area, Chongming Island, Changxing Island and the Yangshan deep-water port. The latitude and longitude range from 120.5° E to 122.3° E and from 30.5° N to 32° N [34]. Located at the Yangtze River estuary, the port of Shanghai is a transportation hub port on the eastern coast of China. It is a world-famous port with well-developed shipping, transportation and service industries. The largest port area of the port of Shanghai is the Waigaoqiao port area, on the southern bank of the south port channel of the Yangtze River estuary. The Waigaoqiao port area has held the first position in the global ranking of annual cargo throughput. Other large port areas in Shanghai include the Wusong Ferry Terminal, the Luojing Ore Terminal, the Yangshan deep-water port and other piers along the Yangtze River.
We used 2015 as the base year for this study. The total emissions of different air pollutants from port-related sources throughout the entire year were estimated. The annual emissions were then scaled to monthly averages and used to simulate the impact on air quality.

2.2. Source of Basic Machinery Data

To investigate the basic situation of the statistics of the enterprises within the port of Shanghai in 2015, we cooperated with the Shanghai Traffic Management Office and obtained the port enterprise information, the basic data on cargo-handling equipment, the data on external container trucks and the emission factors of the different air pollutants of the port machinery. With respect to the mechanical data of the port, this study focuses mainly on the type of machinery, rated power, emission standards, energy types, annual operating hours and fuel consumption. For the data on external container trucks, this study includes mainly truck identities, traffic and routine activity. For the emission factor data, we classify the machinery and select the corresponding data according to the classification standards.

2.3. Estimation Method of Emissions from Cargo-Handling Equipment

We contacted the Shanghai Traffic Management Office and obtained a database of machinery with the exact holding volume, power, emission standards, annual working duration, fuel type and hourly-fuel consumption at every port enterprise. We then calculated the fuel consumption for the whole year with the following formula.
Ci = Hi*HCi
where:
I = machine i,
C = annual fuel consumption (t/a),
H = annual working duration (h/a) and
HC = hourly fuel consumption (t/h).
The proper emission factors of every air pollutant for each individual machine were selected according to the four-class principle in the Emission Factors Library of Air Pollutant Sources, shown in Table A1 in the Appendix A. The principles include machine type, fuel type, rated power and emission standard. The emission factors of SO2, NOX, CO, VOCS, PM, PM10, PM2.5, CO2, BC and OC were obtained, after which the following formula was used to compute the emissions of each air pollutant from each machine.
Ei,j = Ci*EFi,j/1000
where:
I = machine i,
J = air pollutant j,
E = emission (t/a) and
EF = emission factor (g/kg).
Following an investigation at the Shanghai Traffic Management Office, the exact location of every port enterprise was also obtained. The computations are presented in terms of their spatial distribution.

2.4. Estimation Method of Emissions from External Container Trucks

The estimation of external container truck emissions was conducted using a road vehicle emission model. According to different time periods, different driving status indicators, such as model segment traffic and speed, are distributed to road traffic. Based on the road traffic calculation results with different driving status indicators, the IVE model was then applied and the total emissions were calculated. The emission factors of the different air pollutants are listed in Table A2 in the Appendix A.

2.5. Air Quality Modeling

We used the weather research and forecasting (WRF) model (version 3.3) and the community multiscale air quality (CMAQ) model (version 4.6) to estimate the concentration distribution of the different air pollutants [34]. For the model establishment, we inputted the inventory of the average monthly values of the year to the simulation, with 72 h of spin-up time per run. The initial and boundary conditions for the meteorological factors in this research were provided by the Chinese National Centers for Environmental Prediction (NCEP) Final Analysis (FNL) at a resolution of 1° × 1° and time intervals of six hours. The CMAQ model used the carbon bond mechanism (CB05) for gas-phase chemistry and the AERO4 aerosol module. The grid resolution of the results is 1 km × 1 km [34].
Due to the severity of NOX and the great impact of PM2.5 from port sources on human health, we chose NOX and PM2.5 as typical pollutants and simulated the concentration fields of NOX and PM2.5 in the case of winter and summer and the yearly average. The impact of the emissions from port-related sources on air quality was then discussed, as were the environmental effects of seasonal changes. Since the port-related sources were mainly composed of the point-sources of the dock areas and the line-sources along the transportation routes of external container trucks, the proportion of port-related sources in all industries could be dense in areas where these emissions are concentrated. Therefore, we also simulated and analyzed the distribution of these proportions in all industries to refine the environmental impact of port-related source emissions.

3. Results

3.1. Engine Power and Emission Status of Port-Related Equipment and Fuel Consumption

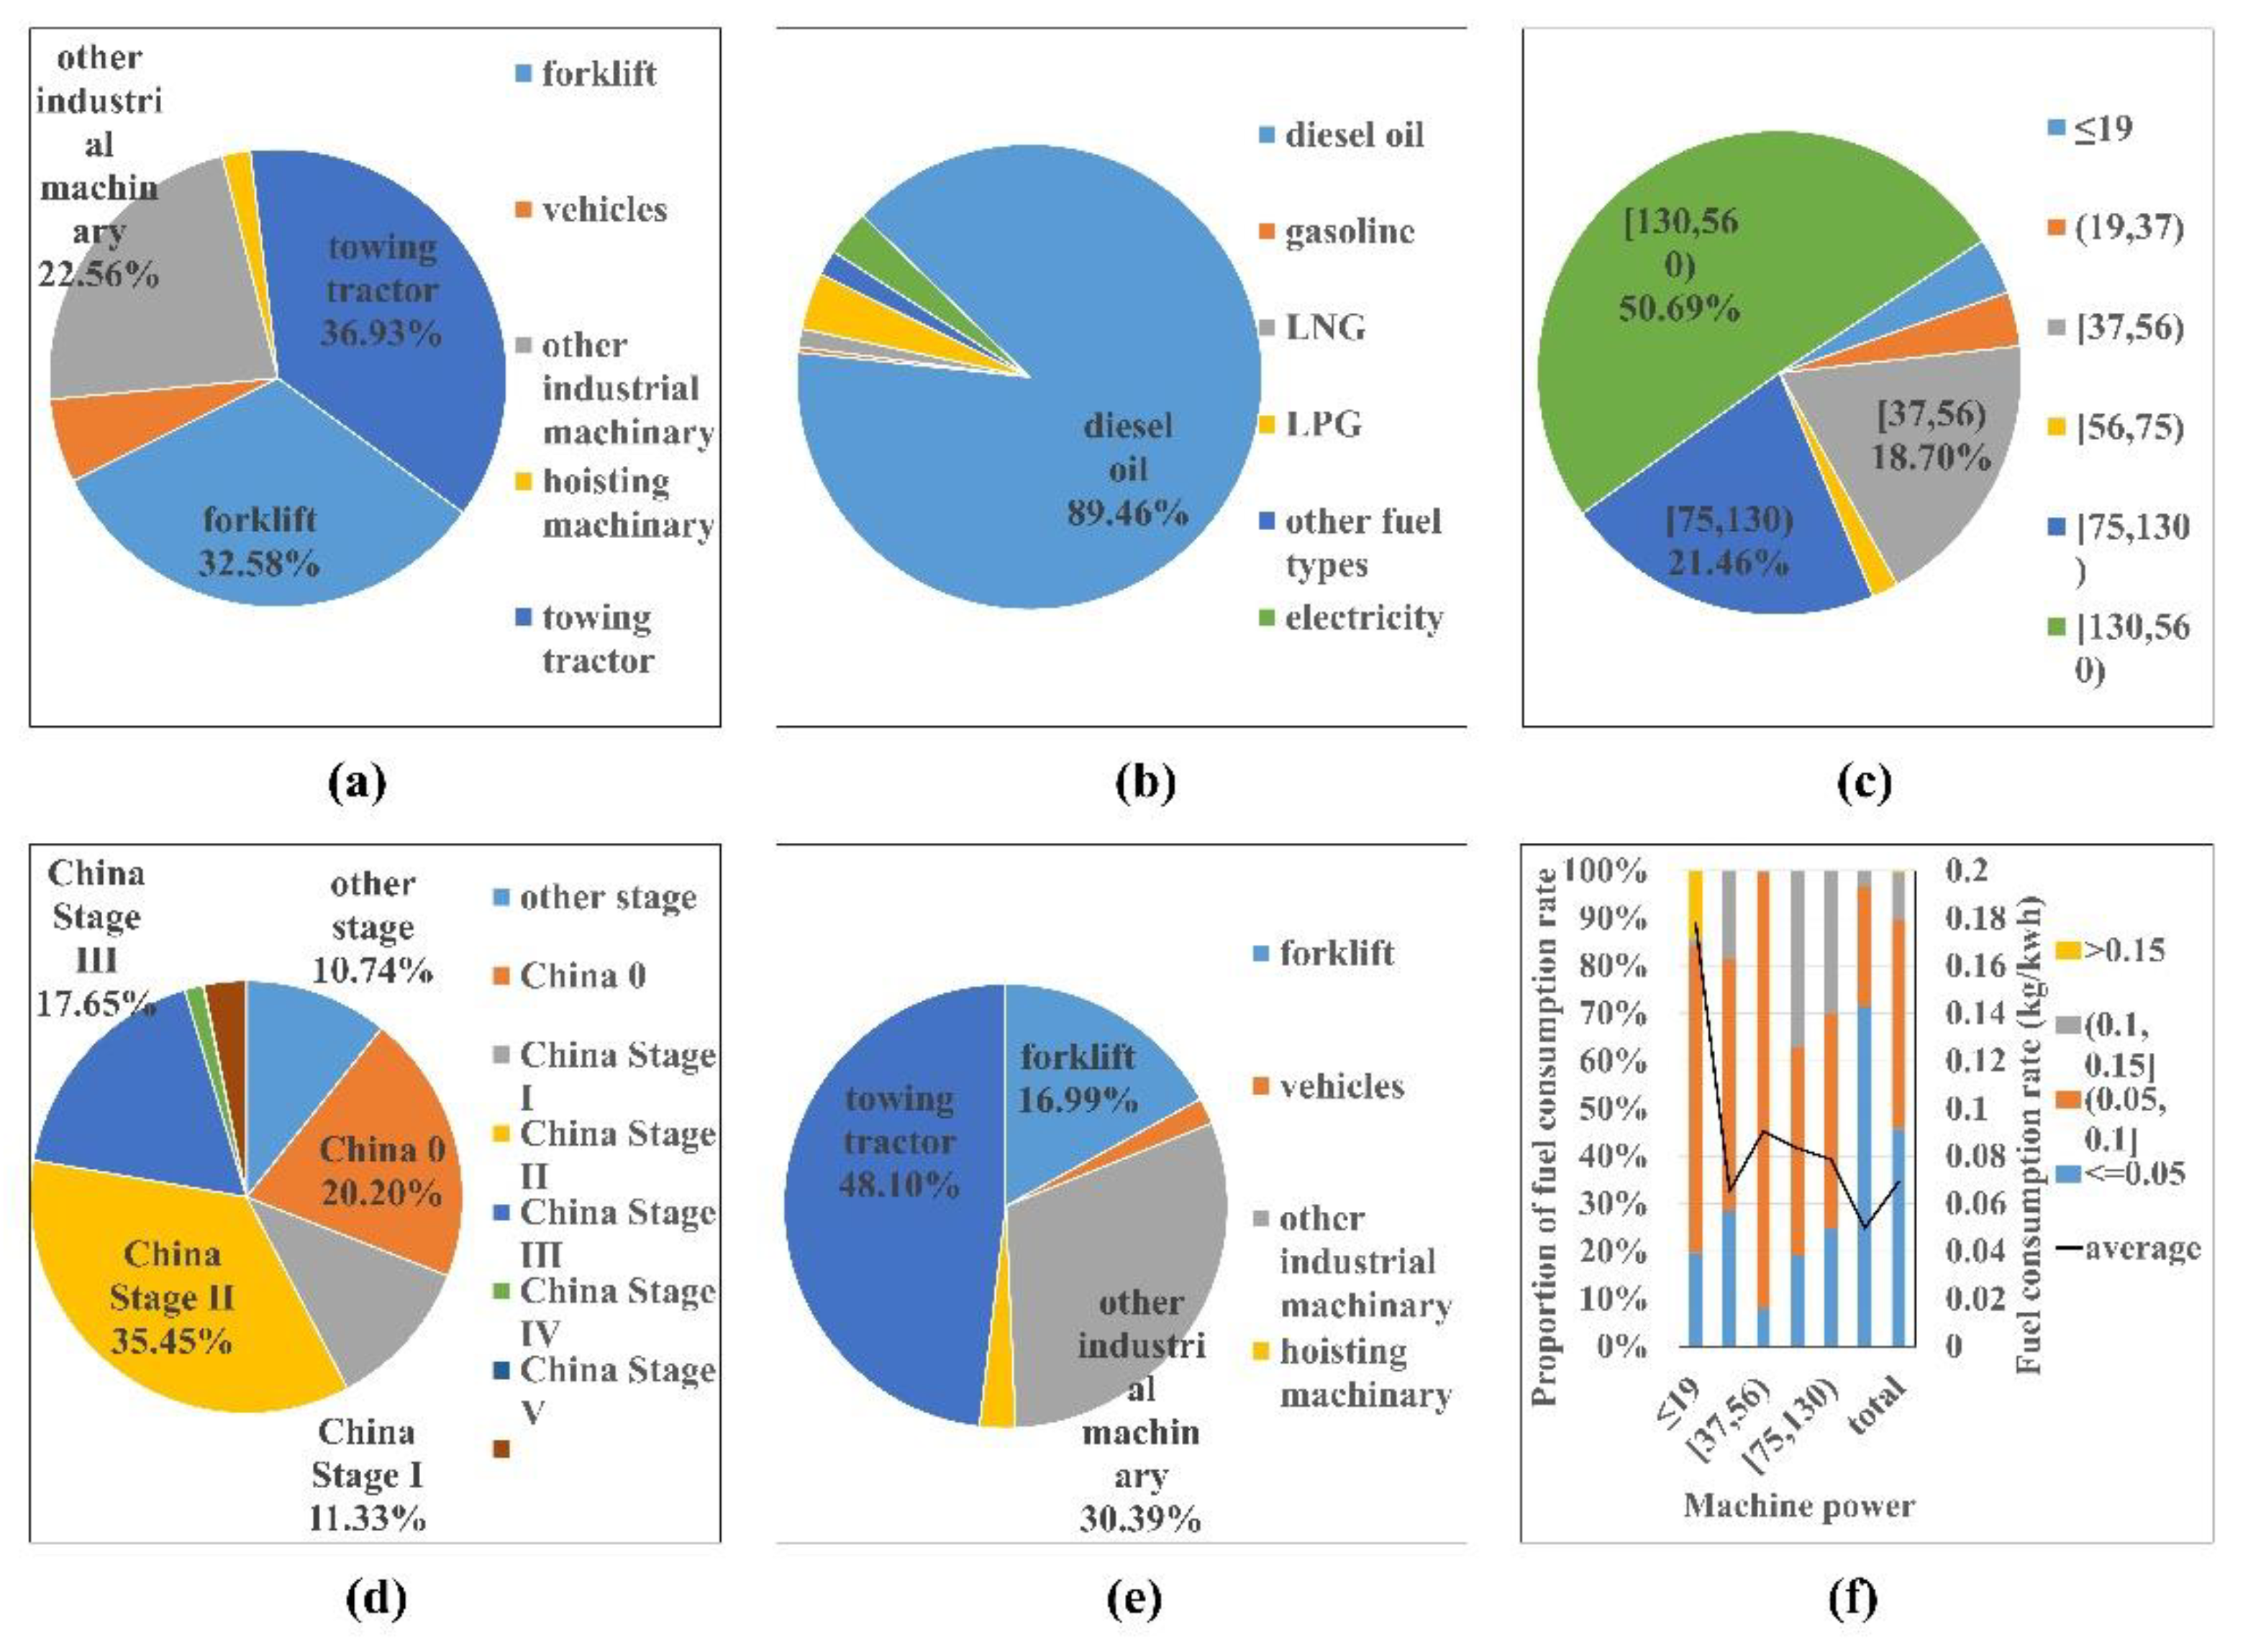
These statistics were based on 442 terminal enterprises in Shanghai, with a total of 3910 pieces of cargo-handling equipment within the survey. The basic parameters of the machines are shown in Figure 2. The machines investigated included forklifts, vehicles, hoisting machinery, towing tractors and other industrial machinery. Among the numbers of all the machines (Figure 2a), the number of towing tractors was the largest, with a total of 1444 pieces, accounting for 36.93%, followed by forklifts, with a total of 1274 pieces, accounting for 32.58%. The third largest was the number of other industrial machines, at 882 pieces, accounting for more than 22.56%.
The distribution of the energy types of cargo-handling equipment had a direct effect on the emissions. The energy types used in the machines included diesel fuel, electricity, liquefied petroleum gas (LPG), liquefied natural gas (LNG), etc. Among them (Figure 2b), the diesel-driven machinery, with a total of 3498 pieces, accounting for 89.46%, predominated, followed by LPG-driven machinery, with a total of 155 pieces, accounting for 3.96%. The third was electricity-driven machinery, with a total of 124 pieces, accounting for more than 3.17%. The fuel types of the cargo-handling equipment were gradually being upgraded and updated, and the number of machines driven by LNG and electric power increased [35]. However, from the research results, in 2015, the integration of LNG and electric drive machinery was relatively low, and the fuel structure still needed to be improved.
The rated power of cargo-handling equipment ranged from 8.8 kWh to 438.5 kWh. Machines with a rated power in the range of 130–560 kW accounted for 50.69% of all machinery (Figure 2c), followed by those with a rated power in the range of 75–130 kW, which accounted for 21.46%. The third most predominant was that of 37–56 kW, accounting for 18.70%. It was obvious that, due to the large amount of port operations, machines needed to bear heavy loads, and the operation time was long. Therefore, the high-power machinery still accounted for the vast majority.
The emission standards of the cargo-handling equipment ranged from the China 0 to China V emission standards. The total number of machines adhering to the China II standards was 1386, accounting for 36.61% (Figure 2d). The second greatest proportion adhered to the China 0 standards, with a total of 790 pieces, accounting for 20.87%. The third greatest proportion adhered to the China III standards, with a total of 690 pieces, accounting for 18.23%. It can be seen that, in 2015, the pollution control of non-road mobile machinery in China was not yet in line with international standards, and there was still a large amount of high-emission and high-pollution machinery in use.
With respect to energy consumption, cargo-handling equipment had a total fuel consumption of 45,575.51 t. The distribution of the fuel consumption of cargo-handling equipment (Figure 2e) did not correspond absolutely with that of the types of machines. Towing tractors accounted for 36.93% but consumed approximately 48.1% of fuel. Forklifts accounted for 32.58% but consumed approximately 16.99% of fuel. The discrepancy was caused by the combined influence of the different distributions of rated power and emission standards.
The fuel consumption rate of the cargo-handling machines involved in this study (Figure 2f) differed greatly from the average fuel consumption rate under the calibration conditions in the literature [36]. This occurred because the ratio of actual hourly fuel consumption to mechanical power was obtained in this research, which was quite different from the value of the fuel consumption rate under calibration conditions. According to this research, the average fuel consumption rate of the cargo-handling equipment was approximately 0.069 kg/kWh, which is close to the value reported by [20]. Among the machinery, approximately 90% of the machines had a fuel consumption rate of no more than 0.1 kg/kWh. Furthermore, the rate of half of the machines was no more than 0.05 kg/kWh and that of only a few machines was higher than 0.15 kg/kWh. The distribution of the fuel consumption rates of the machines varied with their power range. Approximately 65% of the low-power machines (i.e., no more than 19 kW) had a fuel consumption rate of 0.05–0.1 kg/kWh; conversely, more than 70% of the high-power machines (i.e., no less than 130 kW) had a fuel consumption rate of less than 0.05 kg/kWh. Two parameters that directly determine the mechanical fuel consumption rate are mechanical rated power and hourly fuel consumption. According to the research, the hourly fuel consumption of the different machines was not very different, ranging from 0.30 kg/h to 14.93 kg/h. However, the mechanical power varied greatly, ranging from 0.92 kW to 560 kW. In general, except for the average fuel consumption rate of the low-power machines at approximately 0.18 kg/kWh, the machine fuel consumption rate of the other power segments hovered around 0.07 kg/kWh.

3.2. Port-Related Emission Inventory

3.2.1. Cargo-Handling Equipment

The emissions of SO2, NOX, CO, VOCS, PM, PM10, PM2.5, CO2, BC and OC from the machines were 21.88 t, 1811.22 t, 1741.72 t, 222.76 t, 61.52 t, 61.42 t, 58.41 t, 141,805.40 t, 26.80 t and 10.07 t, respectively (Table 1).
Due to the usage of vehicle diesel in cargo-handling equipment, the sulfur content was relatively low—generally no higher than 0.1%. Therefore, the emissions of sulfur dioxide from cargo-handling equipment were low. In contrast, the emissions of NOX were predominant. The different contributions of separate air pollutants were due to the general composition of diesel oil. Therefore, they were similar among different ports [16,22,24,37]. The emission contribution tended to be similar among the different air pollutants according to the distribution of the fuel consumption, though discrepancies still occurred (Figure 3).
For towing tractors, CO and VOCS had higher contributions than the others, while the particulate matter was lower. This result was similar to that of Zhang et al. [24] and Archana et al. [22]. Except for the machinery attributes, this was also caused by the usage of LNG, which had a higher proportion in towing tractors, according to the element investigation. However, the forklifts presented the opposite situation because they were driven mainly by diesel fuel, which can lead to large emissions of particulate matter. Overall, towing tractors, forklifts and other industrial machinery—with the most individual machines and, consequently, the greatest fuel consumption—played the predominant role in the emissions. The results from Zhu et al. [16], covering 21 provinces and cities with ports in China, showed that loaders and tractors were the most severe polluting sources. A significant reason for the difference was the terminal type. The port of Shanghai is the world’s largest container port, while Zhu’s research included a more complex cargo composition.
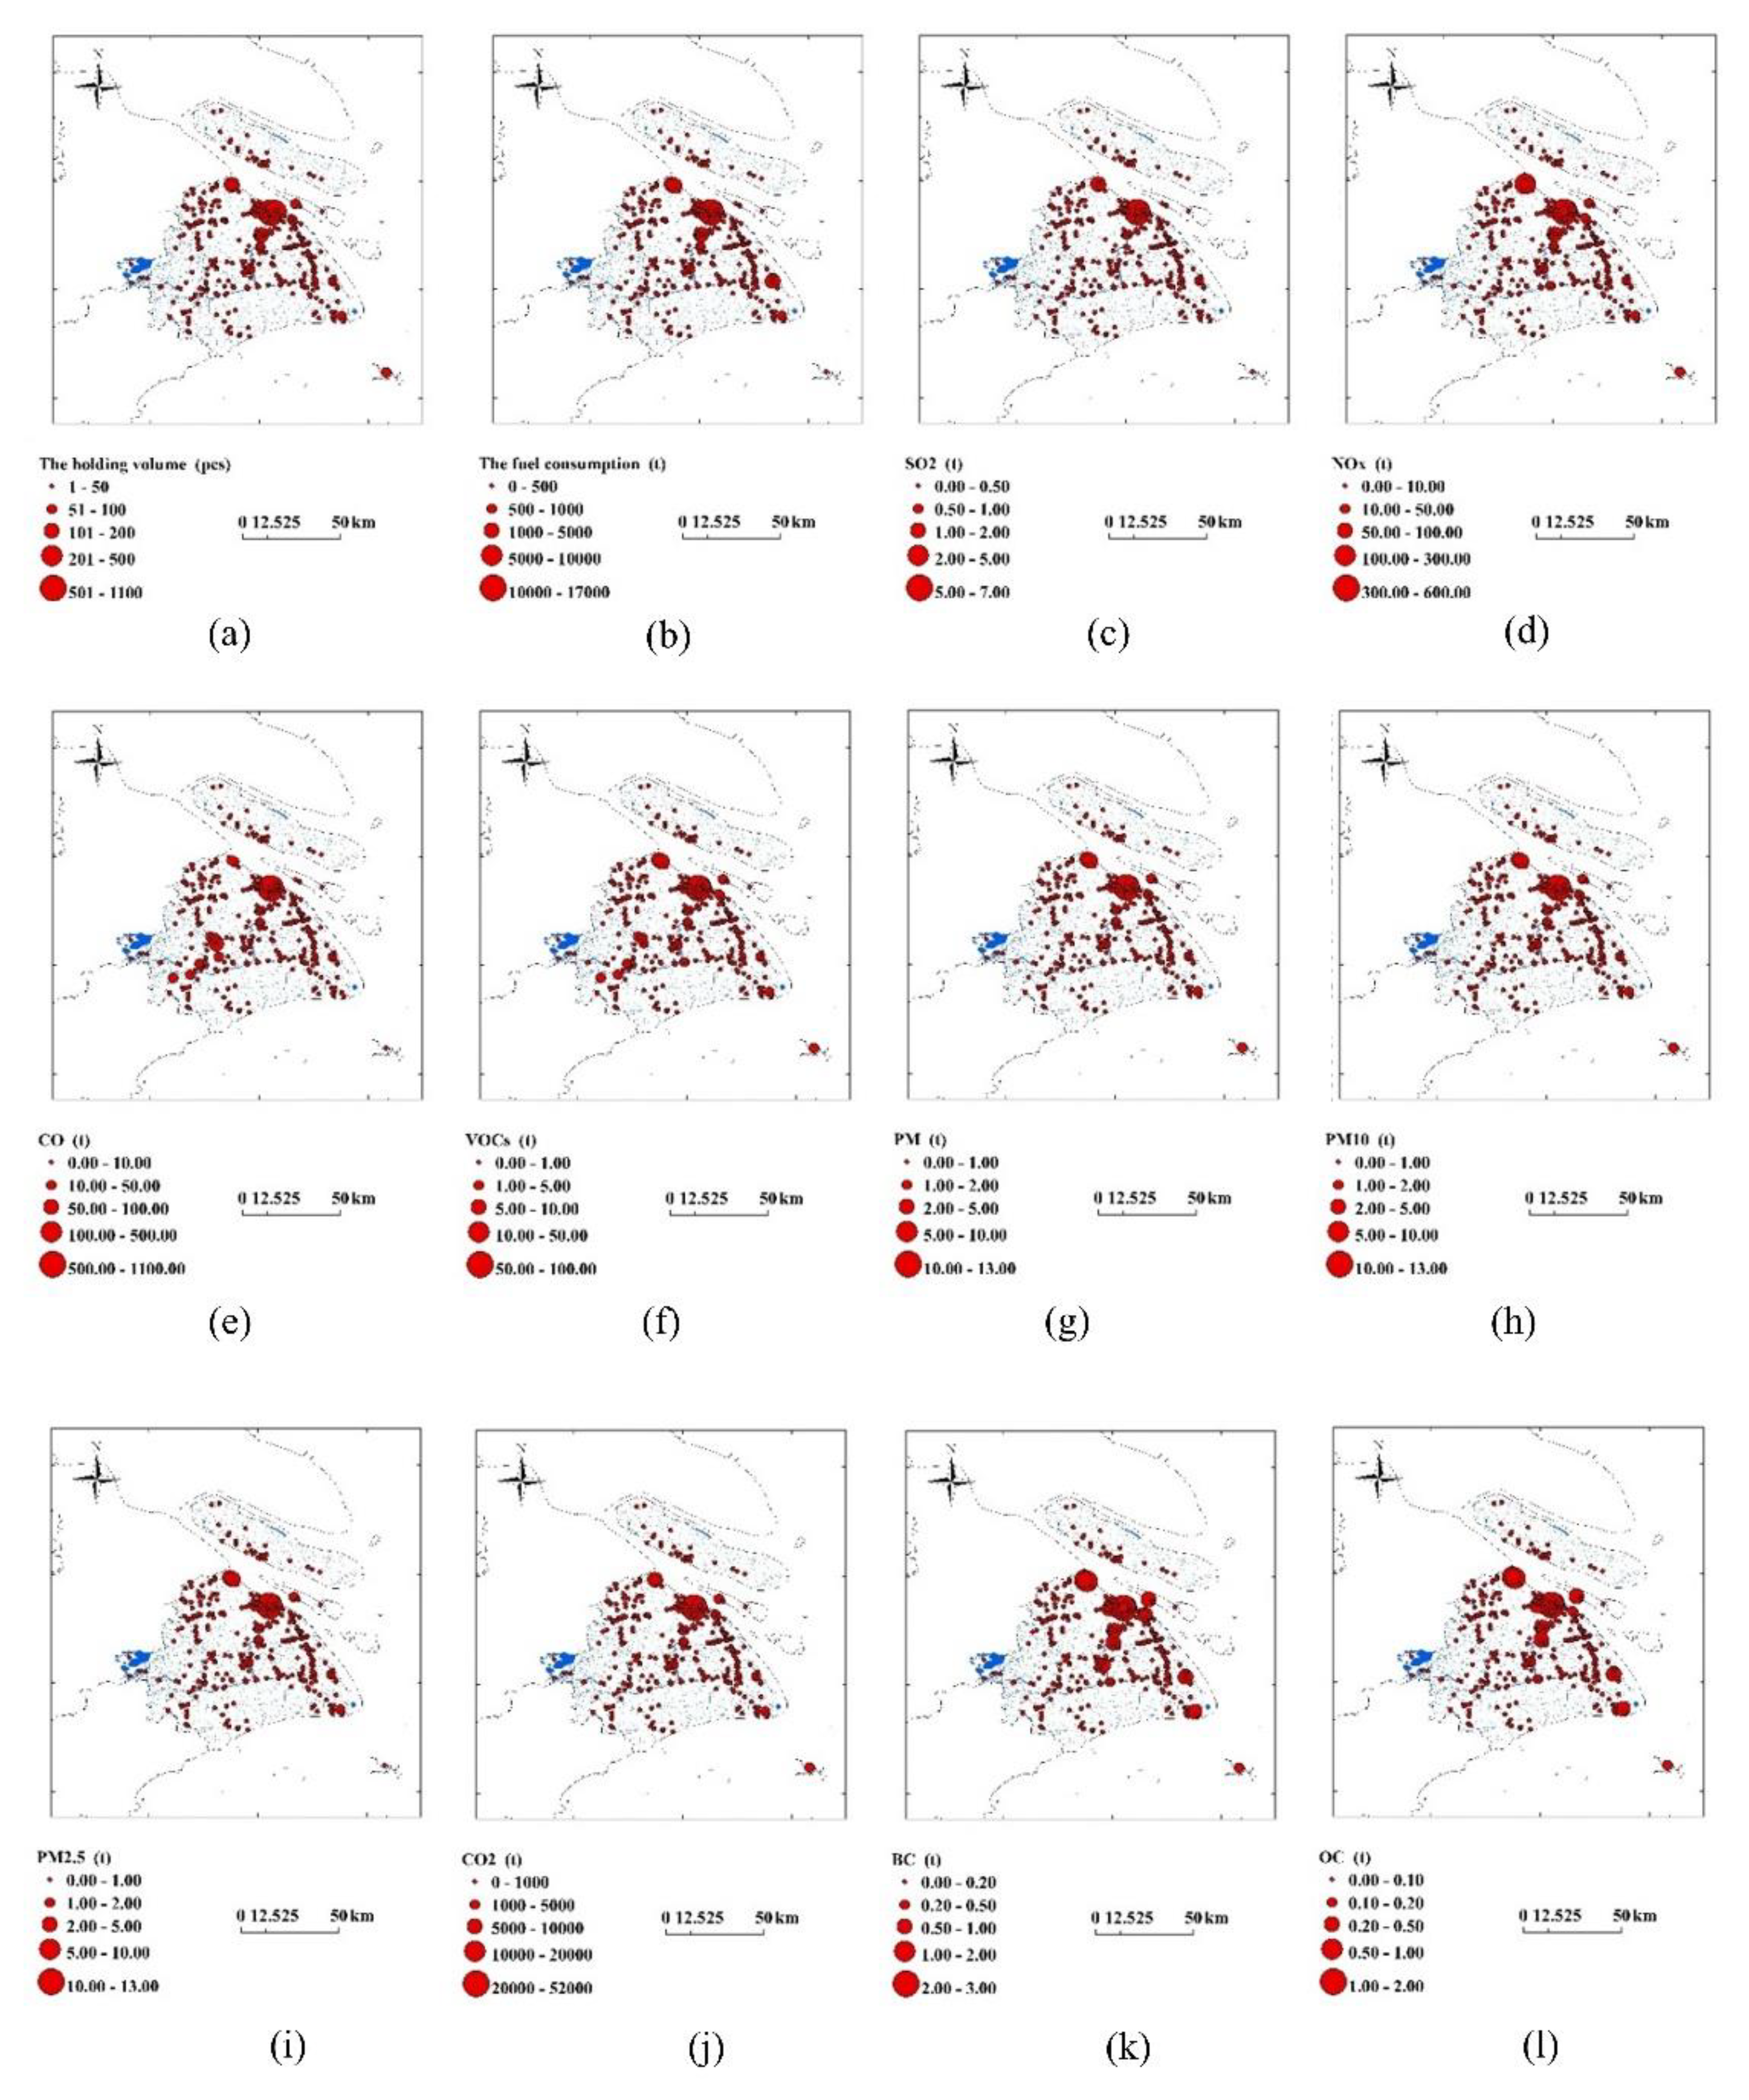
The emissions of the port machinery are mapped in Figure 4. Most of these port enterprises were located near the Yangtze River estuary and along the Huangpu River. Among them, those in Luojing, Wusong, Waigaoqiao, Baoshan and Yangshan had a larger scale and higher levels of production activity. Therefore, we expected the pollution in these areas to be more severe than elsewhere. The general tendency of the spatial distribution was similar among the different pollutants (Figure 4), so SO2 was taken as an example (Figure 4a). The total emissions of SO2 were 21.88 t. Analogous to the distribution of port enterprises, the docks in Luojing, Wusong, Waigaoqiao, Laogang, Yangshan and along Huangpu River contributed significantly to the port emissions. Waigaoqiao contributed the most, and the peak was 6.96 t.

3.2.2. External Port-Related Container Trucks

The emissions of NOX, CO, VOCS, PM10 and PM2.5 from external container trucks were 18,002.92 t, 5308.05 t, 1134.57 t, 711.12 t and 640.59 t, respectively (Table 1). Like the cargo-handling equipment, external container trucks basically used vehicle diesel, which has a low sulfur content. Therefore, the emissions of SO2 from external container trucks were not included in this study. The general tendency of the spatial distribution was similar among the different pollutants (Figure 5), so NOX was taken as an example (Figure 5c).
The total emissions of NOX were 18,002.92 t. The emissions of trucks were mainly concentrated in Shanghai’s suburban and outer ring road, on the G60 Shanghai-Kunming Highway in the direction of Hangzhou, in Zhejiang and on the S2 Hulu Highway in the direction of the Yangshan deep-water port. This spatial distribution met the traffic policy needs and the Shanghai road traffic flow. In accordance with traffic policies, container trucks were not allowed to enter central road sections in a particular period of the day. Therefore, the emissions inside the outer loop were much lower. In contrast, the emissions along the line-sources of the Shanghai outer ring road were generally higher. Regarding Shanghai’s traffic flow, the Shanghai suburban and outer ring road, G60 Shanghai-Kunming Highway and S2 Hulu Highway were heavy-traffic routes in Shanghai’s suburban areas. This enormous transportation burden leads to serious emissions, so the carrying capacity of different roads had a direct impact on the spatial distribution of emissions from external container trucks. Moreover, corresponding to the largest scale of the port enterprises in the Waigaoqiao area, the emissions peaked at 148 t on the road sections in this area. As a result of the unique geographic location of the Waigaoqiao area, near the Shanghai outer ring road, the emissions in this area were more prominent than those in other regions. As far as the two sources of port-related pollution are concerned, the total amount of pollution discharged by trucks was much higher than that of machines, which was essentially 5–11-fold greater.

3.3. Air Quality Impact

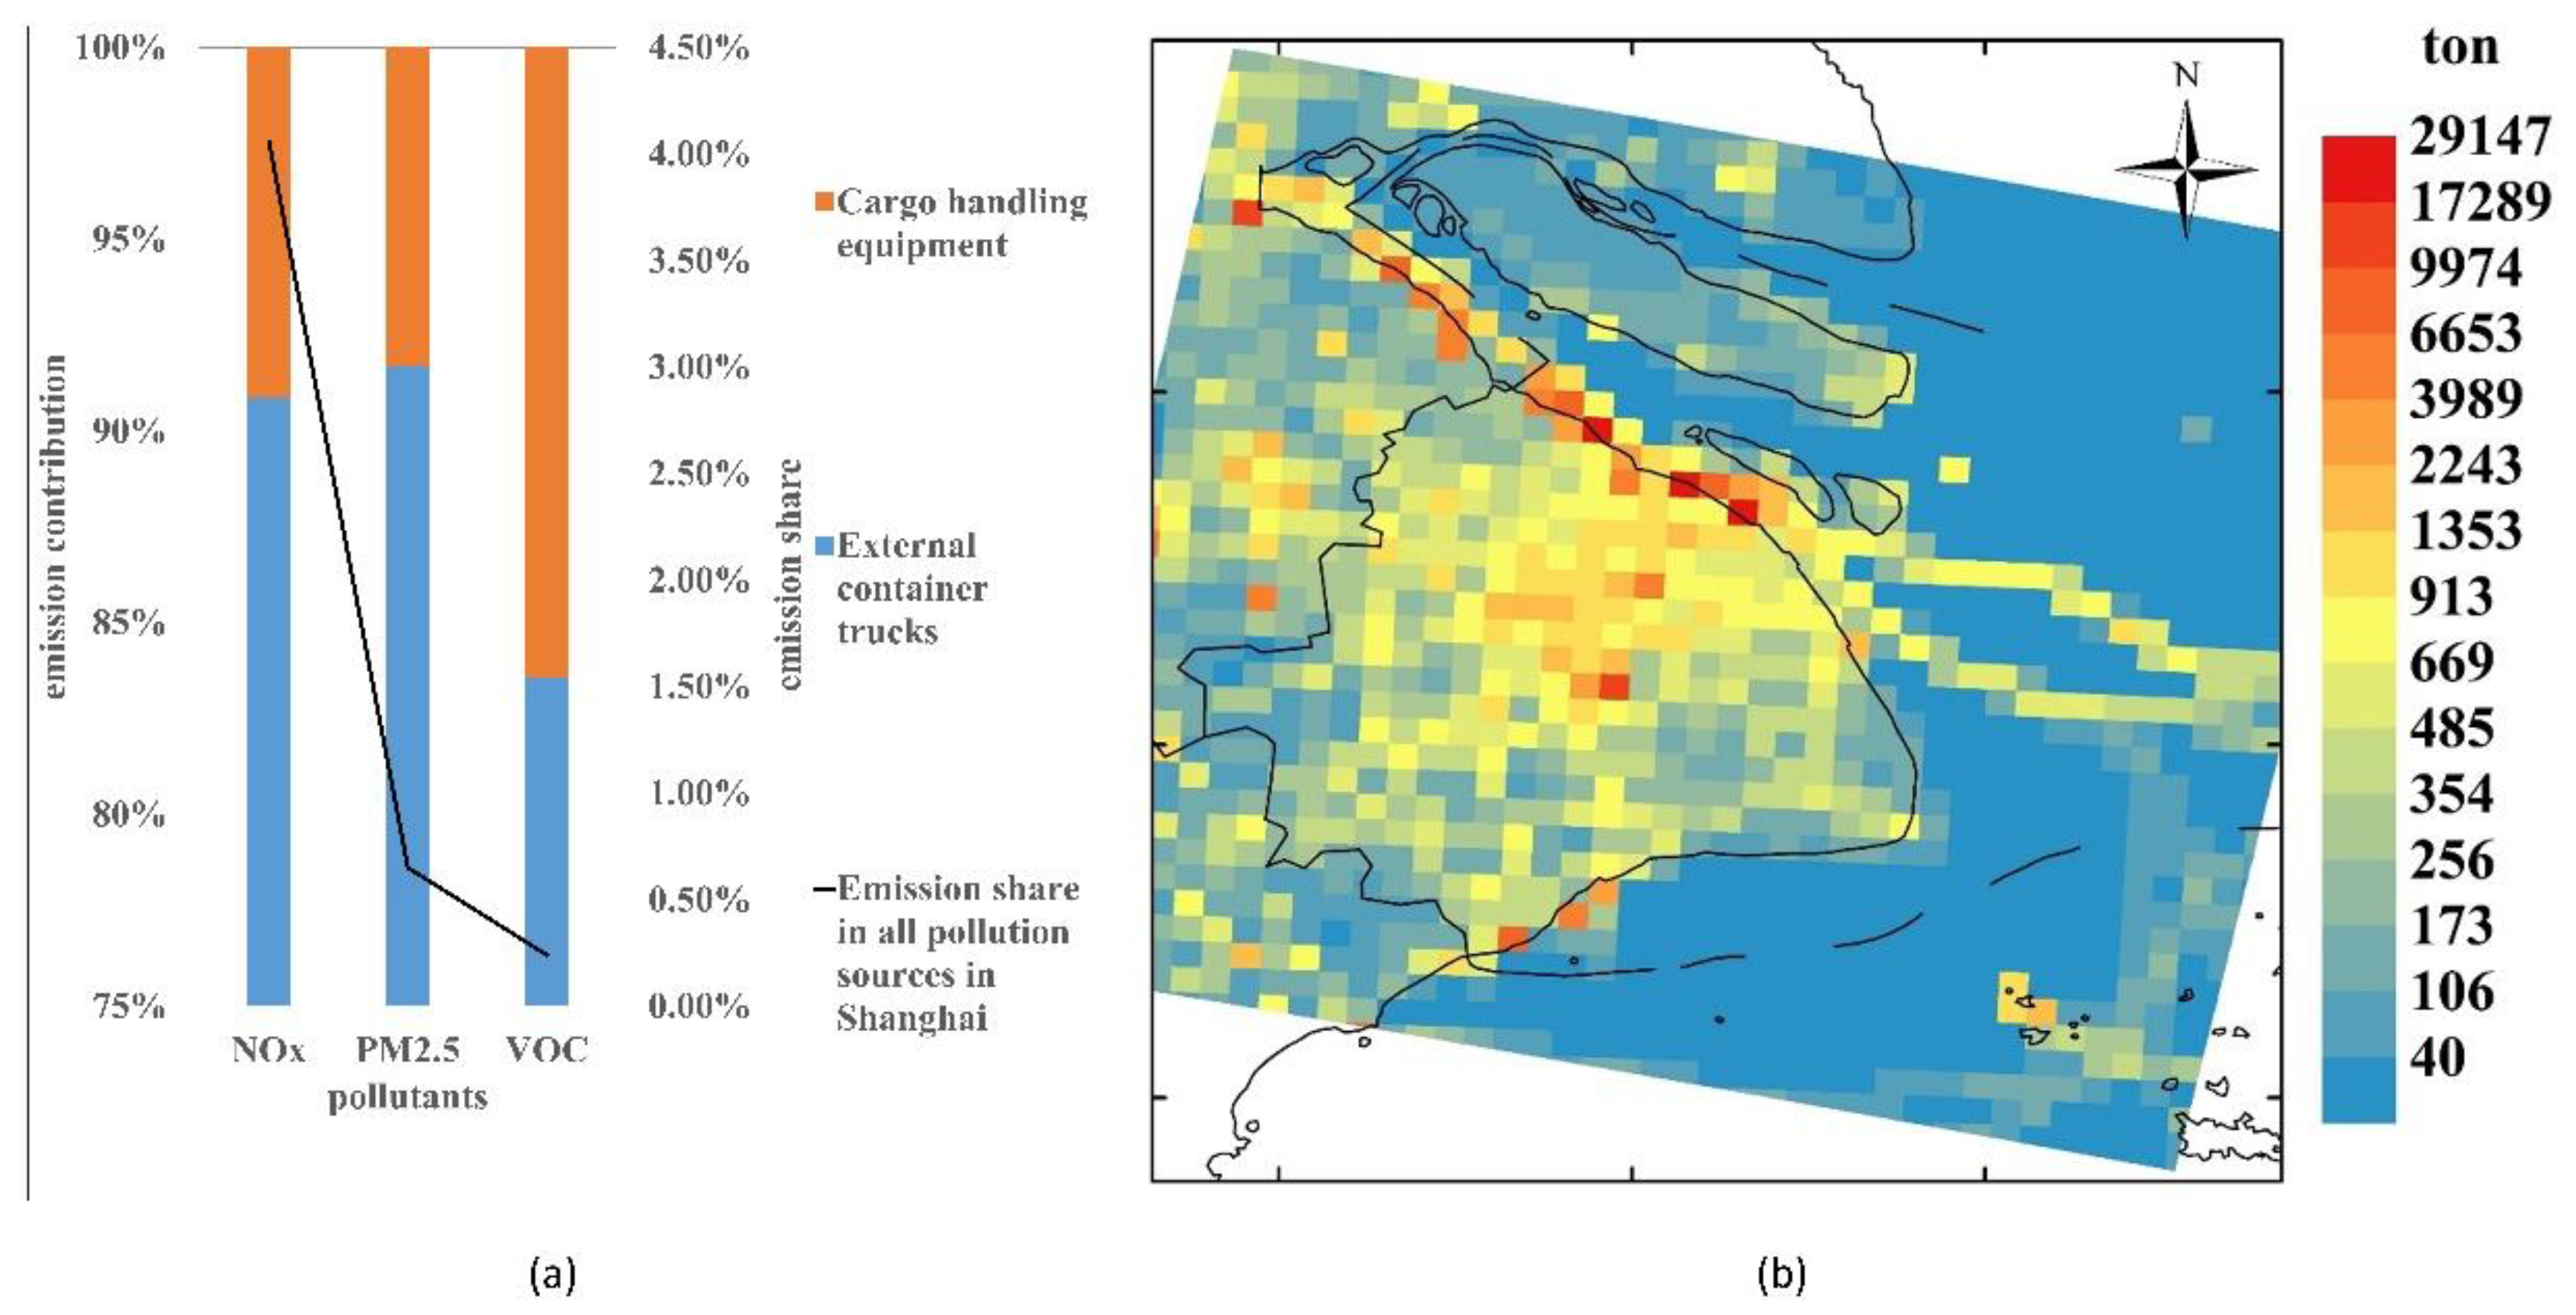
Among all pollution sources in Shanghai, the total port-related emissions (including cargo-handling equipment and external container trucks) constituted a relatively small proportion; e.g., the NOX emissions accounted for approximately 4%, while the VOCS accounted for only 0.24% (Figure 6a). However, because port-related sources were concentrated on the outer ring road and port area, they played an important role in port-surrounding areas with high-density populations. As such, NOX was taken as an example. The total emissions of NOX from all industries was approximately 500 kt in 2015. The amount was higher in urban areas than in the suburbs (Figure 6b). This discrepancy was caused by the high emission contribution of on-road transportation inside the outer ring road. On the other hand, the emission shares were extremely high near terminal areas, such as Baoshan, Waigaoqian, Jinshan and some inland water areas. The peak reached 29,147 t near the Waigaoqiao terminal. Therefore, simulations were conducted to estimate the impact of the two types of port-related sources on air quality in Shanghai, including cargo-handling equipment and external container trucks. Because summer is the busiest period for shipping activity and port-related pollution [38,39], it was selected as a typical case to compare the diffusion and the impact on the air quality of the pollutants.
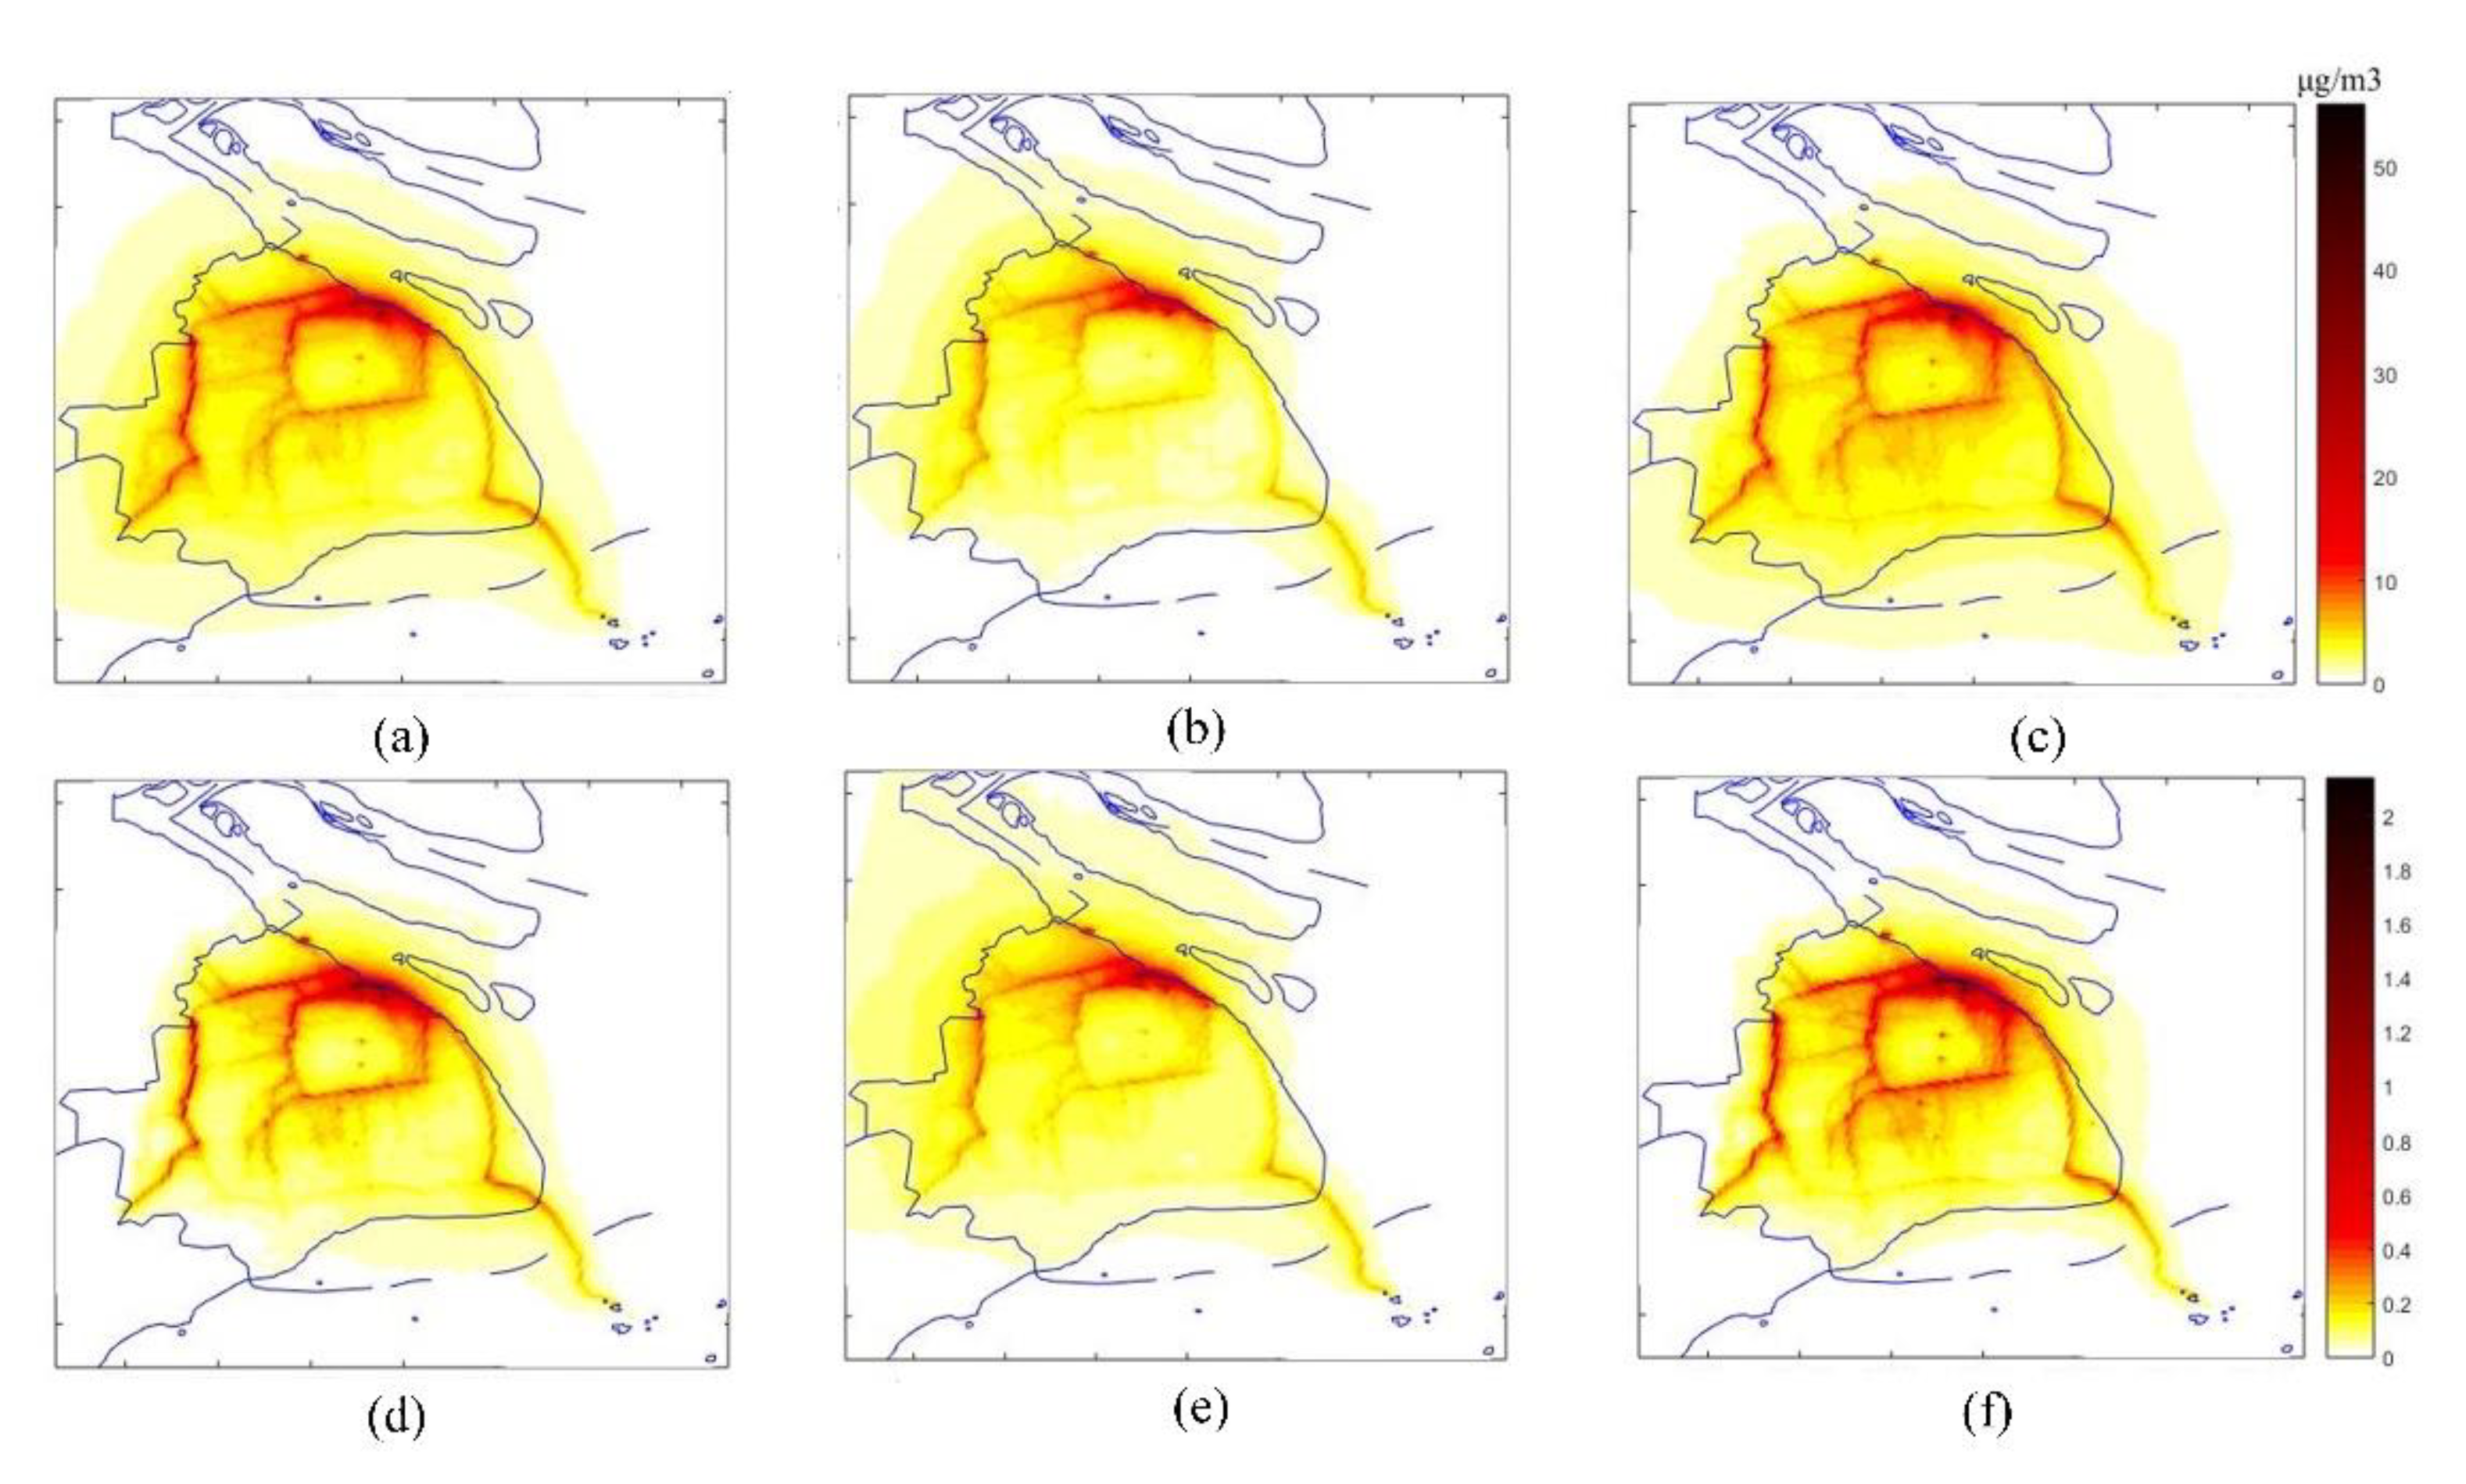
In the case of summer, the distributions of the concentration field for NOX and PM2.5 were similar (Figure 7b,e). Because the numbers and activity of trucks were greater than those of the machines, the emissions were much higher. In addition, Shanghai is greatly affected by monsoons in the summer. Due to the influence of the monsoons, there could be a rapid spread of pollutants above most of the terminals located along the coast of the water-facing side, so the concentration was not high. The route of the trucks was generally inland, and the diffusion was slower than that of the machinery on the docks. In addition, the total emissions of trucks were 5–11 times those of the machinery. Therefore, the concentration of pollutants was higher along the main traffic route, including the suburban loop, outer loop, G60 Shanghai-Kunming Expressway and S2 Hulu Expressway. These traffic routes all converged near the Waigaoqiao port area, which guaranteed the heavy burden of freight transportation in Waigaoqiao, but also caused the maximum contribution of pollutants to be approximately 30.395 μg/m3 for NOX and approximately 1.346 μg/m3 for PM2.5. For NOX, the concentrations along the main roads were essentially 5–10 μg/m3, while the concentrations in other regions were mostly less than 5.0 μg/m3. For PM2.5, the concentrations along the main roads were essentially 0.2–0.4 μg/m3, while the concentrations in other regions were mostly less than 0.2 μg/m3.
The contribution of the pollutant concentrations varied greatly in the different seasons (Figure 7c–f). Due to the influence of the summer monsoon derived from the sea, the pollutants spread to the interior areas in the summer. In addition, the high wind speed of the summer monsoon brings a high diffusion rate of pollutants. Therefore, the impact of air quality from port-related sources was relatively small in the case of summer, with peaks of 30.4 μg/m3 for NOX (Figure 7c) and 1.35 μg/m3 for PM2.5 (Figure 7e). In contrast, Shanghai is influenced by monsoons from the interior areas during the winter, so pollutants spread to the southeastern coastal areas. Moreover, the relatively low wind speed and wet deposition reduced the diffusion of contaminants. Therefore, even if the cargo volume in the summer was higher than that in the winter, the impact of air quality from the port-related sources in the winter was higher than that in the summer in this study. The peak of NOX was 55.8 μg/m3 (Figure 7d) and the peak of PM2.5 was 2.14 μg/m3 (Figure 7f), both of which were recorded in the Waigaoqiao area.
Generally, the impact of air quality differed by location with respect to the proportion in all industries. Near the large-scale ports such as Waigaoqiao port and the Yangshan deep-water port, compared with other industries, the port industry is relatively well developed. Therefore, the impact on air quality was greater from port-related sources than from other sources. As shown in Figure 8, it can be seen that in the port areas such as Waigaoqiao and Yangshan, the relative contributions of pollutant concentrations (i.e., the proportion in the whole industry) were large. For the average annual contribution of NOX, the peak near Waigaoqiao reached 36.7% (Figure 8a), while the peak of PM2.5 reached 3.08% (Figure 8d). Similarly, the relative contribution along the main road of Shanghai traffic was also significant, especially along the route leading to Waigaoqiao and Yangshan. The relative contribution of NOX at these traffic routes was approximately 25%, while the relative contribution of PM2.5 was approximately 1.5%.
The seasonal differences in relative contributions were also obvious. For NOX, due to the influence of the summer monsoon on the spread of pollutants, the relative contribution of concentration in the summer was lower than that in the winter (Figure 8b,c). However, the relative contribution of the S2 Hulu Expressway was higher in the summer than in the winter. This situation might be caused by the higher content of NOX in the exhaust emissions of external container trucks as compared to those of other sources. In addition, freight transportation in the summer was more frequent than that in the winter, resulting in the high-density discharge from trucks on the Hulu Expressway. For PM2.5, the important role of the summer monsoon on the diffusion can be clearly seen in Figure 8e. Moreover, due to the large amount of ground dust produced by other industries, such as construction, the relative contribution of port-related PM2.5 was relatively small and was mainly concentrated within the dense traffic routes of external container trucks, including the suburban loop, outer loop, G60 Shanghai-Kunming Expressway and S2 Hulu Expressway (Figure 8e,f).

4. Discussions

Our study of port-related emission inventories and environmental impact has suggested the importance of cleaner energy in the future. Clean energy, such as LNG and electricity, did not constitute a major portion of the energy structure in port-related activities in 2015. There is still some room for further improvements in optimizing the energy structure. The type of energy power at the port terminal has the most direct impact on the air pollutant emissions in a port area. The energy driving cargo-handling equipment, especially the horizontal transporting machines, should be changed from predominantly diesel fuel to predominantly electricity and LNG. Otherwise, the fuel quality of the diesel needs to be improved. Moreover, the proportion of clean energy, such as solar energy, wind energy and tidal energy, in the use of onshore electricity usage should be increased. With regard to the external container trucks, the energy use can be improved through the conversion of diesel oil to electricity hybrid and pure electric.
For the two different port-related sources, the emissions and environmental impacts of external container trucks occupied a prominent position. This is because the volume of external container trucks was large. In addition, the activity area and activity intensity of the external container trucks was much larger than those of the cargo-handling equipment. According to the impacts of port-related pollution on air quality in Shanghai, the proportions of terminals and main roads are more prominent due to the dense emissions in these areas. Therefore, besides the improvement of the energy structure, the control of the emissions of the external container trucks can be achieved through gradual policy development and the phasing out of vehicles with high energy consumption and high pollution levels, through the restriction of emission standards.
More importantly, the current major way to deliver shipping freight from port to city is by land trucks burning diesel oils, which contribute largely to air pollution in surrounding highway areas. In addition, the efficiency of truck transportation is relatively low. Previous studies [11,33] have shown that the conversion of land transportation to railway and waterway for multimodal transportation can effectively reduce the atmospheric pollution caused by external container trucks. There are large spaces for the use of railways or coasts and river waterways for freight transportation, which could significantly reduce the emissions from external port-related cargo delivery trucks if used. Therefore, the scale of railway transportation and waterway transportation must be gradually expanded and the proportion of land transportation reduced.

5. Conclusions

A systematic port-related emission inventory was constructed for the port of Shanghai, which included the port itself and the freight delivery land trucks outside the port. Diesel fuel dominated the fuel type of the machines and cargo delivery trucks in 2015. The emissions of NOX, CO, VOCS, PM10 and PM2.5 from port-related sources were 19,814.14 t, 7049.77 t, 1357.33 t, 772.55 t and 699 t. Among all port-related sources, external container trucks generally produce more pollution than cargo-handling equipment. For NOX, CO, VOCS and PM2.5, the external port-related trucks accounted for 90.9%, 75.3%, 83.6%, 92.0% and 91.6%.
Therefore, the annual emissions of different air pollutants were approximately 5 to 11 times that of the cargo-handling equipment. Under these circumstances, the environmental impact of pollution on air quality along the main city arteries was significantly higher than that in other areas in all cases in our research. Furthermore, in terms of the concentrations of air pollutants, the nearby port areas close to the main roads with container cargo traffic suffered most severely from port-related emissions. In this area, the average annual peak concentration of NOX was approximately 30.40 μg/m3, accounting for 36.7% of all anthropogenic sources, while the peak of PM2.5 was approximately 1.346 μg/m3, accounting for 3%.
Overall, the study implied it was necessary to promote the implementation of a combined green port policy in Shanghai, which could be made possible in the near future by optimizing the cargo delivery system from port to city and the energy structure used in the port, also by adding real-time monitoring systems to manage energy consumption and air pollutant emissions. Future green-port-related researches can focus on the following aspects: (1) To improve the energy structure of the port-related sources and reduce the usage of diesel oil; (2) To improve the choices of multimodal transport and explore the feasibility of railway and waterway transit; (3) To get access to the establishment of a monitoring system with high spatial and temporal resolution of the port areas.

Author Contributions

Conceptualization, Y.Z. (Yan Zhang); Data curation, Y.Z. (Yuyan Zhou), J.L., J.F., C.H. and W.G.; Formal analysis, Y.Z. (Yuyan Zhou), Y.Z. (Yan Zhang), S.L. and J.F.; Investigation, Y.Z. (Yuyan Zhou), Y.Z. (Yan Zhang), D.M., J.L., S.L., C.H., W.G. and H.Z.; Methodology, Y.Z. (Yuyan Zhou), D.M., J.L., J.F. and C.H.; Project administration, Y.Z. (Yan Zhang); Resources, D.M., J.L., W.L., Y.F., W.G. and H.Z.; Software, S.L. and J.F.; Supervision, Y.Z. (Yan Zhang); Writing—original draft, Y.Z. (Yuyan Zhou); Writing—review & editing, Y.Z. (Yan Zhang), D.M., J.L., W.L., Y.F., C.H., W.G. and H.Z. All authors have read and agree to the published version of the manuscript.

Funding

This research was funded by the National Natural Science Foundation of China, grant number 21677038, and the Major Program of the Shanghai Committee of Science and Technology, China (17DZ120290; No. 19DZ1205009).

Acknowledgments

We want to thank the Shanghai Traffic Management Office for the investigated data and valuable advice. The opinions expressed in this article are the author’s own and do not reflect the view of author affiliations.

Conflicts of Interest

The authors declare no conflicts of interest. The funders had no role in the design of the study; in the collection, analyses, or interpretation of data; in the writing of the manuscript, or in the decision to publish the results.

Appendix A

Table A1: Selecting principles for cargo-handling equipment emission factors, Table A2: The emission factors of external container trucks.
Table A1. Selecting principles for cargo-handling equipment emission factors.
FirstSecondThirdFourth
Grading standardMachine typeFuel typeRated power
(kw)
Emission standard
GradingForklift
Vehicles
Hoisting machinery
Towing tractor
Other industrial machinery
Diesel
Gasoline
LNG
LPG
Electricity
Other fuel type
≤19
(19,37)
[37,56)
[56,75)
[75,130)
[130,560)
≥560
China 0
China 1
China 2
China 3
China 4
China 5
Table A2. The emission factors of external container trucks.
Emission StandardAir PollutantEmission Factor (g/km)
China 1CO0.00
China 2CO0.00
China 3CO4.40
China 4CO2.50
China 5CO2.50
China 1VOCS0.00
China 2VOCS0.00
China 3VOCS1.16
China 4VOCS0.72
China 5VOCS0.72
China 1NOX0.00
China 2NOX0.00
China 3NOX15.88
China 4NOX13.77
China 5NOX11.72
China 1PM2.50.00
China 2PM2.50.00
China 3PM2.50.77
China 4PM2.50.42
China 5PM2.50.26
China 1PM100.00
China 2PM100.00
China 3PM100.85
China 4PM100.46
China 5PM100.29
China 1CO20.00
China 2CO20.00
China 3CO2894.17
China 4CO2894.17
China 5CO2894.17

References

  1. Chen, S. The Research on Evaluation of Green Port in Shanghai Port. Master’s Thesis, Nanchang University, Nanchang, China, 2016. [Google Scholar]
  2. Li, J.B.; Oh, Y.S. A Research on Competition and Cooperation Between Shanghai Port and Ningbo-Zhoushan Port. Asian J. Shipp. 2010, 26, 67–91. [Google Scholar] [CrossRef] [Green Version]
  3. Mou, N.; Wang, C.; Yang, T.; Zhang, L. Evaluation of Development Potential of Ports in the Yangtze River Delta Using FAHP-Entropy Model. Sustainability 2020, 12, 493. [Google Scholar] [CrossRef] [Green Version]
  4. Ren, J.; Dong, L.; Sun, L. Competitiveness prioritisation of container ports in Asia under the background of China’s Belt and Road initiative. Transp. Rev. 2018, 38, 436–456. [Google Scholar] [CrossRef]
  5. Johnson, T.; Rogan, E.; Pope, J. 2005 Green Port Annual Report; Maryland Port Administration: Baltimore, MD, USA, 2005.
  6. Cannon, C.; Tomley, H. San Pedro Bay Ports Clean Air Action Plan 2017; Port of Los Angeles: San Pedro, CA, USA, 2017. [Google Scholar]
  7. Bonner, A.; Snedden, P.; Mayson, J.; Haydon, S.; Smith, K.; Osborne, B. Ports of Auckland Annual Report 2017; Ports of Auckland Limited: Auckland, New Zealand, 2017. [Google Scholar]
  8. Madalin, A.; Alina, M.; Daniela, S.; Ambroziu, D.; Ciprian, H. Annual Report—Port of Constanta 2015; Port of Constanta: Constanta, Romania, 2015. [Google Scholar]
  9. Gonzalez Aregall, M.; Bergqvist, R.; Monios, J. A global review of the hinterland dimension of green port strategies. Transp. Res. Part D Transp. Environ. 2018, 59, 23–34. [Google Scholar] [CrossRef]
  10. Yong, L.U.; Hao, H.U. Sydney Port′s Practice in Green Port Development and China′s Inspiration from it. Navig. China 2009, 32, 72–75. [Google Scholar]
  11. Han, C.H. Air Pollution Reduction Strategies of World Major Ports. Int. Commer. Law Rev. 2010, 48, 27–56. [Google Scholar]
  12. Qin, C. Discussion on Setting up the Area of International Ship Emission Control Area in China. Energy Conserv. Environ. Prot. Transp. 2018, 14, 25–28. [Google Scholar]
  13. Li, Y.; Zhang, X.; Lin, K.; Huang, Q. The Analysis of a Simulation of a Port–City Green Cooperative Development, Based on System Dynamics: A Case Study of Shanghai Port, China. Sustainability 2019, 11, 5948. [Google Scholar] [CrossRef] [Green Version]
  14. Han, C.H. Green Port Strategies for Reducing Air Pollution in Port of Incheon. J. Korea Port Econ. Assoc. 2011, 27, 281–304. [Google Scholar]
  15. Peng, C.Y.; Lin, C.G.; Jong, T.C. Emissions of particulate and gaseous pollutants within the Keelung harbor region of Taiwan. Environ. Monit. Assess. 2005, 109, 37–56. [Google Scholar] [CrossRef]
  16. Li, Z.; Feng, C.J.; Ya, D.J. Air Pollution and Control of Cargo Handling Equipments in Ports. In Proceedings of the 2018 International Conference on Green Energy and Environment Engineering, Kitahiroshima, Japan, 27–29 August 2018; Wang, Y., Ed.; E D P Sciences: Les Ulis, France, 2019; Volume 93. [Google Scholar]
  17. Isakov, V.; Barzyk, T.; Arunachalam, S.; Snyder, M.; Venkatram, A. A Community-Scale Modeling System to Assess Port-Related Air Quality Impacts; Springer Int Publishing Ag: Cham, Switzerland, 2016; pp. 385–390. [Google Scholar]
  18. Arunachalam, S.; Brantley, H.; Barzyk, T.M.; Hagler, G.; Isakov, V.; Kimbrough, E.S.; Naess, B.; Rice, N.; Snyder, M.G.; Talgo, K.; et al. Assessment of port-related air quality impacts: Geographic analysis of population. Int. J. Environ. Pollut. 2015, 58, 231–250. [Google Scholar] [CrossRef]
  19. International, I. Current Methodologies in Preparing Mobile Source Port-Related Emission Inventories. In Final Report for US Environmental Protection Agency; US Environmental Protection Agency: Washington, DC, USA, 2009. [Google Scholar]
  20. Li, D.; Wu, Y.; Zhou, Y.; Du, X.; Fu, L. Fuel Consumption and Emission Inventory of Typical Construction Equipments in China. Chin. J. Environ. Sci. 2012, 33, 518–524. [Google Scholar]
  21. Samaras, Z.; Zierock, K.H. OFF-ROAD VEHICLES—A COMPARISON OF EMISSIONS WITH THOSE FROM ROAD TRANSPORT. Sci. Total Environ. 1995, 169, 249–255. [Google Scholar] [CrossRef]
  22. Agrawal, A.; Aldrete, G.; Anderson, B.; Muller, R.; Ray, J. Inventory of Air Emissions for Calendar Year 2013; Starcrest: Longbeach, CA, USA, 2014. [Google Scholar]
  23. Fu, M.; Ge, Y.; Tan, J.; Zeng, T.; Liang, B. Characteristics of typical non-road machinery emissions in China by using portable emission measurement system. Sci. Total Environ. 2012, 437, 255–261. [Google Scholar] [CrossRef]
  24. Zhang, Y.; Peng, Y.-Q.; Wang, W.; Gu, J.; Wu, X.-J.; Feng, X.-J. Air emission inventory of container ports’ cargo handling equipment with activity-based “bottom-up” method. Adv. Mech. Eng. 2017, 9, 1–9. [Google Scholar] [CrossRef] [Green Version]
  25. Shon, Z.-H. Emissions of Ozone Precursors from a Biogenic Source and Port-related Sources in the Largest Port City of Busan, Korea. Asian J. Atmos. Environ. 2015, 9, 39–47. [Google Scholar] [CrossRef] [Green Version]
  26. Kean, A.J.; Sawyer, R.F.; Harley, R.A. A fuel-based assessment of off-road diesel engine emissions. J. Air Waste Manag. Assoc. 2000, 50, 1929–1939. [Google Scholar] [CrossRef]
  27. Tan, H.; Liu, J.; Shen, Y.; Fang, Y. Emission Inventory of Air Pollutants from Cargo Handling Equipments. Environ. Sci. Manag. 2013, 38, 82–87. [Google Scholar]
  28. Fan, X.; Xia, Z.; Li, C. An Improved Method for Building an Emission Inventory for Cargo Handling Equipment and Its Application. Res. Environ. Sci. 2017, 30, 628–635. [Google Scholar]
  29. Dragović, B.; Tzannatos, E.; Tselentis, V.; Meštrović, R.; Škurić, M. Ship emissions and their externalities in cruise ports. Transp. Res. Part D Transp. Environ. 2018, 61, 289–300. [Google Scholar] [CrossRef]
  30. Huang, L.; Wen, Y.; Geng, X.; Zhou, C.; Xiao, C. Integrating multi-source maritime information to estimate ship exhaust emissions under wind, wave and current conditions. Transp. Res. Part D Transp. Environ. 2018, 59, 148–159. [Google Scholar] [CrossRef]
  31. López-Aparicio, S.; Tønnesen, D.; Thanh, T.N.; Neilson, H. Shipping emissions in a Nordic port: Assessment of mitigation strategies. Transp. Res. Part D Transp. Environ. 2017, 53, 205–216. [Google Scholar] [CrossRef]
  32. Smailys, V.; Rapalis, P.; Strazdauskiene, R.; Esmantaite, V.; Kaunas University Technology Press. Air Pollution by NOx from Ships Passing Klaipeda Port Channel. In Transport Means 2013; Kaunas University Technology Press: Kaunas, Lithuania, 2013; pp. 97–100. [Google Scholar]
  33. Bailey, D.; Solomon, G. Pollution prevention at ports: Clearing the air. Environ. Impact Assess. Rev. 2004, 24, 749–774. [Google Scholar] [CrossRef]
  34. Feng, J.; Zhang, Y.; Li, S.; Mao, J.; Patton, A.P.; Zhou, Y.; Ma, W.; Liu, C.; Kan, H.; Huang, C.; et al. The influence of spatiality on shipping emissions, air quality and potential human exposure in the Yangtze River Delta/Shanghai, China. Atmos. Chem. Phys. 2019, 19, 6167–6183. [Google Scholar] [CrossRef] [Green Version]
  35. Lu, J.; Huang, C.; Hu, Q.-Y.; Yang, Q.; Jing, B.L.; Xia, Y.; Lu, B.; Tang, W.; Lou, S.R.; Tao, S.K.; et al. Air Pollutant Emission Inventory of Non-road Machineries in Typical Cities in Eastern China. Environ. Sci. 2017, 38, 2738–2746. [Google Scholar]
  36. Xie, Y.; Ji, W. The Study of Factors Affecting the Limits in the Standard of Non-road Diesel Engine Fuel Consumption Limits. Diesel Engine 2010, 32, 1–4. [Google Scholar]
  37. Xu, J.; Feng, X.; Jiang, L. Research of Air Pollutants from Cargo Handling Equipments. J. East China Jiaotong Univ. 2014, 31, 12–17. [Google Scholar]
  38. Fan, Q.; Zhang, Y.; Ma, W.; Ma, H.; Feng, J.; Yu, Q.; Yang, X.; Ng, S.K.; Fu, Q.; Chen, L. Spatial and Seasonal Dynamics of Ship Emissions over the Yangtze River Delta and East China Sea and Their Potential Environmental Influence. Environ. Sci. Technol. 2016, 50, 1322–1329. [Google Scholar] [CrossRef]
  39. Jalkanen, J.P.; Brink, A.; Kalli, J.; Pettersson, H.; Kukkonen, J.; Stipa, T. A modelling system for the exhaust emissions of marine traffic and its application in the Baltic Sea area. Atmos. Chem. Phys. 2009, 9, 9209–9223. [Google Scholar] [CrossRef] [Green Version]
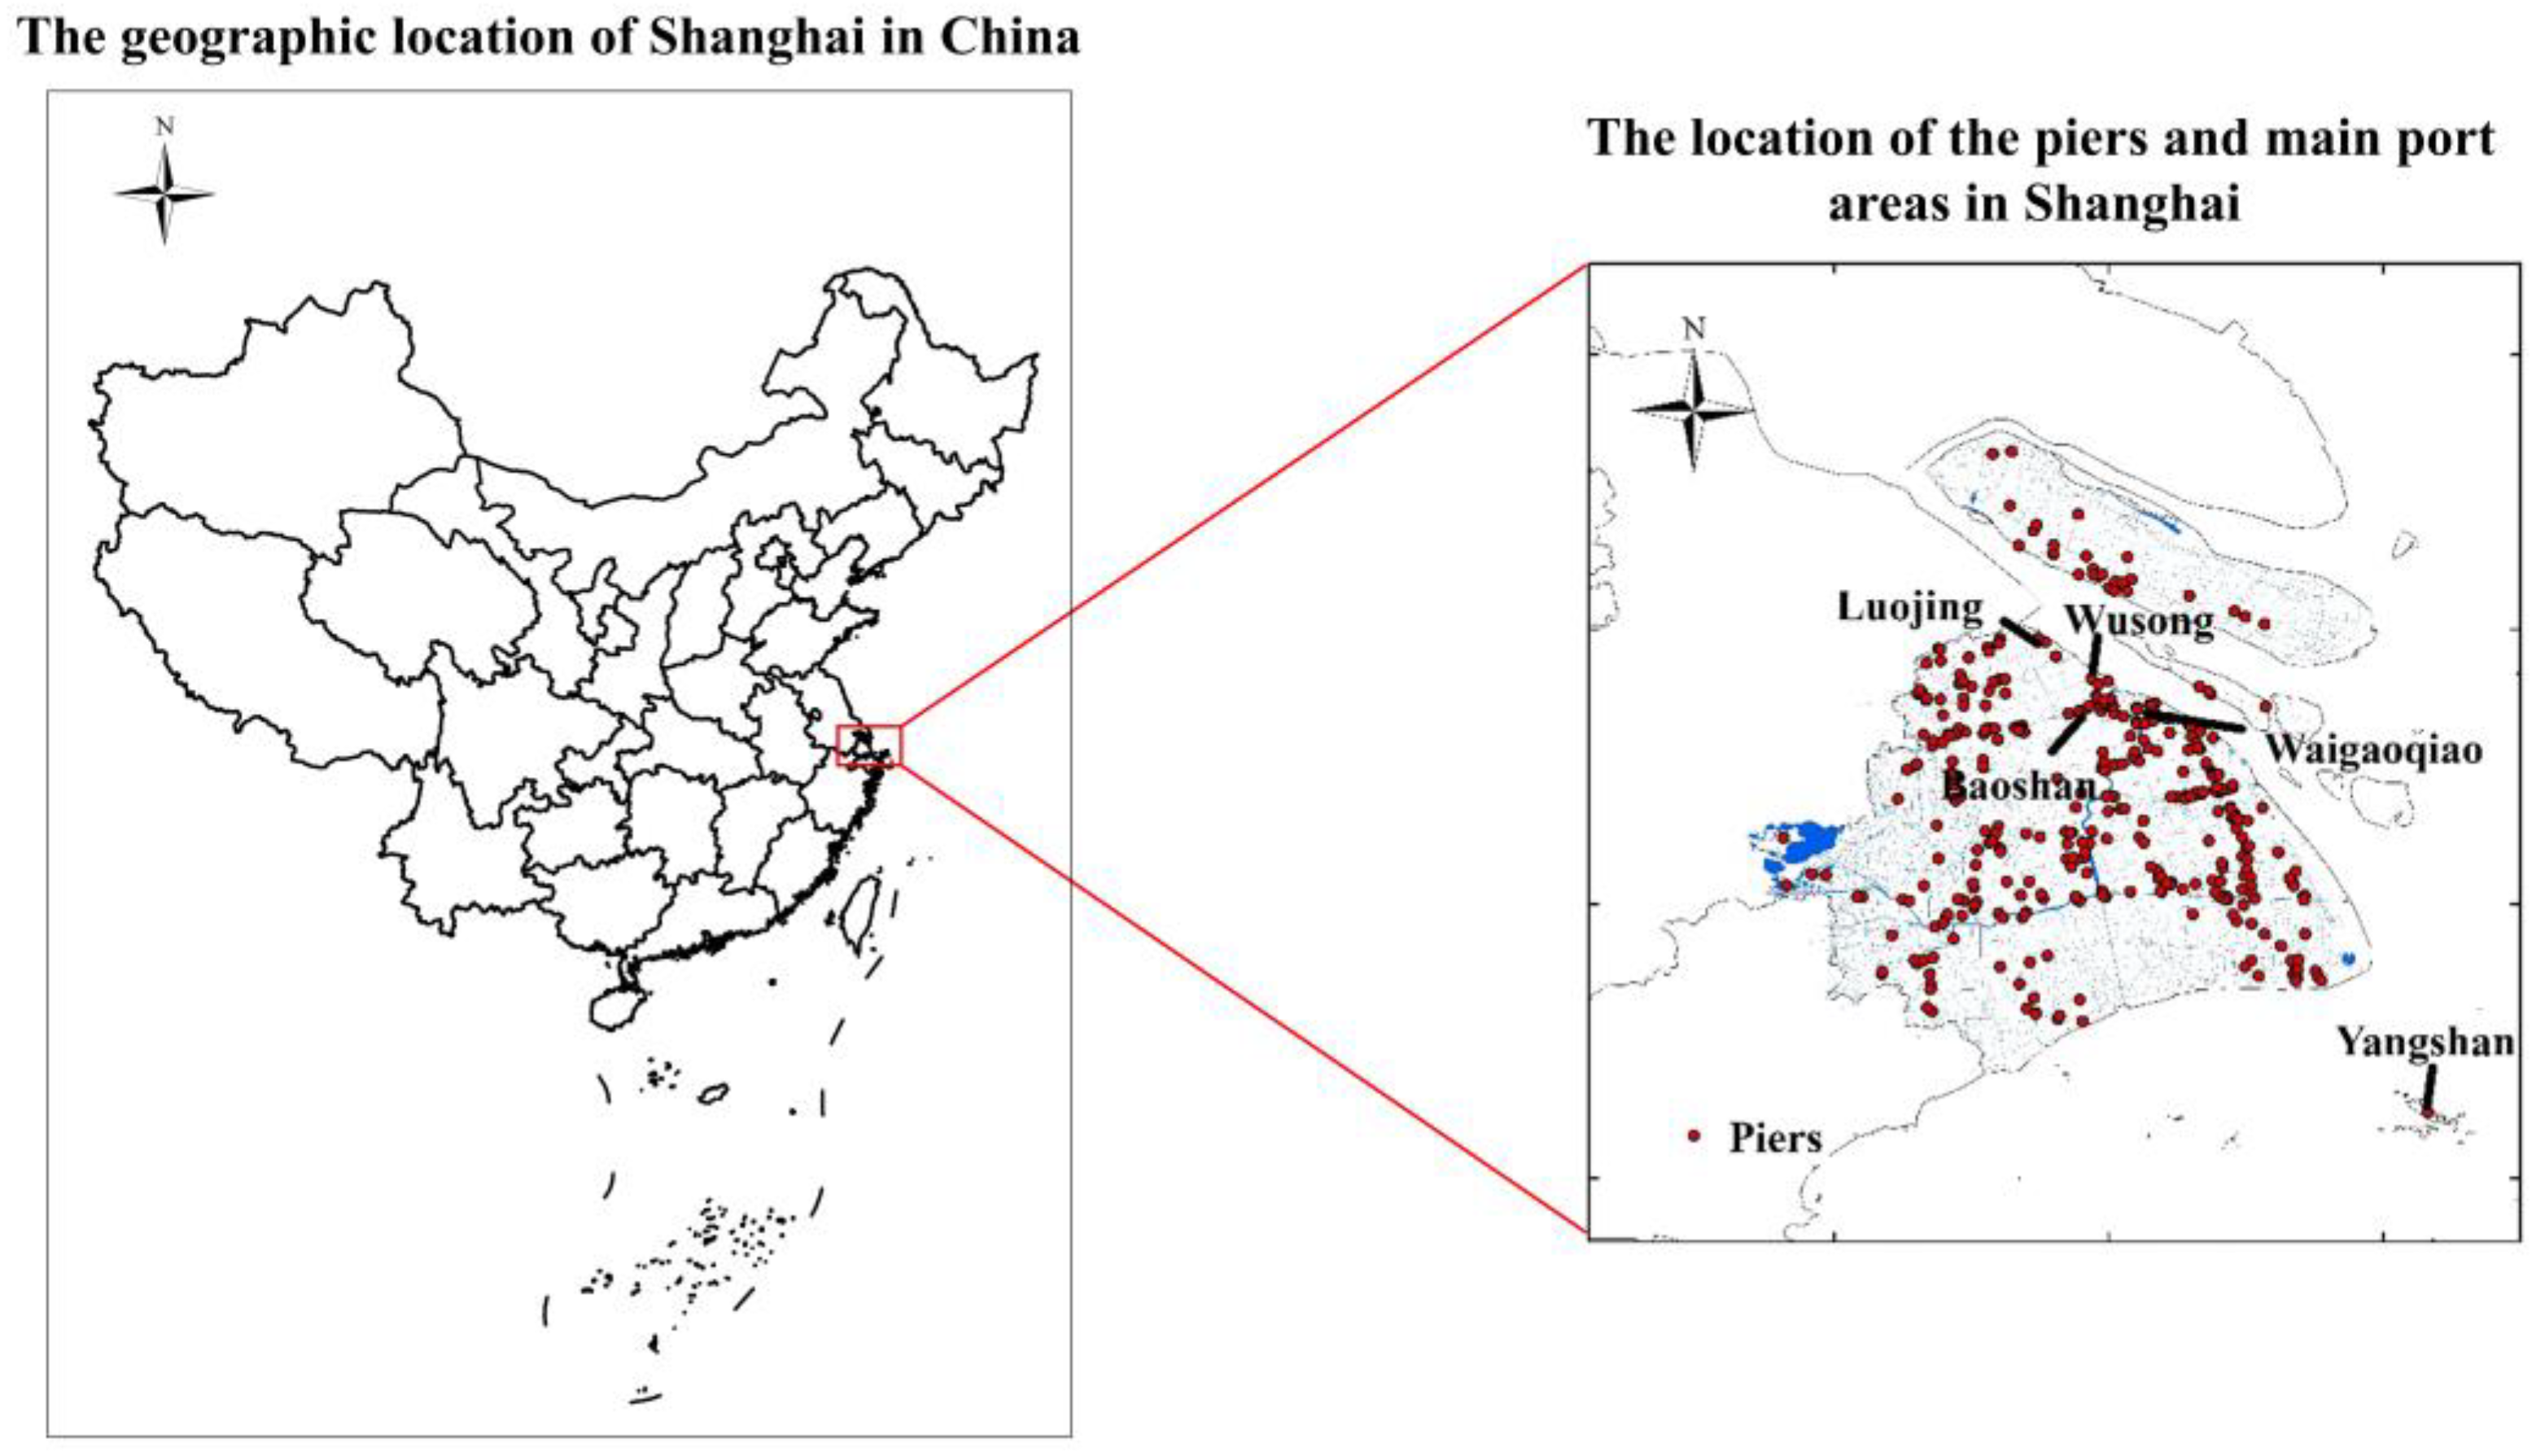
Figure 1. The study area, including Shanghai Inland Area, Chongming Island, Changxing Island and Yangshan Deep Water Port. The latitude and longitude range from 120.5° E to 122.3° E and 30.5° N to 32° N.
Sustainability 12 04162 g001
Figure 2. The summary of the basic parameters and the proportion of the fuel consumption rate of the cargo-handling equipment in 2015: (a) Machine type; (b) Fuel type; (c) Machine rated power; (d) Machine emission standard; (e) Machine fuel consumption; (f) Machine fuel consumption rate.
Sustainability 12 04162 g002
Figure 3. Emission contribution of different machine types in 2015 in the port of Shanghai.
Sustainability 12 04162 g003
Figure 4. The spatial distribution of cargo-handling equipment volume, fuel consumption and emission flux: (a) cargo-handling equipment volume; (b) fuel consumption; (c) SO2; (d) NOX; (e) CO; (f) VOCS; (g) PM; (h) PM10; (i) PM2.5; (j) CO2; (k) BC; (l) OC. The emission flux is given as t.
Sustainability 12 04162 g004
Figure 5. The spatial distribution of external port-related container trucks emissions: (a) CO; (b) NOX; (c) PM2.5; (d) PM10; (e) VOCS. The emission flux is given as t.
Sustainability 12 04162 g005
Figure 6. The total emission fluxes of port-related sources in Shanghai: (a) The emission contribution of cargo-handling equipment and external container trucks and their share in all pollution sources in Shanghai (%); (b) The spatial distribution of annual NOX emission from all industries in Shanghai (t).
Sustainability 12 04162 g006
Figure 7. The simulated concentrations of NOX and PM2.5 contributed by port-related sources in Shanghai: (a) Simulated NOX concentrations for annual average; (b) Simulated NOX concentrations in summer; (c) Simulated NOX concentrations in winter; (d) Simulated PM2.5 concentrations for annual average; (e) Simulated PM2.5 concentrations in summer; (f) Simulated PM2.5 concentrations in winter. The concentrations are given as μg/m3.
Sustainability 12 04162 g007
Figure 8. The proportions of port-related sources in all industries in Shanghai: (a) NOX for annual average; (b) NOX in summer; (c) NOX in winter; (d) PM2.5 for annual average; (e) PM2.5 in summer; (f) PM2.5 in winter. The proportions are given as %.
Sustainability 12 04162 g008
Table 1. Emission inventory from different types of cargo-handling equipment in port.
In-Port Sources of PollutionForkliftVehiclesOther Industrial MachineryHoisting MachineryTowing TractorTotal of MachineriesExternal Container Trucks
Holding volume1274.00232.00882.0078.001444.003910.00
Fuel consumption/t7743.54876.6713,848.271185.8121,921.2345,575.51
Emission/tSO24.200.477.280.249.7021.88
NOX372.2448.49621.4740.59728.421811.2218,002.9
CO122.7432.90286.41179.751119.911741.725308.05
VOCS31.789.3356.4313.89111.32222.761134.57
PM17.531.8923.660.7017.7461.52
PM1017.531.8023.660.7017.7461.43711.12
PM2.516.661.7422.480.6716.8758.41640.59
CO224,459276643,558344167,581141,805
BC9.490.3912.810.383.7326.80
OC3.000.284.050.122.6310.07