Mapping Climate Vulnerability of River Basin Communities in Tanzania to Inform Resilience Interventions

 ,
,  , , , and
Abstract
1. Introduction
- Focus: vulnerability of basin communities to climate stressors
- Valued attribute: water and food security, health and general wellbeing
- Climate stressors: variability and changes in rainfall and increasing temperatures that threaten social systems
- Temporal reference: historical period of 1981–2017
2. Materials and Methods
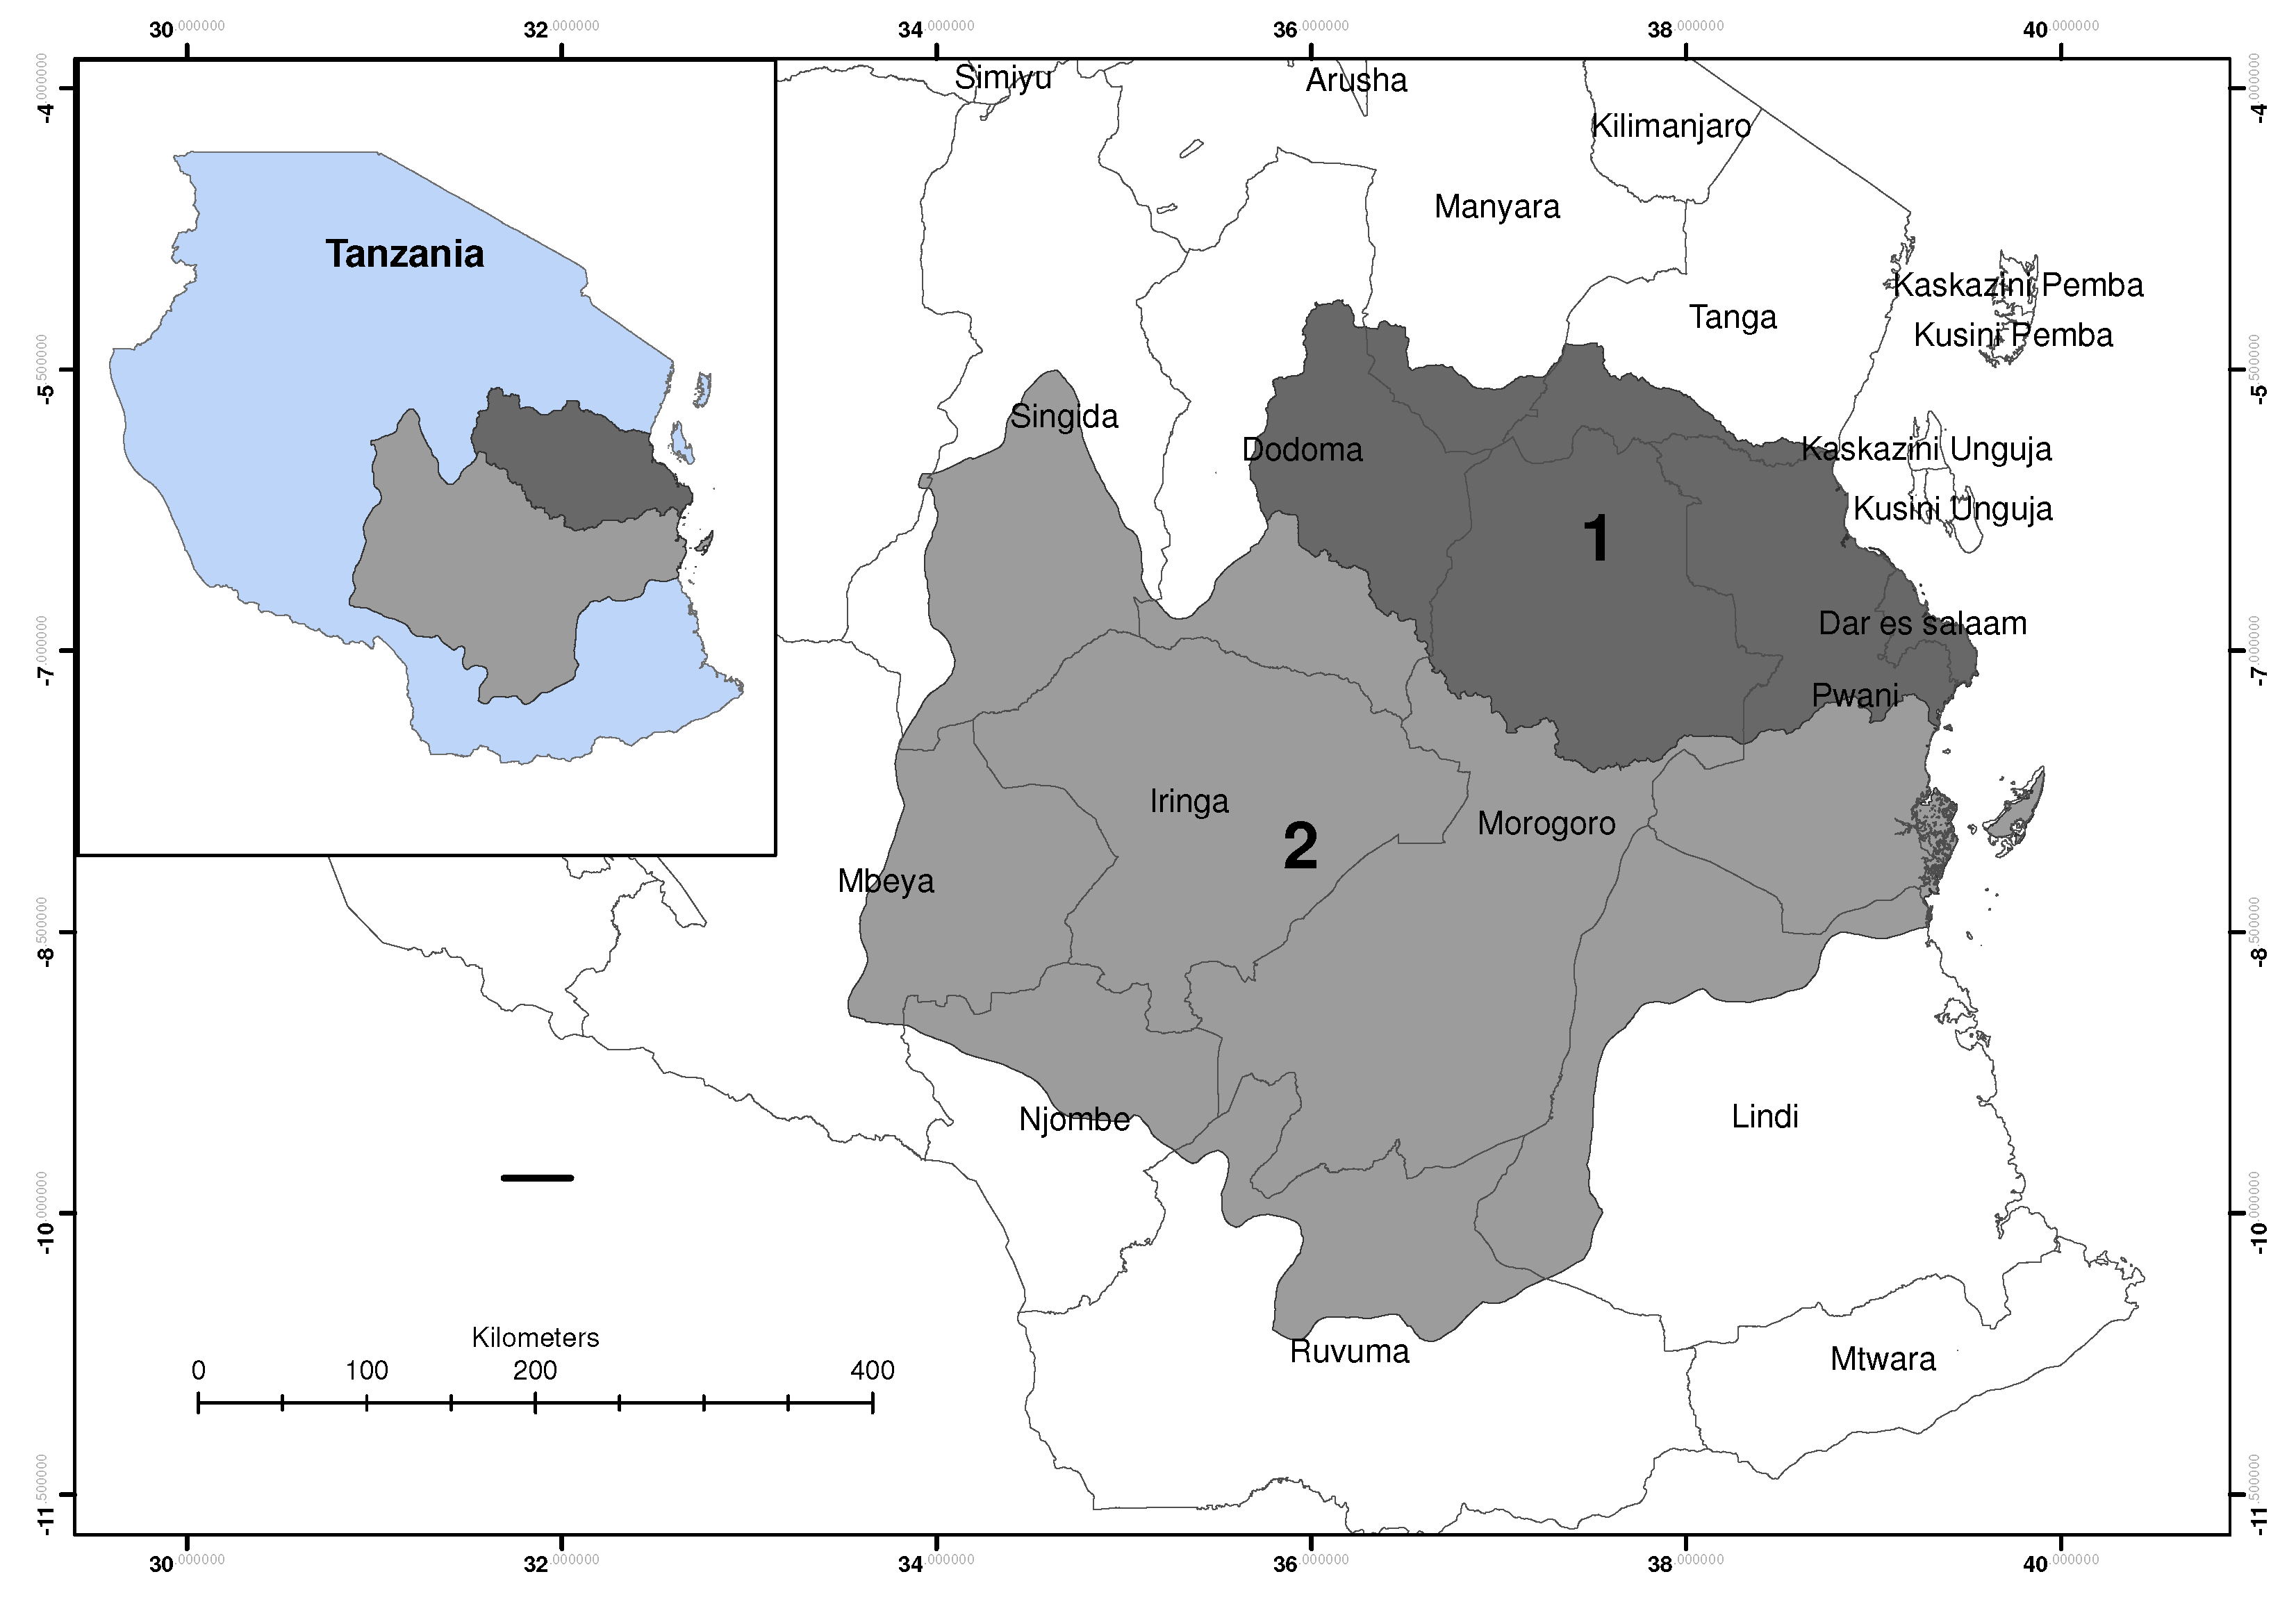
2.1. Description of the Study Area
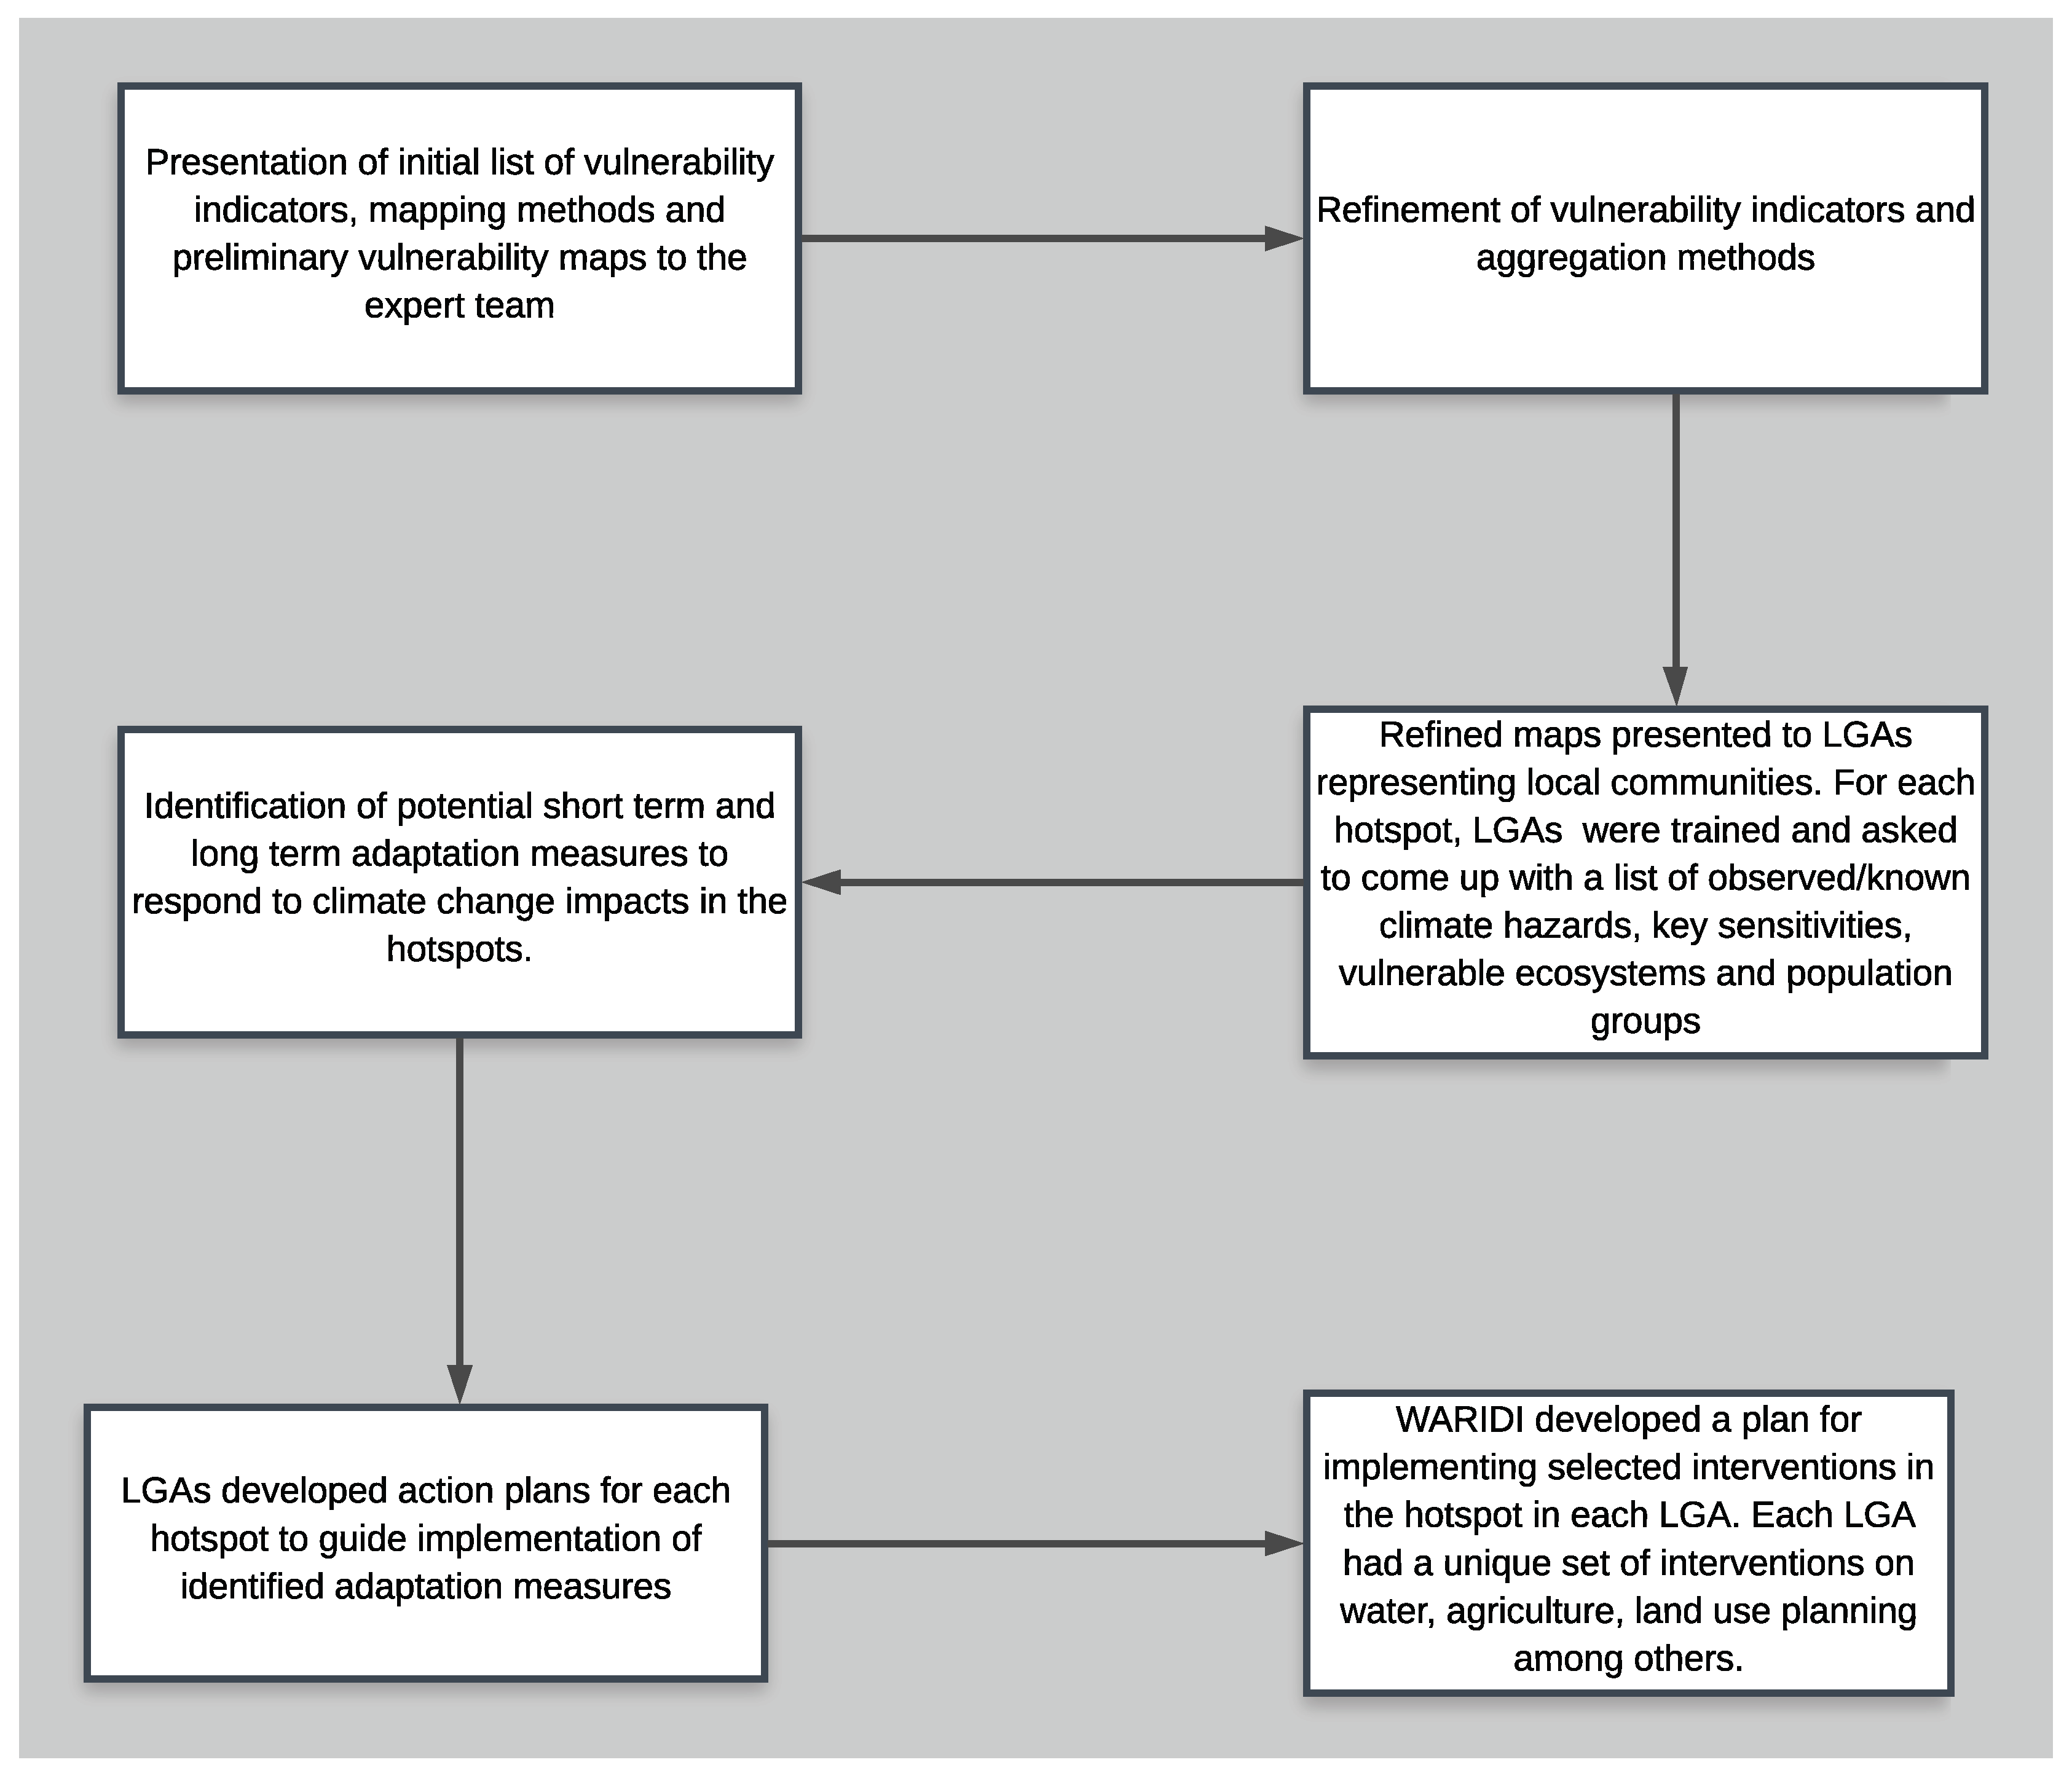
2.2. Stakeholder Engagement
2.3. Vulnerability Mapping
2.3.1. Data Sources and Indicator Selection
- Availability and accessibility: The study used data that were available and accessible at the time of analysis.
- Conceptual proximity to the component being measured: Data had to be associated with one of the three components of vulnerability and the scope of the vulnerability mapping.
- Spatial resolution: Gridded data had to have high resolution (≤5 km) while socioeconomic data from household surveys had to be disaggregated to ward level and not larger than a district.
- Timeliness of most recent acquisition: Climate data had to cover the period 1981–2017 while environmental and socioeconomic data had to be 10 years old or less.
- Reliability and validity: Data had to be consistently representative and accurate for each indicator.
2.3.2. Aggregation of Vulnerability Indicators
2.3.3. Validation of Vulnerability Maps
3. Results
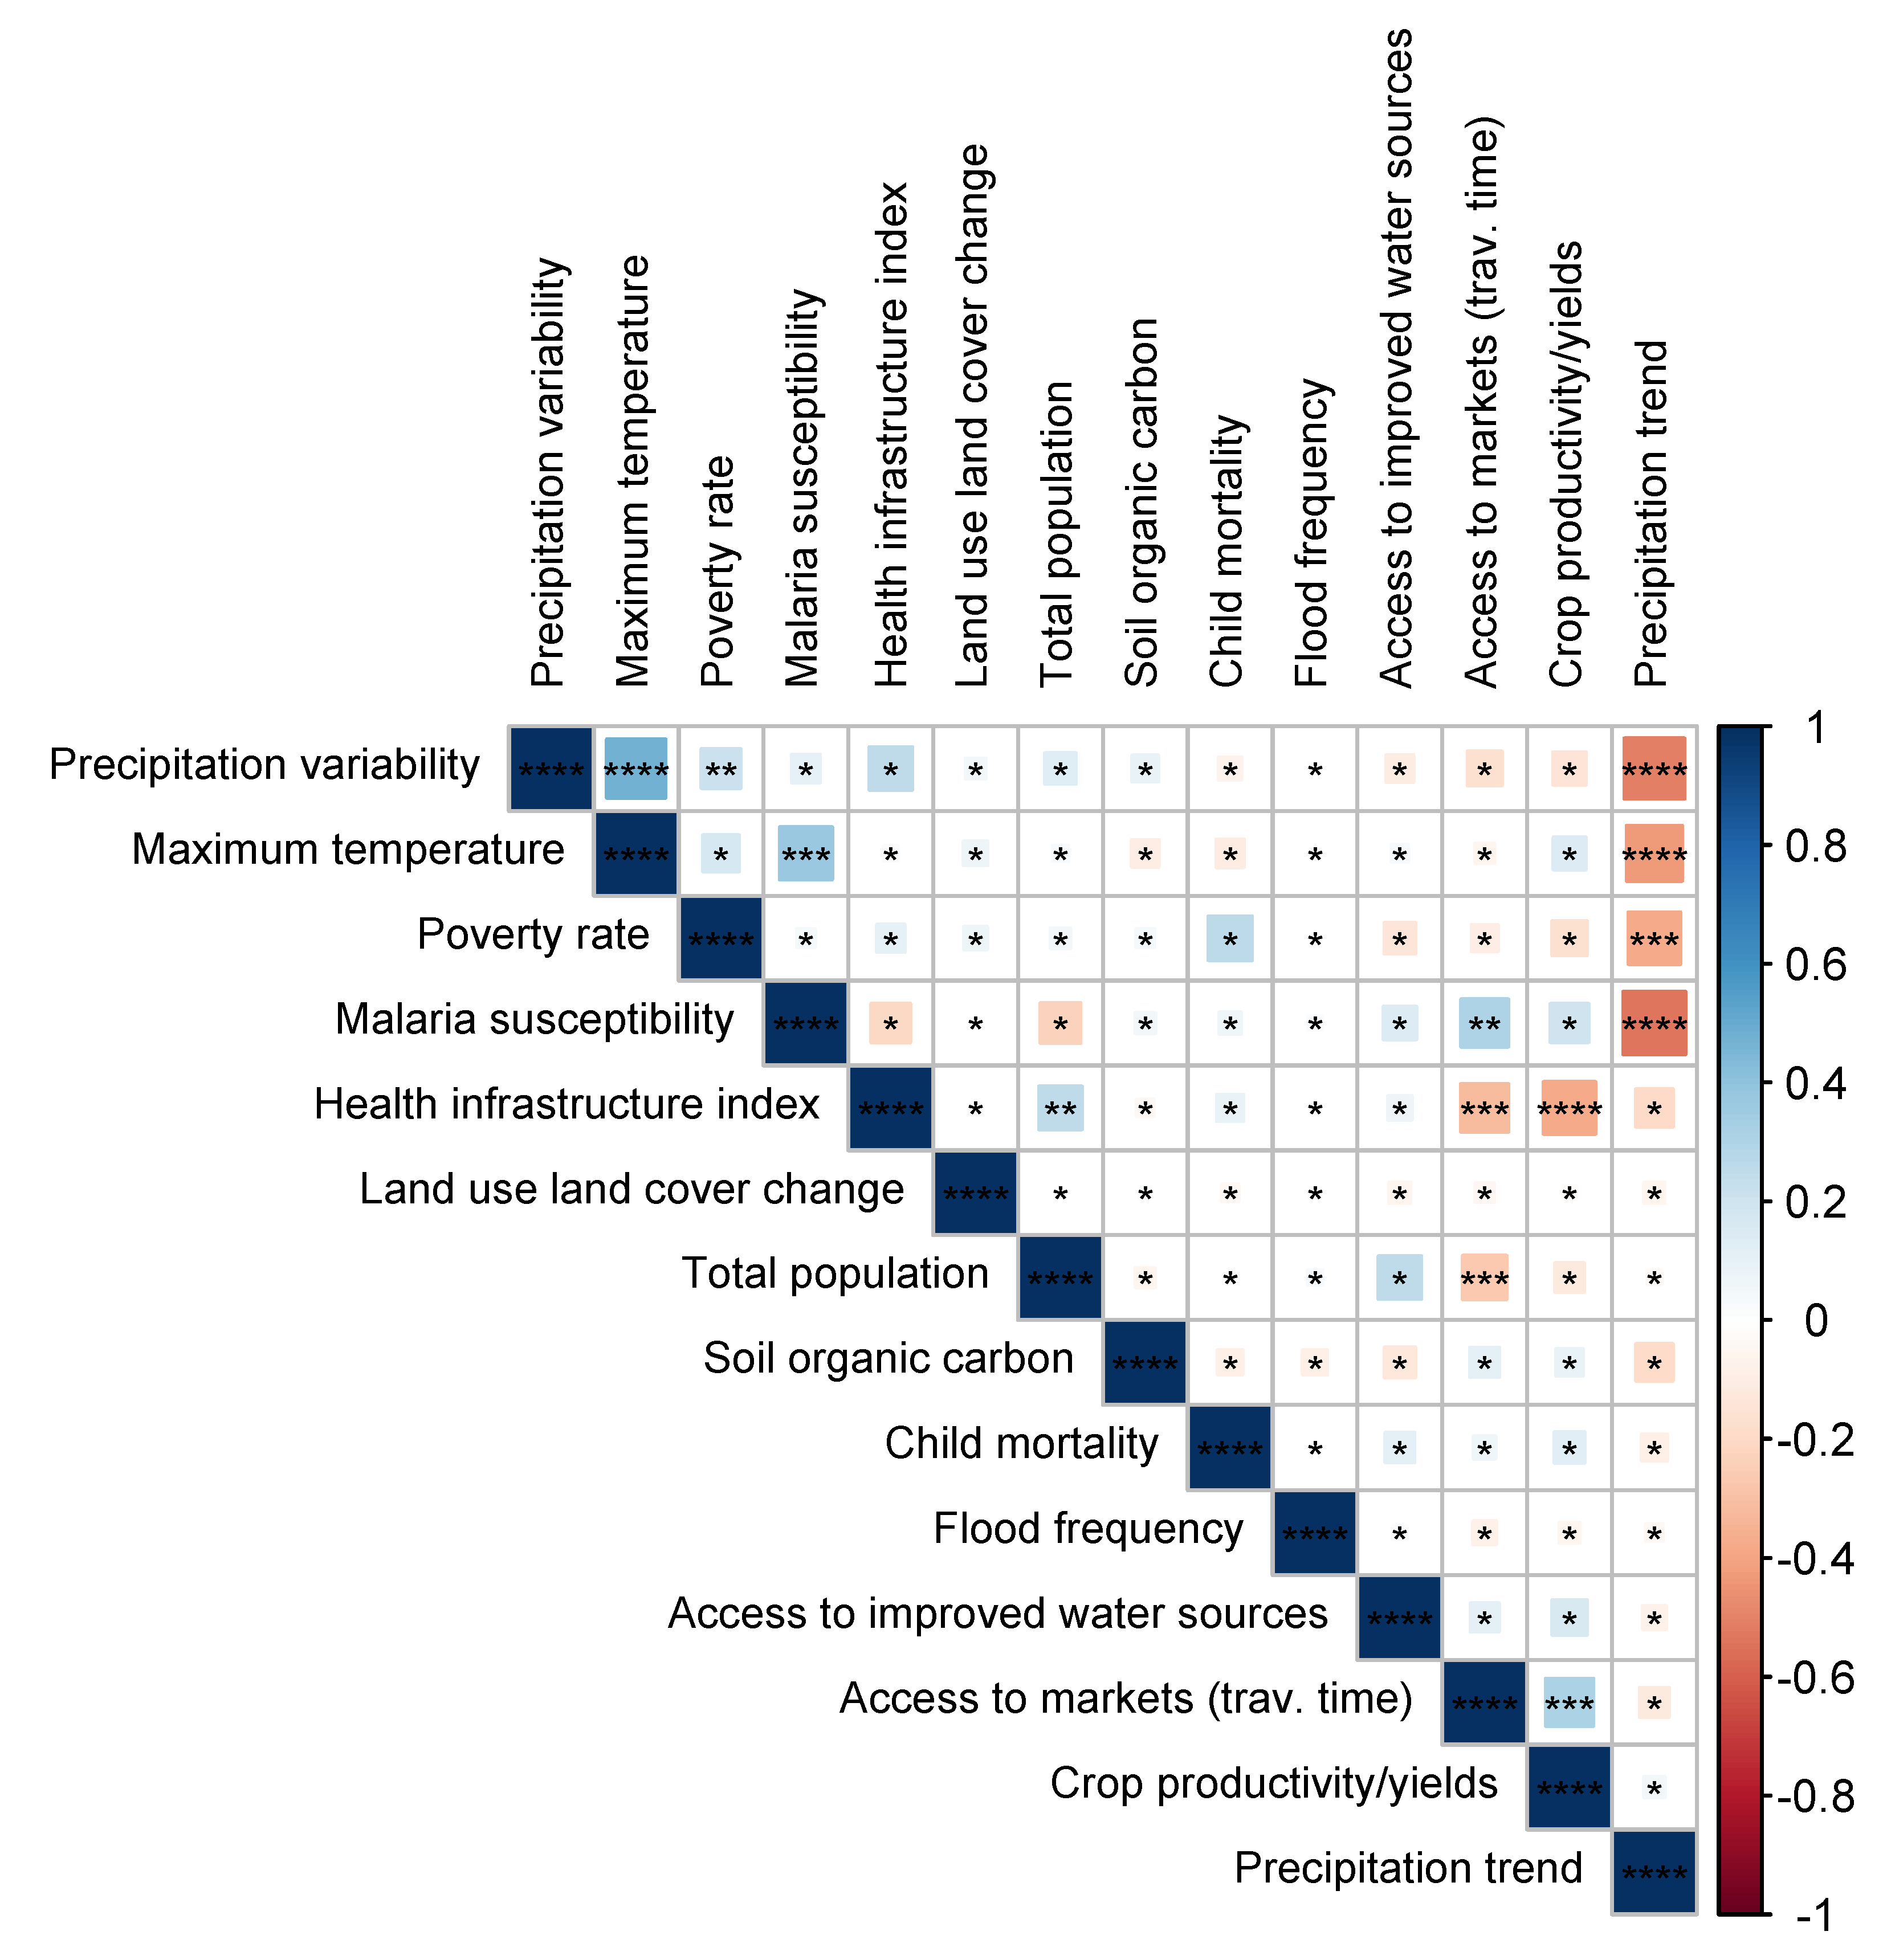
3.1. Indicator Correlation
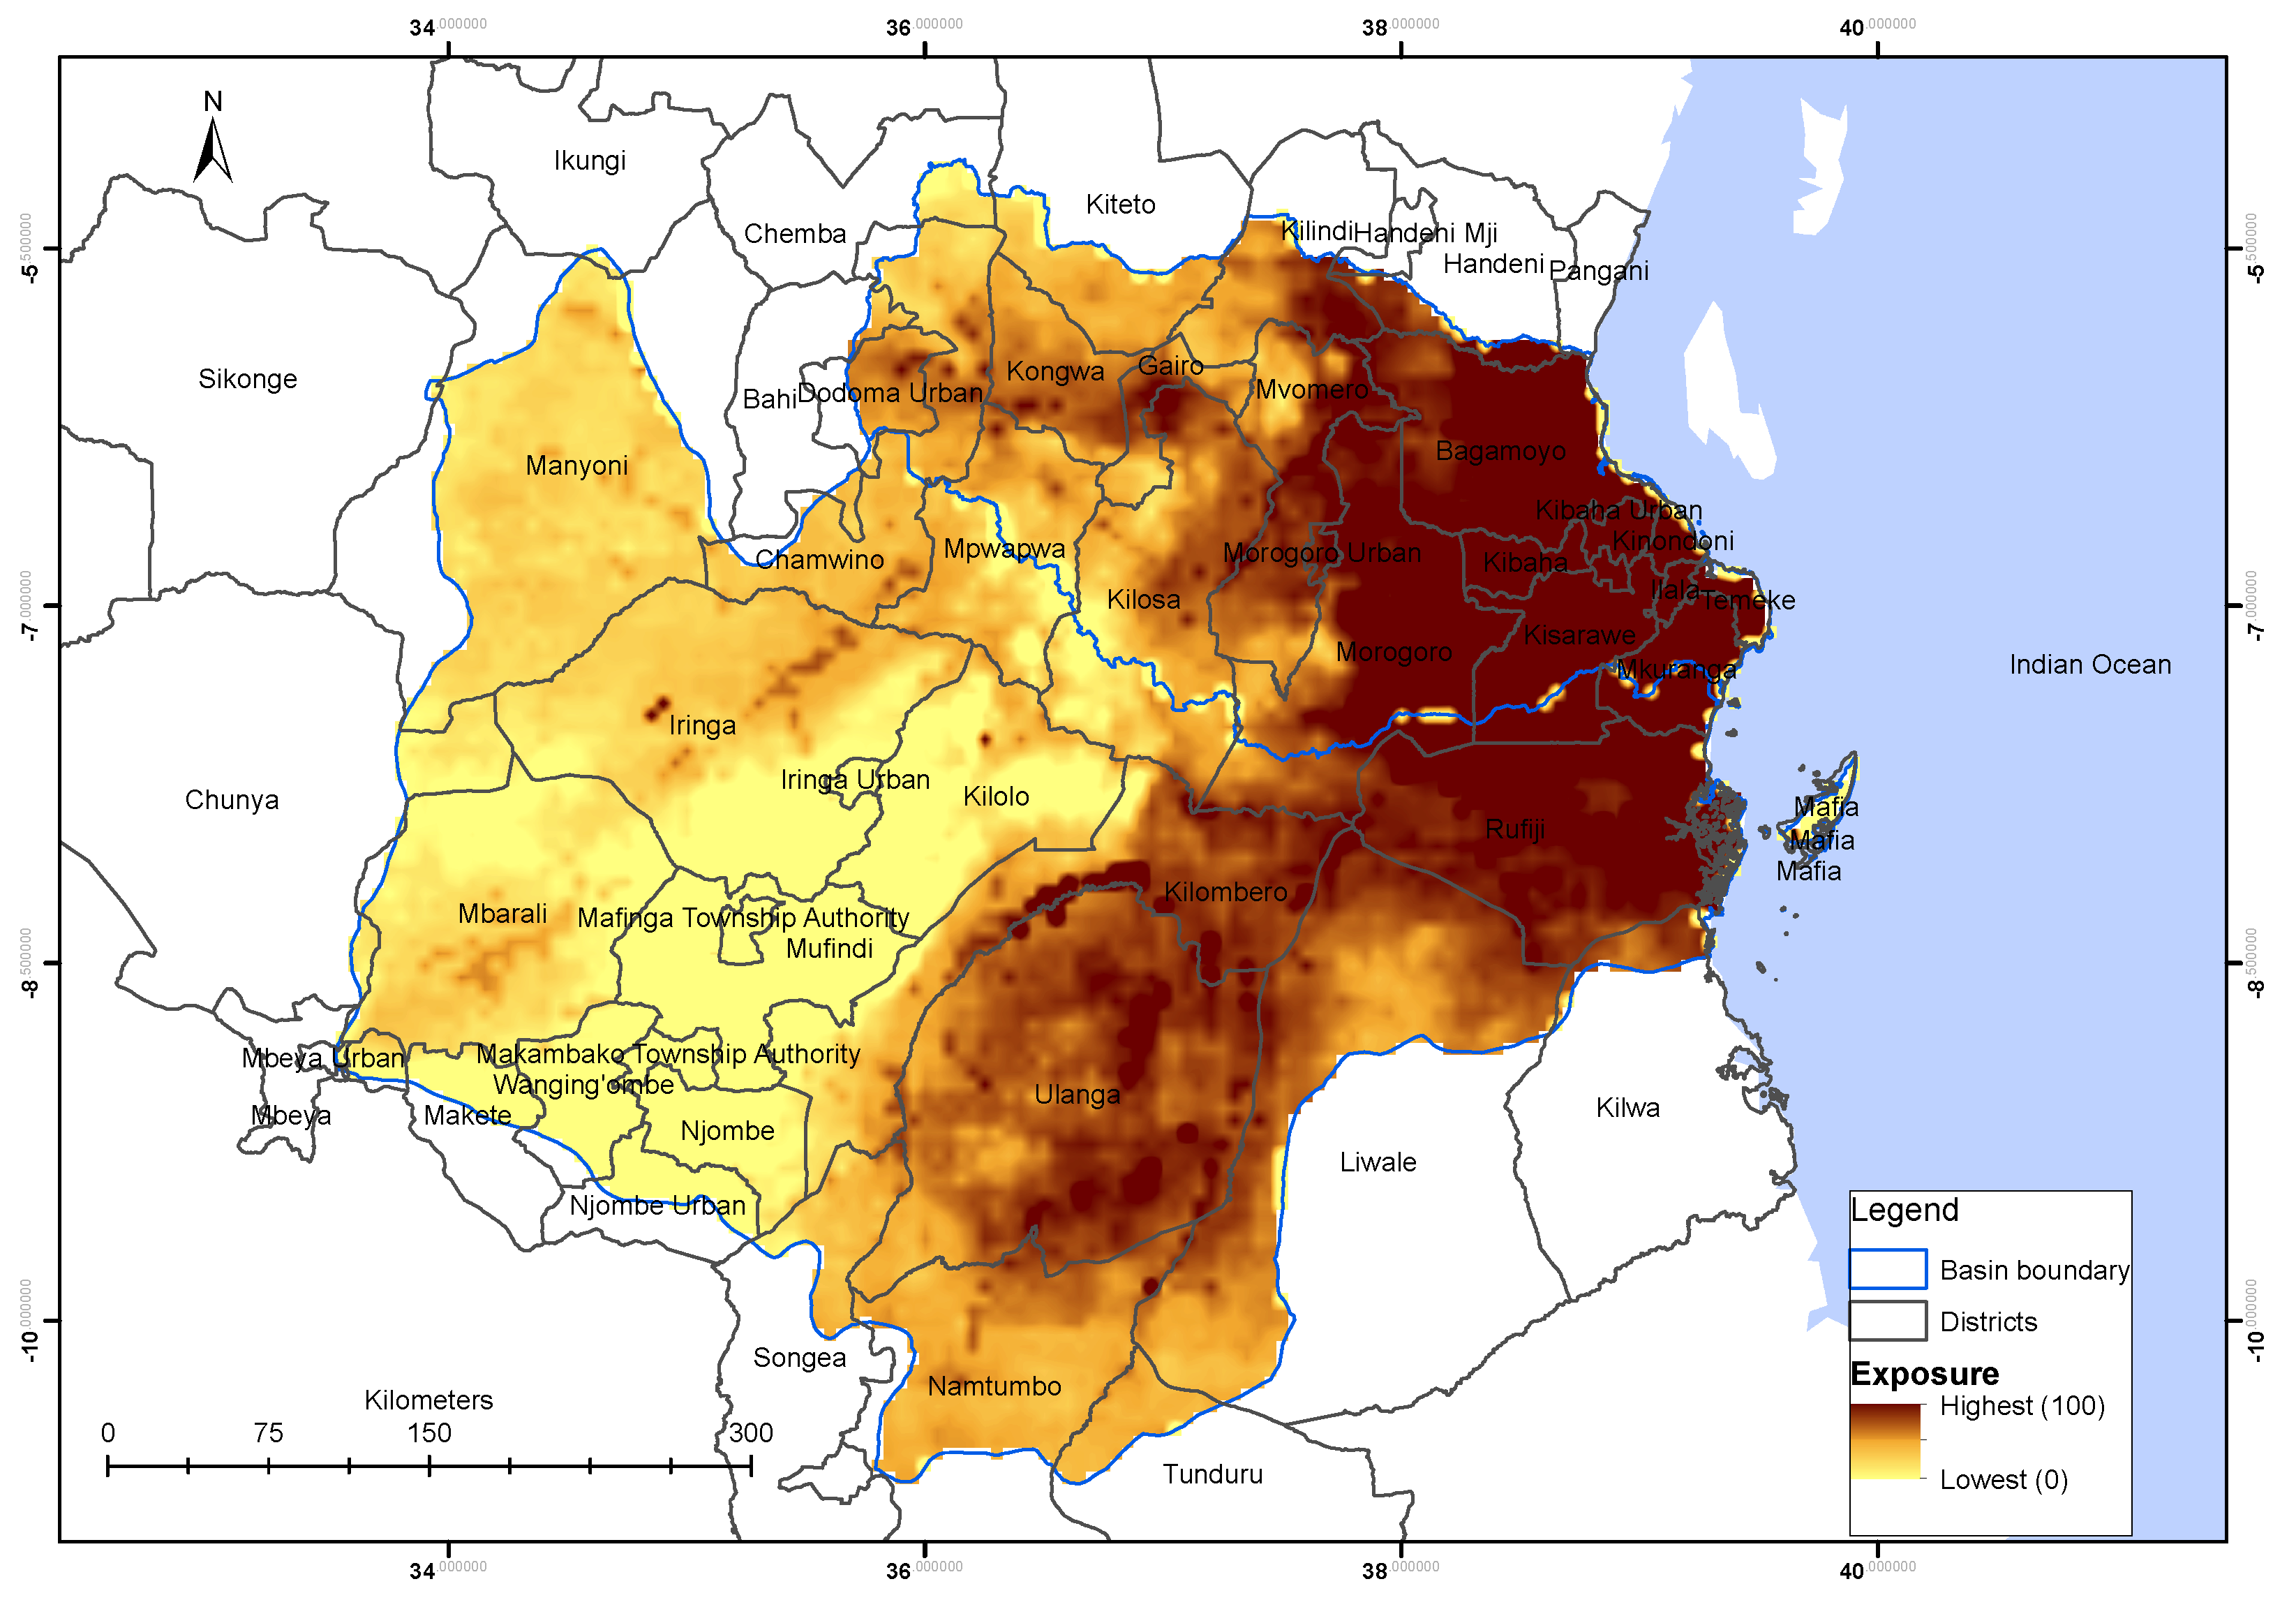
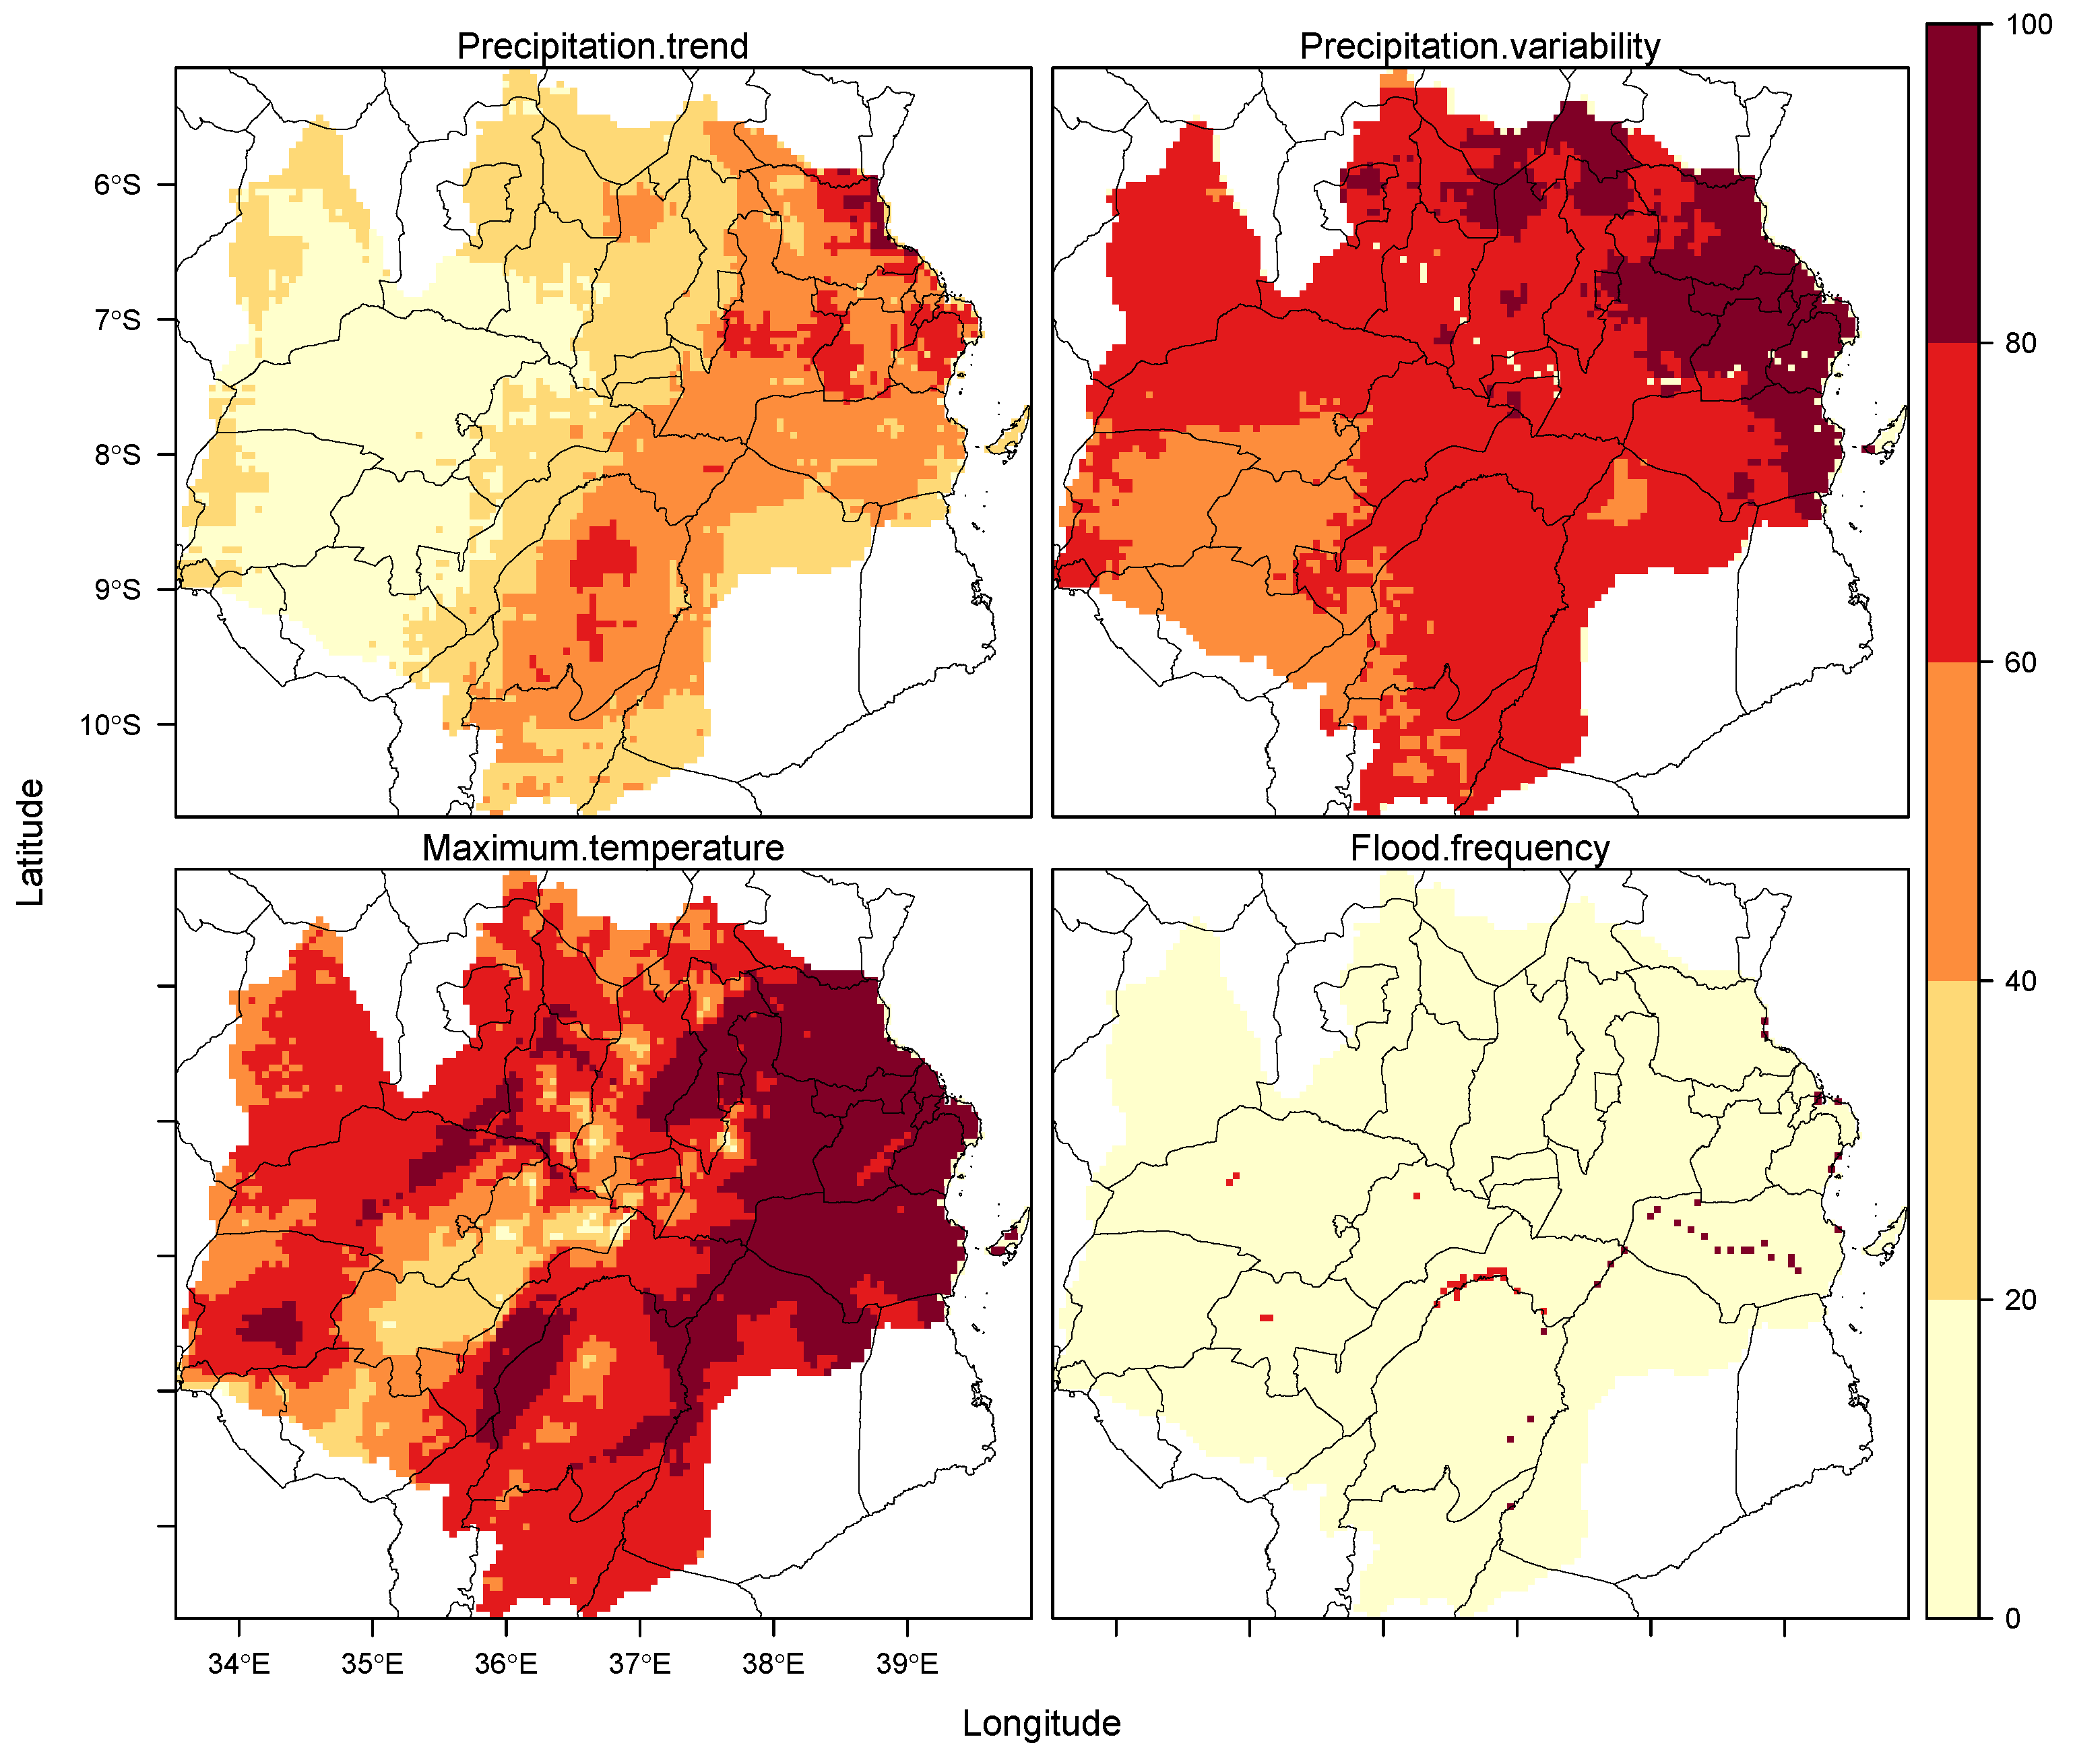
3.2. Exposure
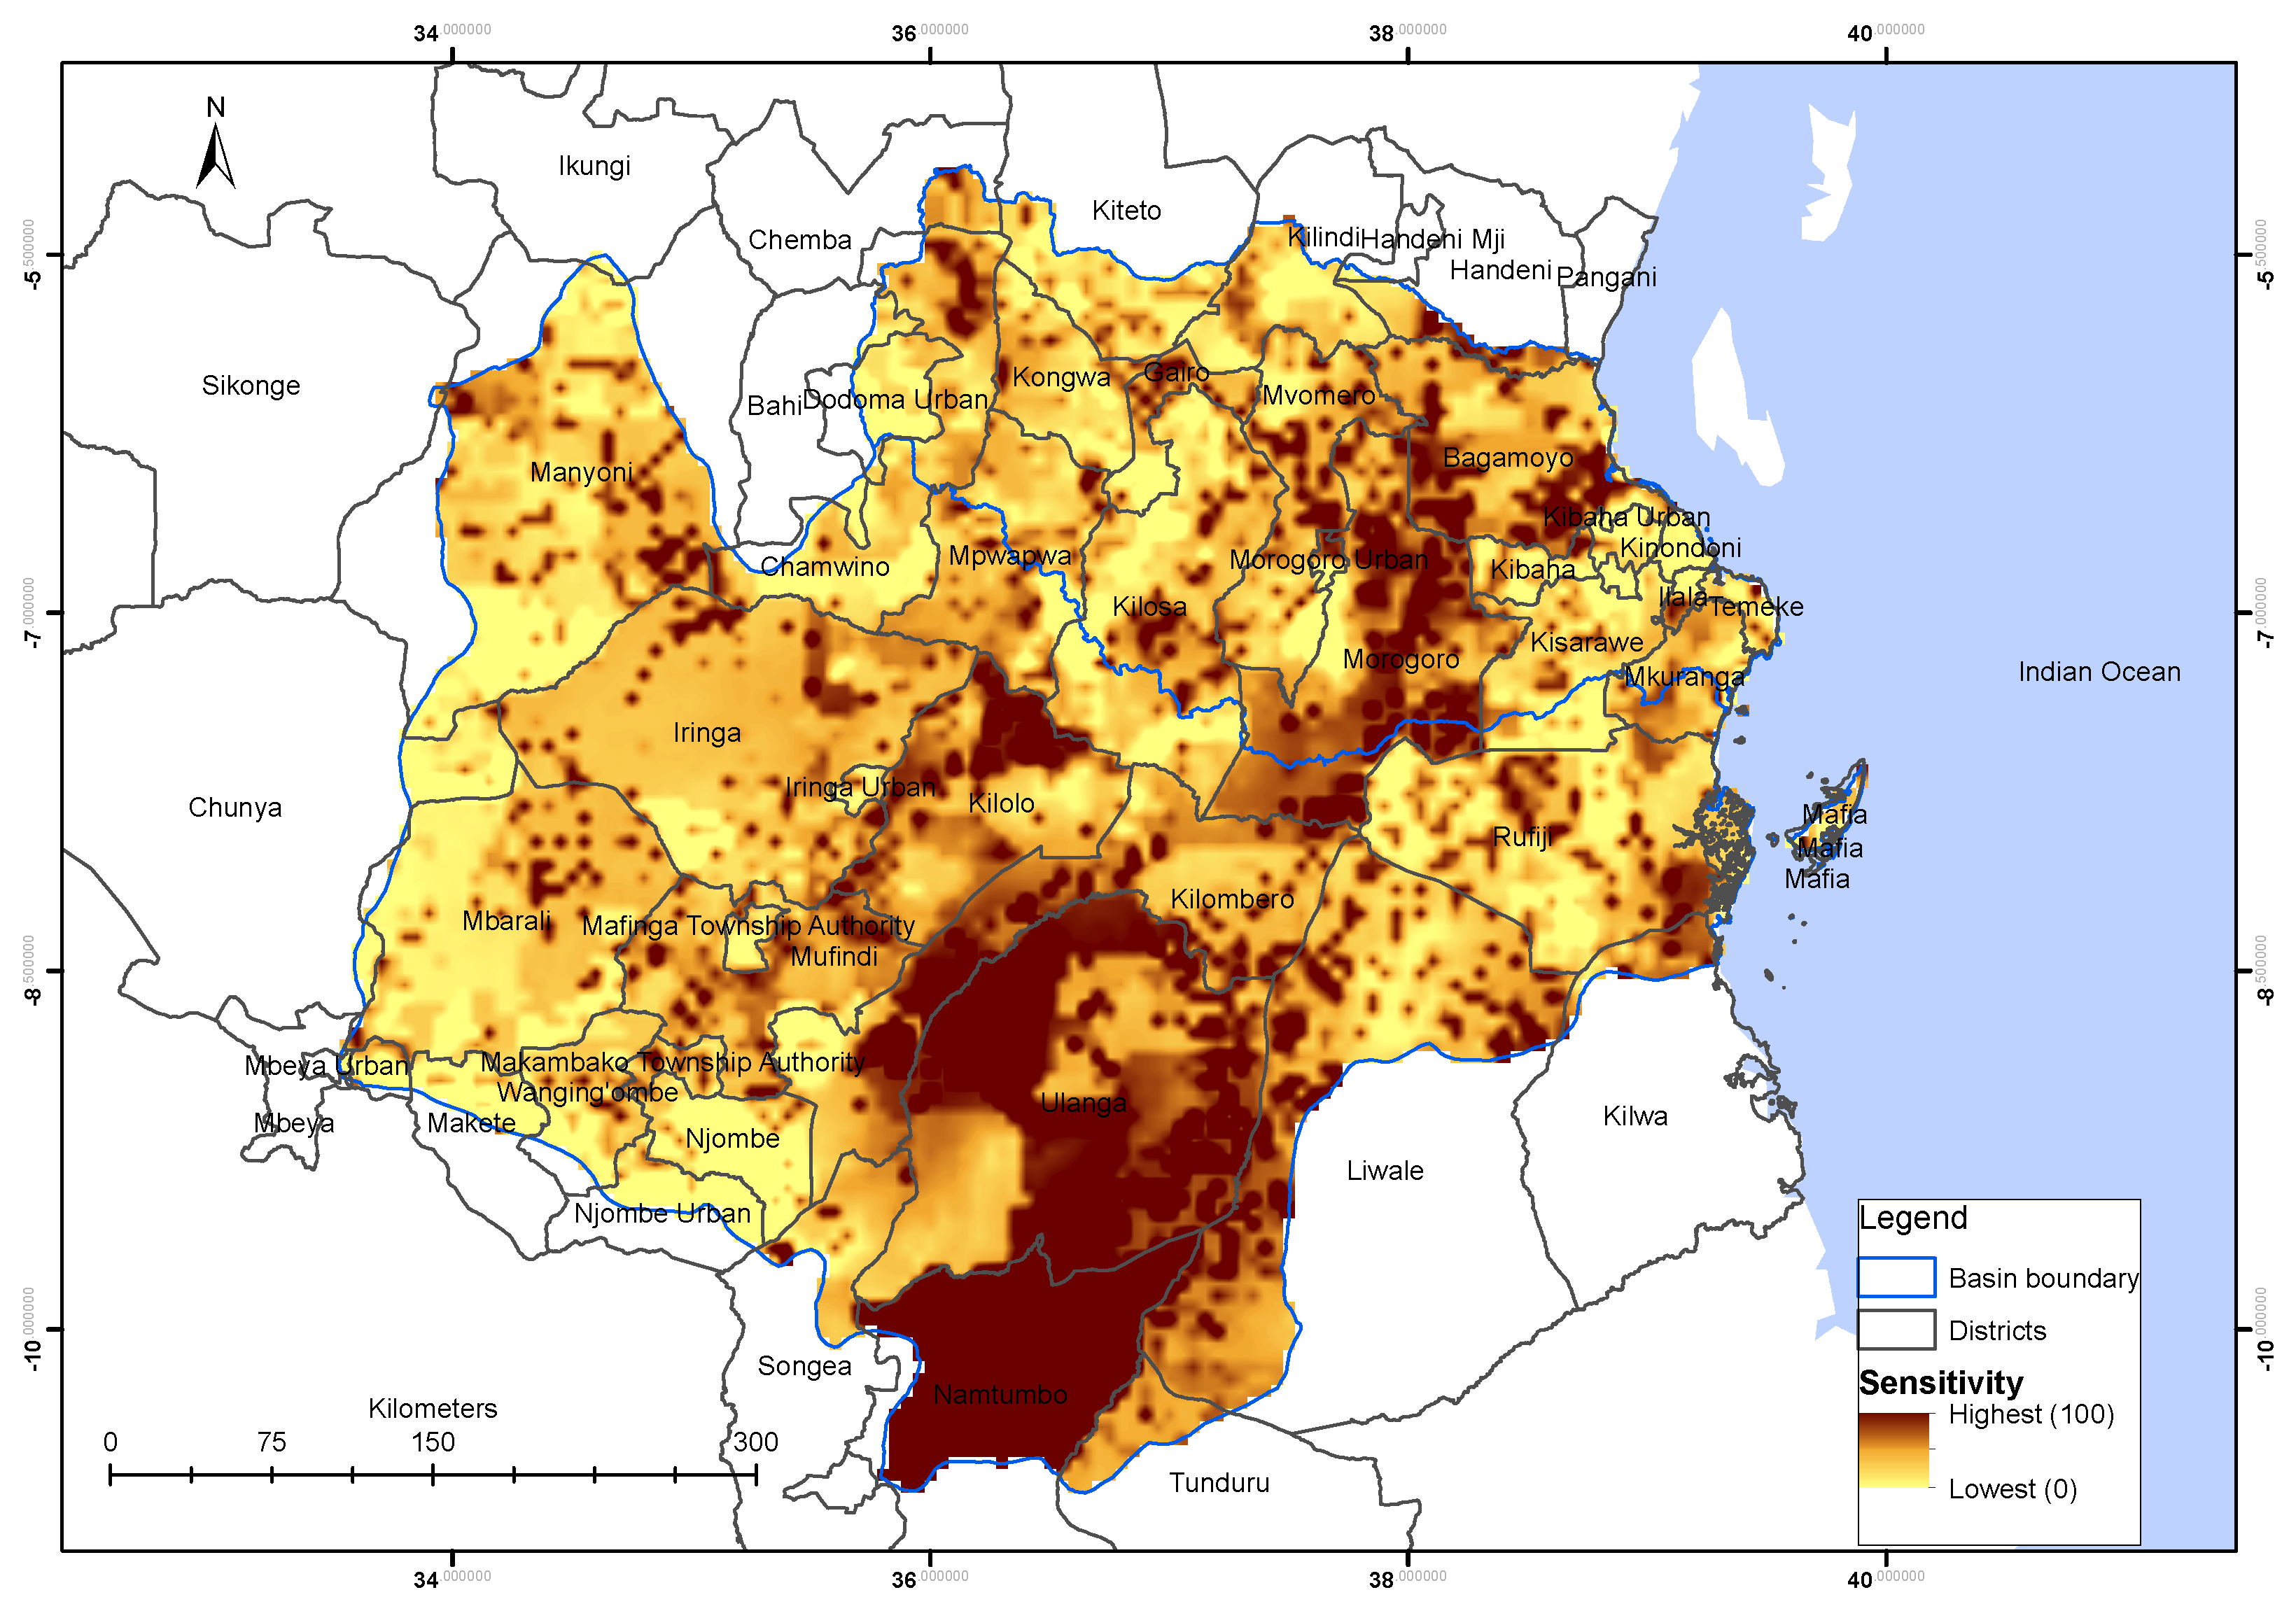
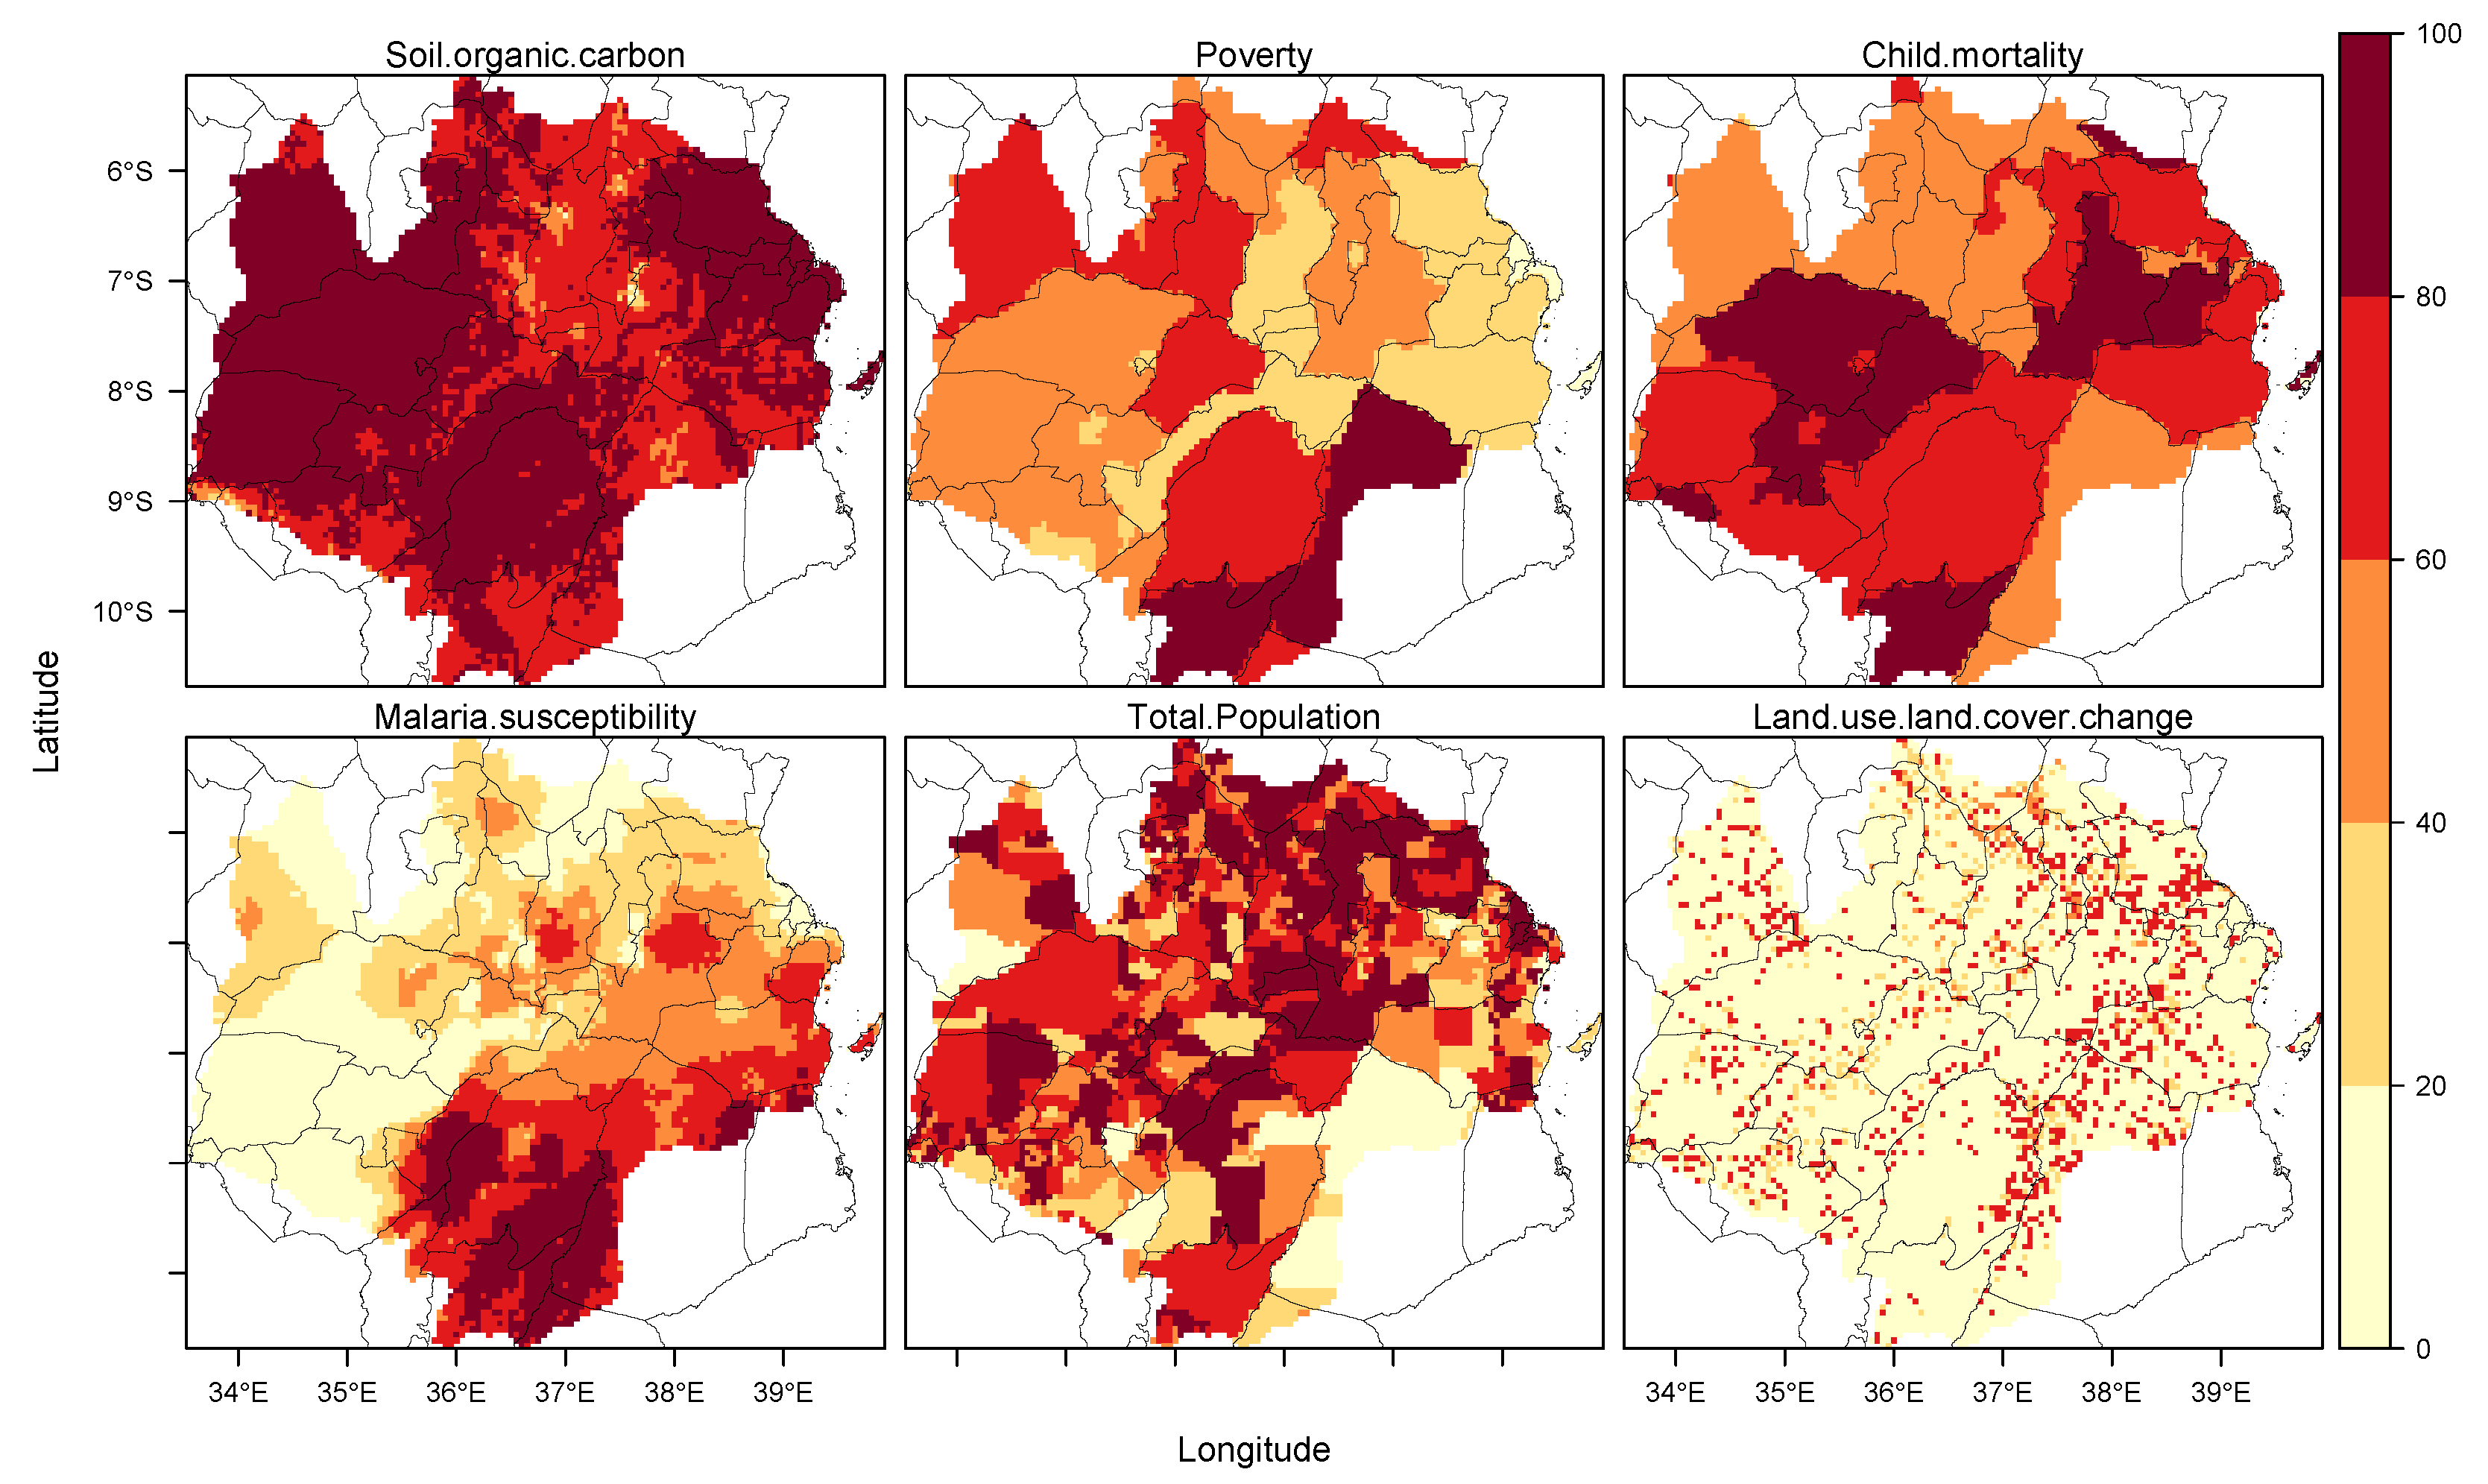
3.3. Sensitivity
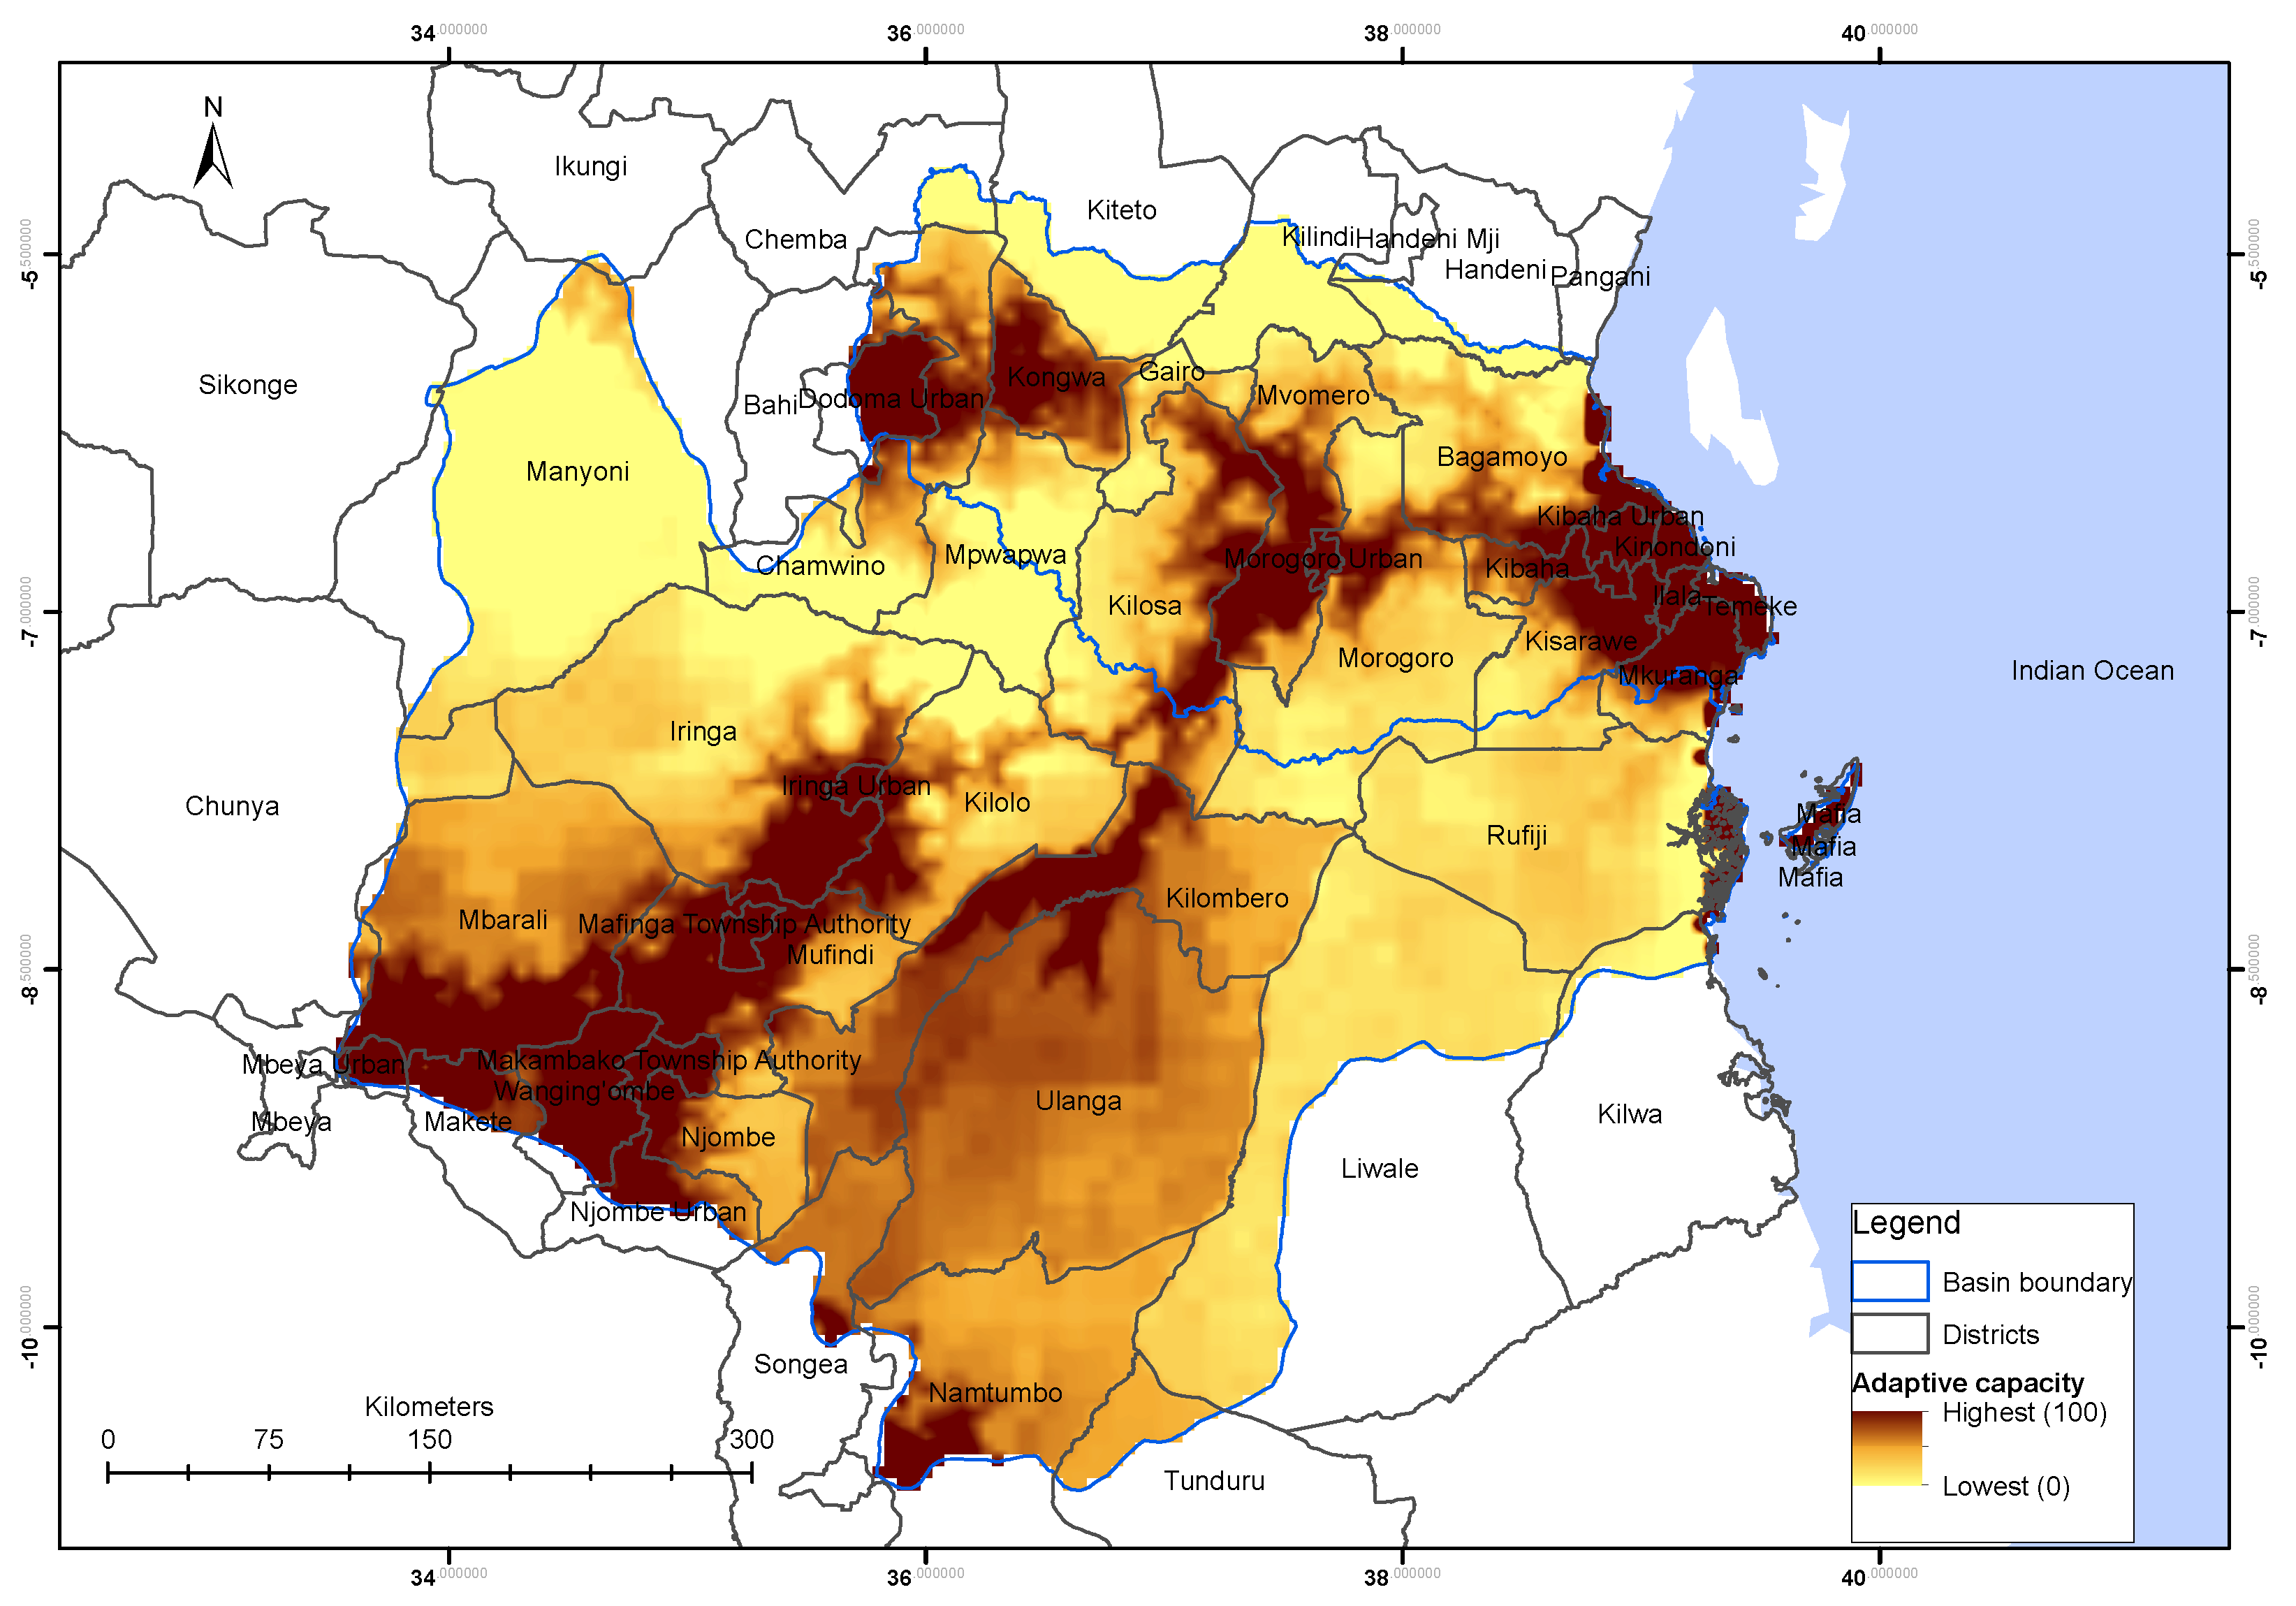
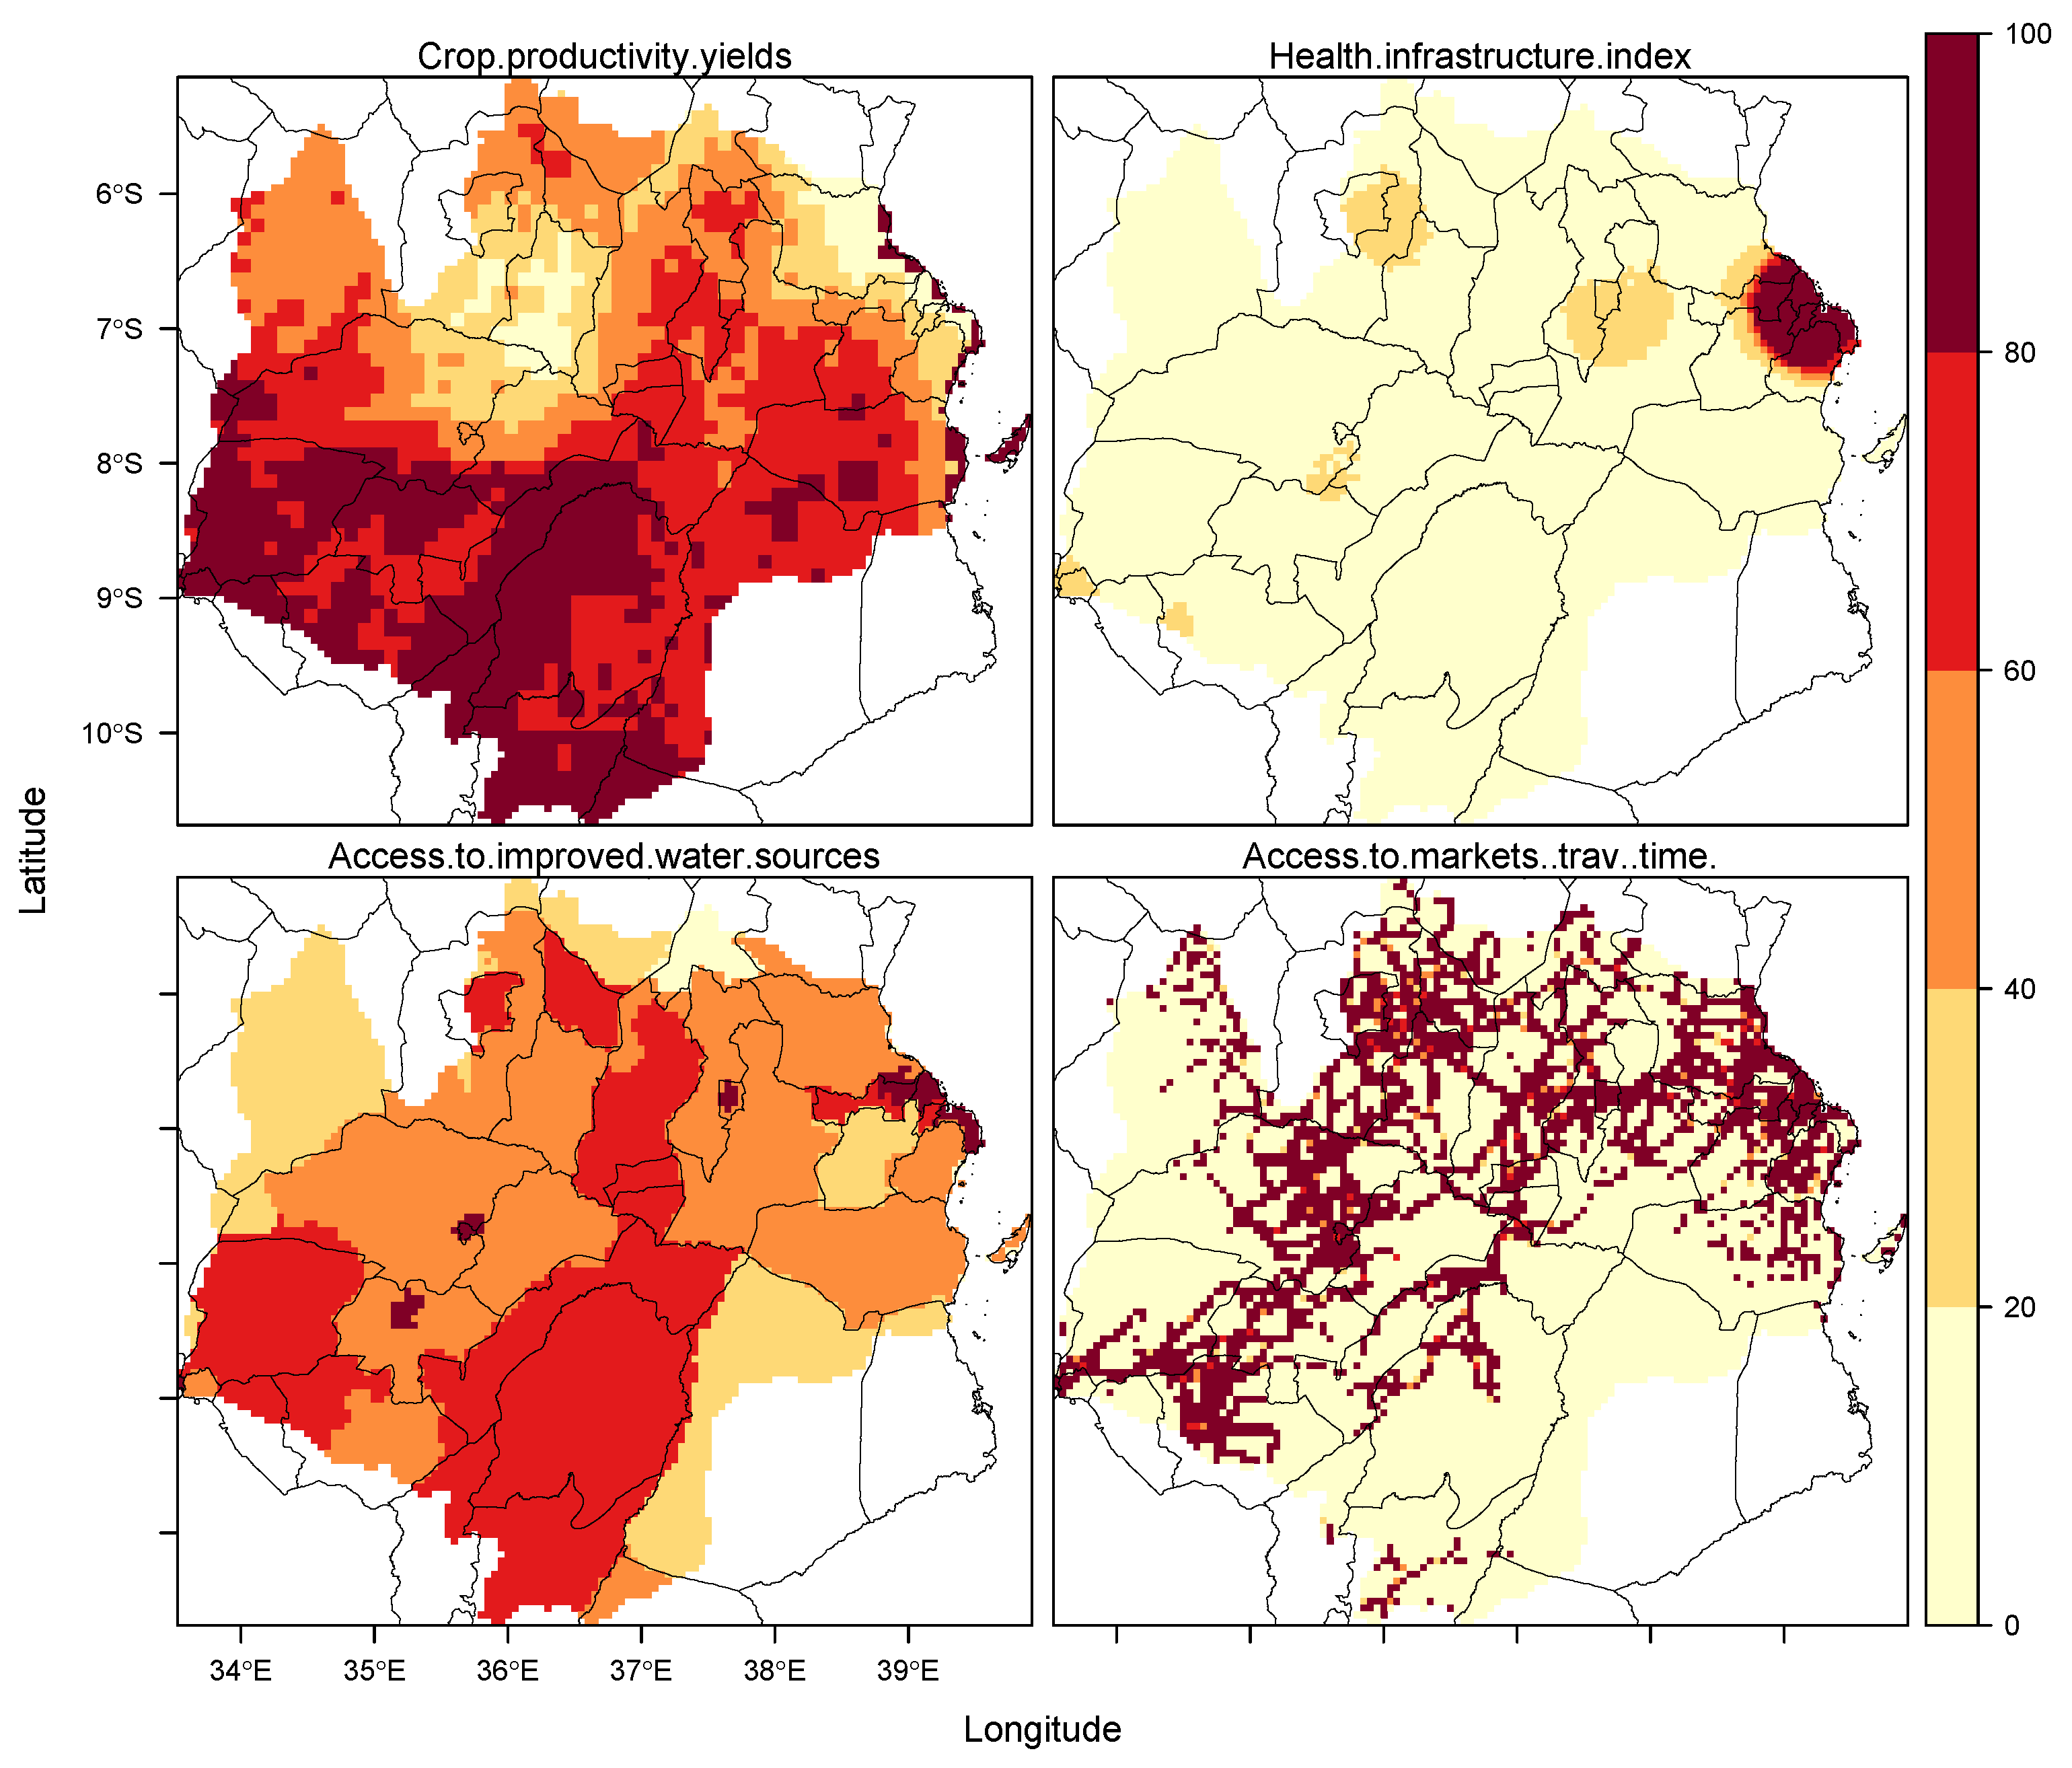
3.4. Adaptive Capacity
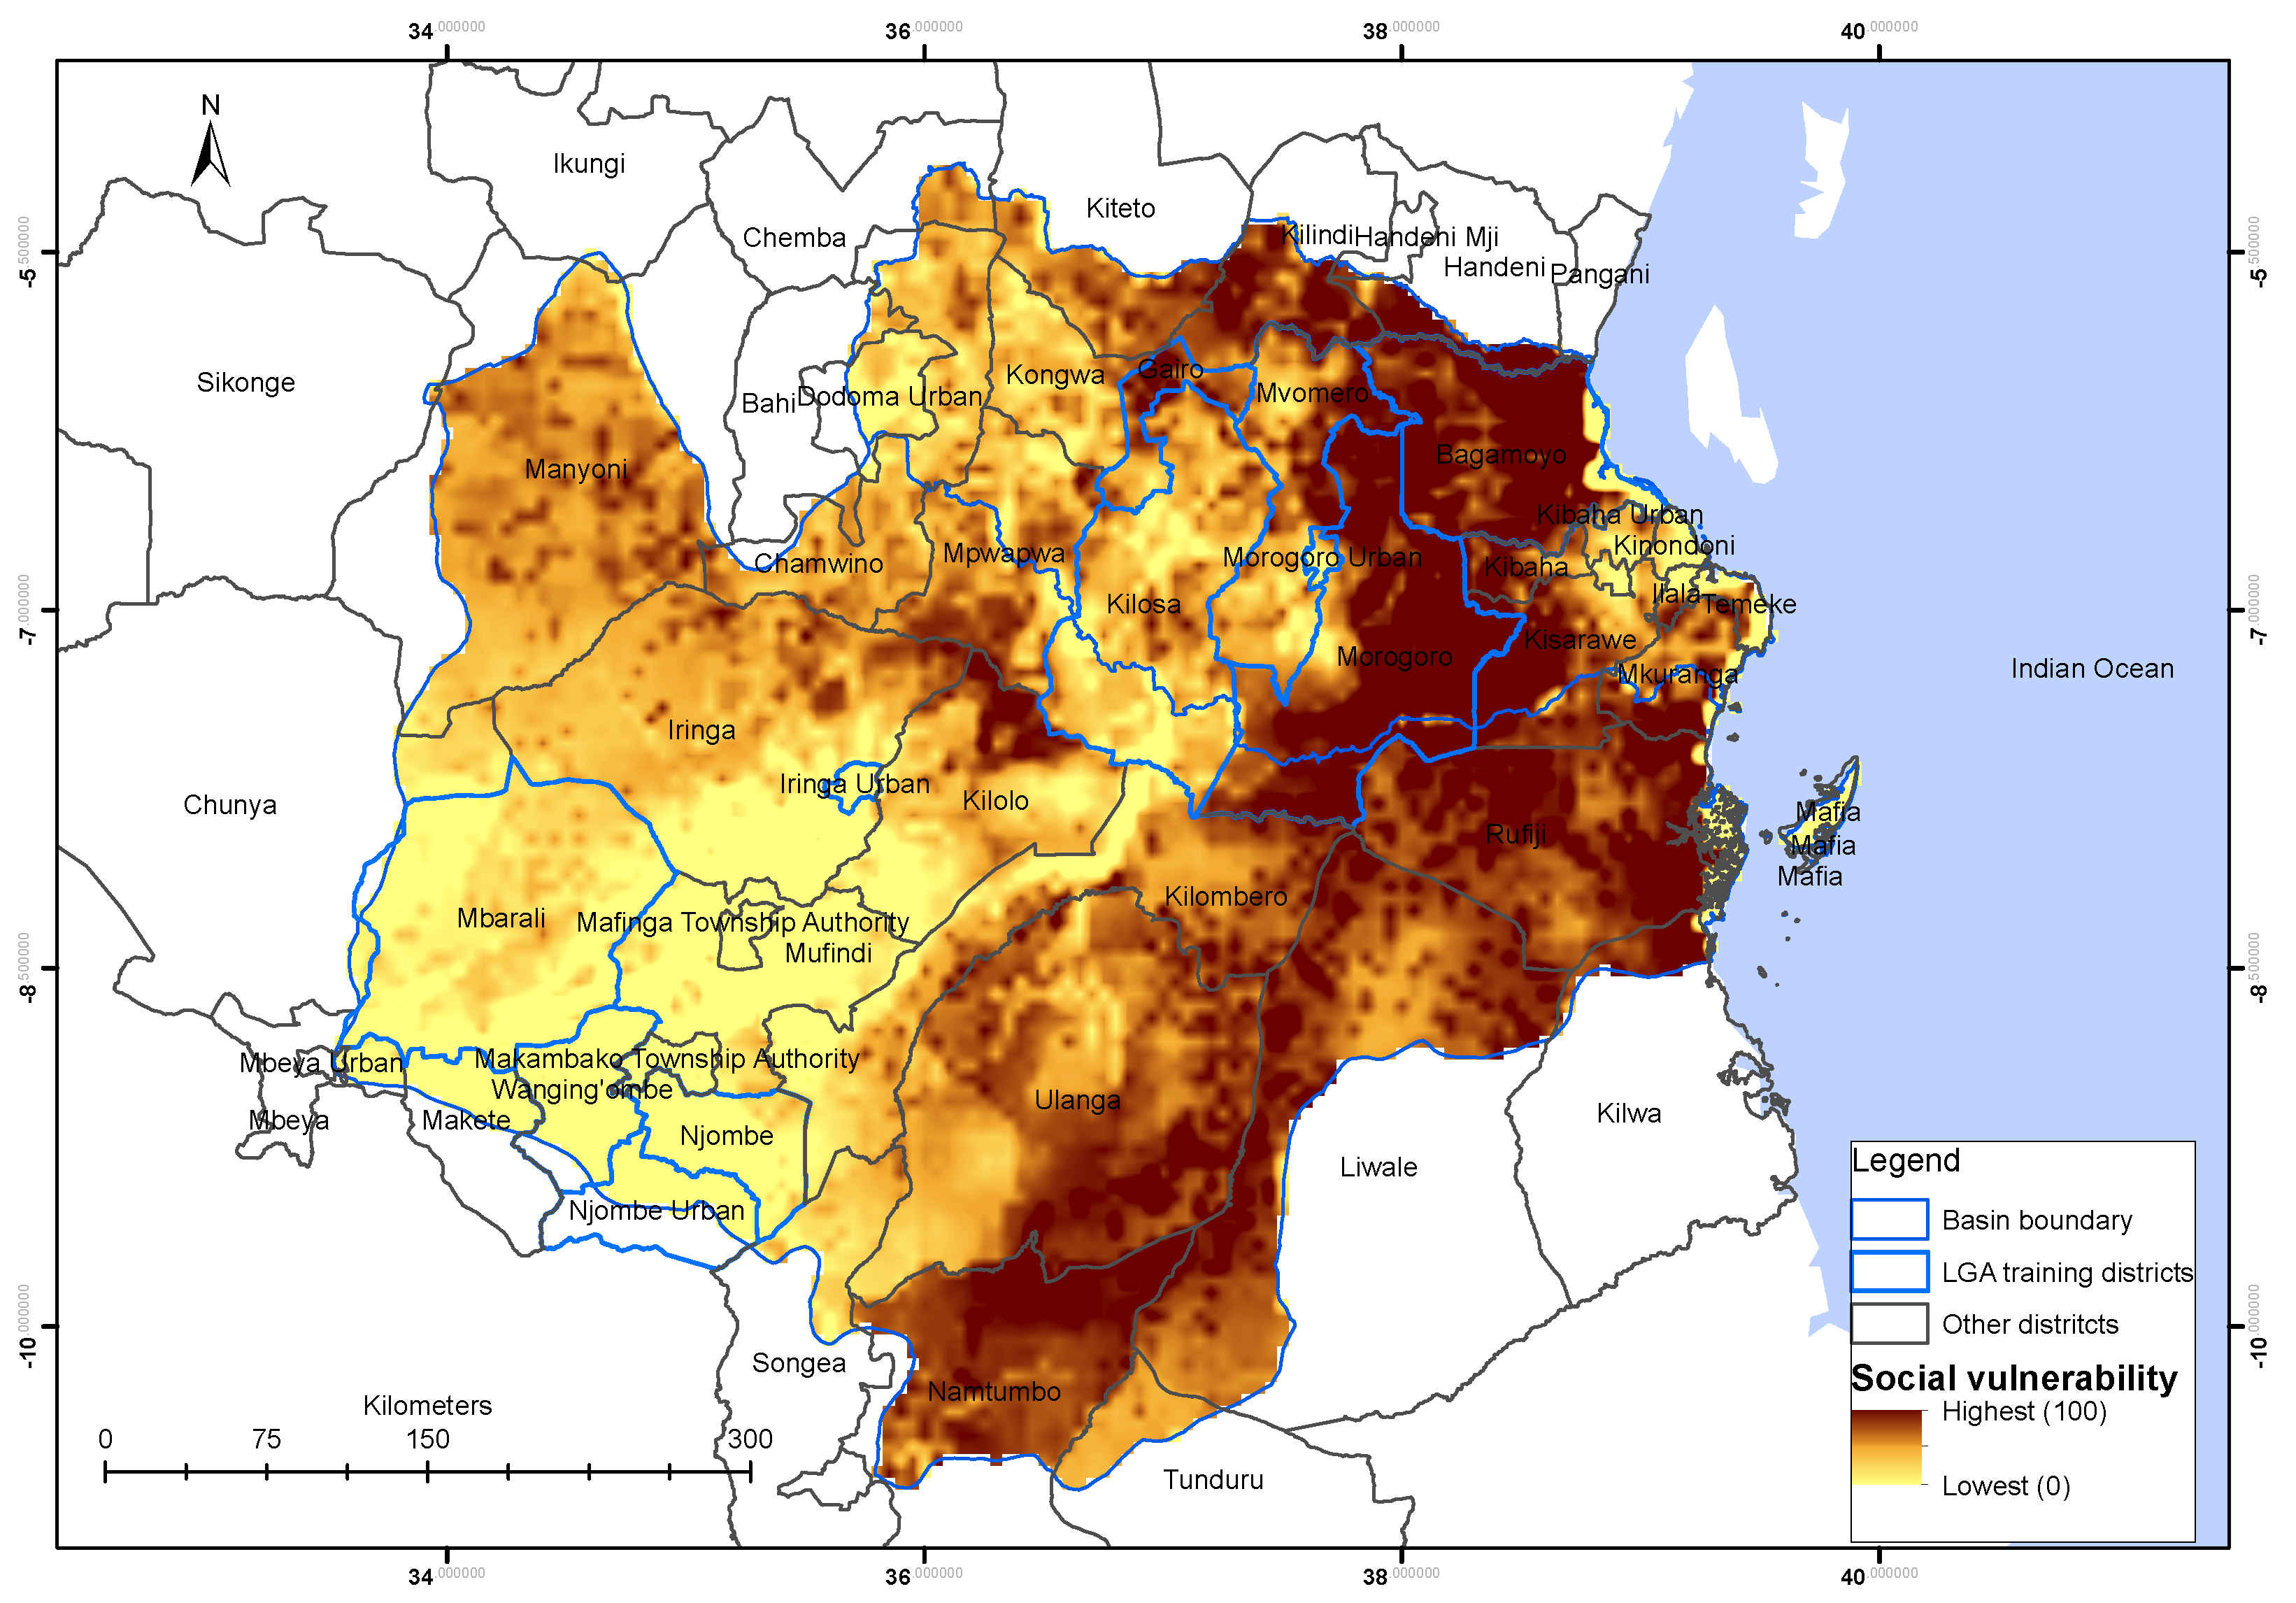
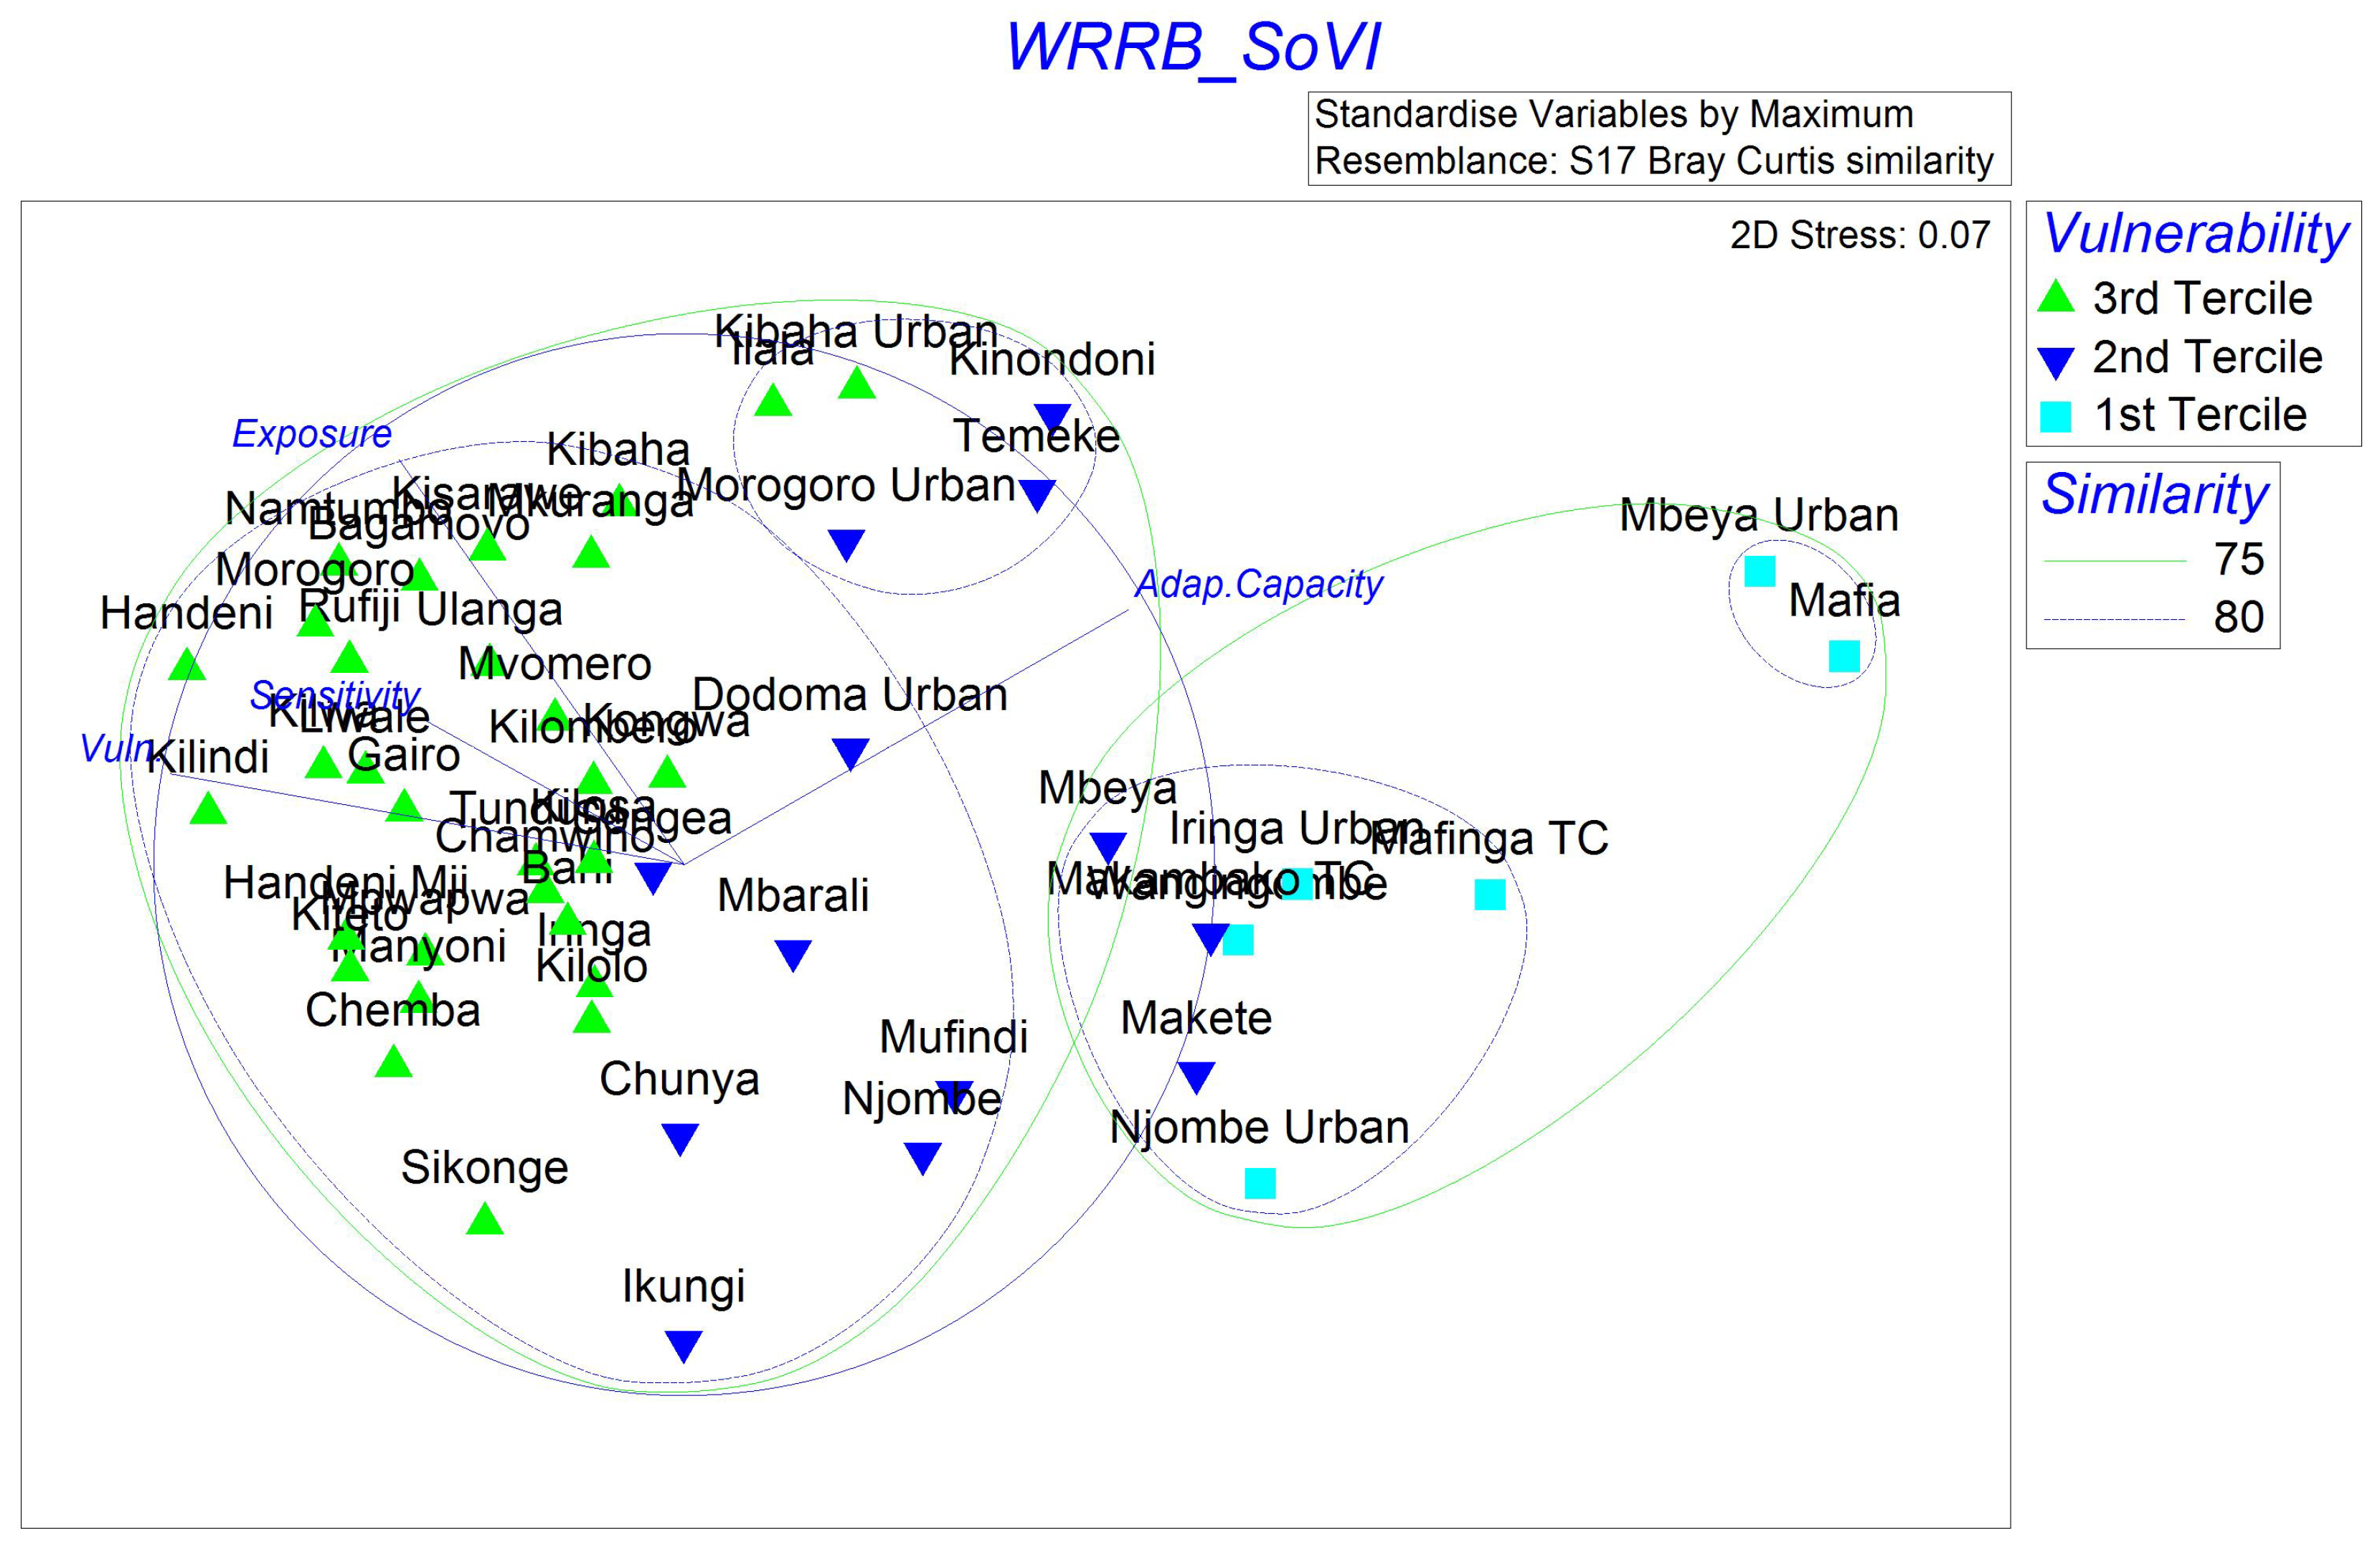
3.5. Overall Social Vulnerability
3.6. Selection of Hotspot Sites and Adaptation Interventions
3.7. Discussion
4. Conclusions
Author Contributions
Funding
Acknowledgments
Conflicts of Interest
Abbreviations
| AC | Adaptive Capacity |
| CCRO | Certificate of Customary Rights of Occupancy |
| CDT | Co-development team |
| CHIRPS | Climate Hazards InfraRed Precipitation with Stations |
| CSA | Climate Smart Agriculture |
| DHS | Demographic Health Surveys |
| FAO | Food and Agriculture Organization of the United Nations |
| FEWSNET | Famine Early Warning Systems Network |
| GIS | Geographic Information Systems |
| GRID | Global Risk Data platform |
| GSOCmap | Global Soil Organic Carbon map |
| IPCC | Intergovernmental Panel on Climate Change |
| ISRIC | International Soil Reference and Information Centre |
| JRC | Joint Research Centre |
| LGA | Local Government Agency |
| MAP | Malaria Atlas Project |
| MDS | Multi-Dimensional Scaling |
| NBS | National Bureau of Statistics |
| OC | Organic Carbon |
| PCA | Principal Component Analysis |
| QGIS | Quantum GIS |
| RCMRD | Regional Centre for Mapping of Resources for Development |
| SoVI | Social Vulnerability Index |
| TMA | Tanzania Meteorological Agency |
| USAID | United States Agency for International Development |
| VLUPs | Village Land Use Plans |
| WARIDI | Water Resources Integration Development Initiative |
| WASH | Water, Sanitation and Hygiene |
| WHO | World Health Organization |
| WRRB | Wami-Ruvu and Rufiji Basins |
Appendix A


References
- Chang’a, L.B.; Kijazi, A.L.; Luhunga, P.M.; Ng’ongolo, H.K.; Mtongori, H.I. Spatial and temporal analysis of rainfall and temperature extreme indices in Tanzania. Atmos. Clim. Sci. 2017, 7, 525–539. [Google Scholar] [CrossRef]
- Chang’a, L.B.; Yanda, P.Z.; Ngana, J.O. Spatial and temporal analysis of recent climatological data in Tanzania. J. Geogr. Reg. Plan. 2010, 3, 044–065. [Google Scholar]
- Gebrechorkos, S.H.; Hülsmann, S.; Bernhofer, C. Changes in temperature and precipitation extremes in Ethiopia, Kenya, and Tanzania. Int. J. Climatol. 2019, 39, 18–30. [Google Scholar] [CrossRef]
- Lyon, B.; DeWitt, D.G. A recent and abrupt decline in the East African long rains. Geophys. Res. Lett. 2012, 39. [Google Scholar] [CrossRef]
- Agwanda, A.; Amani, H. Population Growth, Structure and Momentum in Tanzania; Economic and Social Research Foundation: Dar es Salaam, Tanzania, 2014. [Google Scholar]
- National Research Council. Advancing the Science of Climate Change; National Academies Press: Washington, DC, USA, 2011. [Google Scholar]
- Yohe, G.; Lasco, R.; Ahmad, Q.K.; Cohen, S.; Janetos, T.; Perez, R.; Ebi, K.; Lankao, P.R.; Malone, E.; Malone, T.; et al. Perspectives on Climate Change and Sustainability 3. Change 2007, 25, 49. [Google Scholar]
- Kangalawe, R.Y. Climate change impacts on water resource management and community livelihoods in the southern highlands of Tanzania. Clim. Dev. 2017, 9, 191–201. [Google Scholar] [CrossRef]
- Tatem, A.; Weiss, D.; Pezzulo, C. Pilot High Resolution Poverty Maps; University of Southampton: Southampton, UK, 2013. [Google Scholar]
- Metzger, M.J.; Schröter, D. Towards a spatially explicit and quantitative vulnerability assessment of environmental change in Europe. Reg. Environ. Chang. 2006, 6, 201–216. [Google Scholar] [CrossRef]
- Stelzenmüller, V.; Ellis, J.R.; Rogers, S.I. Towards a spatially explicit risk assessment for marine management: Assessing the vulnerability of fish to aggregate extraction. Biol. Conserv. 2010, 143, 230–238. [Google Scholar] [CrossRef]
- de Sherbinin, A. Climate change hotspots mapping: What have we learned? Clim. Chang. 2014, 123, 23–37. [Google Scholar] [CrossRef]
- de Sherbinin, A.; Bukvic, A.; Rohat, G.; Gall, M.; McCusker, B.; Preston, B.; Apotsos, A.; Fish, C.; Kienberger, S.; Muhonda, P.; et al. Climate vulnerability mapping: A systematic review and future prospects. Wiley Interdiscip. Rev. Clim. Chang. 2019, 10, e600. [Google Scholar] [CrossRef]
- de Sherbinin, A.; Apotsos, A.; Chevrier, J. Mapping the future: Policy applications of climate vulnerability mapping in West Africa. Geogr. J. 2017, 183, 414–425. [Google Scholar] [CrossRef]
- Hagenlocher, M.; Lang, S.; Holbling, D.; Tiede, D.; Kienberger, S. Modeling hotspots of climate change in the Sahel using object-based regionalization of multidimensional gridded datasets. IEEE J. Sel. Top. Appl. Earth Obs. Remote Sens. 2014, 7, 229–234. [Google Scholar] [CrossRef]
- Samson, J.; Berteaux, D.; McGill, B.J.; Humphries, M.M. Geographic disparities and moral hazards in the predicted impacts of climate change on human populations. Glob. Ecol. Biogeogr. 2011, 20, 532–544. [Google Scholar] [CrossRef]
- Davies, R.A.G.; Midgley, S.J.E. Risk and Vulnerability Mapping in Southern Africa: A Hotspot Analysis; OneWorld Sustainable Investments (Pty) Ltd.: Cape Town, South Africa, 2010. [Google Scholar]
- Busby, J.W.; Smith, T.G.; White, K.L.; Strange, S.M. Locating climate insecurity: Where are the most vulnerable places in Africa? In Climate Change, Human Security and Violent Conflict; Springer: Berlin/Heidelberg, Germany, 2012; pp. 463–511. [Google Scholar]
- RCMRD. Malawi Hazards and Vulnerability Atlas; Progress Press Ltd.: Birkirkara, Malta, 2015.
- Kienberger, S.; Hagenlocher, M. Spatial-explicit modeling of social vulnerability to malaria in East Africa. Int. J. Health Geogr. 2014, 13, 29. [Google Scholar] [CrossRef] [PubMed]
- de Sherbinin, A.; Schiller, A.; Pulsipher, A. The vulnerability of global cities to climate hazards. Environ. Urban. 2007, 19, 39–64. [Google Scholar] [CrossRef]
- Stocker, T.F.; Qin, D.; Plattner, G.K.; Tignor, M.; Allen, S.K.; Boschung, J.; Nauels, A.; Xia, Y.; Bex, V.; Midgley, P.M.; et al. Climate Change 2013: The Physical Science Basis; Cambridge University Press: Cambridge, UK; New York, NY, USA, 2013. [Google Scholar]
- Baettig, M.B.; Wild, M.; Imboden, D.M. A climate change index: Where climate change may be most prominent in the 21st century. Geophys. Res. Lett. 2007, 34. [Google Scholar] [CrossRef]
- Kienberger, S. Spatial modelling of social and economic vulnerability to floods at the district level in Búzi, Mozambique. Nat. Hazards 2012, 64, 2001–2019. [Google Scholar] [CrossRef]
- de Sherbinin, A. Spatial Climate Change Vulnerability Assessments: A Review of Data, Methods, and Issues; Technical Report; ARCC Project Working Paper; CIESIN: Palisades, NY, USA, 2013. [Google Scholar]
- Bruno Soares, M.; Gagnon, A.S.; Doherty, R.M. Conceptual elements of climate change vulnerability assessments: A review. Int. J. Clim. Chang. Strateg. Manag. 2012, 4, 6–35. [Google Scholar] [CrossRef]
- Abson, D.J.; Dougill, A.J.; Stringer, L.C. Using principal component analysis for information-rich socio-ecological vulnerability mapping in Southern Africa. Appl. Geogr. 2012, 35, 515–524. [Google Scholar] [CrossRef]
- Midgley, S.J.E.; Davies, R.A.G.; Chesterman, S. Climate Risk and Vulnerability Mapping in Southern Africa: Status Quo (2008) and Future (2050); For the Regional Climate Change Programme for Southern Africa (RCCP); UK Department for International Development (DFID): London, UK; OneWorld Sustainable Investments: Cape Town, South Africa, 2011.
- Brooks, N. Vulnerability, risk and adaptation: A conceptual framework. Tyndall Cent. Clim. Chang. Res. Work. Pap. 2003, 38, 1–16. [Google Scholar]
- Füssel, H.M. Vulnerability: A generally applicable conceptual framework for climate change research. Glob. Environ. Chang. 2007, 17, 155–167. [Google Scholar] [CrossRef]
- Luers, A.L.; Lobell, D.B.; Sklar, L.S.; Addams, C.L.; Matson, P.A. A method for quantifying vulnerability, applied to the agricultural system of the Yaqui Valley, Mexico. Glob. Environ. Chang. 2003, 13, 255–267. [Google Scholar] [CrossRef]
- Metzger, M.J.; Leemans, R.; Schröter, D. A multidisciplinary multi-scale framework for assessing vulnerabilities to global change. Int. J. Appl. Earth Obs. Geoinf. 2005, 7, 253–267. [Google Scholar] [CrossRef]
- USAID. Community Climate Change Adaptation Assessment, 2018. Available online: https://www.climatelinks.org/resources/prepared-fact-sheet-community-climate-change-adaptation-assessment (accessed on 13 October 2019).
- LVBC. Adapting to Climate Change in the Lake Victoria Basin, 2017. Available online: https://www.adaptation-fund.org/project/adapting-climate-change-lake-victoria-basin-burundi-kenya-rwanda-tanzania-uganda (accessed on 13 October 2019).
- Weber, S.; Sadoff, N.; Zell, E.; de Sherbinin, A. Policy-relevant indicators for mapping the vulnerability of urban populations to extreme heat events: A case study of Philadelphia. Appl. Geogr. 2015, 63, 231–243. [Google Scholar] [CrossRef]
- Preston, B.L.; Brooke, C.; Measham, T.G.; Smith, T.; Gorddard, R. Igniting change in local government: Lessons learned from a bushfire vulnerability assessment. Mitig. Adapt. Strateg. Glob. Chang. 2009, 14, 251–283. [Google Scholar] [CrossRef]
- Collins, T.W.; Grineski, S.E.; Ford, P.; Aldouri, R.; Aguilar, M.d.L.R.; Velázquez-Angulo, G.; Fitzgerald, R.; Lu, D. Mapping vulnerability to climate change-related hazards: Children at risk in a US–Mexico border metropolis. Popul. Environ. 2013, 34, 313–337. [Google Scholar] [CrossRef]
- Funk, C.; Peterson, P.; Landsfeld, M.; Pedreros, D.; Verdin, J.; Shukla, S.; Husak, G.; Rowland, J.; Harrison, L.; Hoell, A. The climate hazards infrared precipitation with stations—A new environmental record for monitoring extremes. Sci. Data 2015, 2, 150066. [Google Scholar] [CrossRef]
- Arcement, G.J.; Schneider, V.R. Guide for Selecting Manning’s Roughness Coefficients for Natural Channels and Flood Plains; US Geological Survey, Books and Open-File Reports Section: Denver, CO, USA, 1989.
- Herold, C.; Rudari, R. Improvement of the Global Flood Model for the GAR 2013 and 2015; United Nations Office for Disaster Risk Reduction (UNISDR): Geneva, Switzerland, 2013. [Google Scholar]
- Hengl, T.; de Jesus, J.M.; MacMillan, R.A.; Batjes, N.H.; Heuvelink, G.B.M.; Ribeiro, E.; Samuel-Rosa, A.; Kempen, B.; Leenaars, J.G.B.; Walsh, M.G.; et al. SoilGrids1km—Global Soil Information Based on Automated Mapping. PLoS ONE 2014, 9, e105992. [Google Scholar] [CrossRef]
- Rawls, W.; Pachepsky, Y.A.; Ritchie, J.; Sobecki, T.; Bloodworth, H. Effect of soil organic carbon on soil water retention. Geoderma 2003, 116, 61–76. [Google Scholar] [CrossRef]
- de Sherbinin, A.; Chai-Onn, T.; Jaiteh, M.; Mara, V.; Pistolesi, L.; Schnarr, E.; Trzaska, S. Data integration for climate vulnerability mapping in West Africa. ISPRS Int. J. Geo-Inf. 2015, 4, 2561–2582. [Google Scholar] [CrossRef]
- Jayanthi, H.; Husak, G.J.; Funk, C.; Magadzire, T.; Adoum, A.; Verdin, J.P. A probabilistic approach to assess agricultural drought risk to maize in Southern Africa and millet in Western Sahel using satellite estimated rainfall. Int. J. Disaster Risk Reduct. 2014, 10, 490–502. [Google Scholar] [CrossRef]
- Bhatt, S.; Weiss, D.J.; Cameron, E.; Bisanzio, D.; Mappin, B.; Dalrymple, U.; Battle, K.E.; Moyes, C.L.; Henry, A.; Eckhoff, P.A.; et al. The effect of malaria control on Plasmodium falciparum in Africa between 2000 and 2015. Nature 2015, 526, 207. [Google Scholar] [CrossRef] [PubMed]
- Oduor, P.; Ababu, J.; Mugo, R.; Farah, H.; Flores, A.; Limaye, A.; Irwin, D.; Artis, G. Land Cover Mapping for Green House Gas Inventories in Eastern and Southern Africa Using Landsat and High Resolution Imagery: Approach and Lessons Learnt. In Earth Science Satellite Applications; Springer: Berlin/Heidelberg, Germany, 2016; pp. 85–116. [Google Scholar]
- Weiss, D.J.; Nelson, A.; Gibson, H.S.; Temperley, W.; Peedell, S.; Lieber, A.; Hancher, M.; Poyart, E.; Belchior, S.; Fullman, N.; et al. A global map of travel time to cities to assess inequalities in accessibility in 2015. Nature 2018, 553, 333. [Google Scholar] [CrossRef] [PubMed]
- Parry, M.; Canziani, O.; Palutikof, J.; van der Linden, P.J.; Hanson, C.E. Climate Change 2007: Impacts, Adaptation and Vulnerability; Cambridge University Press: Cambridge, UK, 2007; Volume 4. [Google Scholar]
- UNDP. Mapping Climate Change Vulnerability and Impact Scenarios: A Guidebook for Sub-National Planners; Technical Report; UNDP: New York, NY, USA, 2010. [Google Scholar]
- Ericksen, P.; Thornton, P.K.; Notenbaert, A.M.O.; Cramer, L.; Jones, P.G.; Herrero, M. Mapping Hotspots of Climate Change and Food Insecurity in the Global Tropics; Technical Report; CCAFS: Frederiksberg, Denmark, 2011. [Google Scholar]
- Hinkel, J. “Indicators of vulnerability and adaptive capacity”: Towards a clarification of the science–policy interface. Glob. Environ. Chang. 2011, 21, 198–208. [Google Scholar] [CrossRef]
- Braat, L. The predictive meaning of sustainability indicators. In Search of Indicators of Sustainable Development; Springer: Dordrecht, The Netherlands, 1991; pp. 57–70. [Google Scholar]
- Mahmood, R.; Pielke Sr, R.A.; Hubbard, K.G.; Niyogi, D.; Dirmeyer, P.A.; McAlpine, C.; Carleton, A.M.; Hale, R.; Gameda, S.; Beltrán-Przekurat, A.; et al. Land cover changes and their biogeophysical effects on climate. Int. J. Climatol. 2014, 34, 929–953. [Google Scholar] [CrossRef]
- Baptista, S.R. Design and Use of Composite Indices in Assessments of Climate Change Vulnerability and Resilience; Technical Report; CIESIN: Palisades, NY, USA, 2014. [Google Scholar]
- de Sherbinin, A.; Chai-Onn, T.; Giannini, A.; Jaiteh, M.; Levy, M.; Mara, V.; Pistolesi, L.; Trzaska, S. Mali Climate Vulnerability Mapping; Technical Report; CIESIN: Palisades, NY, USA, 2014. [Google Scholar]
- CIESIN. Gridded Population of the World (GPW), v4. Available online: sedac.ciesin.columbia.edu/data/collection/gpw-v4 (accessed on 11 May 2019).
- Cutter, S.L.; Finch, C. Temporal and spatial changes in social vulnerability to natural hazards. Proc. Natl. Acad. Sci. USA 2008, 105, 2301–2306. [Google Scholar] [CrossRef]
- Yohe, G.; Tol, R.S. Indicators for social and economic coping capacity—Moving toward a working definition of adaptive capacity. Glob. Environ. Chang. 2002, 12, 25–40. [Google Scholar] [CrossRef]
- Koutroulis, A.; Papadimitriou, L.; Grillakis, M.; Tsanis, I.; Warren, R.; Betts, R. Global water availability under high-end climate change: A vulnerability based assessment. Glob. Planet. Chang. 2019, 175, 52–63. [Google Scholar] [CrossRef]
- Thornton, P.K.; Jones, P.G.; Alagarswamy, G.; Andresen, J.; Herrero, M. Adapting to climate change: Agricultural system and household impacts in East Africa. Agric. Syst. 2010, 103, 73–82. [Google Scholar] [CrossRef]
- Madulu, N.F. Environment, poverty and health linkages in the Wami River basin: A search for sustainable water resource management. Phys. Chem. Earth Parts A/B/C 2005, 30, 950–960. [Google Scholar] [CrossRef]
- Conway, D.; Mittal, N.; Vincent, K. Future Climate Projections for Tanzania; Technical Report; Future Climate for Africa: Cape Town, South Africa, 2017. [Google Scholar]
- Mboera, L.E.; Rumisha, S.F.; Lyimo, E.P.; Chiduo, M.G.; Mangu, C.D.; Mremi, I.R.; Kumalija, C.J.; Joachim, C.; Kishamawe, C.; Massawe, I.S.; et al. Cause-specific mortality patterns among hospital deaths in Tanzania, 2006–2015. PLoS ONE 2018, 13, e0205833. [Google Scholar] [CrossRef] [PubMed]
- Onyango, E.A.; Sahin, O.; Awiti, A.; Chu, C.; Mackey, B. An integrated risk and vulnerability assessment framework for climate change and malaria transmission in East Africa. Malar. J. 2016, 15, 551. [Google Scholar] [CrossRef] [PubMed]
- van Lieshout, M.; Kovats, R.; Livermore, M.; Martens, P. Climate change and malaria: Analysis of the SRES climate and socio-economic scenarios. Glob. Environ. Chang. 2004, 14, 87–99. [Google Scholar] [CrossRef]
- Hagenlocher, M.; Castro, M.C. Mapping malaria risk and vulnerability in the United Republic of Tanzania: A spatial explicit model. Popul. Health Metr. 2015, 13, 2. [Google Scholar] [CrossRef] [PubMed]
- Dinku, T.; Block, P.; Sharoff, J.; Hailemariam, K.; Osgood, D.; del Corral, J.; Cousin, R.; Thomson, M.C. Bridging critical gaps in climate services and applications in africa. Earth Perspect. 2014, 1, 15. [Google Scholar] [CrossRef]
- Dinku, T.; Funk, C.; Peterson, P.; Maidment, R.; Tadesse, T.; Gadain, H.; Ceccato, P. Validation of the CHIRPS satellite rainfall estimates over eastern Africa. Q. J. R. Meteorol. Soc. 2018, 144, 292–312. [Google Scholar] [CrossRef]
- Dinku, T.; Kanemba, A.; Platzer, B.; Thomson, M.C. Leveraging the Climate for Improved Malaria Control in Tanzania. Earthzine, 2014. Available online: http://www.earthzine.org/2014/02/15 (accessed on 28 March 2020).
- Ouma, P.O.; Maina, J.; Thuranira, P.N.; Macharia, P.M.; Alegana, V.A.; English, M.; Okiro, E.A.; Snow, R.W. Access to emergency hospital care provided by the public sector in sub-Saharan Africa in 2015: A geocoded inventory and spatial analysis. Lancet Glob. Health 2018, 6, e342–e350. [Google Scholar] [CrossRef]


| Institution | Type |
|---|---|
| Ministry of Water | Government |
| Tanzania Meteorological Agency (TMA) | Government |
| Wami-Ruvu Basin Water Board | Government |
| Rufiji Basin Water Board | Government |
| National Bureau of Statistics (NBS) | Government |
| National Environment Management Council | Government |
| E-link Consult ltd. | Private |
| Wema Consult | Private |
| University of Dar es Salaam- Institute of Resource Assessment | Academic |
| President’s Office, Regional Administration and Local Government | Local Government (PO-RALG) |
| Planning Commission | Government |
| USAID Water Resources Integration Development Initiative (WARIDI) | Donor funded project |
| Regional Centre for Mapping of Resources for Development (RCMRD) | Intergovernmental |
| Component | Indicator | Variable | Data Source |
|---|---|---|---|
| Exposure | Precipitation change | Long term trend in annual precipitation | CHIRPS enhanced precipitation for Wami Ruvu and Rufiji basins (1981–2016) |
| Precipitation variability | Long term Coefficient of Variation in annual precipitation | CHIRPS enhanced precipitation for Wami Ruvu and Rufiji basins (1981–2016) | |
| Floods | Flood frequency (events/100 years) | UNEP GRID (2009) | |
| Temperature | Long term mean of annual maximum temperature | FEWSNET ITE temperature (1981–2012) | |
| Sensitivity | Soil health | Soil organic carbon | FAO-ISRIC Global Soil Organic Carbon Map (2017) |
| Poverty | Poverty index | National Bureau of Statistics (2016) | |
| Child mortality | Under 5 mortality rate | National Bureau of Statistics (2015) | |
| Malaria susceptibility | Malaria endemicity index | Malaria Atlas project (2010) | |
| Population | Population count/ward | National Bureau of Statistics (2012) | |
| Land use land cover | Land use land cover change | RCMRD (2010) | |
| Adaptive capacity | Crop productivity/Yields | Water Requirement Satisfaction Index (WRSI) | FEWSNET GeoWRSI (1981–2016) |
| Water access | Access to safe drinking water | National Bureau of Statistics (2015) | |
| Markets | Access to market services (travel time) | JRC World travel time map (2015) (Weiss et al., 2018) | |
| Availability of health services | Health infrastructure index | DHS (2015) |
| SoVI (Equal Intervals) | Vulnerability Level | % Land Area | Total Population (2015) | Population % |
|---|---|---|---|---|
| 0–20 | Lowest | 2 | 1,058,367 | 9 |
| 20–40 | Low | 12 | 3,412,546 | 28 |
| 40–60 | Medium | 49 | 5,682,709 | 46 |
| 60–80 | High | 35 | 2,010,397 | 16 |
| 80–100 | Highest | 2 | 103,995 | 1 |
© 2020 by the authors. Licensee MDPI, Basel, Switzerland. This article is an open access article distributed under the terms and conditions of the Creative Commons Attribution (CC BY) license (http://creativecommons.org/licenses/by/4.0/).
Share and Cite
Macharia, D.; Kaijage, E.; Kindberg, L.; Koech, G.; Ndungu, L.; Wahome, A.; Mugo, R. Mapping Climate Vulnerability of River Basin Communities in Tanzania to Inform Resilience Interventions. Sustainability 2020, 12, 4102. https://doi.org/10.3390/su12104102
Macharia D, Kaijage E, Kindberg L, Koech G, Ndungu L, Wahome A, Mugo R. Mapping Climate Vulnerability of River Basin Communities in Tanzania to Inform Resilience Interventions. Sustainability. 2020; 12(10):4102. https://doi.org/10.3390/su12104102
Chicago/Turabian StyleMacharia, Denis, Erneus Kaijage, Leif Kindberg, Grace Koech, Lilian Ndungu, Anastasia Wahome, and Robinson Mugo. 2020. "Mapping Climate Vulnerability of River Basin Communities in Tanzania to Inform Resilience Interventions" Sustainability 12, no. 10: 4102. https://doi.org/10.3390/su12104102
APA StyleMacharia, D., Kaijage, E., Kindberg, L., Koech, G., Ndungu, L., Wahome, A., & Mugo, R. (2020). Mapping Climate Vulnerability of River Basin Communities in Tanzania to Inform Resilience Interventions. Sustainability, 12(10), 4102. https://doi.org/10.3390/su12104102