Geodesign Process Analytics: Focus on Design as a Process and Its Outcomes


1
Department of Civil and Environmental Engineering and Architecture, University of Cagliari, 09042 Cagliari, Italy
2
School of Architecture and Urbanism, Federal University of Minas Gerais, Belo Horizonte 30130-140, Brazil
*
Author to whom correspondence should be addressed.
Sustainability 2020, 12(1), 119; https://doi.org/10.3390/su12010119
Submission received: 6 November 2019
/
Revised: 19 December 2019
/
Accepted: 19 December 2019
/
Published: 22 December 2019
(This article belongs to the Special Issue Sustainable Urban Planning Techniques)
Abstract
:This paper argues that the opportunities offered by currently available collaborative Planning Support Systems (PSS) are useful not only for applying a systems approach and coordinating actors in the planning process, but also for tracking the evolution of design alternatives toward a final plan. The availability of process log-data in the latest PSS opens new paths for understanding (geo)design dynamics. With the aim of taking full advantage of this new data source, a novel Geodesign Process Analytics is described in detail from log-data extraction and pre-processing methods and tools to the development of the set of spatial, performance, temporal and design evolution indicators. The study also demonstrates how the proposed measures are appropriate for display in a dynamic dashboard, making available a real-time process analysis tool to the team coordinators, thus supporting their leading role in facilitating the geodesign process. The research assumptions were tested using the Geodesignhub PSS and data from a geodesign study developed within the International Geodesign Collaboration.
1. Introduction
In recent decades, the availability of a variety of advanced digital tools for design has advanced the creative process gradually supplanting the traditional analogue pen-and-paper methods used by individual designers to communicate their ideas. The recent shift towards the development of collaborative design systems has enabled multiple designers and citizens to act together interactively (e.g., collaborative Computer Aided Design—CAD, Building Information Modeling—BIM, Volunteered Geographic Information platforms—VGI) [1,2] to address the growing complexity of contemporary design challenges. The general trend is now to move farther away from desktop single-user solutions towards web-based interactive multi-user systems [3]. Novel technological advances are giving rise to potential new ways of designing and mapping in collaborative environments.
Computer-based support tools in urban and regional planning have moved along this trend thanks to the advances both in Information Communication and Technology (ICT) and in the planning approaches. The increasing complexity of current planning challenges requires “smart” support tools which allow creation and evaluation of design alternatives quickly and efficiently, and at the same time in a more engaging way [4]. A subset of these geo-information technologies, known as planning support systems (PSS), has met these challenges by providing support to the whole, or to some part of, complex planning processes and workflows. PPS combine a range of digital technologies to support different aspects of the planning process in an integrated way [5,6], including “computer-based tools for public participation” and collaboration among stakeholders [7].
The use of digital information technologies and the active engagement of local communities, or the people of the place in the design process are two key elements of the geodesign approach [8,9]. Although traditional public participation has been a challenge in many situations, [10], geodesign methods have been proven successful in engaging members of the local community in the design phase through genuine collaboration.
In the last decade, the geodesign approach to spatial planning has attracted the interest of the academic community [9,11,12], business companies [13] and institutional environments [14,15]. Ervin [16,17] identified “15 essential components of an ideal geodesign toolbox” associating to each of them a specific set of digital tools. Among these components, real-time digital dashboards are proposed as a tool for interactively displaying the impacts of design alternatives against desired performance criteria and, thus, offering real-time support to decision-making. These dashboards can be used to rapidly evaluate the achievement of goals or targets, or to identify at a glance potential conflicts or critical situations.
In addition, real-time digital dashboards are useful for monitoring and analysis of the geodesign collaborative process itself. Within the context of the broader geodesign analytical framework, this study focuses on the development of a set of indicators that may be used by the coordinators of geodesign studies to evaluate both the behavior and the performance of the participants involved in the process, and the evolution of the design outcomes through time. Among the objectives of this study are assessment of the achievement of performance and participation levels (e.g., number of times a participant used the sketching tool in a design support system, or to identify leading vs lagging behind participants), along with analysis of spatial relations (e.g., intersection, proximity) among design alternatives proposed by different groups of stakeholders. This is key in identifying areas of disagreement, which may help to reach consensus among stakeholders. It is argued that investigating these aspects can increase the coordinator’s understanding of the process, which can, in turn, lead to improved outcomes, as well as, inform future process workflows. Moreover, through this approach, it is possible to evaluate existing support tools, as well as, to aid the development of new process-oriented PSS [18].
In general, traditional data collection methods used to measure design dynamics in collaborative and computer-supported processes are based on traditional data collection tools (e.g., audio/video recording, survey, etc.) [5,19], and are very demanding in terms of both time and human resources. ([20,21]). However, in the contemporary information age, automated or computer-supported processes leave historical traces behind that exist in several forms, such as event logs [22]. Many commonly used design software applications capture and make available information about actions taken automatically by the system or actively by the users [23,24]. The recently developed collaborative PSS Geodesignhub [25] records log-data regarding the actions undertaken by the participants involved in a geodesign study and their products.
Increasingly in the last decade, organizations rely on the availability of log-data to improve and support their business processes in competitive and rapidly changing environments [26]. Robust process mining techniques have been developed in recent years in several domains ranging from web page contents and usage [27,28,29], education and e-learning platforms [30,31] and software engineering to detect anomalies and errors in systems processes [32]. Despite the growing interest in log-based process analysis, very few, although very promising, studies—have been undertaken to exploit the potentialities of this new data source in the design field [20,22,33].
Taking advantage of this approach, we propose a methodology to extract knowledge from Geodesignhub log-data in order to monitor and to understand the design dynamics of a study, ultimately aiming at improving collaborative geodesign processes. Both historical and real-time log-data can be analyzed using the set of indicators developed as a part of a more comprehensive framework for a Geodesign Process Analytics (GDPA). In a previous study, we applied inferential statistics techniques for testing a subset of those indicators using log-data of an existing geodesign study [34]. Insights gained from ex-post analyses of a large number of collaborative design studies can be used to guide future cases with a view to process, design and coordination improvement.
The objective of the present study is to evaluate whether the analysis of information on the ongoing design dynamics, as recorded in the Geodesignhub log-data and made available in a timely and user-friendly manner through dashboards, can help improve the real-time management of geodesign processes. Several steps are necessary to collect, prepare, and analyze log-data to extract useful information about the current process unfolding. Hence, this paper’s structure is organized as follows: in Section 2 the main phases and the characteristics of the log-data of the PSS Geodesignhub are presented; Section 3 is entirely dedicated to the proposed analytical process, from data extraction methods to the detailed description of the indicators, a subset of which was tested with the log-data of the Cagliari case study presented in Section 4.
2. Novel Methods, Tools and Type of Data
2.1. Geodesignhub System
The Geodesignhub PSS [35] was specifically designed to implement the Steinitz’s framework [8] digitally, enabling dynamic interactive and collaborative design. Its use was tested in a variety of settings [15,36,37,38] and it proved to be particularly useful in the early strategic stages of urban and regional planning. Itcreates a user-friendly collaborative working environment where in a very short time, multiple stakeholders, with different backgrounds and views, can present their project proposals (i.e., , create diagrams representing projects and/or policies), assemble them in integrated complex plan alternatives (i.e., , syntheses), and compare them in order to negotiate compromise solutions based on consensus. As such, it enables the rapid development of strategic plans where the design of short-term actions is spatially explicit. This possibility overcomes some of the main pitfalls of strategic planning [39,40], including the lack of cross-fertilization and mutual understanding of strategies and short-term actions among stakeholders, the length of the process, and the often vague verbal nature of its outcomes.
In practical terms, Geodesignhub is most often used to support two-day geodesign workshops where the main actors involved in a planning process can interact through the platform. The platform in principle has no limit in terms of number of participants, and workshops with up to about seventy participants have been successful. The typical workshop is divided into three main phases (supported by tools available in Geodesignhub):
- creation of design proposals in the form of georeferenced project or policy diagrams (using the “sketching and visualization tool”), organized by systems (e.g., agriculture, housing, etc.) each in its own colour;
- creation of design alternatives (using the “design creation tool” and the “compute detailed impacts tool”), usually by up to six teams, each with its own objectives, who select a set of diagrams and test their performance with an impact assessment interactive dashboard including maps and charts;
- resolving conflicts and negotiating (using the “comparison tools” and the “negotiation tools”) towards a final common design based on consensus.
The objective of the workshop is twofold: enhancement of understanding of complex planning problems through dialogue and collaboration eventually leading to agreement on a spatial development scheme. The latter will represent those short-term actions [40] which constitute the back-bone of the implementation of mid-long term strategies.
A geodesign workshop using Geodesignhub demands a fast-paced iterative workflow and can involve many participants. It is essential for the coordinator to manage the schedule take best advantage of all the participants interacting together (either physical or virtual). In general, and more specifically in workshops with many participants, or in large virtual online workshops, the coordinator’s ability to make sure all the participants are engaged and productive is critical. The availability of a real-time dashboard monitoring of participants’ performance can be of substantial help in aiding the coordinator. The following part of this section describes the main characteristics and data structure of the Geodesignhub log-data, which provides the foundation on which the dashboard monitoring is built.
2.2. Geodesignhub Log File
A “log file [is] a computer file that contains a record of all actions that have been done on a computer, a website, etc.” [41]. Several current information systems and software applications automatically store information about events occurring as a result of a user’s action or a running process. Log files represent a valuable source of data to aid understanding of the history of processes. The use of process mining techniques is widely spread in many domains [42]. The logs can use standard or proprietary - and more or less structured - text formats (e.g., common log format, XML, JSON, etc.). Notwithstanding the different formats, log-data always include information relating to each specific activity and task (i.e., , event) that occurs within the process workflow. Additional properties are usually recorded, such as the timestamp and information about the user or the device executing the actions.
More recently, the use of log-data has been applied in the design support systems domain on the premise that each command executed by a designer in a working session can be though as an event in the field of process mining, thus an action potentially interesting for analysis [22]. Large numbers of commands are often needed to complete a task in computer-aided design software and systems (e.g., CAD, BIM, GIS, PSS, etc.). The number/sequence of commands and the average time taken by a designer to execute a task can be analyzed to understand recurrent patterns in users’ performance and design teams’ collaboration behaviors. A study to analyze users’ productivity performance in the BIM software Autodesk Revit used a log-data database containing information about 25 designers who produced (executed) at the micro-level more than 20,000 design events (/commands) to complete 13 architectural projects at the macro-level [22].
In advanced Planning Support Systems, such as Geodesignhub, information on participants’ and teams’ actions is closely related to the semantics of the design task at the macro-level, that is to macro-tasks, whose execution originates a meaningful design element (e.g., diagrams created, or diagrams selected in the syntheses). Geodesignhub log-data are, therefore, a collection of diagrams directly resulting from users’ actions (i.e., , “create, “select”), and thus worthy to be considered as events in process mining. The design elements generated by the software semantically represent individual project and policy, encoded and stored in the system database as polygon spatial features. The data structure of a diagram (Figure 1) differs from traditional geographic information because it combines the traditional spatial components with the temporal dimension (i.e., timestamp, project implementation timing), user information and preferences (i.e., author, system priority weight), as well as the thematic attributes (e.g., type, system they belong to), and in some cases complementary multimedia data (i.e., , photo, video, tag). In many ways, it is possible to compare Geodesignhub diagrams to the spatial user generated contents retrieved from social media platforms [43]. The potential of both new types of data within the design domain is promising, and the analytical framework we are proposing may represent a first effort to fully exploit the possibility offered by the Geodesignhub log-data.
3. Analytical Process
3.1. Geodesign Process Analytics
The peculiar data structure of the Geodesignhub log-data provides unparalleled opportunities to analyze geodesign studies. In order to provide the basis for the development of a comprehensive geodesign analytical framework (i.e., , Geodesign Process Analytics or GDPA), we focused on the two meanings of the term design, as stated by Steinitz [8]: design as a verb, highlighting the importance of the process itself, and design as a noun, identifying its product (Figure 2). Unlike other type of design software, such as CAD or BIM, information on participants’ interactions with the Geodesignhub platform is obtained indirectly by looking at the results of their actions.
On the one hand, diagrams are seen as the fundamental products of a geodesign study and analyzed with regard to geometry, the system they belong to (e.g., Agriculture, Housing, etc.), or other characteristics to assess their individual design quality and the spatial relations between them. A set of spatial analysis models, previously proposed by Freitas and Moura [44], is extended here in order to create spatial indicators useful to identify in real-time possible conflicts of interest among stakeholder teams (i.e., , incompatible land-uses).
On the other hand, diagrams are considered as design events each representing a task carried out by a participant (i.e., , create a diagram; select a diagram). The quantity of diagrams created or selected can be used to analyze the productivity of the workshop participants and the evolution of the design alternatives. Temporal information of the diagrams allows evaluation of a participant’s behavior and performance over time. The analytical process presented in the following sections aims to extract useful information on the design product and process from the Geodesignhub log-data. This process includes data collection, preparation, analysis and the use of spatial analysis and statistics techniques to derive useful insights from this information (Figure 3).
The proposed methodology is only the first step towards developing a complete Geodesign Process Analytics, yet it offers a set of useful indicators and measures to gain insights on the design dynamics and patterns that drive participants’ actions and their results in a typical workshop workflow. We argue, in fact, that the new knowledge gained from log-data analysis can help the workshop coordinator i) to evaluate the participants’ performance during the ongoing process, and ii) to discover meaningful patterns and trends in post-workshop analyses. Since (geo)design processes are now observable and measurable, ongoing or future processes can be potentially improved on the basis of an empirical understanding of their dynamics. Statistical analytical techniques were applied to the performance, temporal and design evolution indicators proposed in this study. Some of them are more suitable to support the coordinator in real-time in their role of facilitating the process, while others aid post-workshop analysis of the design process itself and in comparisons with other studies. This study focusses on the use of descriptive statistics and interactive dashboards aiming to provide quick and simple real-time updates to the coordinator of the workshop, whose fast pace workflow requires fast-moving attention. Indicators have not been designed to automate decisions but rather as warning systems able to inform the coordinator about potential issues in the process that may require further attention.
3.2. Data Extraction
Geodesignhub exposes its log-data via API. Information related to project objects is made available, including: diagrams (e.g., details of all diagrams created in a project); change teams (e.g., list of all diagrams selected in a group synthesis); the project in general (e.g., list of participants that took part in a project); systems (e.g., details of all systems considered in a project). The API is JSON-based and all the requests return GeoJSON files. The Python urllib2 module was used to query the API and retrieve information useful for analyzing the design process. An excerpt of the GeoJSON file containing details of all diagrams that were created in a project is shown in Figure 4. Spatial and non-spatial components of a GeoJSON object (i.e., , FeatureCollection) are stored in the one-row GeoJSON string. In this example, the “diagramid” is the unique identifier assigned by Geodesignhub platform and the “author” information were omitted for privacy. Information on other project objects were similarly retrieved and saved in JSON or GeoJSON formats.
In addition, the plug-in Geodesignhub Dashboard is accessible to the non-technical user and allows downloading individual diagrams in the common Shapefile format. API functionality was used here to get a text-based version of the Geodesignhub interface with textual descriptions of diagrams, change teams and users. Groups’ syntheses can also be manually downloaded in the “Design History” section. Although Geodesignhub enables export of key data from the platform, manual download can be very time consuming because of the many project and policy diagrams (typically200 or more).
More recently, the research team of the Laboratório de Geoprocessamento of the Universidade Federal de Rio de Janeiro in Brazil developed an open source tool for querying Geodesignhub API and downloading diagrams in Shapefile format. The tool (Geodesign Hub—Vicon SAGA) is integrated in the GIS-based web platform Vicon/SAGA, which provides functionalities for data collection, storage, querying, visualization and exchange in many formats [45,46]. Although programming skills are not required, making downloading much easier and faster, the collected data are lacking several available attributes. Data gaps may affect the analysis and should be addressed. Data access through the API, although requiring more advanced IT skills, remains the preferred option to enable collection of a richer set of log-data.
The methods and tools of data pre-processing described in the next section allowed us to extract complete design process information from raw log-data and organize them into a geodatabase [47], facilitating the analyses. Software and procedures used in this study are not new in the field of data mining, however, the application of these methodologies in the design domain is still substantially unexplored.
3.3. Data Preparation
Data preprocessing aims to offer a structural, reliable, and integrated data source for pattern discovery. This process encompasses a first data cleaning phase that can be implemented using Extract Transform Load (ETL) software. ETL transformation tasks support data optimization for efficient storage and analysis. Performed operations include cleaning, summarization, integration, and aggregation. The spatially-enabled version of Pentaho Data Integration, GeoKettle (version 2.5) provides full control over the entire process through an intuitive graphical user interface. The ETL tool extracts data from a source, transforms it to fit the users’ needs, and then loads it into a destination or database. ETL tools were initially developed to be used in the Information Communication Technologies (ICT) field, specifically in the processes of data migration between relational databases. More recently, the rapid diffusion of Business Intelligence tools (BI) has broadened the scope of ETL software by including the fast and automated building of data warehouses for data visualization rather than only storage. Currently, ETL tools expand their functionalities though the inclusion of spatial data and operations capable of competing with existing desktop Geographic Information System (GIS) software. The Geokettle software employed in this study falls within the category of spatial ETL tools.
Figure 5 shows the ETL data transformation diagram for validating (e.g., eliminate empty diagrams), filtering (e.g., selecting only certain attributes/columns) and splitting (e.g., multi-polygon diagram into single-polygon diagrams) a GeoJSON collection of features containing details of all the diagrams created in a Geodesignhub project. The sequence of data transformation activities began with reading the input data, splitting the GeoJSON unformatted single row into features or feature collections, and identifying diagrams with no geometry to be excluded from the analysis (Figure 5a). Features and feature collections were then separated for further pre-processing into their spatial component (Figure 5b, Figure 5c) and into their non-spatial attributes (Figure 5d). A series of transformation steps was applied to pull out useful information from the input data, in particular, multipart diagrams were split into single-part features (Figure 5c) to avoid losing information. Finally, cleaned geometry and properties components were merged and temporarily saved in shapefile format (Figure 5e) to allow a preliminary data exploration and visualization in a GIS environment.
The ETL transformation task described in Figure 5 allows automatic preprocessing of GeoJSON files downloaded from Geodesignhub API. Resulting data were used to create and populate the database following a specific data model (Figure 6). Although small, the relational database was structured in accordance with a series of normal forms to reduce redundancy of data and prepare a clearer and readable data model [47]. Normalization includes organizing data attributes in tables and establishing relationships between those tables. Relations can be of various types as well as different in their representation. For example, a “one-to-many” relationship (1 - 1*) exists between the tables “group” and “sys_priority”. A system priority value represents design preferences of a single group, but a group assigns different priority values, as many as the systems considered in a project. Whereas, a “zero-to-many” relationship (0 - *) connects the “group” and the “synthesis” tables. A synthesis could be created by a group or by no group, it could, in fact, be the result of a negotiation process within a coalition. Additionally, a group may have created more than one synthesis.
The open source relational database PostegreSQL was used in this study, mainly because of its spatial functions for processing and analysis of geographic objects. The extension PostGIS allows storage and querying of spatial data and supports various geometry types (e.g., POLYGON, MULTI-POLYGON) expressed in Open Geospatial Consortium (OGC) formats (e.g., Well-Known Text—WKT, Well-Known Binary—WKB). Currently, it provides a large set of spatial functions enabling the fast retrieval and processing of geographic information, without the need to use any additional GIS-based analysis tools.
At this point, the “Load” functions of ETL software were exploited for writing the processed data into the database. The second phase of the data transformation (Figure 7) includes a series of steps for filtering first, and then loading, data attributes into the target tables. Geometries and properties components of all diagrams created in a Geodesign project populated the “system” (Figure 7a), “author” (Figure 7b) and “diagram” (Figure 7c) tables. Additionally, priority weights assigned to the systems by the stakeholder groups can be obtained by Geodesignhub API calls and loaded into the “sys_priority” table (Figure 7d).
The other tables, identified in the data model in Figure 6, were populated with data containing details of all diagrams selected in the group/coalition syntheses created in the project (Figure 8). The input step of the data transformation diagram was a series of shapefiles collected in a File List (a text file listing of the shapefiles contained in the syntheses folder) (Figure 8a). Data was cleaned and loaded in the target tables including “selection” (Figure 8b), “synthesis” (Figure 8c), “group_” (Figure 8d), “coalition” (Figure 8e) and “component” (Figure 8f) tables.
We provided a first set of indicators to analyze participants’ performance and design evolution which combine the analytical dimensions made available by the data model. The following section describes in detail the analysis, which was articulated as follows: (i) spatial queries were used to investigate the relations among geometric objects (diagrams) present in the spatial dataset, and (ii) descriptive statistical analysis was applied to identify the relations between temporal and thematic attributes (e.g., time of creation of a diagram, system name, frequency of selection, etc.). The results of the analyses applied to the Cagliari case study are reported in Section 4.
3.4. Data Analysis
3.4.1. Spatial Indicators
In 2018, Freitas and Moura [44] exploited the ETL capabilities to manage spatial data and developed effective methods to analyze topological relationships and positional similarity among diagrams (Table 1). Two data transformation diagrams were set up and tested using diagram collections from several geodesign workshops. Understanding spatial relationships (e.g., intersection, proximity) among selected diagrams, and combining them with other attributes (e.g., system name, diagram title), allows identification of possible conflicts of interest or areas of agreement within the teams or among the teams. This, in turn, is likely to stimulate dialogue between workshop participants with a view to fostering consensus on a common design. The following indicators are suitable both to be displayed in a real-time dashboard facilitating dialogue and negotiation and to be used as a basis of comparison with other studies.
In this paper, we propose the use of PostGIS spatial functionality for querying the log-data database about spatial relationships among diagrams. Spatial databases are able to manipulate spatial data, rather than simply store and organize them. PostGIS, in particular, supports all the standard OGC geospatial operators (e.g., distance, within, intersects, closest, etc.) and it is considered the most efficient open source solution for managing geospatial data [48]. Topological and geometrical queries were formulated in SQL to analyze the spatial properties of diagrams. The advantage of using the databases for data analysis (as opposed to ETL tools) is that it eliminates the need to extract the data by creating transformation steps that can be directly performed in the database repository. In addition, data is automatically processed as information and is loaded into the database without the need for further technical intervention.
A first set of spatial functions defines the topological relationships between two overlapping diagrams (A ∩ B ≠ ∅) selected by two different change teams (Figure 9). The existing relationships between the spatial objects can be determined by evaluating their possible combinations and calculating the proportion between the intersection area and the diagrams areas. Three topological relations—partially based on the 9-intersection model [49]—were identified as being of interest for the workshop coordinator:
- If the intersection area is greater than the 80% of the total area of the two diagrams, they are considered “similar” (Figure 9a);
- If the intersection area is greater than the 80% of the area of the first diagram, A is “within” B (Figure 9b);
- If the intersection area is greater than the 80% of the area of the second diagram, A “contains” B (Figure 9c).
A second set of spatial functions includes a more elaborate analysis setting to be used in case of a “disjointed” relation between two diagrams (A ∩ B = ∅). The proposed approach relates the concept of proximity (or nearness) between two diagrams to the minimum bounding rectangle of all diagrams created. A bounding box is a rectangular polygon aligned with the coordinate axes that encompass a spatial feature, or group of features, from its minimum and maximum coordinates in the x and y directions. If the distance between two diagrams, based on the length of the segment linking their centroids, is less or equal to 12.5% of the shorter side of the bounding box, the two diagrams are considered to be close. It is worth mentioning that in assessing spatial proximity, the shape of the diagram counts. This approach, which considers the coordinates of the centroids, provides an efficient trade-off between computational time requirements and accuracy of results.
3.4.2. Participants’ Performance Indicators
Drawing design proposals in the form of projects and policies is one of the main tasks performed by the participants involved in a Geodesignhub workshop. Diagrams were used as the basis for assessment of participants’ performance. The number of diagrams created was combined with thematic attributes (i.e., , author, system, type) to construct the first three indicators of the set presented in Table 2. We argue that those indicators can support the workshop coordinator’s understanding of participants’ performance in real-time, and help detect any related issues in the early stages of the design development process.
The indicator Top Contributors (Table 2) identifies leading participants with greatest potential to influence the design and, perhaps more importantly, those lagging behind who may need further attention in performing their work. Also, within the multi-system approach of geodesign, all systems identified as relevant for the development of the study area (e.g., Agriculture, Housing, etc.) will be taken into consideration. The coordinator plays an essential role in identifying systems of major interest and those not sufficiently considered. The real-time assessment of the Diagram creation by system efficiently supports this task. Geodesignhub uses two types of diagrams to convey ideas for a change in a system, projects and policies. A project envisages a physical change on the study area and its impacts and costs can be measured. In the Geodesignhub computational logic, a policy will not have a quantified physical impact on the site. The objectives underlying policies are achieved through private/public incentives or the creation of ad hoc laws, therefore, its impact and cost are not taken into account. The number of diagrams created per type (Diagram creation by type) helps to get a preliminary idea of most pressing needs (e.g., new infrastructure or buildings or changes in activity patterns).
A second group of performance indicators is used to evaluate the influence of background information on the number of diagrams created. Cocco et al. [34] explored the relationship between number of diagrams created and the personal and professional profiles. Inferential statistical techniques were used to perform correlation analysis between the available dimensions: age group, education level (e.g., undergraduate, graduate, PhD), level of experience (e.g., previous experience with Geodesignhub/PSS), professional expertise (e.g., architecture, planning, ecology), role within the area of interest (e.g., practitioner, researcher, student). The number of diagrams created is also indicative of participants’ perceived mastery of the built-in sketching tool. However, the tendency of homogeneous categories of participants (in terms of age, expertise, etc.) to reach similar level of performance should be further investigated by using the descriptive indicators proposed here in comparative studies of workshops results, whether or not they are complemented with inferential statistics.
Another aspect to be analyzed in a post-workshop phase is the influence of the role played by system experts and stakeholders) on performance as authors of diagrams. It is expected that stakeholders would create more diagrams if they were not satisfied by the experts’ first design proposals. System experts’ performance can act as an indicator of stakeholders’ satisfaction in respect to the experts’ first proposals/diagrams.
3.4.3. Temporal Indicators
Time stamps contained in the Geodesignhub log-files provide precise temporal information on two events: “diagram creation” and “synthesis creation”. In addition, it is possible to infer temporal information for several different steps in a geodesign workshop workflow (e.g., “Experts Create Diagrams”, “Add Diagrams and Create Synthesis 1”, “Add Diagrams and Create Synthesis 2”, etc.) and establish time intervals between the starting time and the end time of each step. This information was systematically exploited in the set of temporal indicators listed in Table 3.
More specifically, real-time measurement of Workshop steps duration was useful to assess whether the workflow is properly following the initial schedule. If delays occur, they should be carefully monitored by the coordinator during the workshop and then analyzed in detail by the project coordination team after the workshop to identify the reasons for delays.
The temporal dimension of diagrams was also used to measure various indicators for evaluating participants’ and groups’ performance over time. Diagrams can be associated to workflow steps on the basis of their creation time, making it possible to observe variations in the number of diagrams created as the workshop progresses. Participants’ performance (individually or in groups) can differ significantly throughout the workshop until a final agreement is reached. This analysis was particularly interesting in regard to Diagram creation over time by group of stakeholders/coalitions. Despite the fact that no statistically significant difference has been found so far [34], these dynamics need to be examined in more depth using time series graphs to investigate differences in the Diagram creation over time, both between, and within the workshop steps.
The Average time spent on diagram creation can help to better understand differences across the steps. We argue average time spent on diagram creation may vary greatly from one step to another. Leaving aside differences in the workshop timetable, there could be other reasons for variations (e.g., influence of the coordinator, difficulties experienced by the participants in using the software, disagreements within the team, difficulty of the subject matter, etc.), which should be considered in comparative studies.
3.4.4. Indicators of Design Evolution
Log-data have previously been used to measure the productivity of participants based on the number of diagrams created and assessed over time. Similarly, in this section we relate the number of diagrams selected in the groups’/coalitions’ syntheses to different thematic attributes (i.e., , author, stakeholder group, system, system priority weight) to develop a better understanding of design evolution dynamics. The first set of indicators proposed in Table 4 should both help the coordinator to have a clearer insight into the intermediate results of the design process, and enable a comprehensive analysis of the results.
The Frequency of diagram selection in all the groups’/negotiation coalitions’ syntheses is a useful indicator of each diagram’s success. The diagrams with the highest frequency of use in the syntheses were identified. The shape of the curve in the frequency distribution graph shows the extent of agreement among groups and provides a first indication of the degree of disagreement that must be addressed in order to achieve consensus among the stakeholders. This metric was also applied at the level of individual participants to identify leading individuals having greater influence in the design. The Top Contributors can be compared to the Top Influencers to identify for each participant potential relationships between the number of diagrams created and their success.
The evolution of the syntheses, measured by the number of diagrams selected, provides an indication of the groups’ performance over time, especially if compared with the analysis of how many diagrams were selected per system. Differences across the syntheses can be associated with possible changes in Groups’ views as the process develops. Significant differences across the group’s syntheses in the number of selected diagrams aggregated by system in relation to its priority weight are likely to indicate that the group has modified its views.
Lastly, the role played by the diagram authors can also be tested. The number of diagrams selected in the syntheses is classified by author type, either system experts or stakeholder teams. The hypothesis according to which the Diagram selection frequency changes based on the role played by author has been tested in a previous study [34]. Preliminary results showed that the chance of diagrams created by expert groups to be selected in the subsequent syntheses was greater than those created by the non-expert stakeholders in the other steps.
The participants’ performance, and the temporal and design evolution indicators described above, and related set of measures, were implemented in R, an open source software environment for statistical computing and graphics. R can be used to analyze data from many different sources including PostgreSQL. The log-data geodatabase was connected, and data access operations were performed using the R driver PostgreSQL. The indicators suitable for display in the coordinator’s real-time dashboards were tested on the Cagliari geodesign workshop log-data.The results are presented in the following section. The R extension Shiny was used for data visualization in interactive dashboards. Dashboards are visual indicators of information based on performance metrics that have been previously defined as relevant. Shiny enables users to rapidly build complex web applications using the R language without web development. It cannot be considered a direct substitute to more complex Business Intelligence (BI) platforms, yet it ensures an interactive data experience of sufficient quality for use in this study.
4. Case study
4.1. The Metropolitan City of Cagliari
Among the various geodesign workshops developed by the authors encompassing a range of conditions (i.e., , academic environment, real planning problems) and territorial scales (e.g., neighborhood, metropolitan area, etc.), the geodesign study of the Metropolitan City of Cagliari held in October 2018 was chosen for testing the effectiveness of real-time indicators. The interactive dashboard is investigated as assistance for the workshop coordinator, helping monitor developments in the design process, especially in cases where their multiple role of guidance, coordination and control of activities are extremely complicated (e.g., multi-session workshop, many participants, majority of non-expert participants, etc.).
The Cagliari workshop took place at the University of Cagliari within the Spatial Planning Course of the Civil Engineering MSc program, investigated a study area of 80x80 km including the whole Metropolitan City of Cagliari (MCC), and involved 56 students with little or no earlier background in spatial planning and design. The geodesign workflow was divided into five three-hour sessions and coordinated by a team of experts (i.e., , a professor and two assistants). It required an intense organizational effort and substantial monitoring work between sessions to assess the evolution of the process, maintain its efficiency and efficacy, and assess student performance. It was necessary, as in many dynamic situations to devise remedial targeted actions to address problems of both participation and subject matter.
The design of scenarios for future sustainable development of MCC has been the focus of two earlier geodesign studies in 2010 and 2016 [11,50], of one week and two days respectively. The choice of the area is very timely since the Metropolitan Government recently began (2018) their Territorial Strategic Plan, the development framework for future physical planning.
The 2018 study is part of the International Geodesign Collaboration (IGC) project [51], and therefore followed the requirements established by the Collaboration. The IGC is based on two future planning horizons of 2035 and 2050, and three different design approaches: Non-Adopters (NA) continue with business-as-usual until the final study date; Late Adopters (LA) follow a business-as-usual scenario during the first time stage (2020-2035) and consider adopting technological innovations in design proposals for the second period (2035-2050); Early Adopters (EA) include innovations within project and policies in both time periods. IGC standards include nine systems to be analysed, including blue infrastructure (BI), green infrastructure (GI), grey infrastructure (TRANS), energy (EN), agriculture (AG), low-density housing (LDH), mixed high-density (MIX) housing, institutional uses (INST) and industry-and-commerce (IND) land uses. Based on the specific conditions of the study area, History and Cultural Heritage (CULTH) was added to become the tenth of the systems. In the first phase the students played the role of experts and were assigned to one of the systems (e.g., transport planners or engineers, agronomists, etc.). In this stage they worked individually to produce a first set of diagrams, and become familiar with the Geodesignhub software. In the second phase they were grouped into six scenario-driven change teams (EA35, EA50, LA35, LA50, NA35, NA50) and were asked to select appropriate combinations of diagrams to create a design representing their development goals and interests which was then evaluated. After three rounds of designs, each of the six groups produced a plan for the MCC. The final stage of the workshop identified shared strategies amongst the six change teams, grouped them into coalitions, (NA35+NA50; LA35+LA50; EA35+EA50) and instigated a negotiation process in order to reach consensus on a single integrated development strategy for the MCC 2020–2050.
4.2. Results
Precisely by the negotiation phase, the spatial indicators can provide a great support to focus the dialogue more sharply on solving the potential conflicts of interest between stakeholder groups. Table 5 shows in detail the topological relations between the overlapping diagrams of the latest synthesis of the group EA50 and EA35 respectively, which was exactly the starting point for their negotiation process. The construction of new “High-density 3D printed houses” proposed by the Early Adopter 50 group is “within” an area devoted by the group Early Adopter 35 to “Smart farming and precision agriculture with drones”, which appear to be not compatible (Figure 10a). The immediate identification of areas of conflict, as well as, of agreement (e.g., “Precision agriculture with drones” “intersect” “Smart farming with drones”) facilitates the negotiation process.
Similarly, the positional similarity analysis (Table 6) highlighted the relations of proximity between disjointed diagrams. Two diagrams identified as close and that foresee potentially conflicting projects (e.g., a new project for a “Floating wind farm” is close to an area devoted to the “Protection of underwater ancient relict”, Figure 10b) require greater attention during the negotiation process than two incompatible, but not close, diagrams (e.g., “High-density 3D-printed housing” is not close to “Green corridor”).
PostGIS spatial functions return results of spatial indicators in tabular form (e.g., Table 5 and Table 6), however it is possible to visualize the analyzed diagrams in Geodesignhub (Figure 10) using the “diagramid” unique identifier.
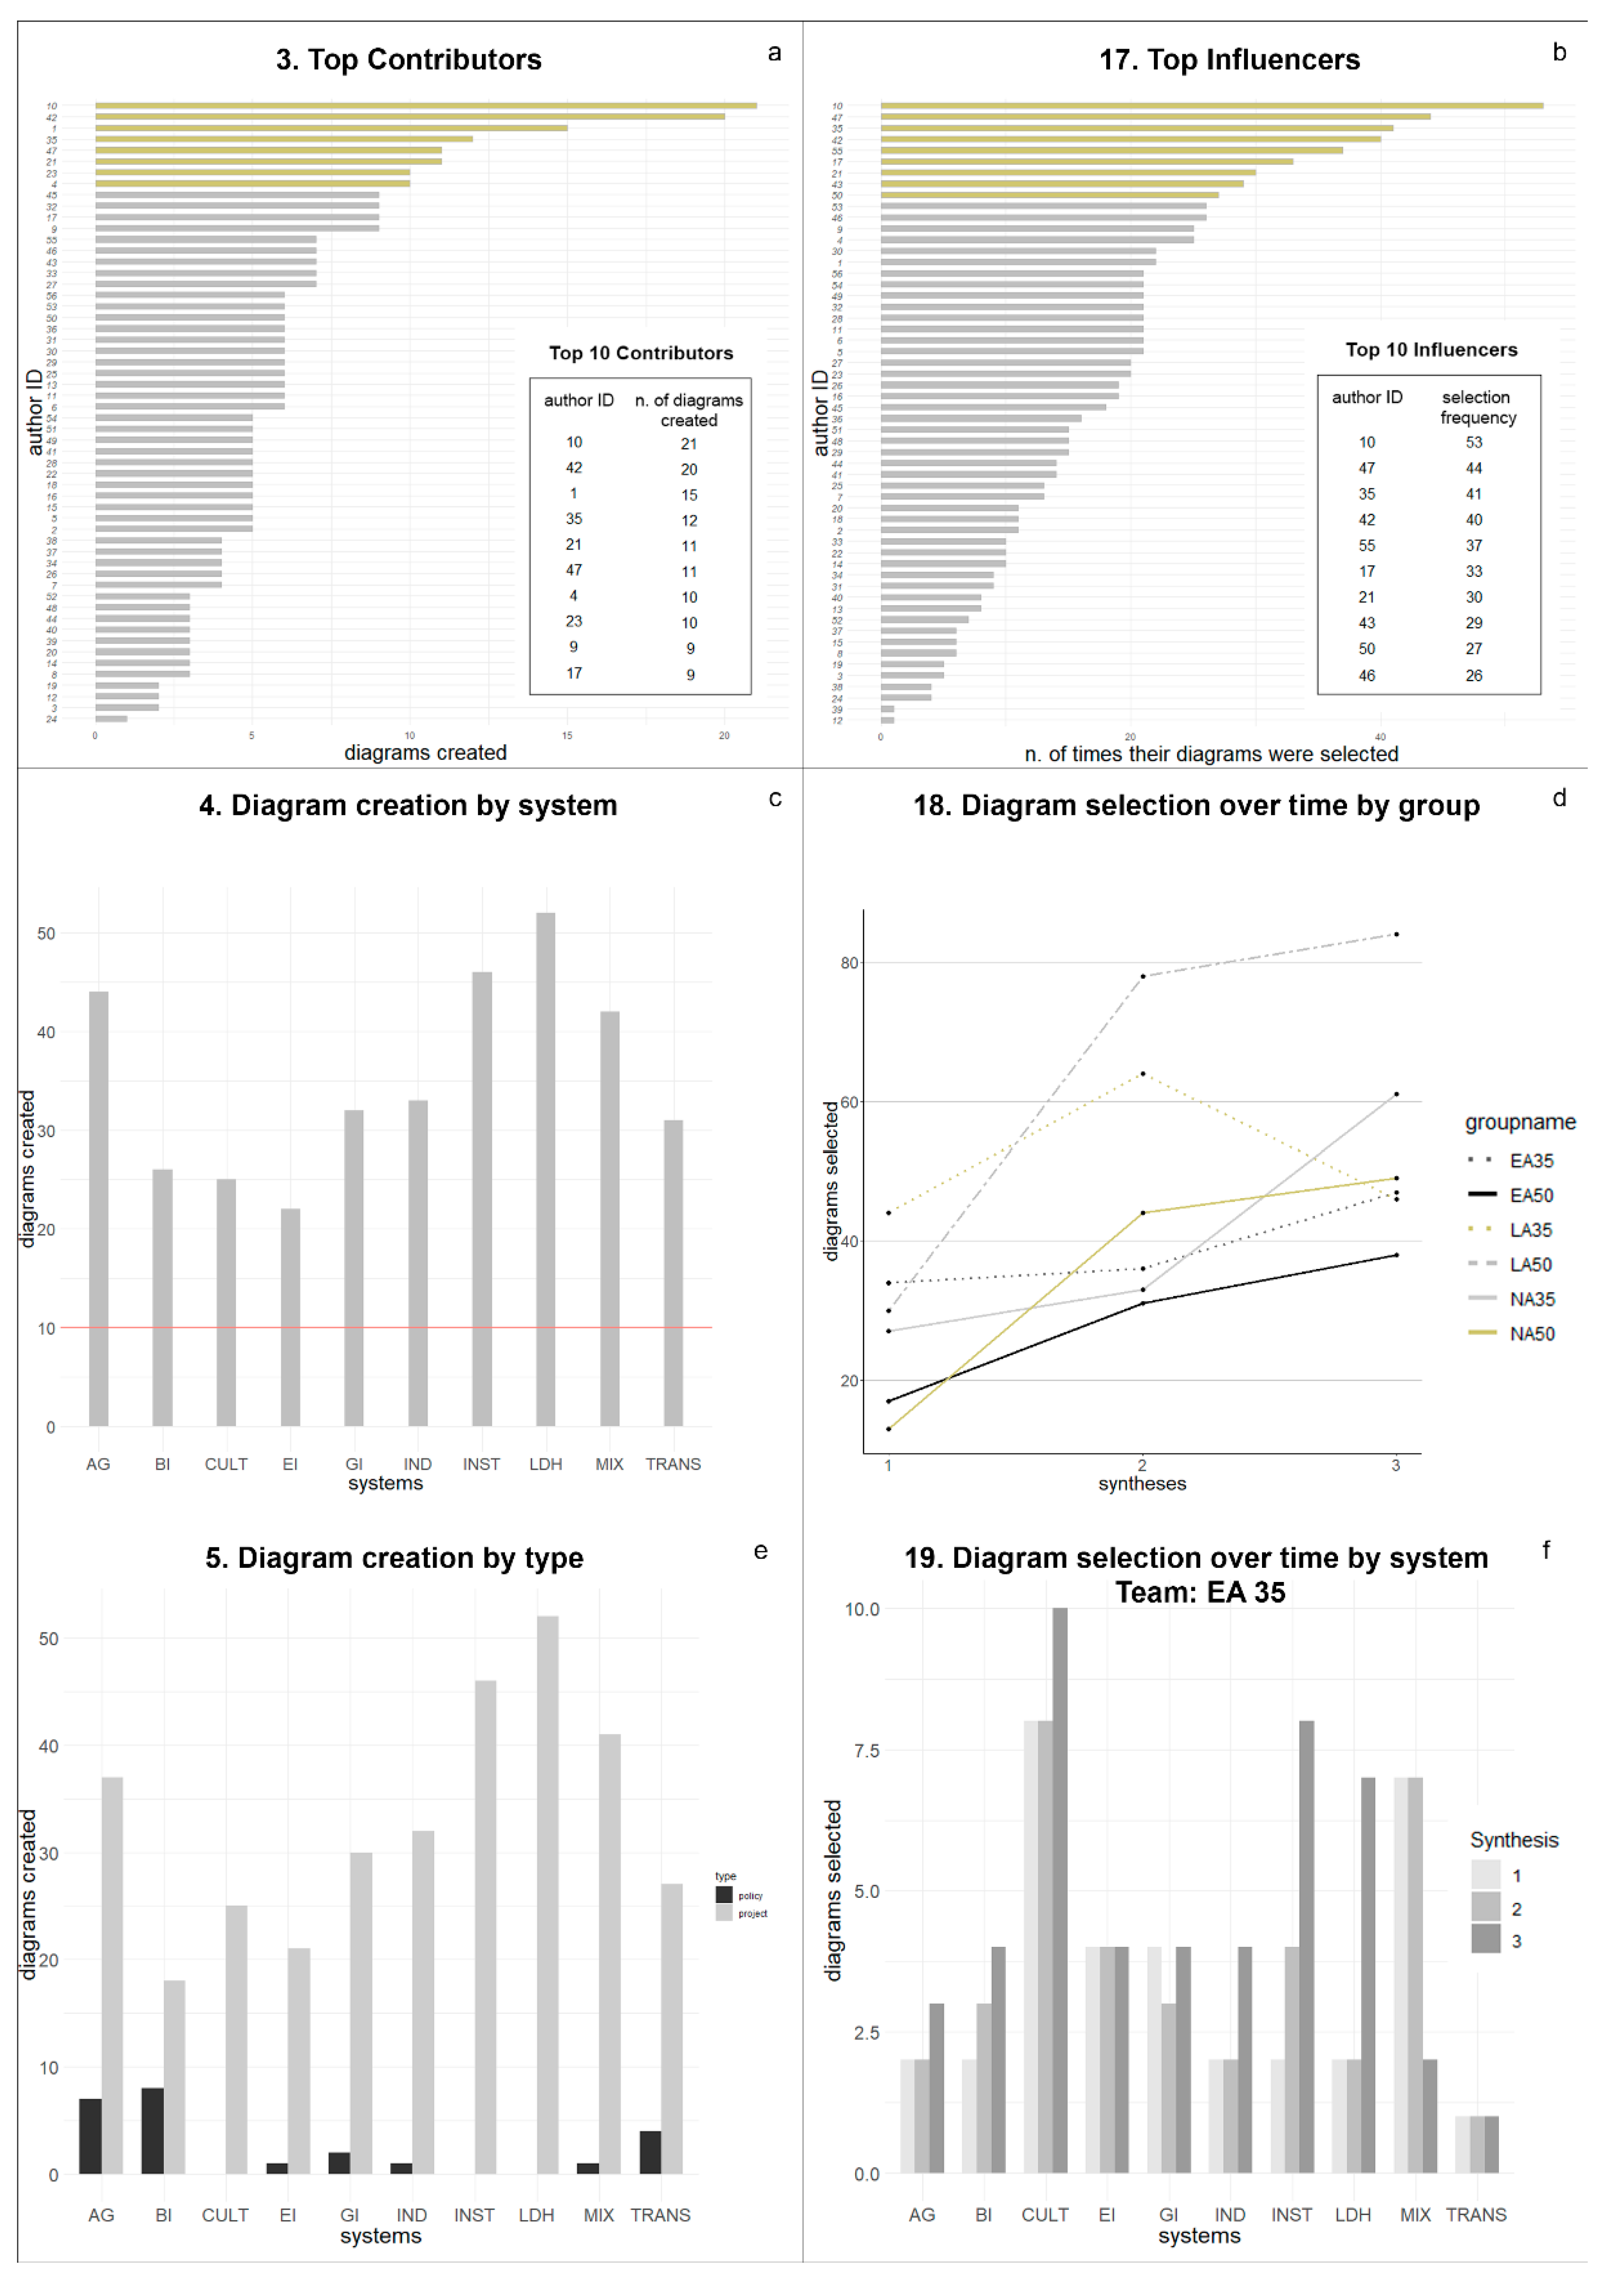
Among the other indicators listed in Section 3 and suitable to be displayed in a real-time dashboard, in this case study we only focus on the indicators of participants’ performance and design evolution. Despite at the time of the workshop the measures were not available, it is however possible to assess ex-post their potentialities (Figure 11).
More specifically, the histogram in Figure 11a provides immediate information on the number of diagrams created by students. This measure helps the coordinator better target the support towards those who risk to lag behind and are most in need of assistance directly during the ongoing design process. Moreover, comparing the Top 10 Contributors with the Top 10 Influencers (Figure 11b) it is possible to observe the relationship between the number of diagrams created by a participant and their selection frequency, measured as the number of times diagrams were selected in the syntheses by the groups. It is worth noting that 4 participants out of the top 10 influencers (author ID 55, 43, 50 and 46) were not among the first contributors (respectively 7, 7, 6, 7 diagrams created that were selected 37, 29, 27, 26 times), with a 1:4.4 ratio between diagrams created and selection frequency (top 4 participants had a 1:2.5 ratio).
The Diagram creation by system is generally clearly observable in the Geodesignhub user interface. Diagrams are systematically organized in a matrix by the software and positioned in the column of the related system in chronological order of creation. However, when large numbers of diagrams are created - around 350 in the Cagliari workshop—monitoring the trend is not as straightforward as in the case of workshops involving limited number of participants. The bar graph in Figure 11c allows the coordinator to identify at a glance the most popular systems and those requiring additional attention. Their role is further facilitated by the red threshold line that defines the minimum goal that participants had to reach in phase 1. At least 3 diagrams had to be created by each student playing the role of system expert.
Similarly, the Diagram creation by type (Figure 11e) may provide early indications on the type of intervention participants considered more appropriate for communicating their visions and needs. For example, designing blue infrastructure (BI) interventions to manage water resources may be a very difficult task for non-expert participants, who tended to make greater use of policies than in the other systems. Policies provides an efficient way to express design intentions (e.g., introducing water quality laws; incentives to use precision agriculture technologies) without defining the projects that would best support these policies (e.g., install a water quality monitoring system; install a capillary communication network in the agricultural areas).
In addition, while evaluating groups’ performance over time (Figure 11d), the line graph reveals continuing positive trends for most of the stakeholder teams. The number of diagrams selected by each group is generally increasing from synthesis 1 to synthesis 3. However, the group LA35 showed a different trend reducing from 64 to 46 diagrams in syntheses 2 and 3 respectively. The Diagram selection over time by group acts as an early warning system providing useful information to the coordinator that can immediately investigate the possible causes of an unexpected behavior. In this respect, it is essential to have information on the breakdown of the diagrams in the ten systems selected in the three syntheses (Figure 11f). The graph shows the increasing interest, or disinterest, of the group EA35 in the systems. Interestingly the number of low-density housing (LDH) diagrams increased significantly in the last synthesis, whereas the number of interventions in mixed high-density housing dropped from 7 in the second synthesis to 2 in the third synthesis. These outcomes reflect a change in the housing development model of the EA35 group: from building mid-rise and high-rise residential communities with retail/commercial businesses to single family housing development.
5. Discussion
In this case, even more than in others, the tasks that are necessary for the correct geodesign workshop development were included in a well-structured workflow. In particular for its academic and educational nature, the coordinator should have constantly had a clear vision of the participants’ performance and of the design evolution. This required ex-post evaluation work after each session by the coordination team in order to better target support during coming session. The implementation of the indicators described in the previous section (Figure 11) may provide important complementary support aimed at improving the monitoring in real-time.
For example, the information obtained through Top Contributors and Top Influencers analysis may not only be used for monitoring the participants’ or students’ performance, but also to analyze whether those who have great potential to influence the design are also those who really influence the design, or in other words to make an assessment of performance in terms of quantity vs quality. As can be seen by comparing Figure 11a with Figure 11b there is not a direct relationship between the number of diagrams created by a participant and their selection frequency.
In addition, it is particularly useful to break down the number of diagrams created by system and by type thus offering detailed insights into the participants’ performance. Arguing the fact that all the systems need to be taken into consideration when designing future development alternatives, the Diagram creation by system and Diagram creation by type (Figure 11c,e) facilitate the identification and timely execution of “corrective” measures to ensure a balanced distribution (in terms of number and type) of initial proposals, whether they were created by experts or by stakeholders.
Similarly, the Diagram selection over time by system helps in identifying that all systems were taken into account in the syntheses creation. Again, the relation between diagrams created and diagram selected broken down by system is not strictly linear (e.g., Figure 11f shows they the cultural heritage diagrams were the most numerous in all syntheses created by the group EA35; however cultural heritage is among the less considered systems—in terms of created diagrams - as shown in Figure 11c), and thus both indicators should be analyzed.
Another interesting aspect that is not clearly observable in the Geodesignhub user interface is the Diagram selection over time by group that provides a detailed picture of the groups’ performance and highlights possible differences in behavior (e.g., the opposite trend recorded for group EA35 in Figure 11d).
Summarizing, the chart reports are an effective way to visualize ongoing dynamics in a live dashboard and may ensure the effective coordination of the assistance efforts during the workshop. The overall results show the appropriateness of the first set of indicators proposed to analyze the design log-data made available for the first time by recent PSS, as Geodesignhub. Such an investigation may be useful both for monitoring ongoing processes, and for learning from past case studies with the aim of improving future one. First, while the experience and the observation skills of those involved in the coordination of geodesign studies will always be relevant and needed, the availability of digital dashboard monitoring the process (design as a verb) and its product (design as a noun) real-time may potential add great value, especially in fast-pace intensive geodesign workshops with high number of participants. Second, by identifying recurrent behaviours and pattern which appear to be more or less effective for the process to succeed, better processes could be designed and managed in the future avoiding bottlenecks and facilitating the emergence of positive dynamics.
Lastly, the opportunity of analysing this new type of data with digital dashboards may potentially enable the application of a new business intelligence perspective in real-time geodesign study management, and in retrospective or comparative studies by mining, what may be considered geodesign (processes) big-data.
6. Conclusions
The use of process mining techniques to discover, monitor and improve processes dynamics is gaining acceptance in many fields including collaborative design. Planning processes are becoming increasingly complex as a result of the multi-dimensional context (i.e., , multi-actor, multi-objective, multi-criteria, multi-scale processes) characterizing current practices. The new generation of advanced planning support technology is able to handle complex design workflows and to record detailed information about the history of processes and make it readily available for analysis.
This research develops an analytical framework to exploit information about collaborative geodesign processes recorded in the Geodesignhub log-data aiming at supporting the workshop coordinator in their role of guidance by getting real-time feedback on ongoing dynamics. As an early step towards a comprehensive Geodesign Process Analytics, this paper describes in detail the proposed analytical process: data extraction, preprocessing and analysis.
As highlighted in earlier sections, collaborative design log-data have a peculiar structure which integrates information relate to both the tasks carried out by participants along the process (i.e., , create a diagram; select a diagram) and the outputs of those tasks (i.e., , diagrams created, diagrams selected). The analytics tools, therefore, should cover two types of measures: those linked to the actions of the participants which characterize the process, and those related to design aspects of the products. The acquired knowledge can be applied to facilitate targeted and effective process improvement initiatives regarding on-going and future situations.
To this end, the indicators proposed for the analysis of a typical workshop dynamics provide knowledge about (i) spatial relations among design proposals by different groups of stakeholders, (ii) participants’ performance, (iii) actual compliance of the process with the workshop schedule, (iv) design evolution over time. The usefulness of the analytical framework has been demonstrated ex-post by applying a sub-set of representative indicators to gain insights on the geodesign study in real-world use-cases developed within the International Geodesign Collaboration project and involving postgraduate students in designing the future of the Metropolitan City of Cagliari, Italy.
While the set of the indicators has not been tested yet live during a geodesign workshop, the simulation of the application of a real-time dashboard implementing the indicators demonstrates their potential value in offering contextual advice to the geodesign workshop coordinator. The application of so called "descriptive" analytics does not, in fact, lead to any automated decisions based on the results of the analysis, but rather to better-informed real-time/proactive coordination actions and decisions. The objective is, therefore, to develop an analytical tool to support the coordination and management of running geodesign workshops and, subsequently, to facilitate the identification of recurrent behaviors and rules in the post-workshop analysis. In both cases, the improvement of current/future processes is the focus of the application of the proposed analytics.
In the light of the results of this research, the proposed analytical process could be integrated in the PSS architecture. The recently developed plugin “Geodesign Analytics” in Geodesignhub can be regarded as a first step towards the integration of process analysis tool within a PSS. The tool provides basic analysis including a timeline of when different groups saved their syntheses, a visual representation of how many diagrams were added and subtracted as the design develops. The capabilities offered by current web-based analytic apps should be fully exploited to carry out exploratory log-data analysis directly downloading design information from the cloud-based design platform. Design logs are rich data sources that offer many advantages in comparison with more traditional data gathering techniques and coding systems. The opportunity of obtaining value from this data is unprecedented, and it is worth to be investigated further as it may contribute to offer a better understanding of the process unfolding, and of its results.
Author Contributions
This work is an outcome of joint efforts of the authors: Conceptualization, C.C., C.R.F., A.C.M.M. and M.C.; Data curation, C.C. and C.R.F.; Formal analysis, C.C. and C.R.F.; Investigation, C.C.; Methodology, C.C. and M.C.; Software, C.C. and C.R.F.; Supervision, M.C. and A.C.M.M.; Validation, C.C. and C.R.F.; Visualization, C.C.; Writing—original draft, C.C. and M.C.; Writing—review & editing, C.C., C.R.F., A.C.M.M. and M.C. All authors have read and agreed to the published version of the manuscript.
Acknowledgments
Chiara Cocco gratefully acknowledges Sardinia Regional Government for the financial support of her PhD scholarship (P.O.R. Sardegna F.S.E. Operational Program of the Autonomous Region of Sardinia, European Social Fund 2014–2020—Axis III Education and training, Thematic goal 10, Priority of investment 10ii.). Christian Freitas and Ana Clara Moura collaborated due to the CNPq research, Process 401066/2016-9, Universal Call 01/2016. The Authors wish to thanks Tess Canfield for her very valuable comments on the early version of this paper.
Conflicts of Interest
The authors declare no conflict of interest.
References
- Hasby, F.M.; Roller, D. Sharing of Ideas in a Collaborative CAD for Conceptual Embodiment Design Stage. Procedia CIRP 2016, 50, 44–51. [Google Scholar] [CrossRef] [Green Version]
- Arsanjani, J.J.; Vaz, E. An assessment of a collaborative mapping approach for exploring land use patterns for several European metropolises. Int. J. Appl. Earth Obs. Geoinf. 2015, 35, 329–337. [Google Scholar] [CrossRef]
- Zissis, D.; Lekkas, D.; Azariadis, P.; Papanikos, P.; Xidias, E. Collaborative CAD/CAE as a cloud service. Int. J. Syst. Sci. Oper. Logist. 2017, 4, 339–355. [Google Scholar] [CrossRef]
- Pettit, C.; Bakelmun, A.; Lieske, S.N.; Glackin, S.; Thomson, G.; Shearer, H.; Dia, H.; Newman, P. Planning support systems for smart cities. City Cult. Soc. 2018, 12, 13–24. [Google Scholar] [CrossRef]
- Jankowski, P.; Nyerges, T. Geographic Information Sistems for Group Decision Making; CRC Press: London, UK, 2001; ISBN 978-0-203-48490-6. [Google Scholar]
- Geertman, S.; Stillwell, J. Planning support systems: An inventory of current practice. Comput. Environ. Urban Syst. 2004, 28, 291–310. [Google Scholar] [CrossRef]
- Steiner, F.R.; Butler, K. ; American Planning Association. Planning and Urban Design Standards; John Wiley & Sons: Hoboken, NJ, USA, 2012; ISBN 1-118-55076-5. [Google Scholar]
- Steinitz, C. A Framework for Geodesign: Changing Geography by Design; Esri Press: Redlands, CA, USA, 2012. [Google Scholar]
- Pettit, C.; Hawken, S.; Ticzon, C.; Nakanishi, H. Geodesign–A Tale of Three Cities, Lecture Notes in Geoinformation and Cartography; Springer: Cham, Switzerland, 2019. [Google Scholar]
- Loures, L.; Panagopoulos, T.; Burley, J.B. Assessing user preferences on post-industrial redevelopment. Environ. Plan. B Plan. Des. 2016, 43, 871–892. [Google Scholar] [CrossRef]
- Albert, C.; Von Haaren, C.; Vargas-Moreno, J.C.; Steinitz, C. Teaching Scenario-Based Planning for Sustainable Landscape Development: An Evaluation of Learning Effects in the Cagliari Studio Workshop. Sustainability 2015, 7, 6872–6892. [Google Scholar] [CrossRef] [Green Version]
- Fisher, T. An education in geodesign. Landsc. Urban Plan. 2016, 156, 20–22. [Google Scholar] [CrossRef]
- Wheeler, C. Geodesign takes root. Arc User 2019, 22, 64–69. [Google Scholar]
- Patata, S.; Paula, P.L.; Moura, A.C.M. The application of geodesign in a Brazilian illegal settlement. Participatory planning in Dandara occupation case study. In Environmental and Territorial Modelling for Planning and Design; FedOA-Federico II University Press: Napoli, Italy, 2018; ISBN 978-88-6887-048-5. [Google Scholar]
- Pettit, C.; Hawken, S.; Zarpelon, S.; Ticzon, C.; Afrooz, A.; Steinitz, C.; Ballal, H.; Canfield, T.; Lieske, S. Breaking Down the Silos Through Geodesign-Envisioning Sydney’s Urban future. Environ. Plan. B Urban Anal. City Sci. 2019, 46, 1387–1404. [Google Scholar] [CrossRef]
- Ervin, S.M. Technology in geodesign. Landsc. Urban Plan. 2016, 156, 12–16. [Google Scholar] [CrossRef]
- Ervin, S. A system for GeoDesign. In Proceedings of the digital landscape architecture 2012 at Anhalt University of Applied Sciences, Bernburg, Germany, 31 May–2 June 2012; pp. 145–154. [Google Scholar]
- Campagna, M. Metaplanning: About designing the Geodesign process. Landsc. Urban Plan. 2016, 156, 118–128. [Google Scholar] [CrossRef]
- Becattini, N.; Cascini, G.; O’Hare, J.A.; Masclet, C. Coding schemes for the analysis of ICT supported co-creative design sessions. In Proceedings of the DS 92: DESIGN 2018 15th International Design Conference, Dubrovnik, Croatia, 21–24 May 2018; pp. 533–544. [Google Scholar]
- Becattini, N.; Cascini, G.; O’Hare, J.A.; Morosi, F.; Boujut, J.-F. Extracting and Analysing Design Process Data from Log Files of ICT Supported Co-Creative Sessions. Proc. Des. Soc. Int. Conf. Eng. Des. 2019, 1, 129–138. [Google Scholar] [CrossRef] [Green Version]
- Blessing, L.T.M.; Chakrabarti, A. DRM, A Design Research Methodology; Springer: London, UK, 2009; ISBN 978-1-84882-586-4. [Google Scholar]
- Zhang, L.; Wen, M.; Ashuri, B. BIM Log Mining: Measuring Design Productivity. J. Comput. Civ. Eng. 2018, 32, 04017071. [Google Scholar] [CrossRef]
- Revit About Journal Files | Revit Products 2019 | Autodesk Knowledge Network. Available online: https://knowledge.autodesk.com/support/revit-products/getting-started/caas/CloudHelp/cloudhelp/2019/ENU/Revit-GetStarted/files/GUID-477C6854-2724-4B5D-8B95-9657B636C48D-htm.html (accessed on 11 October 2019).
- SOLIDWORKS Capture Performance Logs for SOLIDWORKS-Computer Aided Technology. Available online: https://www.cati.com/blog/2016/01/capture-performance-logs-for-solidworks/ (accessed on 11 October 2019).
- Geodesignhub. Available online: https://www.geodesignhub.com/#collab (accessed on 13 October 2019).
- Van Der Aalst, W. Process Mining: Discovery, Conformance and Enhancement of Business Processes; Springer: Berlin/Heidelberg, Germany, 2011; ISBN 978-3-642-19344-6. [Google Scholar]
- Cooley, R.; Mobasher, B.; Srivastava, J. Web mining: Information and pattern discovery on the World Wide Web. In Proceedings of the Proc Int Conf Tools Artif Intell, Newport Beach, CA, USA, 3–8 November 1997; pp. 558–567. [Google Scholar]
- Nasraoui, O.; Soliman, M.; Saka, E.; Badia, A.; Germain, R. A Web usage mining framework for mining evolving user profiles in dynamic Web sites. IEEE Trans. Knowl. Data Eng. 2008, 20, 202–215. [Google Scholar] [CrossRef]
- Terragni, A.; Hassani, M. Analyzing Customer Journey with Process Mining: From Discovery to Recommendations. In Proceedings of the 2018 IEEE 6th International Conference on Future Internet of Things and Cloud, FiCloud, Barcelona, Spain, 6–8 August 2018; pp. 224–229. [Google Scholar]
- Drlik, M.; Munk, M. Understanding time-based trends in stakeholders’ choice of learning activity type using predictive models. IEEE Access 2019, 7, 3106–3121. [Google Scholar] [CrossRef]
- Wong, J.; Khalil, M.; Baars, M.; de Koning, B.B.; Paas, F. Exploring sequences of learner activities in relation to self-regulated learning in a massive open online course. Comput. Educ. 2019, 140. [Google Scholar] [CrossRef]
- Pettinato, M.; Gil, J.P.; Galeas, P.; Russo, B. Log mining to re-construct system behavior: An exploratory study on a large telescope system. Inf. Softw. Technol. 2019, 114, 121–136. [Google Scholar] [CrossRef]
- Zhang, L.; Ashuri, B. BIM log mining: Discovering social networks. Autom. Constr. 2018, 91, 31–43. [Google Scholar] [CrossRef]
- Cocco, C.; Jankowski, P.; Campagna, M. An Analytic Approach to Understanding Process Dynamics in Geodesign Studies. Sustainability 2019, 11, 4999. [Google Scholar] [CrossRef] [Green Version]
- Ballal, H. Collaborative Planning with Digital Design Synthesis. Ph.D. Thesis, UCL (University College London), London, UK, 2015. [Google Scholar]
- Rivero, R.; Smith, A.; Orland, B.; Calabria, J.; Ballal, H.; Steinitz, C.; Perkl, R.; McClenning, L.; Key, H. Multiscale and multijurisdictional Geodesign: The Coastal Region of Georgia, USA. Landscapes 2017, 19, 42–49. [Google Scholar]
- Araújo, R.P.; Moura, A.C.M.; Nogueira, T. Creating Collaborative Environments for the Development of Slum Upgrading and Illegal Settlement Regularization Plans in Brazil: The Maria Tereza Neighborhood Case in Belo Horizonte. Int. J. E-Planning Res. (IJEPR) 2018, 7, 25–43. [Google Scholar] [CrossRef]
- Nyerges, T.; Ballal, H.; Steinitz, C.; Canfield, T.; Roderick, M.; Ritzman, J.; Thanatemaneerat, W. Geodesign dynamics for sustainable urban watershed development. Sustain. Cities Soc. 2016, 25, 13–24. [Google Scholar] [CrossRef] [Green Version]
- Mintzberg, H. The pitfalls of strategic planning. Calif. Manag. Rev. 1993, 36, 32. [Google Scholar] [CrossRef]
- Albrechts, L. Strategic (spatial) planning reexamined. Environ. Plan. B Plan. Des. 2004, 31, 743–758. [Google Scholar] [CrossRef] [Green Version]
- Press, C.U. Cambridge Business English Dictionary; Cambridge University Press: Cambridge, UK, 2011; ISBN 978-0-521-12250-4. [Google Scholar]
- Van Der Aalst, W.; Adriansyah, A.; De Medeiros, A.K.A.; Arcieri, F.; Baier, T.; Blickle, T.; Bose, J.C.; Van Den Brand, P.; Brandtjen, R.; Buijs, J.; et al. Process Mining Manifesto; Lecture Notes in Business Information Processing; Springer: Berlin, Germany, 2012. [Google Scholar]
- Campagna, M.; Floris, R.; Massa, P. The role of social media geographic information (SMGI) in geodesign. In JoDLA–Journal of Digital Landscape Architecture; Wichmann Verlag, VDE Verlag GmbH: Berlin/Offenbach, Germany, 2016; Volume 1, pp. 161–168. ISBN 978-3-87907-612-3. [Google Scholar]
- Freitas, C.R.; Moura, A.C.M. ETL Tools to Analyze Diagrams’ Performance: Favoring Negotiations in Geodesign Workshops. DISEGNARECON 2018, 11, 15:1–15:23. [Google Scholar]
- Geodesign Hub-Vicon SAGA. Available online: https://viconsaga.com.br/site/tool-geodesign-hub (accessed on 11 September 2019).
- Moura, A.C.; Marino, T.; Ballal, H.; Ribeiro, S.; Motta, S. Interoperability and visualization as a support for mental maps to face differences in scale in Brazilian Geodesign processes. Rozw. Reg. I Polityka Reg. 2016, 35, 89–102. [Google Scholar]
- Beeri, C.; Bernstein, P.A.; Goodman, N. A sophisticate’s introduction to database normalization theory. In Readings in Artificial Intelligence and Databases; Morgan Kaufmann: Burlington, MA, USA, 1989; pp. 468–479. [Google Scholar]
- Baralis, E.; Valle, A.D.; Garza, P.; Rossi, C.; Scullino, F. SQL versus NoSQL databases for geospatial applications. In Proceedings of the 2017 IEEE International Conference on Big Data (Big Data), Boston, MA, USA, 11–14 December 2017; pp. 3388–3397. [Google Scholar]
- Egenhofer, M.J.; Herring, J. Categorizing binary topological relations between regions, lines, and points in geographic databases. The 1990, 9, 76. [Google Scholar]
- Campagna, M.; Steinitz, C.; Di Cesare, E.A.; Cocco, C.; Hrishikesh, B.; Tess, C. Collaboration in planning: The Geodesign approach. Rozwój Regionalny i Polityka Regionalna 2016, 35, 55–72. [Google Scholar]
- Orland, B.; Steinitz, C. Improving our Global Infrastructure: The International Geodesign Collaboration. In Proceedings of the Journal of Digital Landscape Architecture, Dessau, Germany, 22–25 May 2019; Volume 4, pp. 213–219. [Google Scholar]
Figure 1.
Geodesignhub diagram data structure.

Figure 2.
Methodological framework for Geodesign Process Analytics.
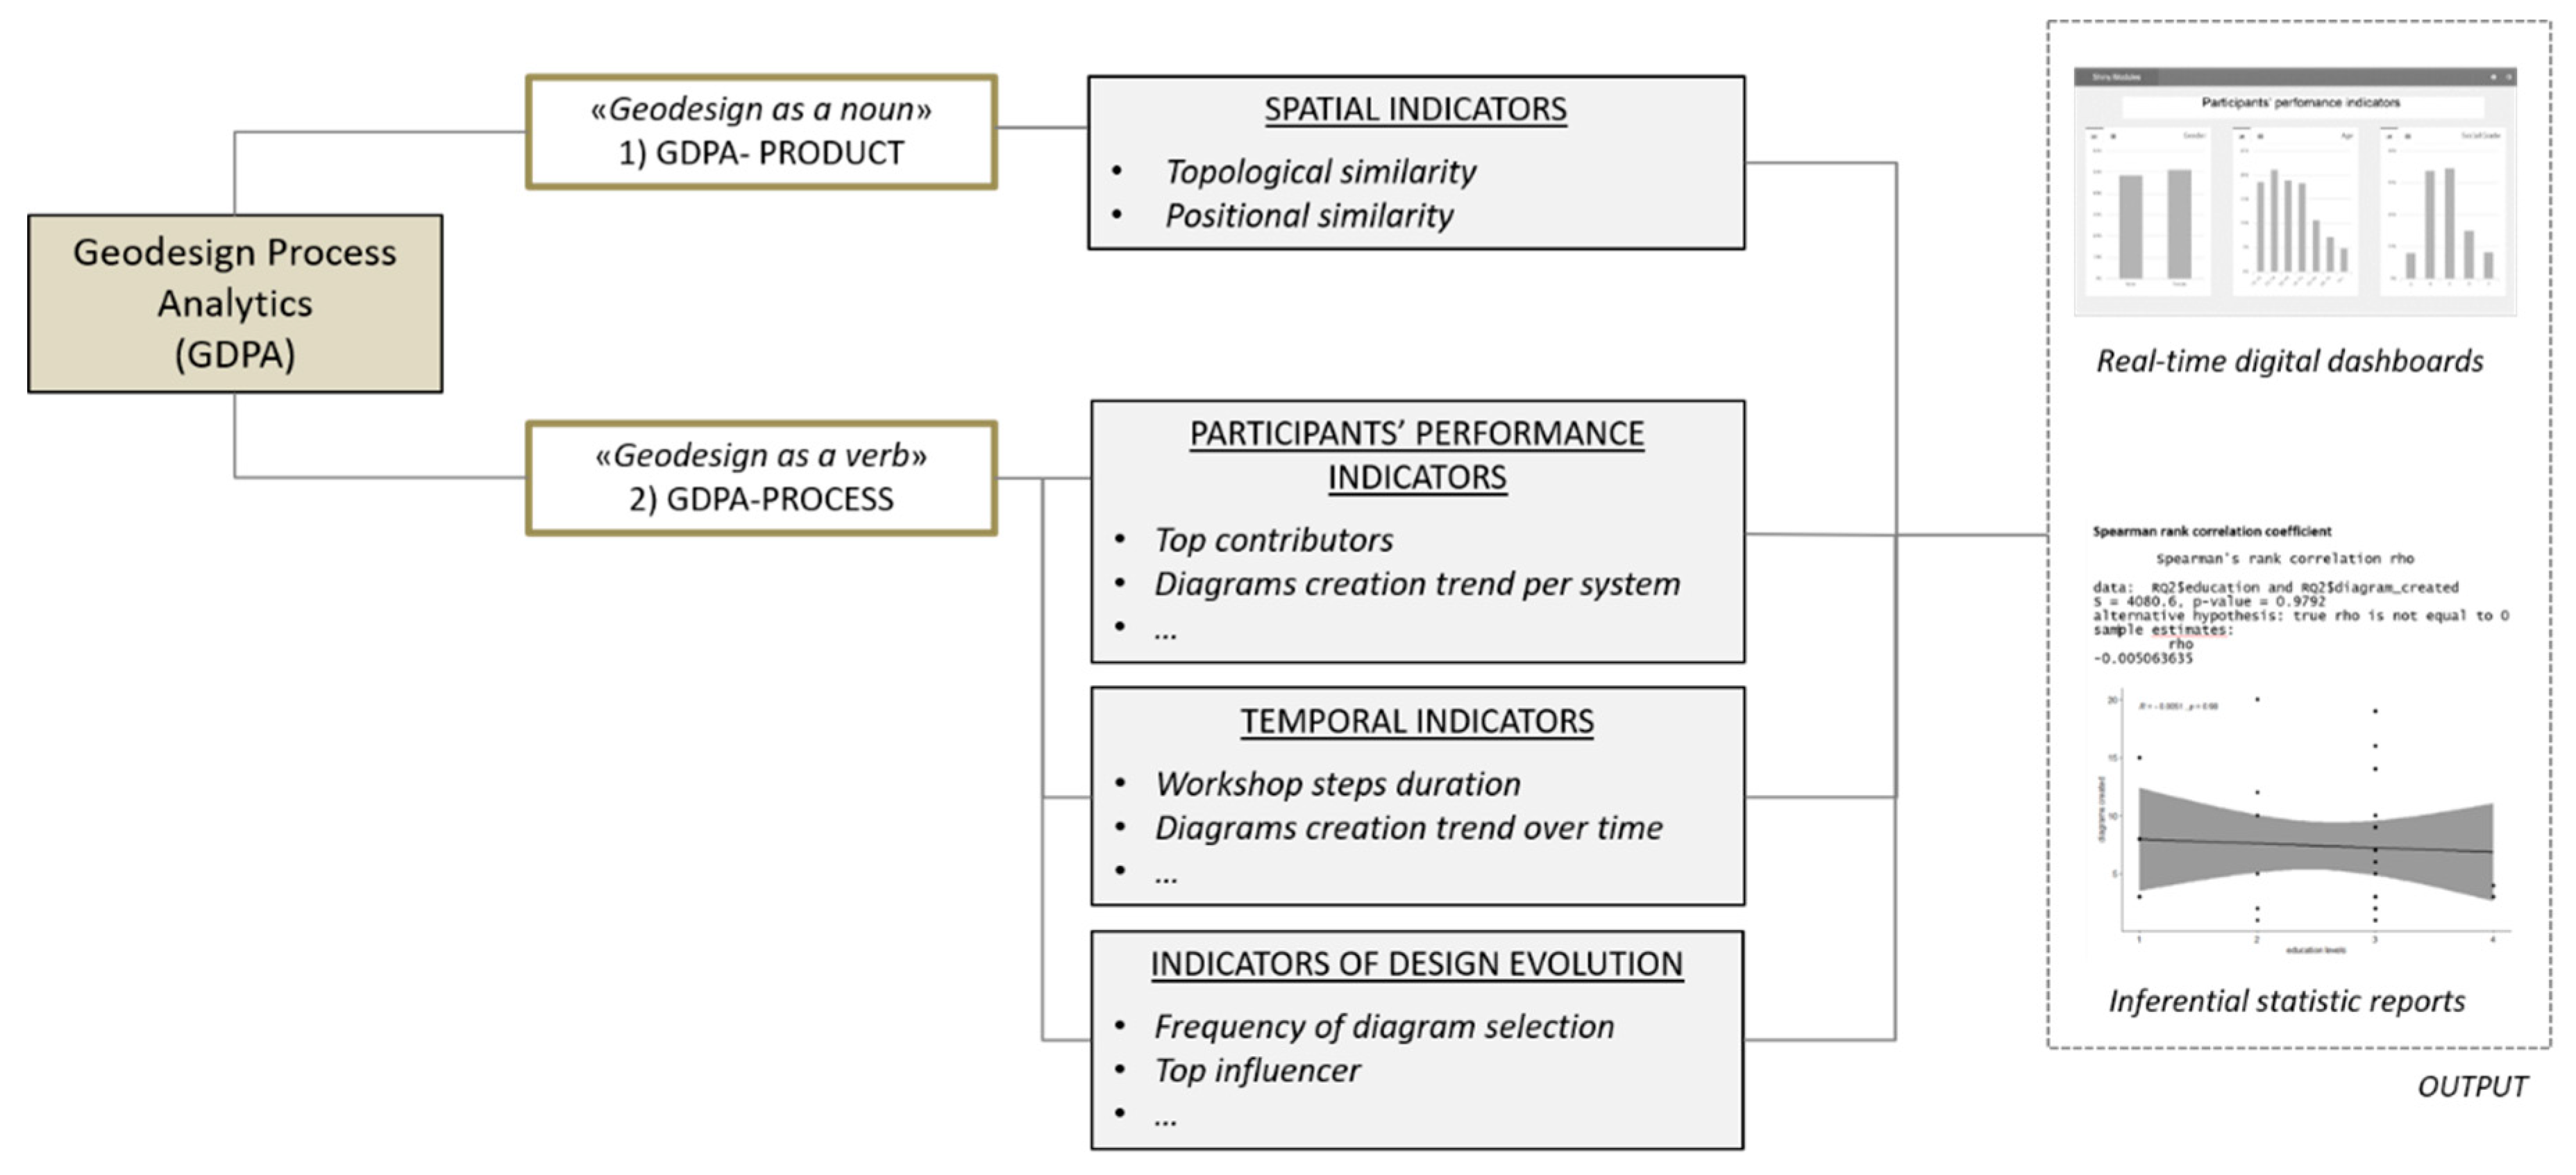
Figure 3.
The main steps and tools defining the analytical process.

Figure 4.
Excerpt of the GeoJSON file containing details of all diagrams created in a project.

Figure 5.
ETL data transformation diagram for cleaning the GeoJSON file of all projects and policies created in a Geodesignhub project and converting it into a shapefile. Main operations of the transformation task include exclusion of empty features (a), conversion of multipart features into single-part features (b), preprocessing of the spatial component (c) and of the non-spatial attribute (d), joining geometry and properties and store the cleaned data in shapefile format (e).

Figure 6.
Data model of the log-data geodatabase.

Figure 7.
ETL data transformation diagram for loading the cleaned shapefile of all diagrams created in a Geodesignhub project into the geodatabase: “system” (a), “author” (b), “diagram” (c) and “sys_priority” (d) tables were populated.
Figure 7.
ETL data transformation diagram for loading the cleaned shapefile of all diagrams created in a Geodesignhub project into the geodatabase: “system” (a), “author” (b), “diagram” (c) and “sys_priority” (d) tables were populated.

Figure 8.
ETL data transformation diagram for cleaning the Shapefiles of all syntheses created in (a) Geodesignhub project and loading preprocessed data into the geodatabase: “selection” (b), “synthesis” (c), “group_” (d), “coalition” (e) and “component” (f) tables were populated.
Figure 8.
ETL data transformation diagram for cleaning the Shapefiles of all syntheses created in (a) Geodesignhub project and loading preprocessed data into the geodatabase: “selection” (b), “synthesis” (c), “group_” (d), “coalition” (e) and “component” (f) tables were populated.

Figure 9.
Type of topological relations: “similar” (a), “within” (b), “contains” (c).

Figure 10.
Topological relation between two diagrams: MIX 21 “is within” AG 43 (a); proximity relation between two diagrams: CULTH 14 and EI 17 are close (b). Spatial indicators allow immediate identification of potential areas of conflicts.
Figure 10.
Topological relation between two diagrams: MIX 21 “is within” AG 43 (a); proximity relation between two diagrams: CULTH 14 and EI 17 are close (b). Spatial indicators allow immediate identification of potential areas of conflicts.

Figure 11.
Indicators applied in the monitoring of the participants’ performance and design evolution in the Cagliari geodesign study. The sub-set of indicators includes: Top Contributors (a), Top Influencers (b), Diagram creation by system (c), Diagram selection over time by group (d), Diagram creation by type (e), and Diagram selection over time by system (f).

Table 1.
Spatial indicators.
| Indicator | Coordinator Real-Time Dashboard | Comparative Study | Dynamics Analyzed | |
|---|---|---|---|---|
| 1 | Topological similarity—topological relationships between two overlapping diagrams (e.g., similar, within, contains) | ✓ | ✓ | These measures allow the workshop coordinator to identify possible conflicts of interest or areas of agreement within-teams or between-teams. The dialogue between different stakeholders is thus supported by this real-time information. |
| 2 | Positional similarity—spatial relationships between two disjoint diagrams (e.g., close, not close) | ✓ | ✓ |
Table 2.
Participants’ performance indicators.
| Indicator | Coordinator Real-Time Dashboard | Comparative Study | Dynamics Analyzed (This Indicator Provides Information for the Coordinator as Follows:) | |
|---|---|---|---|---|
| 3 | Top Contributors—number of diagrams created by each participant | ✓ | Participants’ performance, identifying leading participants with great potential to influence the design, and perhaps more importantly, those lagging behind. | |
| 4 | Diagram creation by system— | ✓ | Participants’ performance, identifying systems of major interest and, perhaps more importantly, those not sufficiently taken into consideration. | |
| 5 | Diagram creation by type— | ✓ | Participants’ performance, identifying which type of diagram they are creating. | |
| 6 | Diagram creation by age group | ✓ | Whether participants’ background information (e.g., age, education level, level of experience, professional expertise, role within participant’s area of interest) influence their performance, in terms of n° of diagrams created. | |
| 7 | Diagram creation by education level | ✓ | ||
| 8 | Diagram creation by level of experience | ✓ | ||
| 9 | Diagram creationby professional expertise | ✓ | ||
| 10 | Diagram creation by role within participant’s area of interest— | ✓ | ||
| 11 | System experts’ performance in relation to number of stakeholder’s additional diagrams | ✓ | Performance of the system experts, based on their initial diagrams and the number of additional diagrams created by stakeholders. |
Table 3.
Temporal indicators.
| Indicator | Coordinator Real-Time Dashboard | Comparative Study | Dynamics Analyzed (This Indicator Provides Information for the Coordinator as Follows:) | |
|---|---|---|---|---|
| 12 | Workshop steps duration—time interval between the starting time and the end time of a step | ✓ | ✓ | Whether the workflow is properly following the initial schedule. |
| 13 | Diagram creation over time—number of diagrams created in each workshop step | ✓ | ✓ | Participants’ performance over time, by evaluating whether there are any significant differences between the number of diagrams created across the workshop steps. |
| 14 | Diagram creation over time by group—number of diagrams created in each workshop step by each stakeholder group/negotiation coalition | ✓ | ✓ | Groups’ performance over time, by evaluating whether there are any significant differences between the number of diagrams created across the workshop steps by the stakeholder teams/negotiation coalition. |
| 15 | Average time spent on diagram creation—average time between diagrams creation across workshop steps | ✓ | Participants’ performance over time, by evaluating the average time between diagrams creation and if there are any significant differences across the workshop steps. |
Table 4.
Indicators of design evolution.
| Indicator | Coordinator Real-Time Dashboard | Comparative Study | Dynamics Analyzed (This Indicator Provides for:) | |
|---|---|---|---|---|
| 16 | Frequency of diagram selection—number of times each diagram was selected in all the groups’/negotiation coalitions’ syntheses sorted in ascending order | ✓ | Evaluating the distribution of selection frequency of diagrams among all group/coalition syntheses. | |
| 17 | Top influencers - number of times diagrams were selected in the syntheses aggregated by author and sorted in ascending order | ✓ | ✓ | Assessing the success of diagrams and, in turn, identifying leading participants with great influence in the design. |
| 18 | Diagram selection over time by group - number of diagrams selected in each synthesis by each stakeholder group/coalition | ✓ | ✓ | Evaluating groups’ performance over time, by understanding whether there are any significant differences between the number of diagrams selected across the syntheses by the stakeholder teams/coalition. |
| 19 | Diagram selection over time by group and system - number of diagrams selected in each synthesis by each stakeholder group/coalition per system | ✓ | ✓ | Evaluating groups’ performance over time, by understanding whether there are any significant differences between the number of diagrams selected in each system across the syntheses by the stakeholder teams/coalition. |
| 20 | Group’s Views—number of diagrams selected by each group in each synthesis per system in relation to the group’s priority weighting | ✓ | Evaluating groups’ performance over time, by understanding to what extent the selection of diagrams mirrors the priority weighting assigned to the systems and, thus, stakeholders’ initial values and views. | |
| 21 | Diagram selection frequency by role—number of times diagrams were selected per role played by the author | ✓ | Evaluating the performance of the system experts, by understanding whether their proposals - presented in a first set of diagrams—were selected more often than those created by the non-expert stakeholders. |
Table 5.
Excerpt from the output generated by the SQL query to measure the Topology Similarity between the diagrams selected in the last synthesis of the group EA50 and EA35 respectively.
Table 5.
Excerpt from the output generated by the SQL query to measure the Topology Similarity between the diagrams selected in the last synthesis of the group EA50 and EA35 respectively.
| Title | Diagram A (EA50) | % (A∩B/A) | Relation | % (A∩B/B) | Diagram B (EA35) | Title |
|---|---|---|---|---|---|---|
| High-density 3D-printed housing | MIX 21 | 100 | within | 0.64 | AG 43 | Precision agriculture with drones |
| Smart farming with drones | AG 34 | 47.88 | intersects | 57.29 | AG 43 | Precision agriculture with drones |
| Poetto beach—solar sidewalk | EI 19 | 1.59 | contains | 100 | TRANS 6 | Viale Poetto—solar road |
Table 6.
Excerpt from the output generated by the SQL query to measure the Positional Similarity between the diagrams selected in the last syntheses of the group EA50 and EA35 respectively.
Table 6.
Excerpt from the output generated by the SQL query to measure the Positional Similarity between the diagrams selected in the last syntheses of the group EA50 and EA35 respectively.
| Title | Diagram A (EA50) | Relation | Diagram B (EA35) | Title |
|---|---|---|---|---|
| Floating wind farm | EI 17 | close | CULTH 14 | Protection of underwater ancient relict |
| Zoo with different ecosystems | CULTH 10 | close | IND 25 | Automatic car factory |
| High-density 3D-printed housing | MIX 21 | not close | GI 5 | Green corridor |
© 2019 by the authors. Licensee MDPI, Basel, Switzerland. This article is an open access article distributed under the terms and conditions of the Creative Commons Attribution (CC BY) license (http://creativecommons.org/licenses/by/4.0/).
Share and Cite
MDPI and ACS Style
Cocco, C.; Rezende Freitas, C.; Mourão Moura, A.C.; Campagna, M. Geodesign Process Analytics: Focus on Design as a Process and Its Outcomes. Sustainability 2020, 12, 119. https://doi.org/10.3390/su12010119
AMA Style
Cocco C, Rezende Freitas C, Mourão Moura AC, Campagna M. Geodesign Process Analytics: Focus on Design as a Process and Its Outcomes. Sustainability. 2020; 12(1):119. https://doi.org/10.3390/su12010119
Chicago/Turabian StyleCocco, Chiara, Christian Rezende Freitas, Ana Clara Mourão Moura, and Michele Campagna. 2020. "Geodesign Process Analytics: Focus on Design as a Process and Its Outcomes" Sustainability 12, no. 1: 119. https://doi.org/10.3390/su12010119
Note that from the first issue of 2016, this journal uses article numbers instead of page numbers. See further details here.