The Influence of Leader Encouragement of Creativity on Innovation Speed: Findings from SEM and fsQCA


1
China Institute for SMEs, Zhejiang University of Technology, Liuhe Road 288, Xihu District, Hangzhou 310023, China
2
School of Business, University of Queensland, St Lucia, Brisbane, Queensland 4072, Australia
3
School of Management, Zhejiang University of Technology, Liuhe Road 288, Xihu District, Hangzhou 310023, China
*
Author to whom correspondence should be addressed.
Sustainability 2019, 11(9), 2693; https://doi.org/10.3390/su11092693
Submission received: 25 March 2019
/
Revised: 3 May 2019
/
Accepted: 9 May 2019
/
Published: 11 May 2019
(This article belongs to the Special Issue Creativity and Innovation for Sustainability—State of the Art and Future Perspectives)
Abstract
:Adopting the empowerment perspective of leadership, this study proposes and examines the mediating model that leader encouragement of creativity affects innovation speed through strengthening employees’ engagement in the creative process. Using a sample of 245 participants in China, the results from structural equation modeling (SEM) suggest that the impact of leader encouragement of creativity on innovation speed is significantly mediated by creative process engagement, and positively moderated by organizational ambidexterity at the same time. Additionally, the results from fuzzy-set comparative qualitative analysis (fsQCA) with the same data set reveal that the aforementioned factors have a holistic effect on enhancing innovation speed. The results of fsQCA reinforce and refine the findings of the SEM analysis concerning the limits and conditions for how leader encouragement of creativity affects innovation speed.
1. Introduction
Innovation is deemed the crucial force supporting the sustainable growth of organizations [1]. The requirements of a sustainable society force business organizations to pursue technological development and business model innovation into human-related issues through innovation [2,3]. As more attention is focused on how to improve individuals or teams in enhancing innovation performance in a way that is consistent with both sustainable and organizational requirements, sustainable human resource management initiates a new research direction in innovation management [4]. By establishing an empowering work environment, employees are expected to achieve higher sustainable creative performance [1]. In this study, the researchers consider extending the boundary of sustainable human resource management to organizational sustainable innovation, with the aforementioned finding that an encouraging environment as a key approach motivates individual creativity.
Past literature suggests three angles by which environment, leadership, and tools actually manage creativity to achieve higher innovation performance [5]. In this paper, innovation speed, which refers to the time elapsed from initial idea generation to commercialization, is treated as the indicator of innovation performance due to its integration of the notions of staff-related creativity and organizational structural innovation [6]. Leader encouragement of creativity as supportive leadership plays another important role in conditioning the creative environment and encouraging employees’ creativity, and is thus utilized to explore impacts of the behaviors of empowering leaders on sustainable innovation performance [7]. However, a bridge linking leader encouragement of creativity, which acts on employees, and innovation speed, which is a result of individual-level activities is currently lacking. To fill the gap, this study introduces employee creative process engagement as playing an intermediator, referring to the degree to which individuals engage in creativity [8]. In addition to the above innovation process, the existence of organizational contextual ambidexterity that simultaneously promotes flexibility and controls within the business unit is considered to positively moderate the encouragement of leaders and the engagement of employees [9]. Although an abundance of literature argues that organizational ambidexterity is one of the key antecedents for increasing individuals’ and teams’ innovation performance within organizations, few studies seek to identify the mechanism behind that. For example, few other than Zhang and Bartol find that the positive effect of creative process engagement on creative performance may be stronger with an increase of leader encouragement of creativity as a moderator [7].
Based on empowerment theory, this study first investigates the causal mechanism by which leader encouragement of creativity influences organizational innovation speed via employees’ creative process engagement, and moderated by organizational ambidexterity. Subsequently, the study seeks to articulate the structure and explore the mechanism by which the four variables work. These two approaches provide the main theoretical and empirical contribution of this work.
In this paper, the researchers aim to investigate the following questions: What role does leader encouragement of creativity play in empowerment theory, and how does it affect organizational innovation speed through improving creative process engagement? Can organizational ambidexterity play the role of a boundary condition when analyzing the relationship between empowering leadership behaviors and creative engagement and innovation speed? How do individual creative process engagement and organizational ambidexterity work in regards to the way leader encouragement of creativity affects innovation speed?
The remainder of this paper is organized into five sections. Section 2 briefly summarizes current literature to develop a conceptual model for the investigation. Section 3 introduces the study design, data collection, and the two tools used in this study: structural equation modeling (SEM) and fuzzy-set comparative qualitative analysis (fsQCA). Section 4 shows the results derived from the data analyses. Section 5 discusses the theoretical implications, limitations, and further studies related to the investigation. Section 6 concludes the findings.
2. Literature and Hypotheses
2.1. Leader Encouragement of Creativity and Innovation Speed
Leader encouragement of creativity (LEC) refers to “the extent of a leader’s emphasis on being creative and actively engaging in processes that may lead to creative outcomes” [7]. It derives from empowerment theory and is seen as one of the many leadership competencies that are relevant to managing with innovation in mind [10,11]. Leaders’ behaviors, such as encouragement, as Dunegan et al. [12] suggest, are among the most desirable climatic conditions for innovation, which may improve positive knowledge exchanges among subordinates. It is believed that leader–member exchanges are positively associated with members’ feelings, which in turn promote the efficacy of creative work [13,14]. When leaders place more emphasis on innovation, they have more potential to address problems in the process of innovative activities. Carbonell and Rodríguez-Escudero [15] hold the analogous viewpoint that top management support is positively correlated with innovation speed, especially in industries requiring high technology. A recent study also argues that by adopting an empowering approach, a leader can give people confidence to explore new methods and take risks of failure [16]. Based on the above arguments, we propose the following hypothesis:
Hypothesis 1.
Leader encouragement of creativity is positively related to innovation speed.
2.2. Creative Process Engagement
Creative process engagement has been seen as a key factor in creative performance management [8]. It reflects individual and group creative process engagement, and thus refers as the extent to which individuals engage in creativity, including (1) problem identification, (2) information searching and encoding, and (3) idea and alternative generation [7,8]. Although some researchers confound creativity and innovation in their studies, creativity mainly emphasizes the development of new ideas in innovative activities, and innovation emphasizes the application of ideas in practice [16,17]. Namely, creativity only represents the initial stage in the innovation sequence, while the creative process as a prior basis has an obvious association with innovation, but is separate from it [18]. Thus, it is necessary to separate the previous literatures on creativity and innovation. Specifically, leader encouragement of creativity impacts creative process engagement first, and creative process engagement thereafter influences innovation speed.
The existing literature proves that empowering behavior from leaders have positive impacts on employees’ creativity. Leaders who encourage creativity can help team members to extend and assimilate external information, which eventually accelerates innovative activities [19]. When employees are deeply involved in the organization’s creative process, they will strive to resolve a problem completely, for example by searching for highly valuable information from multiple sources, generating an abundance of alternative solutions by combining information, etc. [8,20]. That is, the firm usually expects to gain faster innovation with deeper engagement of employees in the creative process. Zhang and Bartol [7] argue that encouragement from leaders will lead to a higher degree of creative process engagement. Leaders can proactively encourage engagement by outlining the need for creative action, propagating the organization’s values, and facilitating the effectiveness of creativity. With the help of leaders’ encouragement, individuals attain a clear map that acknowledges the importance of creativity in their work, after which employees are supposed be more creative [21,22,23], and when individuals clearly identify their role in the creative process, they will react with a more creative performance [24,25], and then ultimately improve their innovation speed. Thus, there are enough reasons to infer that leader encouragement of creativity has positive effects on creative process engagement as an outcome. As for the relationship between creative engagement and innovation speed, deeply engaging in creativity helps individuals make more efficient decisions to reach a faster innovation pace and higher innovation performance [26,27].
Although existing studies construct a causal mediation model with leader encouragement of creativity as the exogenous variable, innovation speed as the endogenous variable, and creative process engagement as the mediating variable, some other studies afford more direct evidence for this mediating relationship. For example, in an investigation by Henker et al. [28], creative process engagement mediates the relationship between transformational leadership and creativity. Saeed et al. [29] suggest that creative process engagement mediates the leader–member exchange relationship and is positively associated with innovative work behaviors. Formally, we propose the following hypothesis:
Hypothesis 2.
Creative process engagement mediates the relationship between leader encouragement of creativity and innovation speed.
2.3. Organizational Ambidexterity
Organizational ambidexterity is increasingly being considered an environmental factor that positively influences creativity in an organization [30,31]. The term organizational ambidexterity was first conceptualized by Duncan [32] and refers to the sequential fashion in which organizational structure continually shifts to align with the firm’s strategy. Duncan’s view is continuously challenged in later management research and practices; for example, Tushman and O’Reilly [33] argue that firms need not shift the whole organization to a specific alignment, but should instead divide into subunits for different alignments, then integrate organizational targets. Gibson and Birkinshaw [20] suggest that organizations can achieve ambidexterity by designing an organizational structure that permits creative units to take the initiative in balancing exploratory and exploitative activities. In this way, ambidexterity eventually evolves into three separate aspects—sequential ambidexterity, structural ambidexterity, and contextual ambidexterity—and all three aspects of ambidexterity require a set of supportive organizational designs to encourage individuals to make their judgments [9].
Recent literature pays more attention to the roles of organizational exploration and exploitation in innovation management. For example, Jurksiene and Pundziene propose that exploration and exploitation mediate the relation between dynamic capabilities, which are the outcomes of knowledge development, and competitive advantages [34]. Heavey and Simsek’s findings support the idea that the top management team’s transactive memory systems, which represent stored organizational knowledge and experience, are positively associated with the firm’s ambidextrous orientation [35]. Meanwhile, Lee, Kim, and Joshi’s investigation reveals that organizational ambidexterity positively mediates the effect of the organizational memory system on new product performance [36].
Although an abundance of literature supports the positive association of ambidexterity with innovation performance, the latest literature endeavors to differentiate the concepts of “exploration and exploitation” and organizational ambidexterity. According to Brem’s insights, organizational-level explorative and exploitative behaviors originating from the strategic learning process are undertaken by individuals and teams, and both exploration and exploitation are organized in different ways based on the degree of organizational ambidexterity [37]. In other words, organizational ambidexterity moderates and determines the distribution by which individuals’ and teams’ creative activities contribute to explorative and exploitative innovations.
In a more specific vision, leader behaviors (e.g., empowerment) promoting exploration may be affected by organizational ambidexterity as well. Several studies propose that leadership characteristics enable organizations to reconcile the inherent tension so that stronger synergic effects in an ambidextrous organization will lead to better innovative outcomes [38,39,40]. Gibson and Birkinshaw [20] state that ambidexterity indicates the organization’s ability to align with recent operations and its adaptability to cope with an unpredictably changing environment. Hence, an ambidextrous organization excels at exploiting current resources to enable incremental innovation and exploration of new opportunities for transformational innovation [41]. Khazanchi et al. [42] also argue that contextual ambidexterity is a function of an organizational culture that promotes flexibility and controls within the business unit. When an organization develops an ambidextrous culture, leaders in such a culture are more likely to display consistent behavior that encourages their members’ creativity in teams [11,43]. In other words, an ambidextrous organization allows leaders to more efficiently encourage creativity by setting clear goals and reasonable rewards, and also provides a tolerant and aspirational culture that allows employees to be willing to take risks, to try out new approaches and to come up with creative ideas, thereby speeding up innovative implementation [6,9,44]. In conclusion, organizational ambidexterity as organizational context has impacts on each process in innovation management. Thus, we propose:
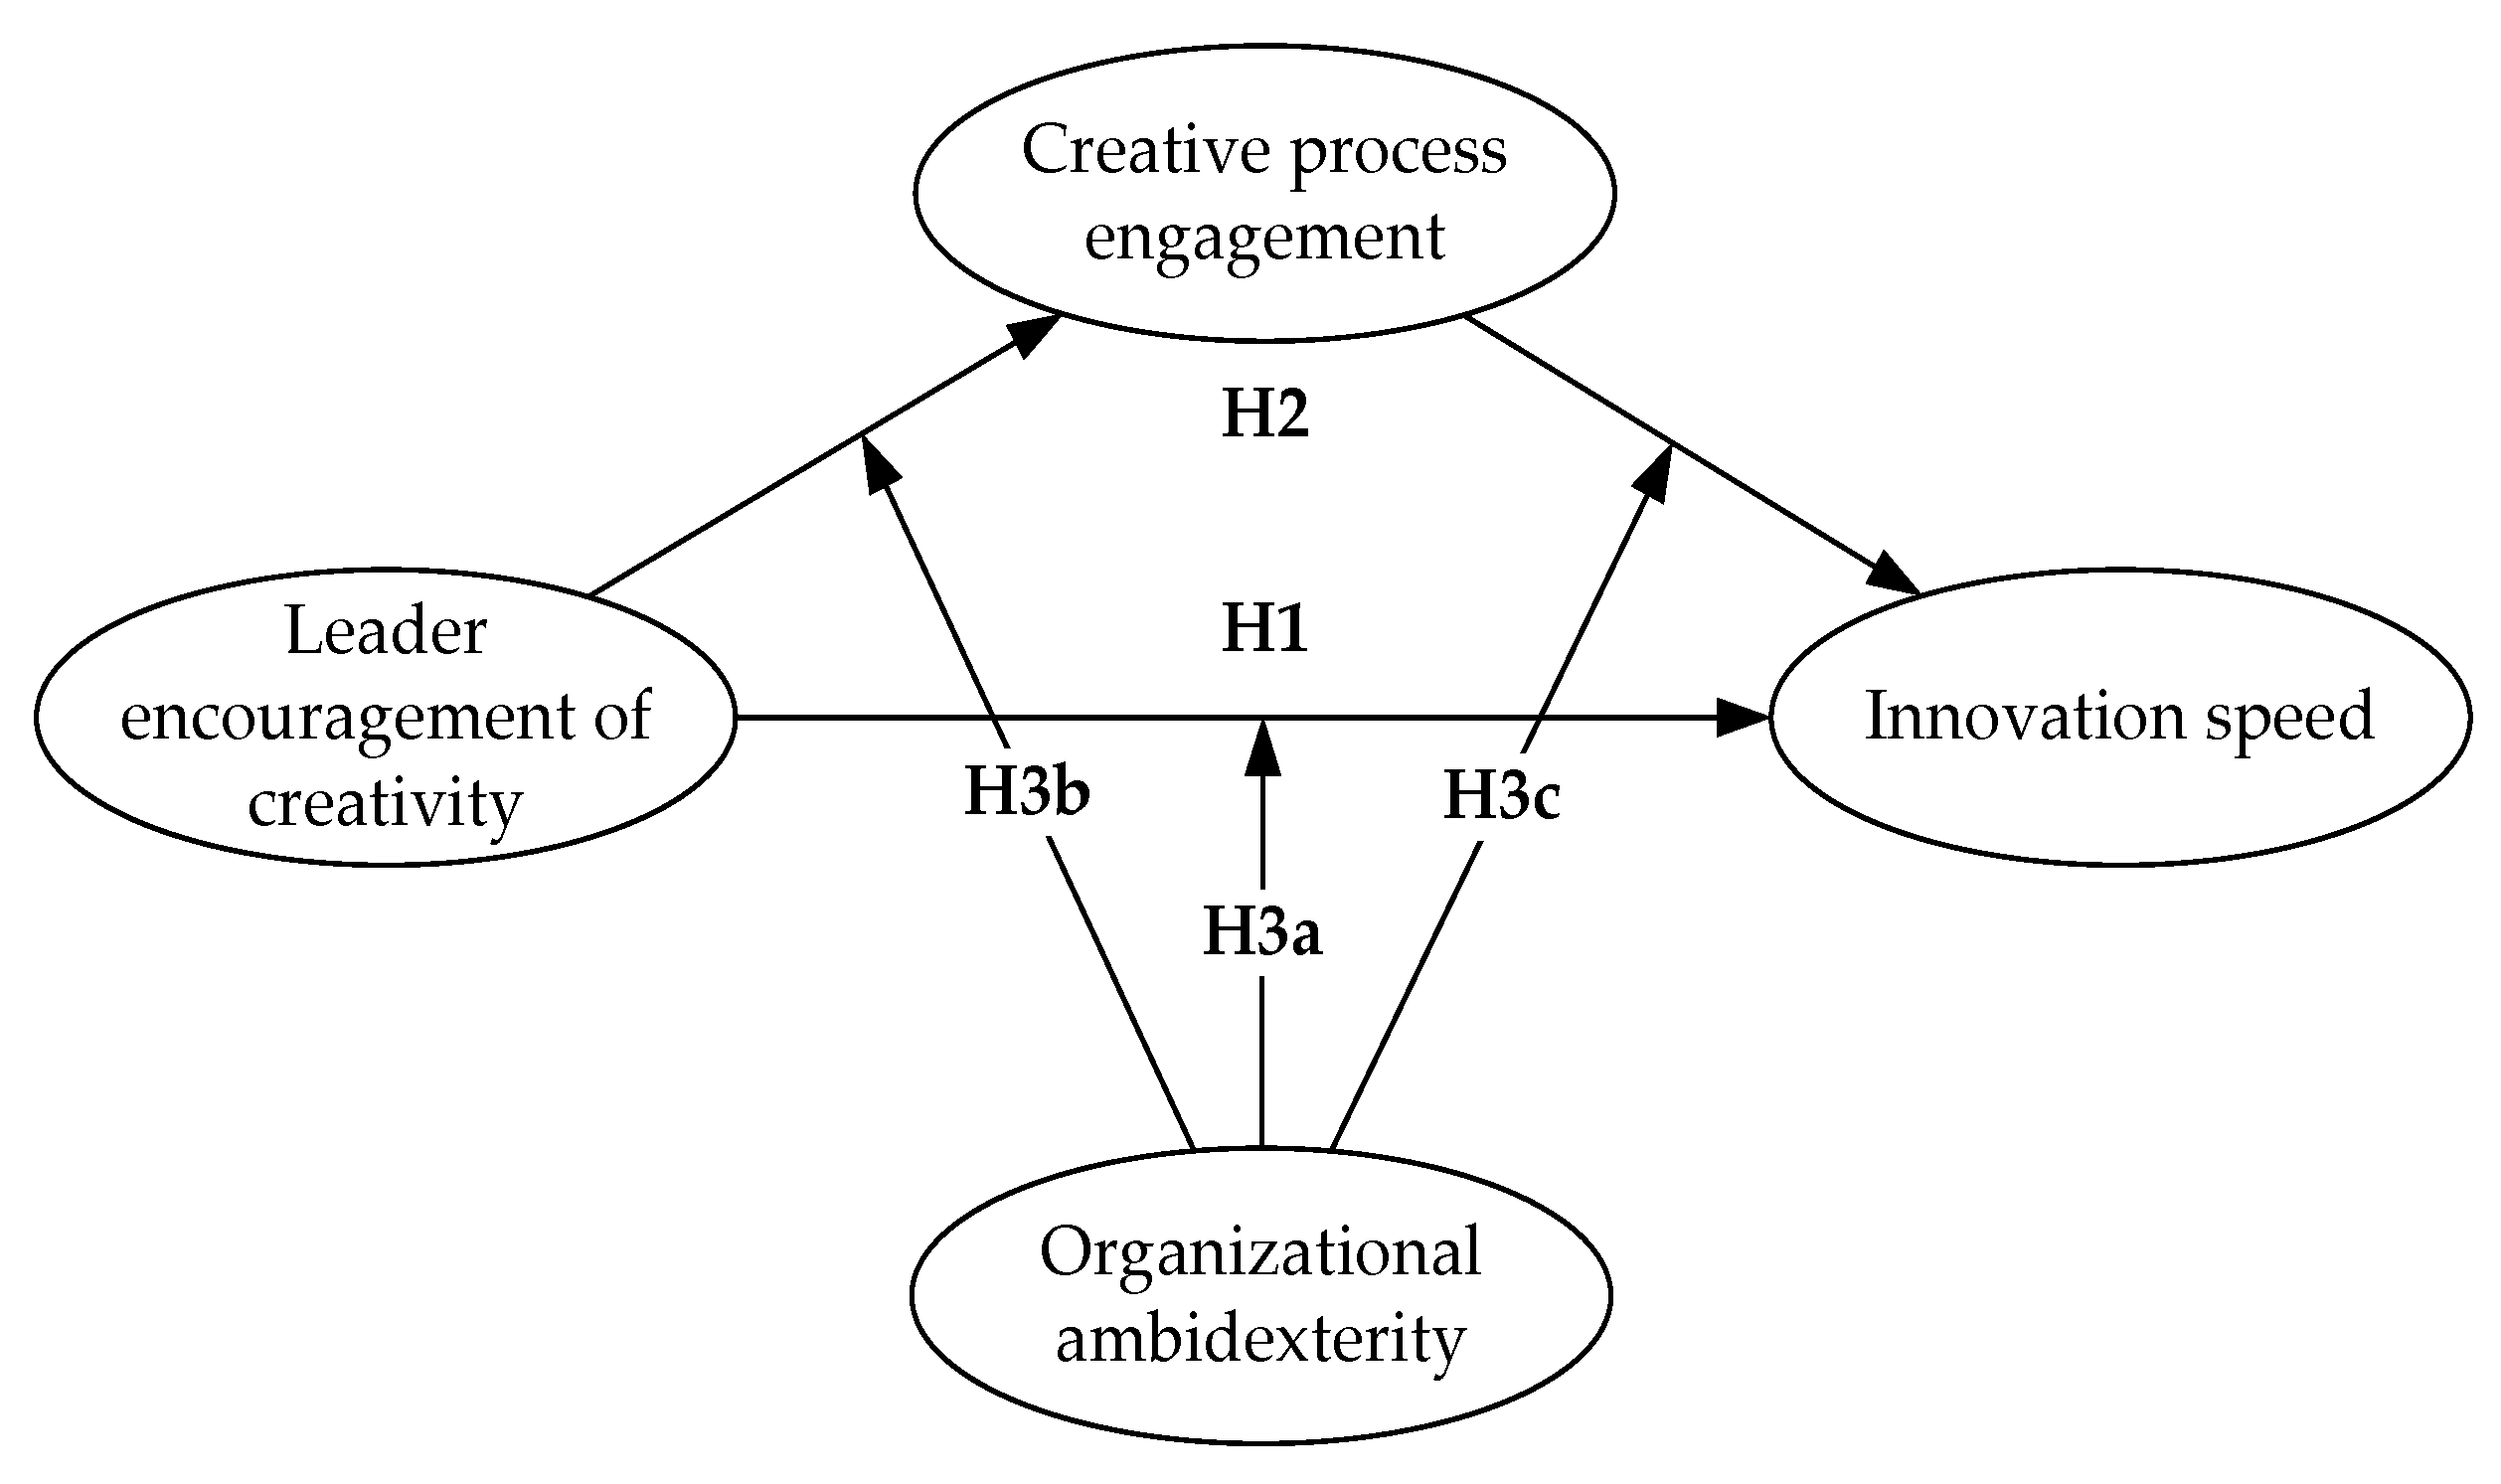
Hypothesis 3a.
Organizational ambidexterity moderates the effect of leader encouragement of creativity on innovation speed.
Hypothesis 3b.
Organizational ambidexterity moderates the effect of leader encouragement of creativity on creative process engagement.
Hypothesis 3c.
Organizational ambidexterity moderates the effect of creative process engagement on innovation speed.
The conceptual model is shown as Figure 1.
3. Methods
3.1. Research Design
Survey questionnaires were adopted to explore the causal mechanisms related to this study in high-tech companies located in China. The initial questionnaires were translated into Mandarin and then back-translated into English separately by two bilingual professors to ensure the reliability and validity of their meanings. Before the formal survey, a pre-test with 20 research and development (R&D) division managers from high-tech industries in Zhejiang province was conducted to examine the questionnaires. Managers were required to answer all the survey items and give feedback on the clarity of the questions; the researchers then refined the items to finalize the formal integrated questionnaire. In addition, to ensure the reliability and validity of the questionnaire, semi-structured interviews were undertaken by executives during preliminary research.
3.2. Measurement
The formal questionnaire that was applied in this study covered innovation speed, leader encouragement of creativity, organizational ambidexterity, creative process engagement, and control variables (gender, tenure, firm ownership, firm age, firm size). Most of the items adopted in this research were selected from prior studies, though the researchers modified several to reflect the specific context of China. All scales in this study followed a five-point Likert format. Evaluation of the scales showed that all Cronbach’s alpha values were above 0.70. To detect common method bias due to self-reports, Harman’s one-factor test was used. The results showed that none of the factors significantly dominated the variance, so common method variance is not an issue [45,46].
Innovation speed (IS). This was conceptualized by a three-item scale borrowed from previous literature: (1) time effectiveness, (2) time efficiency, and (3) time relative to competitors in the industry [47]. We copied these three items and, to be consistent, amended them for our other measure of speed as well as the corresponding measure of technical time efficiency, which enabled us to compare more than incremental innovation [48,49]. The response options ranged from 1, “strongly disagree,” to 5, “strongly agree.” The Cronbach’s alpha reliability value of this scale was 0.79.
Leader encouragement of creativity (LEC). A six-item scale developed by Zhang and Bartol [7], drawing from Scott and Bruce [50], was used to measure leader encouragement of creativity. Response options ranged from 1, “strongly disagree,” to 5, “strongly agree.” The reliability of this scale was 0.86.
Organizational ambidexterity (OA). The researchers adopted the items developed by Gibson and Birkinshaw [20] to measure organizational ambidexterity. According to their study, alignment and adaptability are two dimensions of organizational ambidexterity. Hence, two different subscales were used to measure alignment and adaptability, respectively.
Alignment (AL). A three-item scale was adopted to measure alignment. Response options ranged from 1, “strongly disagree,” to 5, “strongly agree.” The reliability of this scale was 0.87.
Adaptability (AD). A three-item scale was adopted to measure adaptability. Response options ranged from 1, “strongly disagree,” to 5, “strongly agree.” The reliability of this scale was 0.91.
Creative process engagement (CPE). Problem identification, information search and encoding, and idea generation are the three factors of creative process engagement in Zhang and Bartol’s [8] research.
Problem identification (PI). A three-item scale was used to measure problem identification. Response options ranged from 1, “strongly disagree,” to 5, “strongly agree.” The reliability of this scale was 0.81.
Information searching and encoding (ISE). In the same way, a three-item scale was used to measure information searching and encoding. Response options ranged from 1, “strongly disagree,” to 5, “strongly agree.” The reliability of this scale was 0.74.
Idea generation (IG). A five-item scale was used to measure idea generation. Response options ranged from 1, “strongly disagree,” to 5, “strongly agree.” The reliability of this scale was 0.84.
Control variables. Gender and tenure were two controls of participants in this study. Gender was coded “0” for female and “1” for male, and tenure represented the number of years that a participant had been in the company. In addition to individual-level controls, three firm characteristics were included: firm ownership, which was coded “0” for state-owned enterprises and “1” for non-state-owned enterprises, firm age, and firm size.
3.3. Participants and Procedures
With the help of local government agencies (e.g., Department of Commerce, Development and Reform Bureau), we collected data from 300 companies located in Zhejiang, Jiangsu, and Shanghai. Participants were selected from R&D-relevant divisions, and had considerable experience in innovation work. The participants were professional-level employees, such as hardware engineers and software engineers, because those jobs require substantive creative activities. In the first stage (T1), demographic information was asked for when participants reported their perception of organizational ambidexterity; 279 surveys were received (response rate 93%). In the second stage (T2), carried out about two months after T1, the 279 participants who responded were asked to report their perception of the encouragement of creativity by their supervisors for innovation activities and their level of creative process engagement; 253 responses were returned (response rate 90.7%). In the last stage (T3), two months later again, the 253 participants from T2 were required to evaluate their perceptions of innovation speed in their departments; 245 responses were received (valid response rate 96.8%). The procedure of data collection was from December 2015 to May 2016. In the valid surveys, females represented 20% while males constituted the remainder; 232 participants had worked for more than 3 years. As for firms, 14.3% had been founded for fewer than 3 years, 37.1% were founded between 3 and 5 years ago, 35.5% had been founded for between 5 and 10 years, 9% had been founded for between 10 to 20 years, and 4.1% had been founded for more than 20 years. Most of the investigated firms were small and medium-sized enterprises (SMEs), and the number of employees was fewer than 500. Regarding ownership, 31.4% were state-owned enterprises (SOEs) and 68.6% were not SOEs.
3.4. Method Choice
Structural equation modeling. In this study, Amos 17.0 at ZJUT, China which developed by IBM, New York, United States, was used to examine the measurement model. The technique includes a set of suitable methods for both confirmatory factor analysis (CFA) and SEM through visualized modeling techniques. Compared with conventional linear regression, SEM allows comparisons among alternative theoretical models via indexes. In this study, indexes including the values of X2 goodness-of-fit test (X2/df) comparative fit index (CFI), Tucker–Lewis index (TLI), incremental fit index (IFI), and root mean square error of approximation (RMSEA) are adopted to compare the goodness of fit among the proposed models to produce the best model. Regarding sample size, the 245 responses received exceeded the recommendation for a sample size of about 200 for SEM [51]. Therefore, SEM is an appropriate tool for this study.
However, there are still some limitations of SEM. First, SEM emphasizes comparison among alternative models, rather than the effect size within each model. According to Preacher and Hayes [52], the qualified model is a necessary, but not sufficient, condition for the effects in the model. While SEM captured effect size by path coefficients, it failed to detect indirect effect size within the model. Thus, this study adopted SPSS 23.0 at ZJUT, China which developed by IBM, New York, United States, and the PROCESS 3.0 macro developed by Andrew F. Hayes to capture the indirect effect size; that is, the indirect effect from leader encouragement of creativity to innovation speed through creative process engagement with organizational ambidexterity as moderator. Second, both tools mentioned failed to capture the variety or discrepancy of the causal conditions underpinning the same outcomes [53,54,55]. To avoid the limitations of quantitative tools, qualitative comparative analysis (QCA) was introduced to this study to uncover the causal factors within innovation speed
Fuzzy-set qualitative comparative analysis. QCA is a set theory-based method used for detecting sufficient but not necessary combination(s) of one or more variables leading to the expected dependent variable. The core principle of QCA is logic optimization, in which researchers could simplify combinations from cases and construct sufficient combinations with the fewest variables to outcome [49]. Based on that, QCA enables researchers to gain various combinations linking the same outcome with a non-linear nature [56,57],
To adopt QCA, users should convert the original data into membership data ranging from 0 to 1; membership of 0 represents the variable being existence in the given set, and membership of 1 represents the variable being present in the given set. Depending on the membership score in the truth table, QCA is divided into crisp-set QCA (czQCA) and fuzzy-set QCA (fsQCA) [58]. Membership scores in czQCA are only binary data. However, fsQCA expands czQCA by permitting membership scores as continuous variables between 0 and 1. This improvement allows more underlying information to be retained. Additionally, although QCA is initially designed for small-N studies, in work by Fiss et al. [59] QCA is adapted to larger-N analysis. Therefore, in conclusion, fsQCA is suitable for this study.
Noticeably, compared with SEM, there is one obvious limitation of QCA: there is no causal structure in its solutions. Because of the causal principles of set theory, the outcomes of QCA only show the sufficient configurations of the result, without inner relationships within one combination or among combinations [60]. However, in this study, this limitation was partly reduced by combining the outcomes from SEM and fsQCA, so that the researchers could reveal more comprehensive and integral findings.
4. Results
4.1. Descriptive Statistics
Table 1 displays the means, standard deviations (SDs), correlations, and Cronbach’s alphas for all variables used in the path model. There is a significant positive correlation between IS and CPE (r = 0.37, p < 0.01). LEC is positively correlated with CPE (r = 0.34, p < 0.01) and IS (r = 0.30, p < 0.01).
4.2. Structural Equation Modeling
Table 2 compares the nested models. It first shows that the measurement model had acceptable goodness of fit and was well established to realize discriminant validity. It then shows that the most complex model—that is, the hypothesized model—satisfied the quality criteria as well as did others, suggesting that the hypothesized model completely reflects the relationships of latent variables in the data. Therefore, the hypothesized model is adopted for further analysis with SPSS and PROCESS.
4.3. Results of Hypothesis Testing
4.3.1. Main Effects and Simple Moderated Effects
H1 aimed to explore the influences of LEC on IS. Table 3 shows the results of the regression and that H1 was supported. To be specific, Model 1 in the table showed that LEC was positively correlated with IS (β = 0.293, p = 0.000). Model 2 showed that CPE was positively correlated with IS (β = 0.422, p = 0.000). Model 3 showed that OA was negatively associated with IS (β = −0.199, p = 0.020), while interactions LEC × OA and CPE × OA were positively related to IS (β = −0.056, p = 0.001; β = −0.044, p = 0.003). Thus, H1, H2b, H3a, and H3b were supported.
H2 proposed that CPE plays the role of mediator between LEC and IS. According to Preacher and Hayes [61], mediation exists when an indirect effect rather than main effects exists at two stages. Thus, two direct effects of LEC on CPE and CPE on IS were examined by regression, as shown in Table 3 as Models 4 and 2, while the indirect effect was investigated in the next part. Model 4 showed that LEC was positively correlated with CPE (β = 0.284, p = 0.000). Model 2 showed that CPE was positively correlated with IS (β = 0.422, p = 0.000). Thus, H2a and H2b were supported.
4.3.2. Mediation Effect
After satisfying the prerequisites of the existence of direct effects that LEC impacts CPE and CPE impacts IS, the PROCESS macro was used to examine the indirect effect. The results in Table 4 show that the 95% confidence interval for the direct effect was [0.0784, 0.3290], containing 0; while the 95% confidence interval for the indirect effect was [0.0540, 0.1745], excluding 0. Therefore, CPE mediated the positive relationship of LEC on IS, supporting H2.
4.3.3. Moderated Mediation Model
H3 assumed that both the direct and indirect effects of LEC on IS were moderated by OA. Although previous studies respectively prove the existence of simple moderation effects (H3a, H3b, and H3c), examination of H3 required the model to be treated as an integral entity. Hence, to better test H3, Model 59 in PROCESS was adopted to examine those effects simultaneously. The results are shown in Table 4 as the second and third paths. According to Table 4, OA insignificantly moderated the effect of LEC on CPE (β = 0.0421, p = 0.3266). Nevertheless, the moderation effect of OA on the relationship between LEC and IS was significantly positive. When the values of OA were at a high or medium level (+1 SD and 0), the direct effects of LEC on IS were significantly positive (β = 0.3380, 95% Conf. = [0.1422, 0.5339]; β = 0.2175, 95% Conf. = [0.0072, 0.3478]), while when the value of OA was at a low level (-1 SD), the effect of LEC on IS was insignificantly positive (β = 0.0970, 95% Conf. = [−0.0498, 0.2438]). Additionally, the moderated mediation effect of OA on the relationship between LEC on IS via CPE was insignificant (β = -0.0544, p = 0.4776). Specifically, when the values of OA were at a low or medium level (−1 SD and 0), the indirect effects of LEC on IS through CPE were significantly positive (β = 0.0711, 95% Conf. = [0.0093, 0.1462]; β = 0.0725, 95% Conf. = [0.0248, 0.1302]), while when the value of OA was at a high level (+1 SD), the indirect effect was insignificantly positive (β = 0.0696, 95% Conf. = [−0.0003, 0.1532]).
In conclusion, H3a and H3b were not supported, while H3c was supported. Therefore, H3 was partly supported.
4.4. Calibration and Necessity
Another method employed in this study was fsQCA. The first step of fsQCA is to transform Likert scores into set scores. There are two typical strategies for calibration: knowledge-based calibration, which was developed to cope with meaningful data [48]; and data-based calibration, which was developed for transferring survey scores into set scores [55,62]. This study followed the first approach.
Before calibration, the researchers were required to identify target sets that corresponded to each variable in the study. According to Ragin [53], target sets should be described as statements, rather than variables only. Therefore, to inherit the maximum information, first-order latent variables in SEM were turned into target sets named “the existence of organization adaptability,” “the existence of organization alignment,” “the existence of leader encouragement of creativity,” “the existence of problem identification,” “the existence of information searching and encoding,” “the existence of idea generation,” and “high innovation speed.”
For calibration, external criteria based on knowledge were specified as three thresholds for each set, so that original interval scores could be transformed into fuzzy-set membership scores. Membership score referred to the extent of one case belonging to a set [53]. For interval data, the criteria of identifying the extent of membership relied on the selections. In this study, a threshold of 5% indicates the item score was 0.25; a threshold of 50% indicates the item score was 3; and a threshold of 95% indicates the item score was 4.75. The researchers converted the original data ranging from 1 to 5 into calibrated data ranging from 0 to 1. According to the above criteria, all scores from the items were calibrated by fsQCA 3.0 which developed by Charles Ragin and Sean Davey, as shown in Table 5.
It was deemed appropriate to examine the necessity of a single condition before analyzing sufficient configurations of the conditions [53]. If one condition was necessary for the outcome, it might be a common component across all causal recipes in the solutions, and thus it should be removed before the truth table analysis, because necessary conditions are unhelpful for predicting the outcome [53]. In this study, as shown in Table 5, the necessity of each condition was lower than 0.9. All conditions thus qualified to undergo the next step.
4.5. Solutions
Ragin [53] suggested that when the total number of cases in an analysis is large (large-N), a more substantial threshold should be used. Therefore, the researchers in this study set a higher threshold frequency as the case number, which describes the number of cases supporting one combination above 3, and the frequency, which describes the consistency of all cases belonging to one combination above 0.9 simultaneously, which covers over 90% cases from the sample in this study.
There were three solutions produced by fsQCA: complex, intermediate, and parsimonious. The complex solution was the direct result of data-driven analysis with the QCA algorithm. It revealed the greatest number of possible configurations from the cases. The parsimonious solution was derived from unreasonable simplification, but following, as far as possible, minimization of the algorithm. As for the intermediate solution, it was located in the intermediate point between the complex and parsimonious solutions, and thus represented the results of fsQCA after reasonable or theory-driven simplification [52].
The outcomes of fsQCA consisted of the complex solution shown in Table 6. However, the software reported the error that “The 1 Matrix Contains All Configurations”. According to the Quine–McCluskey algorithm adopted in fsQCA, this result suggests that the data were oversimplified to produce the parsimonious solution. As for the intermediate solution, according to the correlations in Table 3 and the literature review above, the researchers added the theoretical conditions that “the presence of idea generation, information searching and encoding, problem identifying, and leader encouragement of creativity and the absence of organizational alignment and organizational adaptation would contribute to high innovation speed” to generate the intermediate solution. The results of the intermediate solution were the same as for the complex solution. This indicates consistency between data and theory.
As shown in Table 6, there were five configurations, as the complex solution led to a high innovation speed. According to Ragin, for the greatest explanatory power the consistency of the configuration should be above 0.9 and the coverage better or higher than 0.5 [53]. Therefore, C3 and C5 were excluded while C1, C2, and C4 satisfied the criteria.
4.6. Robustness Examination
One proposed way to examine robustness involved entering the solutions obtained via QCA into a regression analysis. The advantage of such a hybrid approach, as suggested by Fiss et al. [57], is that “we believe introducing such additional analyses would likely allow insights from large-N QCA to become more robust through comparison across methods and more precise in assessing the magnitude of relationships.” According to this method, the researchers first constructed three new variables in SPSS representing configurations C1, C2, and C4. The researchers then calculated the membership scores of each condition in each configuration as the minimum across the conditions involved. For example, the value of the first case in the configuration was the minimum value of ISE, AL, AD, and LEC. These three new variables, which now stood for the configurations obtained, were then adopted for the regression analysis. The results of the regression analysis are presented in Table 7. According to past literature, there is general acceptance when the variance inflation factor (VIF) is less than 10 [63]. Therefore, the results in Table 7 strongly prove that these three configurations significantly differed from each other, and the diversity of the three configurations leading to high innovation speed is qualified.
5. Discussion
By applying SEM methodology, this study investigates the effect of LEC on IS, and most of the hypotheses receive empirical support. First, a leader with positive behavior in creativity will enhance innovation speed. As a guide in the firm’s creativity work, a leader usually dominates the decision-making of the team’s innovation activities. Second, the mediating effect of CPE is significant in the relationship between LEC and IS. Further, CPE partially mediates the link between LEC and IS. Chinese firms in which the leader actively encourages employees toward creativity will experience a higher innovation speed directly or indirectly via deeper employee engagement in creativity. This result stresses the importance of employees engaging in creativity in the team’s innovation work. Finally, we find that organizational ambidexterity consistently serves as a significant moderator across the links among leader encouragement of creativity, creative engagement, and innovation speed. Additionally, the fsQCA solutions argue that LEC represents a core condition in achieving IS, which consolidates the role of LEC in speeding up innovation activities. The solutions also present varying levels and combinations of the three components of CPE, and the two kinds of organizational ambidexterity, which equally enhance the speed of innovation. The fsQCA outcomes serve to empirically validate our arguments.
5.1. Theory Contributions
Our study offers several theoretical contributions to the literature on leadership, creativity, and innovation in the context of firms in China. First, our results fill the gap in regarding how leadership affects innovation speed. To the best of our knowledge, it is among the first studies addressing the role of the leader’s behavior about regarding creativity in the firm’s innovation speed. Our results help clarify the role of the firm’s leader as the dominating driver in the advance of innovation speed. This finding provides plausible evidence responding in response to previous literature suggesting that the leader’s support plays a key role in driving new products [6,15].
Second, our findings highlight the critical mediating role of CPE in the linkage between LEC and IS. This result advances our understanding of how leaders encourage their subordinates to be fully engaged in the firm’s creativity work. In particular, the finding reveals that the three components of CPE have different mediating effects between LEC and IS. It implies that LEC does not equally depend on the three components of CPE to perform innovation speed. Specifically, an employee’s information search and encoding have stronger mediating effects between LEC and innovation speed than compared to idea generation does, while problem identification has the weakest effect on bridging LEC and IS. These results provide an interesting theoretical explanation for employee creativity in innovation work, and advance the existing research findings [7,27].
Third, for the field of organizational ambidexterity, our study explores the moderating effect of OA among LEC, CPE, and IS. The results offer advanced theoretical implications for how organizational ambidexterity influences the mechanism of leadership inspiration on employees’ engagement in innovation activities [8,21]. Consistent with our predictions, the interaction of LEC and OA significantly increases CPE, while CPE and OA have a positively association with IS. These findings confirm that firms could perform to a high level of innovation speed if their leaders and employees both receive positive support from the organization.
Finally, in terms of methodology, this study also contributes by exemplifying the complementarities of SEM and fsQCA. The SEM analysis is appropriate in explaining the causal paths through which leader encouragement of creativity ultimately impacts innovation speed through creative process engagement, whereas fsQCA provides a deeper understanding of the complex, non-linear, and synergistic effects of organizational ambidexterity in conditioning the effect of leader encouragement of creativity on innovation speed through creative process engagement. The SEM findings demonstrate the general tendency that LEC positively affects innovation speed through CPE, and OA moderates these relationships positively, whereas fsQCA uncovers three configurations that exist in terms of achieving high innovation speed. Specifically, by fsQCA analysis, the confluence of LEC, CPE, and OA is studied, and patterns of conditions that facilitate innovation speed emerge. The outcomes of fsQCA analysis provide interesting results, which reinforce and refine the outcomes from SEM.
5.2. Implications for Practice
This study offers several useful managerial implications for practice. First, the results show that leaders who actively engage in creativity activities have a strong impact on innovation speed. This enlightens the managers in charge of innovation work who focus on the important value of innovativeness for performing strongly, and provide resources devoted to innovation processes. Firms should also select managers who can be involved in creativity activities as much as possible to be responsible for innovation projects.
Second, our study suggests that employees’ creative process engagement mediates the relationship between LEC and IS. This finding helps managers to understand their employees’ creative behaviors and leaders’ support in this specific organizational context, for example, cultivating a more open work climate, sharing a culture embracing innovation, and encouraging employees to think beyond earlier plans. Furthermore, our results center on the moderating role of organizational ambidexterity in promoting the links among LEC, CPE, and IS. Specifically, when employees are tired of generating innovation ideas or identifying innovation problems, we suggest that management help increase innovation speed by articulating a culture that embraces innovation. At the same time, firms need to create a more relaxed and flexible organizational climate.
5.3. Limitations and Future Research
Several limitations to the current study suggest potential directions for future research. First, this study only examines three factors, which are proven to have an impact on innovation speed. There may be other factors contributing to the effectiveness of innovation speed, such as extrinsic motivation [64], radicalness [65], and market orientation [66]. Thus, examinations of such factors are a possible direction which deserves further research. Second, the data used in this study were survey data, which may cause result bias. Hence, objective measures should be introduced in future research. Third, our sample in this study consists of Chinese firms, which can also cause sample bias in the results. Given the complexity of China’s economic development, a future study needs to choose data from other countries to test the hypotheses.
6. Conclusions
The authors created a theoretical model in which leader encouragement of creativity influenced innovation speed through creative process engagement, and was moderated by organizational ambidexterity. Empirical investigation indicated that LEC is associated with innovation speed. The mediating effect of CPE is confirmed between LEC and IS. The results also identify different moderating effects under which the link among LEC, CPE, and IS is reinforced. Furthermore, we identify three configurations that present varying levels and combinations of LEC, the three components of CPE, and the two kinds of organizational ambidexterity which equally enhance the speed of innovation.
Author Contributions
Conceptualization, C.C. and L.C.; methodology, C.C. and L.C. and Y.H.; resources, C.C.; formal analysis, L.C. and H.Z.; writing—original draft preparation, Y.H. and L.C.; writing—review and editing, C.C. and L.C. and H.Z. and Y.H. and J.Q.; funding acquisition, C.C.
Funding
National Natural Science Foundation of China (71772164, 71402168, 71772163); Natural Science Foundation of Zhejiang Province (LR19G020001); Key Project of the Ministry of Education on Humanities and Social Science(17JZD018).
Conflicts of Interest
The authors declare that the research was conducted in the absence of any commercial or financial relationships that could be construed as a potential conflict of interest.
References
- Zhang, Q.; Sun, S.; Zheng, X.; Liu, W. The Role of Cynicism and Personal Traits in the Organizational Political Climate and Sustainable Creativity. Sustainability 2019, 11, 257. [Google Scholar] [CrossRef]
- DuBois, C.L.; Dubois, D.A. Strategic HRM as social design for environmental sustainability in organization. Hum. Resour. Manag. 2012, 51, 799–826. [Google Scholar] [CrossRef]
- Geels, F.W. Ontologies, socio-technical transitions (to sustainability), and the multi-level perspective. Res. Policy 2010, 39, 495–510. [Google Scholar] [CrossRef]
- Kramar, R. Beyond strategic human resource management: Is sustainable human resource management the next approach? Int. J. Hum. Resour. Manag. 2014, 25, 1069–1089. [Google Scholar] [CrossRef]
- Brem, A.; Puente-Diaz, R.; Agogué, M. Creativity and innovation: State of the art and future perspectives for research. Int. J. Innov. Manag. 2016, 20, 1602001. [Google Scholar] [CrossRef]
- Kessler, E.H.; Chakrabarti, A.K. Innovation speed: A conceptual model of context, antecedents, and outcomes. Acad. Manag. Rev. 1996, 21, 1143–1191. [Google Scholar] [CrossRef]
- Zhang, X.; Bartol, K.M. Linking empowering leadership and employee creativity: The influence of psychological empowerment, intrinsic motivation, and creative process engagement. Acad. Manag. J. 2010, 53, 107–128. [Google Scholar] [CrossRef]
- Zhang, X.; Bartol, K.M. The influence of creative process engagement on employee creative performance and overall job performance: A curvilinear assessment. J. Appl. Psychol. 2010, 95, 862–873. [Google Scholar] [CrossRef] [PubMed]
- O’Reilly, C.A.; Tushman, M.L. Organizational ambidexterity: Past, present, and future. Acad. Manag. Perspect. 2013, 27, 324–338. [Google Scholar] [CrossRef]
- Donate, M.J.; de Pablo, J.D.S. The role of knowledge-oriented leadership in knowledge management practices and innovation. J. Bus. Res. 2015, 68, 360–370. [Google Scholar] [CrossRef]
- Rosing, K.; Frese, M.; Bausch, A. Explaining the heterogeneity of the leadership-innovation relationship: Ambidextrous leadership. Leadersh. Q. 2011, 22, 956–974. [Google Scholar] [CrossRef]
- Dunegan, K.J.; Tierney, P.; Duchon, D. Perceptions of an innovative climate: Examining the role of divisional affiliation, work group interaction, and leader/subordinate exchange. IEEE Trans. Eng. Manag. 1992, 39, 227–236. [Google Scholar] [CrossRef]
- Atwater, L.; Carmeli, A. Leader–member exchange, feelings of energy, and involvement in creative work. Leadersh. Q. 2009, 20, 264–275. [Google Scholar] [CrossRef]
- Cramm, J.M.; Strating, M.M.; Bal, R.; Nieboer, A.P. A large-scale longitudinal study indicating the importance of perceived effectiveness, organizational and management support for innovative culture. Soc. Sci. Med. 2013, 83, 119–124. [Google Scholar] [CrossRef] [PubMed] [Green Version]
- Carbonell, P.; Rodríguez-Escudero, A.I. Relationships among team’s organizational context, innovation speed, and technological uncertainty: An empirical analysis. J. Eng. Technol. Manag. 2009, 26, 28–45. [Google Scholar] [CrossRef]
- West, M.A. Developing Creativity in Organizations: Personal and Professional Development; British Psychological Society: Leicester, UK, 1997. [Google Scholar]
- West, M.A. Sparkling fountains or stagnant ponds: An integrative model of creativity and innovation implementation in work groups. Appl. Psychol. 2002, 51, 355–387. [Google Scholar] [CrossRef]
- Amabile, T.M. A model of creativity and innovation in organizations. Res. Organ. Behav. 1988, 10, 123–167. [Google Scholar]
- Sun, W.; Xu, A.; Shang, Y. Transformational leadership, team climate, and team performance within the NPD team: Evidence from China. Asia Pac. J. Manag. 2014, 31, 127–147. [Google Scholar] [CrossRef]
- Gibson, C.B.; Birkinshaw, J. The antecedents, consequences, and mediating role of organizational ambidexterity. Acad. Manag. J. 2004, 47, 209–226. [Google Scholar]
- Gumusluoglu, L.; Ilsev, A. Transformational leadership, creativity, and organizational innovation. J. Bus. Res. 2009, 62, 461–473. [Google Scholar] [CrossRef] [Green Version]
- Oldham, G.R.; Cummings, A. Employee creativity: Personal and contextual factors at work. Acad. Manag. J. 1996, 39, 607–634. [Google Scholar]
- Shalley, C.E.; Zhou, J.; Oldham, G.R. The effects of personal and contextual characteristics on creativity: Where should we go from here? J. Manag. 2004, 30, 933–958. [Google Scholar] [CrossRef]
- Farmer, S.M.; Tierney, P.; Kung-Mcintyre, K. Employee creativity in Taiwan: An application of role identity theory. Acad. Manag. J. 2003, 46, 618–630. [Google Scholar]
- Wang, A.C.; Cheng, B.S. When does benevolent leadership lead to creativity? The moderating role of creative role identity and job autonomy. J. Organ. Behav. 2010, 31, 106–121. [Google Scholar] [CrossRef]
- Bhatnagar, J. Management of innovation: Role of psychological empowerment, work engagement and turnover intention in the Indian context. Int. J. Hum. Resour. Manag. 2012, 23, 928–951. [Google Scholar] [CrossRef]
- Cheng, C.; Yang, M. Creative process engagement and new product performance: The role of new product development speed and leadership encouragement of creativity. J. Bus. Res. 2019, 99, 215–225. [Google Scholar] [CrossRef]
- Henker, N.; Sonnentag, S.; Unger, D. Transformational leadership and employee creativity: The mediating role of promotion focus and creative process engagement. J. Bus. Psychol. 2015, 30, 235–247. [Google Scholar] [CrossRef]
- Saeed, B.B.; Afsar, B.; Cheema, S.; Javed, F. Leader-member exchange and innovative work behavior: The role of creative process engagement, core self-evaluation, and domain knowledge. Eur. J. Innov. Manag. 2018, 22, 105–124. [Google Scholar] [CrossRef]
- Balboni, B.; Bortoluzzi, G.; Pugliese, R.; Tracogna, A. Business model evolution, contextual ambidexterity and the growth performance of high-tech start-ups. J. Bus. Res. 2019, 99, 115–124. [Google Scholar] [CrossRef]
- Havermans, L.A.; Den Hartog, D.N.; Keegan, A.; Uhl-Bien, M. Exploring the role of leadership in enabling contextual ambidexterity. Hum. Resour. Manag. 2015, 54, 179–200. [Google Scholar] [CrossRef]
- Duncan, R.B. The ambidextrous organization: Designing dual structures for innovation. Manag. Organ. 1976, 1, 167–188. [Google Scholar]
- Tushman, M.L.; O’Reilly, C.A., III. Ambidextrous organizations: Managing evolutionary and revolutionary change. Calif. Manag. Rev. 1996, 38, 8–29. [Google Scholar] [CrossRef]
- Jurksiene, L.; Pundziene, A. The relationship between dynamic capabilities and firm competitive advantage: The mediating role of organizational ambidexterity. Eur. Bus. Rev. 2016, 28, 431–448. [Google Scholar] [CrossRef]
- Heavey, C.; Simsek, Z. Distributed cognition in top management teams and organizational ambidexterity: The influence of transactive memory systems. J. Manag. 2017, 43, 919–945. [Google Scholar] [CrossRef]
- Lee, K.; Kim, Y.; Joshi, K. Organizational memory and new product development performance: Investigating the role of organizational ambidexterity. Technol. Forecast. Soc. Chang. 2017, 120, 117–129. [Google Scholar] [CrossRef]
- Brem, A. Creativity and routine: Conceptual considerations on managing organisational ambidexterity in entrepreneurial ventures. Int. J. Entrep. Innov. Manag. 2017, 21, 261–273. [Google Scholar]
- Raisch, S.; Birkinshaw, J. Organizational ambidexterity: Antecedents, outcomes, and moderators. J. Manag. 2008, 34, 375–409. [Google Scholar] [CrossRef]
- Wang, C.L.; Rafiq, M. Ambidextrous organizational culture, contextual ambidexterity and new product innovation: A comparative study of UK and Chinese high-tech firms. Br. J. Manag. 2014, 25, 58–76. [Google Scholar] [CrossRef]
- Wu, Y.; Wu, S. Managing ambidexterity in creative industries: A survey. J. Bus. Res. 2016, 69, 2388–2396. [Google Scholar] [CrossRef]
- Andriopoulos, C.; Lewis, M.W. Exploitation-exploration tensions and organizational ambidexterity: Managing paradoxes of innovation. Organ. Sci. 2009, 20, 696–717. [Google Scholar] [CrossRef]
- Khazanchi, S.; Lewis, M.W.; Boyer, K.K. Innovation-supportive culture: The impact of organizational values on process innovation. J. Oper. Manag. 2007, 25, 871–884. [Google Scholar] [CrossRef]
- Boies, K.; Howell, J.M. Leader–member exchange in teams: An examination of the interaction between relationship differentiation and mean LMX in explaining team-level outcomes. Leadersh. Q. 2006, 17, 246–257. [Google Scholar] [CrossRef]
- Mabert, V.A.; Muth, J.F.; Schmenner, R.W. Collapsing new product development times: Six case studies. J. Prod. Innov. Manag. 1992, 9, 200–212. [Google Scholar] [CrossRef]
- Lai, X.; Li, F.; Leung, K. A Monte Carlo study of the effects of common method variance on significance testing and parameter bias in hierarchical linear modeling. Organ. Res. Methods 2013, 16, 243–269. [Google Scholar] [CrossRef]
- Podsakoff, P.M.; Organ, D.W. Self-reports in organizational research: Problems and prospects. J. Manag. 1986, 12, 531–544. [Google Scholar] [CrossRef]
- Kessler, E.H.; Bierly, P.E. Is faster really better? An empirical test of the implications of innovation speed. IEEE Trans. Eng. Manag. 2002, 49, 2–12. [Google Scholar] [CrossRef]
- Hamdi, S.; Silong, A.D.; Rasdi, R.M.; Omar, Z.B. Moderating effect of Technology Uncertainty on Relationship between Innovation Speed and Product Success: A Survey in Malaysian Biotechnology Industry. Int. J. Manag. 2015, 6, 375–383. [Google Scholar]
- Hult, G.T.M.; Ketchen, D.J.; Nichols, E.L. An examination of cultural competitiveness and order fulfillment cycle time within supply chains. Acad. Manag. J. 2002, 45, 577–586. [Google Scholar]
- Scott, S.G.; Bruce, R.A. Determinants of innovative behavior: A path model of individual innovation in the workplace. Acad. Manag. J. 1994, 37, 580–607. [Google Scholar]
- Iacobucci, D. Structural equations modeling: Fit indices, sample size, and advanced topics. J. Consum. Psychol. 2010, 20, 90–98. [Google Scholar] [CrossRef]
- Preacher, K.J.; Hayes, A.F. Asymptotic and resampling strategies for assessing and comparing indirect effects in multiple mediator models. Behav. Res. Methods 2008, 40, 879–891. [Google Scholar] [CrossRef] [Green Version]
- Ragin, C.C. Redesigning Social Inquiry: Fuzzy Sets and Beyond; University of Chicago Press: Chicago, IL, USA, 2009; pp. 85–108. [Google Scholar]
- Tóth, Z.; Thiesbrummel, C.; Henneberg, S.C.; Naudé, P. Understanding configurations of relational attractiveness of the customer firm using fuzzy set QCA. J. Bus. Res. 2015, 68, 723–734. [Google Scholar] [CrossRef]
- Woodside, A.G.; Zhang, M. Cultural diversity and marketing transactions: Are market integration, large community size, and world religions necessary for fairness in ephemeral exchanges? Psychol. Mark. 2013, 30, 263–276. [Google Scholar] [CrossRef]
- Fiss, P.C. A set-theoretic approach to organizational configurations. Acad. Manag. Rev. 2007, 32, 1180–1198. [Google Scholar] [CrossRef] [Green Version]
- Fiss, P.C.; Marx, A.; Rihoux, B. Comment: Getting QCA Right. Sociol. Methodol. 2014, 44, 95–100. [Google Scholar] [CrossRef]
- Ragin, C.C. The Comparative Method: Moving beyond Qualitative and Quantitative Strategies; University of California Press: Berkeley, CA, USA, 2014; pp. 125–163. [Google Scholar]
- Fiss, P.C.; Sharapov, D.; Cronqvist, L. Opposites attract? Opportunities and challenges for integrating large-N QCA and econometric analysis. Political Res. Q. 2013, 66, 191–198. [Google Scholar]
- Ragin, C.C. Set relations in social research: Evaluating their consistency and coverage. Political Anal. 2006, 14, 291–310. [Google Scholar] [CrossRef]
- Preacher, K.J.; Hayes, A.F. SPSS and SAS procedures for estimating indirect effects in simple mediation models. Behav. Res. Methods Instrum. Comput. 2004, 36, 717–731. [Google Scholar] [CrossRef] [Green Version]
- Oyemomi, O.; Liu, S.; Neaga, I.; Alkhuraiji, A. How knowledge sharing and business process contribute to organizational performance: Using the fsQCA approach. J. Bus. Res. 2016, 69, 5222–5227. [Google Scholar] [CrossRef] [Green Version]
- O’brien, R.M. A caution regarding rules of thumb for variance inflation factors. Qual. Quant. 2007, 41, 673–690. [Google Scholar] [CrossRef]
- Thomas, K.W.; Velthouse, B.A. Cognitive elements of empowerment: An “interpretive” model of intrinsic task motivation. Acad. Manag. Rev. 1990, 15, 666–681. [Google Scholar]
- Carbonell, P.; Rodríguez Escudero, A.I. The effect of market orientation on innovation speed and new product performance. J. Bus. Ind. Mark. 2010, 25, 501–513. [Google Scholar] [CrossRef]
- Lu, Y.; Tsang, E.W.; Peng, M.W. Knowledge management and innovation strategy in the Asia Pacific: Toward an institution-based view. Asia Pac. J. Manag. 2008, 3, 361–374. [Google Scholar] [CrossRef]
Figure 1.
The conceptual model.


Table 1.
Descriptive statistics, correlations, and reliabilities (N = 245).
| Variables | Mean | SD | 1 | 2 | 3 | 4 | 5 | 6 | 7 | 8 | 9 | Cronbach’s Alpha |
|---|---|---|---|---|---|---|---|---|---|---|---|---|
| Gender | 0.20 | 0.41 | 1 | / | ||||||||
| Tenure | 5.11 | 2.87 | −0.09 | 1 | / | |||||||
| Ownership | 0.70 | 0.47 | −0.07 | −0.02 | 1 | / | ||||||
| Firm age | 15.87 | 6.58 | 0.12 * | −0.06 | −0.18 ** | 1 | / | |||||
| Firm size | 21.04 | 4.58 | 0.12 | 0.06 | 0.04 | 0.04 | 1 | / | ||||
| LEC | 4.42 | 0.67 | −0.02 | 0.07 | −0.03 | −0.02 | −0.11 | 1 | 0.852 | |||
| OA | 3.32 | 0.71 | −0.03 | 0.06 | −0.00 | −0.02 | 0.02 | 0.26 ** | 1 | 0.846 | ||
| CPE | 3.23 | 0.58 | −0.05 | 0.12 | 0.03 | −0.10 | 0.01 | 0.34 ** | 0.33 ** | 1 | 0.837 | |
| IS | 3.38 | 0.69 | −0.04 | 0.17* | −0.05 | −0.09 | −0.06 | 0.30 ** | 0.31 ** | 0.37 ** | 1 | 0.786 |
Note: * p < 0.05, ** p < 0.01, *** p < 0.001.
Table 2.
Goodness of fit and model comparison (N = 245).
| Models | X2 | X2/df | CFI | TLI | IFI | RMSEA |
|---|---|---|---|---|---|---|
| Quality Criteria | >0 | <5 | >0.9 | >0.9 | >0.9 | <0.08 |
| Measurement Model | 405.309 | 1.295 | 0.969 | 0.965 | 0.969 | 0.035 |
| Default Model | 412.150 | 1.313 | 0.967 | 0.963 | 0.967 | 0.036 |
| Model 1 | 521.692 | 2.208 | 0.945 | 0.934 | 0.945 | 0.070 |
| Model 2 | 246.468 | 1.347 | 0.968 | 0.963 | 0.968 | 0.038 |
| Model 3 | 476.583 | 1.406 | 0.962 | 0.958 | 0.962 | 0.041 |
| Model 4 | 567.738 | 1.675 | 0.939 | 0.932 | 0.940 | 0.053 |
| Model 5 | 488.635 | 1.441 | 0.959 | 0.954 | 0.959 | 0.043 |
| Model 6 | 496.441 | 1.393 | 0.963 | 0.959 | 0.964 | 0.040 |
| Model 7 | 631.123 | 1.739 | 0.941 | 0.934 | 0.941 | 0.055 |
| Model 8 | 794.478 | 2.183 | 0.905 | 0.894 | 0.906 | 0.070 |
| Hypothesized Model | 629.496 | 1.739 | 0.941 | 0.934 | 0.941 | 0.055 |
NOTE: In the default model LEC, CPE, and OA directly affect IS; Model 1 is a moderation model in which the effect of LEC on IS is moderated by OA; Model 2 is a mediation model in which the effect of LEC on IS is mediated by CPE; Model 3 is a model in which the effect of LEC on CPE is moderated by OA; Model 4 is a model in which the effect of CPE on IS is moderated by OA; Model 5 is a model in which the effect of LEC on IS is moderated by OA; Model 6 is a model in which the effect of LEC on IS and LEC on CPE are both moderated by OA; Model 7 is a model in which the effect of LEC on CPE and CPE on IS are both moderated by OA; Model 8 is a model in which the effect of LEC on IS and CPE on IS are both moderated by OA; Model 9 is a model in which all the effects are moderated by OA.
Table 3.
Regression analysis results.
| Dependent Variable | IS | CPE | |||
|---|---|---|---|---|---|
| Model 1 | Model 2 | Model 3 | Model 4 | Model 5 | |
| Gender | −0.024 | −0.002 | −0.005 | −0.052 | −0.047 |
| Tenure | 0.035 * | 0.029 * | 0.025 | 0.021 | 0.017 |
| Ownership | −0.070 | −0.096 | −0.093 | 0.042 | 0.038 |
| Firm age | −0.008 | −0.006 | −0.007 | −0.006 | −0.007 |
| Firm size | −0.004 | −0.008 | −0.006 | 0.003 | 0.001 |
| LEC | 0.293 *** | 0.284 *** | |||
| CPE | 0.422 *** | \ | \ | ||
| OA | −0.199 * | −0.015 | |||
| LEC OA | 0.056 *** | 0.052 *** | |||
| CPE OA | 0.044 ** | \ | \ | ||
| F | 5.496 *** | 7.661 *** | 8.642 *** | 6.212 *** | 8.629 *** |
| R2 | 0.122 | 0.162 | 0.227 | 0.135 | 0.203 |
Note: * p < 0.05; ** p < 0.01; *** p < 0.001.
Table 4.
PROCESS analysis results.
| Relationship | Direct Effects | ||||
| Path | Moderator | Coefficient | Condition | Conditional Effect | 95% Conf. |
| LEC → CPE → IS | \ | 0.2037 ** | \ | \ | [0.0784, 0.3290] |
| LEC → CPE | OA | 0.0421 n.s. | \ | \ | [−0.0423,0.1265] |
| LEC → CPE → IS | OA | 0.1230 * | −1 SD | 0.0970 | [−0.0498, 0.2438] |
| 0 | 0.2175 | [0.0872, 0.3478] | |||
| +1 SD | 0.3380 | [0.1422, 0.5339] | |||
| Relationship | Indirect Effects | ||||
| Path | Moderator | Coefficient | Condition | Conditional Effect | 95% Conf. |
| LEC → CPE → IS | \ | 0.1051 *** | \ | \ | [0.0540, 0.1745] |
| LEC → CPE → IS | OA | −0.0544 n.s. | −1 SD | 0.0711 | [0.0093, 0.1462] |
| 0 | 0.0725 | [0.0248, 0.1302] | |||
| +1 SD | 0.0696 | [−0.003, 0.1532] | |||
NOTE: ns. p > 0.05; * p < 0.05; ** p < 0.01; *** p < 0.001.
Table 5.
Calibration and necessity.
| Calibration Values at | IS | CPE | OA | LEC | |||
|---|---|---|---|---|---|---|---|
| PI | IG | ISE | AL | AD | |||
| 95% | 4.8 | 4.8 | 4.8 | 4.8 | 4.8 | 4.8 | 4.8 |
| 50% | 3 | 3 | 3 | 3 | 3 | 3 | 3 |
| 5% | 1.2 | 1.2 | 1.2 | 1.2 | 1.2 | 1.2 | 1.2 |
| Necessity | / | 0.75 | 0.78 | 0.85 | 0.81 | 0.78 | 0.87 |
Table 6.
Solutions (N ≥ 3; F ≥ 0.9).
| Casual Configuration | C1 | C2 | C3 | C4 | C5 | |
|---|---|---|---|---|---|---|
| CPE | IG | ● | ⊗ | ● | ⊗ | |
| PI | ⊗ | ● | ⊗ | |||
| ISE | ● | ● | ● | ⊗ | ||
| OA | AL | ● | ● | ● | ● | ⊗ |
| AD | ● | ● | ● | ⊗ | ||
| LEC | LEC | ● | ● | ● | ⊗ | |
| Raw Coverage | 0.603 | 0.634 | 0.376 | 0.516 | 0.248 | |
| Unique Coverage | 0.024 | 0.067 | 0.017 | 0.014 | 0.028 | |
| Consistency | 0.945 | 0.942 | 0.964 | 0.972 | 0.946 | |
| Solution Coverage | 0.765 | |||||
| Solution Consistency | 0.933 | |||||
Note: ● represents presence, ⊗ represents absence.
Table 7.
Multicollinearity Diagnostics.
| Dimension | Eigenvalue | Condition Index | Constant | C1 | C2 | C4 |
|---|---|---|---|---|---|---|
| Constant | 3.800 | 1.000 | 0.01 | 0.01 | 0.01 | 0.01 |
| C1 | 0.145 | 5.040 | 0.87 | 0.07 | 0.00 | 0.18 |
| C2 | 0.108 | 5.854 | 0.06 | 0.10 | 0.28 | 0.71 |
| C4 | 0.058 | 8.009 | 0.06 | 0.82 | 0.71 | 0.10 |
| Collinearity Statistics | Tolerance | / | 0.391 | 0.472 | 0.573 | |
| VIF | / | 2.559 | 2.120 | 1.747 | ||
© 2019 by the authors. Licensee MDPI, Basel, Switzerland. This article is an open access article distributed under the terms and conditions of the Creative Commons Attribution (CC BY) license (http://creativecommons.org/licenses/by/4.0/).
Share and Cite
MDPI and ACS Style
Cheng, C.; Cao, L.; Zhong, H.; He, Y.; Qian, J. The Influence of Leader Encouragement of Creativity on Innovation Speed: Findings from SEM and fsQCA. Sustainability 2019, 11, 2693. https://doi.org/10.3390/su11092693
AMA Style
Cheng C, Cao L, Zhong H, He Y, Qian J. The Influence of Leader Encouragement of Creativity on Innovation Speed: Findings from SEM and fsQCA. Sustainability. 2019; 11(9):2693. https://doi.org/10.3390/su11092693
Chicago/Turabian StyleCheng, Cong, Liebing Cao, Huihui Zhong, Yining He, and Jiahong Qian. 2019. "The Influence of Leader Encouragement of Creativity on Innovation Speed: Findings from SEM and fsQCA" Sustainability 11, no. 9: 2693. https://doi.org/10.3390/su11092693
Note that from the first issue of 2016, this journal uses article numbers instead of page numbers. See further details here.