Article

Environmental Assessment of a Bio-Refinery Concept Comprising Biogas Production, Lactic Acid Extraction and Plant Nutrient Recovery

Tropics and Subtropics Group, Institute of Agricultural Engineering, University of Hohenheim, Garbenstraße 9, 70599 Stuttgart, Germany
*
Author to whom correspondence should be addressed.
Sustainability 2019, 11(9), 2601; https://doi.org/10.3390/su11092601
Submission received: 12 March 2019 / Revised: 2 April 2019 / Accepted: 27 April 2019 / Published: 6 May 2019

Abstract

:
The process of nutrient recovery from biogas digestate and the extraction of lactic acid from silages is technically feasible, but so far no investigations are available on the environmental sustainability of these technologies in the context of the biogas production chain. The aim of the present study is to show whether the recovery of nutrients from digestate (NR) and the extraction of lactic acid from silages (LA) can be integrated in the biogas production process system in an environmentally sustainable way. The modelling in the present study is based on the standards DIN ISO 14040 and DIN ISO 14044 and the results are evaluated with respect to the 100-year global warming potential, the primary energy demand and the eutrophication potential. Results show that the recovery of nutrients from digestate can be a sustainable solution to the problem of surplus nutrients in biogas regions. Furthermore, lactic acid, which is extracted from silages can provide an environmentally sustainable source of income for biogas plant operators. The urgency of the nutrient surplus problem in these regions calls for increased research and the support of policy makers to foster development activities.

1. Introduction

In the context of Germany’s turnaround in energy policy, the sector of renewable energy technologies is increasing rapidly. The regulatory basis for the transition towards a sustainable energy supply is provided by the Act on Renewable Energies [1]. Although the Federal Government mainly focusses on the expansion of solar and wind power, the production of biogas is still an important contributor to the national energy supply [2]. Furthermore, Germany is a leader in the European Union in terms of the number of biogas plants and the total installed capacity [3,4]. The anaerobic digestion for energy provision is state-of-the-art technology in Germany, but there is still need for optimization along the whole production chain with regard to new bio-refinery concepts [5]. Biogas plants in Germany are often situated in regions with high feedstock density, which causes an accumulation of nutrients [6]. To avoid over-fertilization of the soils and hence the leaching of nutrients to the groundwater, the use of biogas digestate in Germany is regulated by law [7]. Therefore, biogas digestate must be transported from regions of high livestock density to regions with nutrient deficits. This transport is often not economically feasible due to the high water content and low nutrient concentration of the digestate [6]. To overcome this issue, nutrients in terms of nitrogen and phosphorous need to be extracted and converted to highly concentrated products. Correspondent methods have been developed as part of the GOBi project [8] and described in detail by Ehmann et al. [9] and Frank et al. [10]. Furthermore, extraction techniques based on sorbents such as biochar or zeolites can be used to recover nutrients from digestate and are described in the literature [11].
In addition, operators of biogas plants are looking for additional sources of income due to decreasing feed-in tariffs for energy from biogas and the mandatory direct marketing of electricity for biogas plants with an installed electrical output of more than 150 kW. Biogas plants are mainly fed with silages made from energy crops. The conservation of plant material for biogas feedstock based on ensiling in a lacto-acidic milieu is a commonly applied technique in agricultural practice. During ensiling, anaerobic and acido-tolerant bacteria form lactic acid, which lowers the pH-value in the silo and thus stabilizes the ensiled material for long-term storage. The ensiling process is described in several studies [12,13]. The seepage of agricultural silages contains up to 6% of lactic acid [14], which is currently fed into the biogas plant. There might be better options to use lactic acid as it is an important platform chemical with a broad application potential in the chemical industry. The possibility to extract lactic acid from silage is described by Danner et al. [15]. Furthermore, the digestibility of separated solids from lactic acid pressing in biogas digesters was recently shown in the context of the GOBI project [16,17].
Although the process of nutrient recovery and the extraction of lactic acid from silages is technically feasible, the sustainability of these bio-refinery concepts should be investigated in order to achieve the best possible ecological compatibility and high economic efficiency before implementation. Life cycle assessment (LCA) has proven to be a crucial method to carry out this evaluation [18]. In the context of the present work, Hanserud et al. [19] showed that phosphorous from manure, obtained by solid-liquid separation, can be transferred sustainably from livestock regions to arable regions. Regarding the environmental impact of extracting lactic acids from crop silages, no studies came to our knowledge. Furthermore, no studies on the environmental impacts of nutrient recovery from biogas digestate and the lactic acid extraction from silages integrated in the biogas process chain, were found.
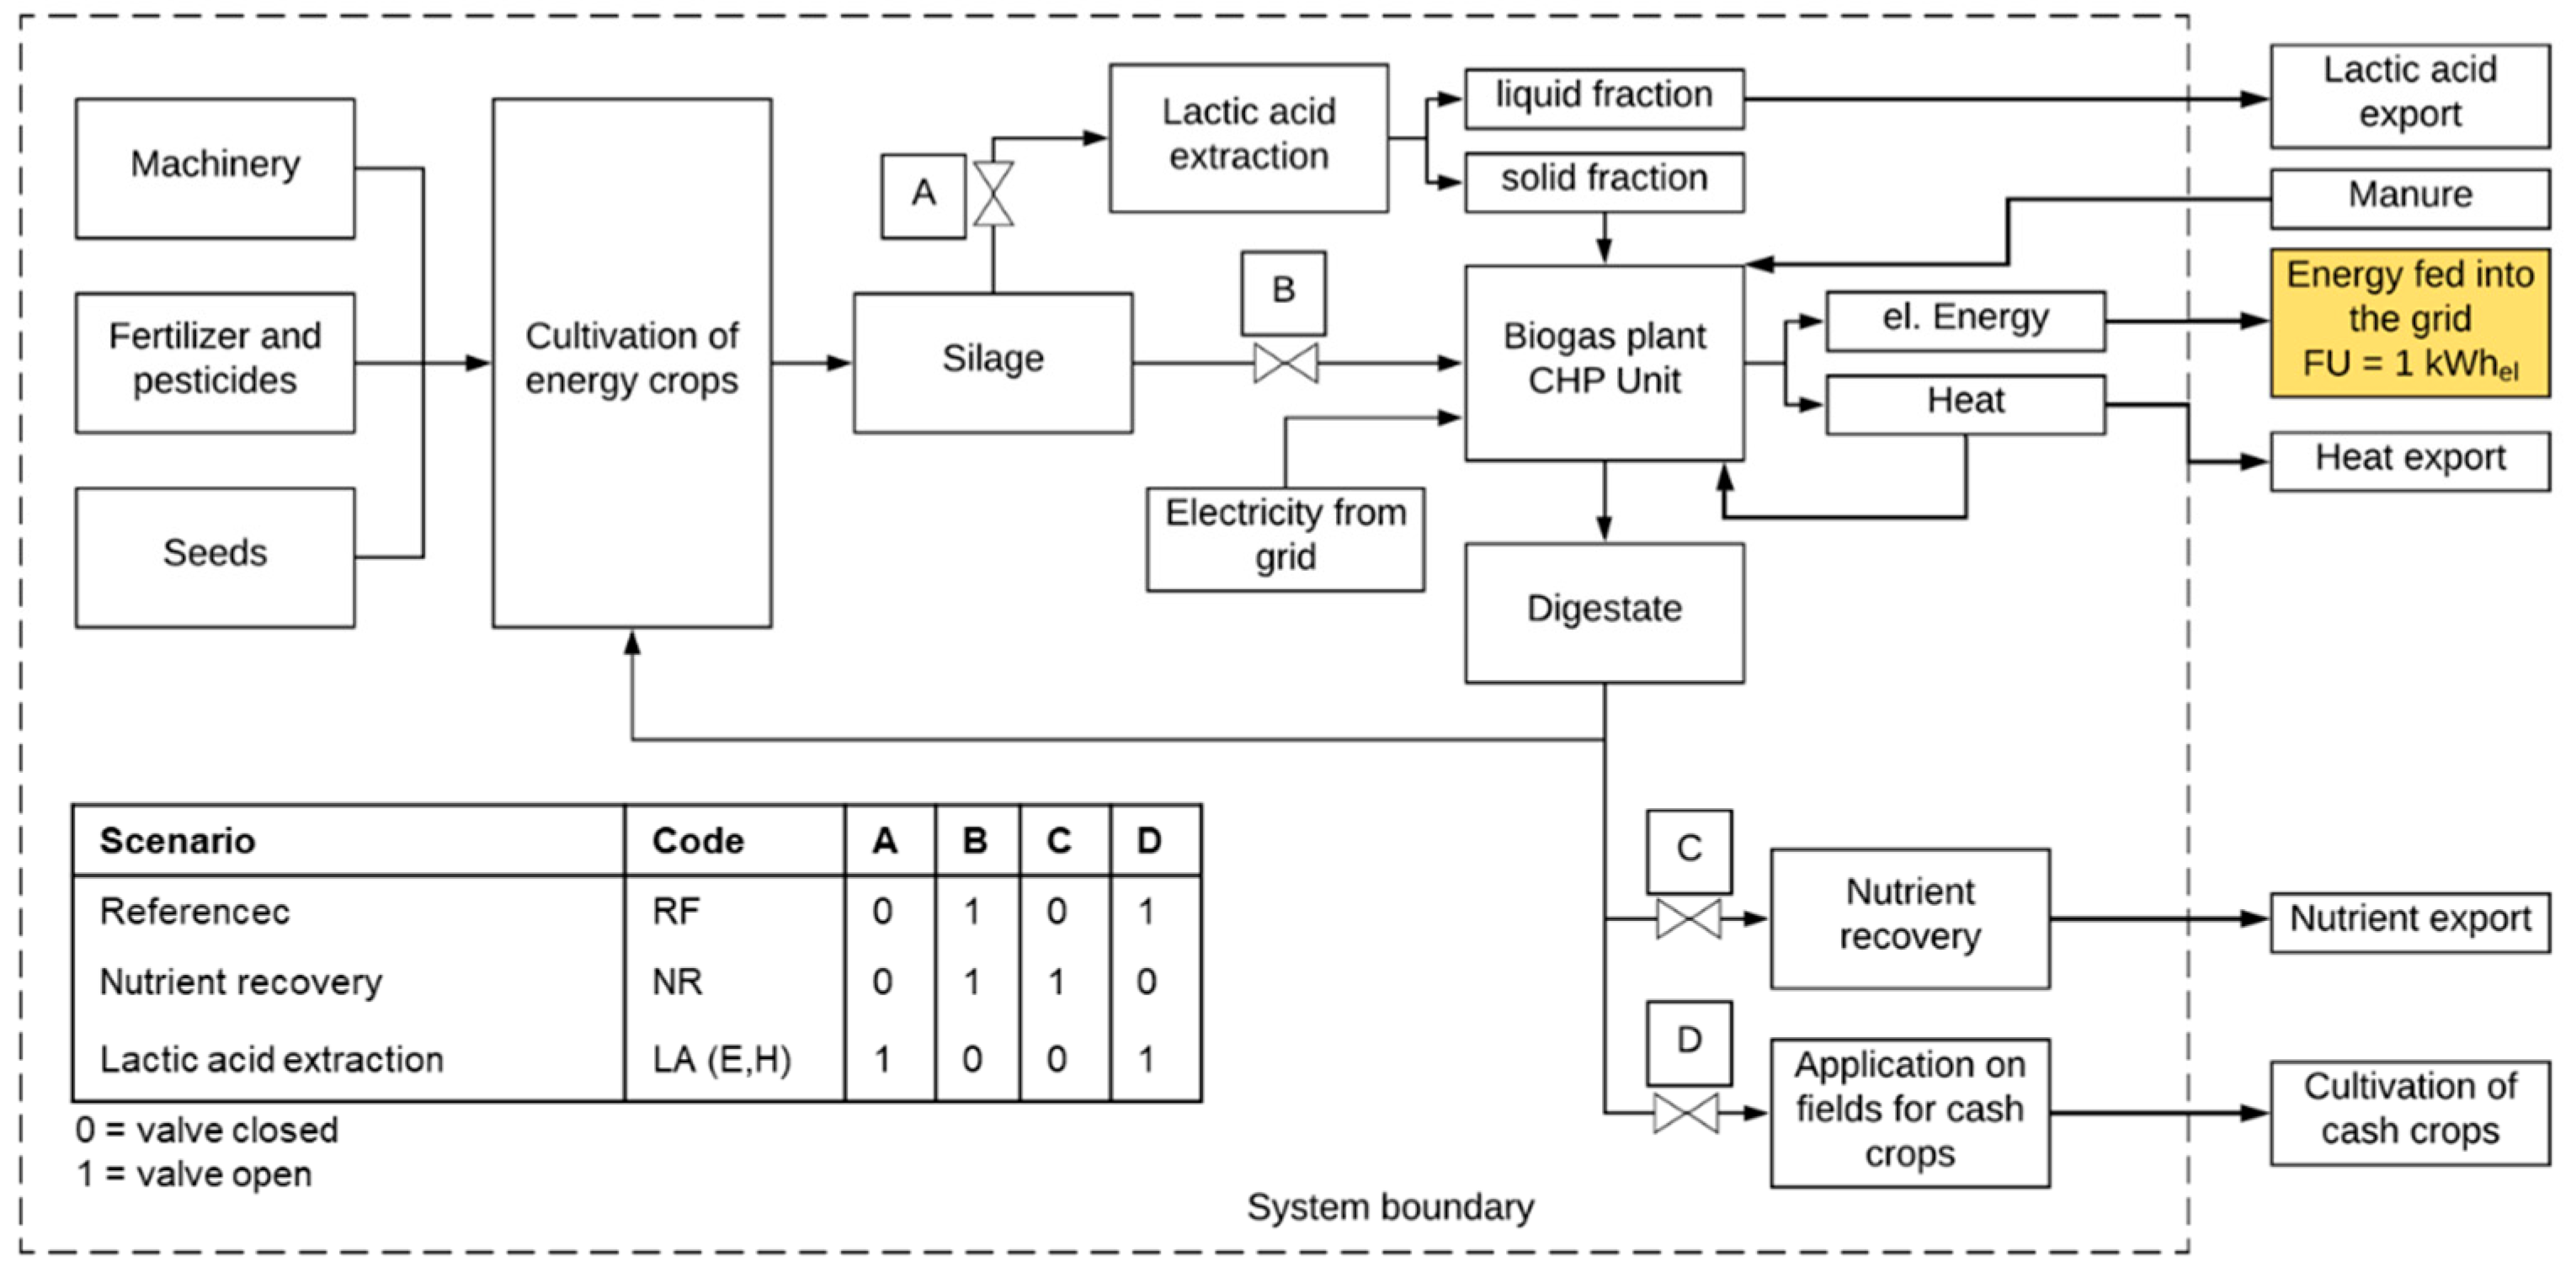
In the present study, a bio-refinery concept was analyzed where the biogas process chain has been extended by: (i) the extraction of plant nutrients such as nitrogen (N) and phosphorus (P) from the digestate and (ii) by extracting lactic acid from the silage before anaerobic fermentation.
The aim of this work was to assess the environmental impacts of the nutrient recovery from biogas digestate and of the lactic acid extraction from silages used for biogas production. Furthermore, the aim was to show if these novel technologies can be integrated in the biogas production process chain in an environmentally sustainable way. Before practical implementation, it is essential to know the expectable environmental impacts of these novel processes in order to address the current challenges of nutrient surpluses and declining income quotas within the biogas sector in Germany.
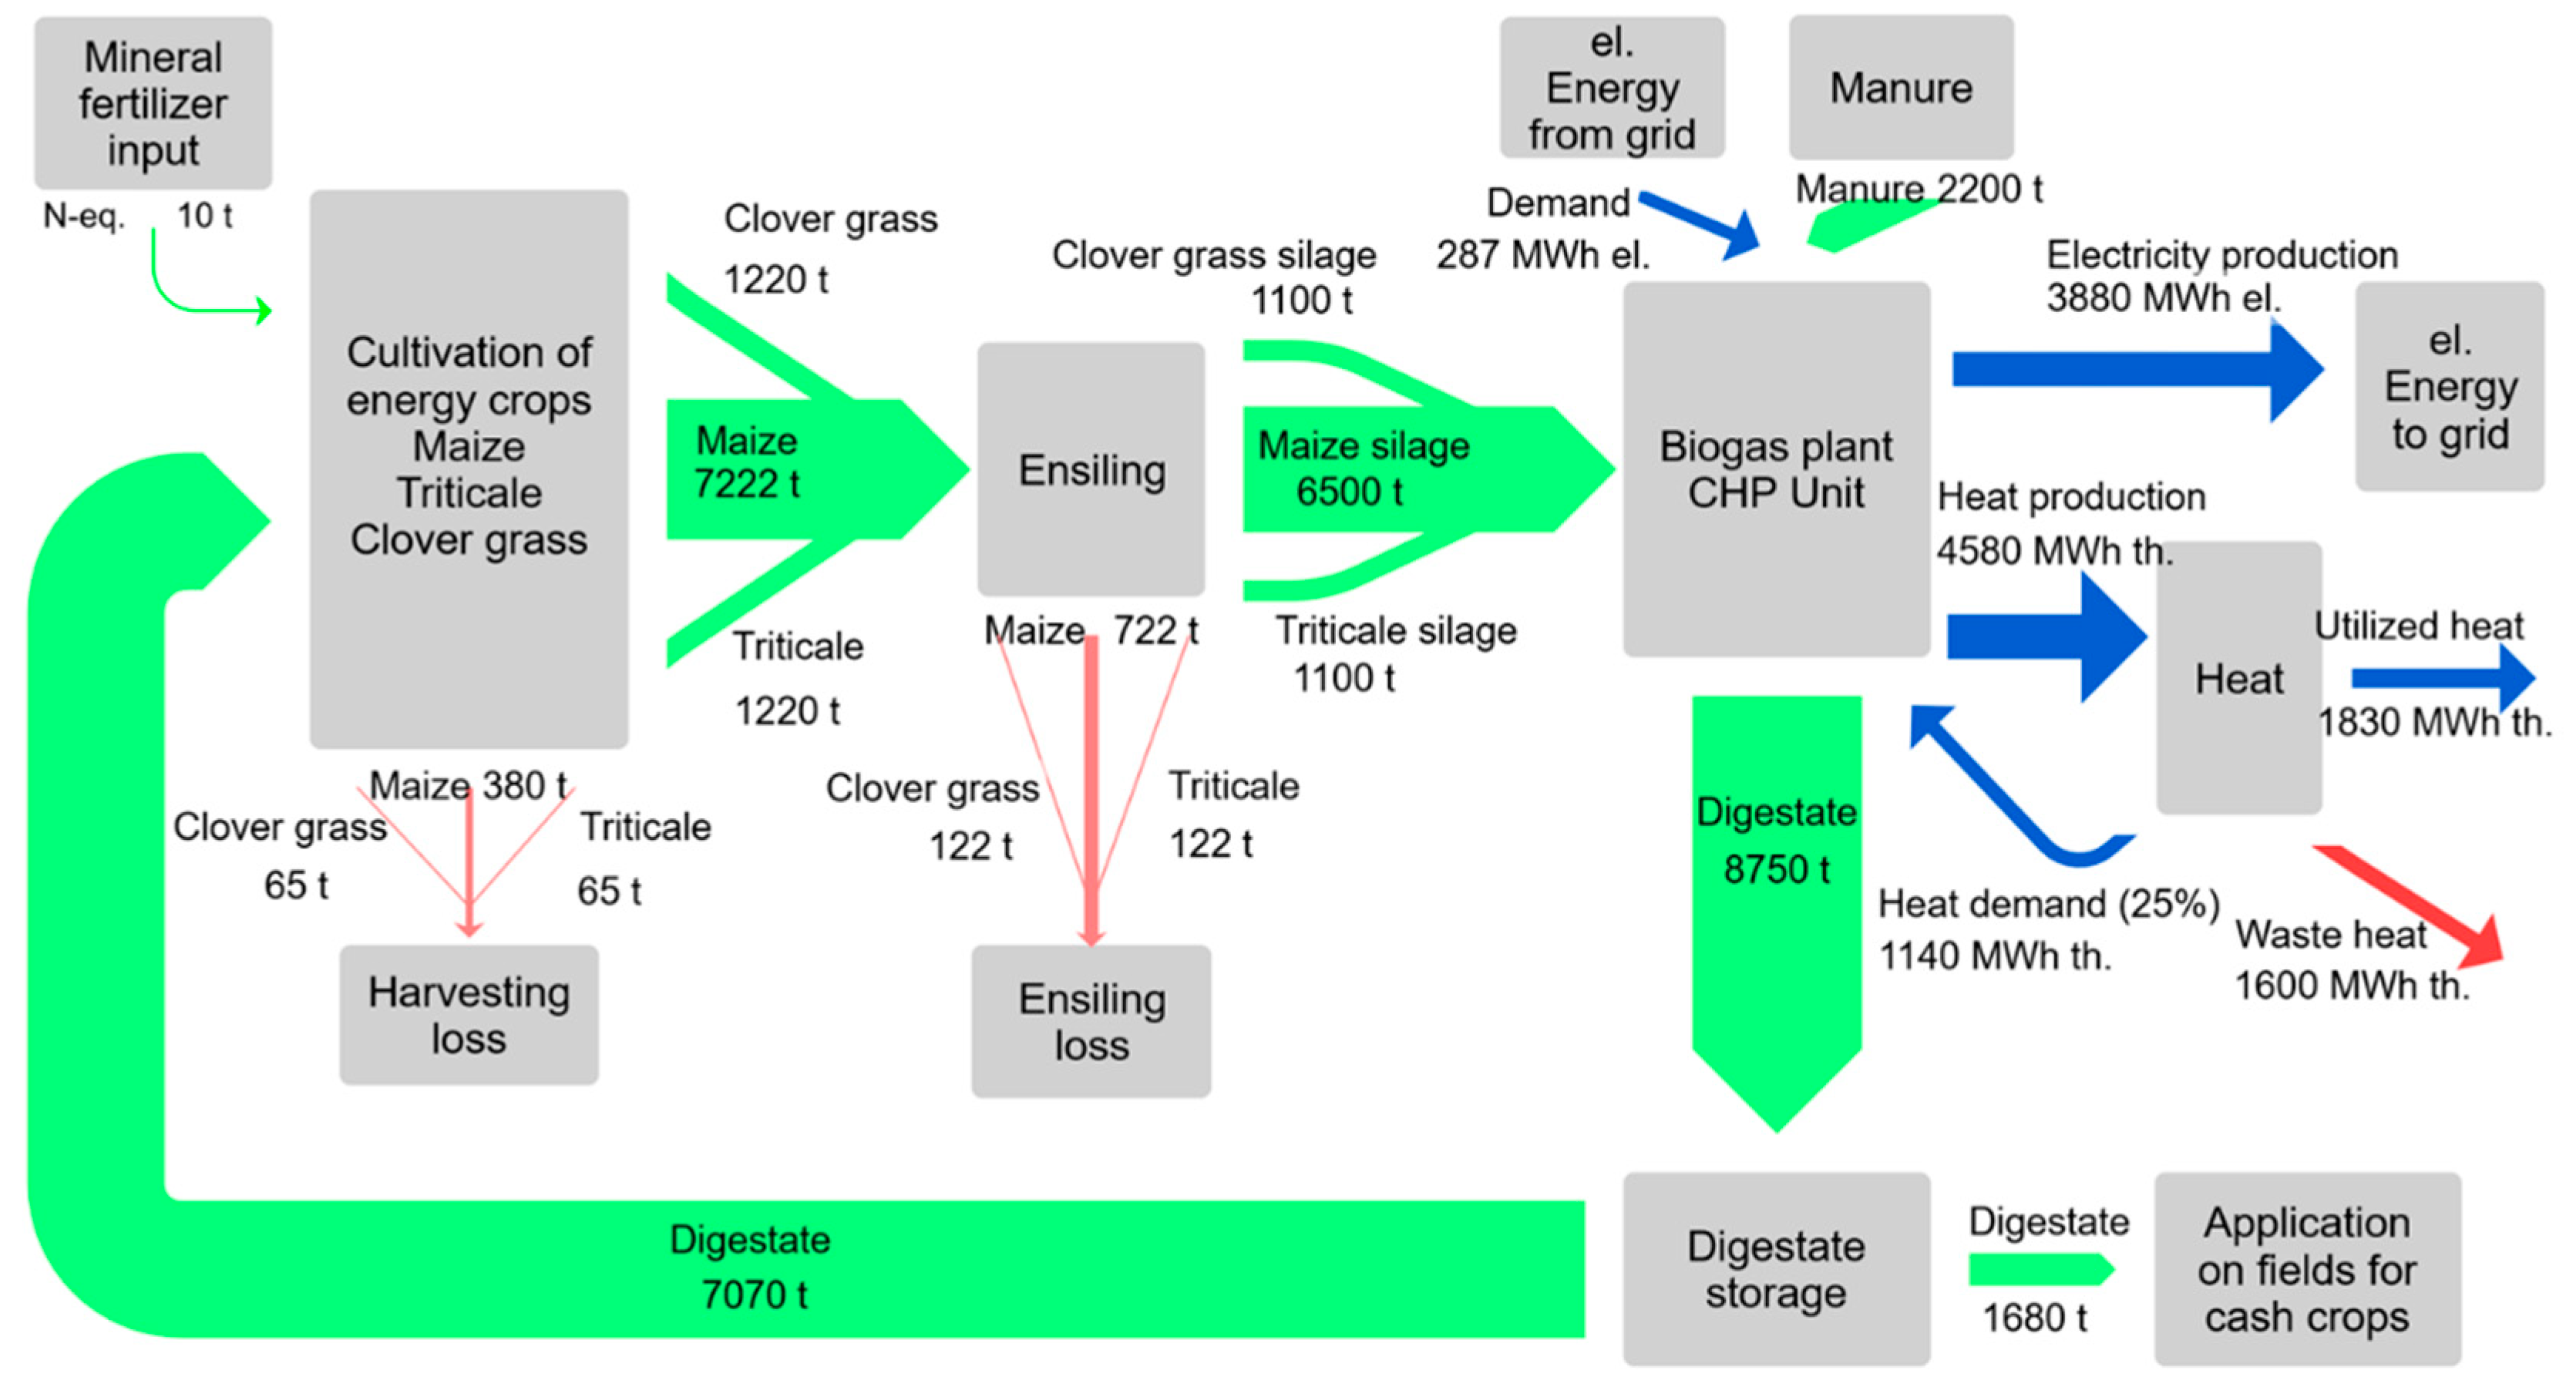
Therefore, a model of a biogas production system in Germany was set up and supplemented by the novel processes. Since the aim of the study was to provide assessments for the biogas sector in Germany in general, the model was based on averaged conditions for biogas production in the country. Therefore, common parameters of biogas plants in Germany regarding the installed power, the share of maize, triticale, grass and manure in the feedstock substrate were selected. This also included farming equipment, crop yields and farm-yard distance. Additionally, energy concepts relating to electricity feed-in to the grid and the proportion of heat utilization were selected according to current practice, which reflects the requirements of the federal legislation. To ensure practical feasibility of the averaged model, dimensions and operational parameters of the biogas plant were calculated and counterchecked with real conditions. This aspect also includes the digestibility of the chemical composition of the substrate mixture used.

2. Materials and Methods

2.1. Scope and Goal Definition

The purpose of the nutrient recovery (NR) process, assessed in the present study is to provide a solution along the biogas process chain to solve the issue of nutrient surplus in biogas regions in Germany. The purpose of the lactic acid extraction (LA) from feedstock silages is to provide additional sources of income for biogas plant operators considering the decreasing feed-in tariffs for electricity from biogas in Germany. The environmental impacts of the technologies investigated were determined in relation to a reference biogas system (Figure 1), which represents the common state of the art in Germany. Furthermore, the technologies were compared in order to investigate the benefits of the alternatives.
Modelling in the present study was based on the standards DIN ISO 14040 [20] and DIN ISO 14044 [21]. Data was collected from the literature, user manuals of installed equipment and own measurements conducted in the context of the GOBi project. LCA was conducted using software “thinkstep GaBi ts,” (thinkstep, Leinfelden-Echterdingen, Germany) with the integrated database “Professional,” version 8.7 as well as database “Ecoinvent,” version 3.3 (ecoinvent, Zürich, Switzerland).
The system boundaries of the LCA model are shown in Figure 1. The core of the model was a biogas power plant with 500 kWel installed electrical power including a combined heat and power unit (CHP). Feedstock for anaerobic digestion was provided by silage from energy crops and manure. The cultivation of energy crops with corresponding inputs was included in the model. Manure for digestion was considered as waste from livestock farming outside the system boundaries and no credit was given for the environmental pollution avoided. Digestate from biogas production was mainly used inside the system to fertilize the energy crops. However, to meet the specific nutrient requirements of energy crops, additional fertilization with minerals was required for a well-balanced supply. Consequently, there was a surplus of digestate, which was applied to cash crops as a measure of safe disposal. Therefore, the application of digestate and the associated environmental impacts were taken into account, but not the other cultivation processes for the cash crops. In a bio-refinery approach, the reference scenario (RF) was supplemented by a nutrient recovery scenario (NR) and a lactic acid scenario (LA). The corresponding process pathways are indicated in Figure 1 by valve symbols in the material flow. In the nutrient recovery scenario, the surplus of digestate was used for phosphorous and nitrogen recovery for nutrient export. In the lactic acid scenario, the silage was mechanically separated into a liquid fraction for subsequent lactic acid extraction and a solid fraction for digestion in the biogas plant.

2.1.1. Functional Unit

As functional unit (FU), 1 kWh of electrical energy, which is fed to the national grid, was introduced for all scenarios (FU = 1 kWhel).

2.1.2. Consideration of Background Systems

The modelling of background processes was realized based on fully aggregated datasets provided by the databases, described above. The background systems consist of the construction, provision and use of machinery, the production and delivery of seeds to the farm gate, pesticides and fertilizers as well as the production and provision of energy. Furthermore, the disposal of compounds was considered as a background process. According to common practice, infrastructure such as roads and buildings were not considered in the model, as they have only little impact on the systems [22,23,24].

2.1.3. Allocation

The major product of the biogas plant is electricity derived from biogas. However, within the scenarios of the present study additional valuable products are generated. Extracted lactic acid and recovered plant nutrients are considered valuable byproducts. The environmental impacts of the scenarios must be distributed across all valuable products in order to avoid a distortion of the environmental impacts and the conceivable benefits between the individual products. Since the valuable products of the present study consisted of a mixture of energy and materials used in non-energetic processes, the environmental impacts for the global warming potential (GWP) were allocated on the basis of assumed retail prices. It was assumed that biogas can be sold at 0.064 €∙kWh−1. Lactic acid was valued at 1 €∙kg−1 considering the low quality of the obtained product. The price for P-salts was assumed to be 0.09 and 0.06 €∙kg−1 for ammonium sulfate, respectively. As Germanys’ rural biogas regions often lack suitable heat utilization concepts, the heat derived from biogas combustion was not considered in the allocation procedure.

2.2. Life Cycle Inventory

2.2.1. Crops and Crop Management

The biogas power plant was operated using 79% energy crops and 21% manure. The plant production was realized as a tripartite crop rotation. Maize silage had a share of 75% of the total energy crop input. Clover grass silage and triticale silage each had a share of 12.5%. The model covers all processes necessary for plant production, plant protection, harvesting and ensiling. Plant specific characteristics such as the specific demand for fertilizers and the nitrogen fixing ability of clover grass were considered. During the harvesting and ensiling processes, losses in the form of fresh matter and dry matter occur. The harvested yield was assumed to be 95% of the fresh biomass in the field. During ensiling, losses of 10% dry matter were assumed. Table 1 displays further assumptions concerning biogas production from energy crops and manure.
Digestate was applied to the fields as fertilizer, either untreated or in the form of recovered nutrients. The nutrient composition of the digestate in terms of total nitrogen (N), phosphate (P2O5) and potassium oxide (K2O) was calculated based on the amount of nutrients in the plants and thus on the nutrient uptake of the plants from the soil. The digestate in the present study contained 5.7 kg∙t−1 N, 3.02 kg∙t−1 P2O5 and 8.15 kg∙t−1 K2O on wet basis (w.b.). Additional mineral fertilizers were applied to ensure a well-balanced nutrient supply of the crops.
The total demand of nutrients and the applied amounts of digestate are shown in Table 2. For clover grass, it was assumed that no additional mineral fertilizer would be applied if enough digestate is available. Furthermore, the nitrogen fixation ability of clover grass was considered to be 128 kg∙ha−1 N, which corresponds with a legume share of around 30% [27].

2.2.2. Ensiling Process

The ensiling process was modelled based on the parameters shown in Table 3. Values for silo dimensions and cover foils are based on common agricultural practice. A weekly substrate removal rate of at least 2 m silo length is required to avoid quality losses at the cutting surface. The silo filling height depends on the targeted removal rate. The ensiling rate depends on the fresh material supply in the silo during harvest and the compaction speed. A slow compaction with a sufficient compaction weight is essential for a safe ensiling process. Selected parameters affect the LCA results in multiple ways. The dimensions of the silos determine the need for ensiling foil made of polymers with certain attributes in terms of durability, strength and density, which affect the demand for raw materials and primary energy. Furthermore, driving speed during compaction and the compaction weight determine the demand of diesel during the ensiling process.

2.2.3. Manure

It was assumed that the manure for digestion is a waste flow, which derives from livestock farming outside the system boundary. According to the current practice in Germany, the manure is stored on-farm in tanks without gas-tight seals. It was further assumed that the manure is delivered continuously to the biogas plant based on supply contracts. Assumptions for manure properties are shown in Table 1.

2.2.4. Biogas Plant

The electrical and thermal efficiency of the modeled 500 kW CHP of the biogas plant were 39% and 46%, respectively. To ensure practical feasibility and relevance of the model, dimensions and operational parameters of the biogas plant were parametrized and calculated according to the current state of the art. Operational parameters are displayed in Table 4.

2.2.5. Reference Scenario

Mass and energy flows of the reference scenario are shown in Figure 2. The major mass flow was a largely closed material cycle where 9660 t of energy crops were ensilaged and then digested in the biogas plant together with 2200 t of manure as a co-substrate. After storage, 7070 t of digestate were returned as fertilizer to the energy crops and a surplus of 1.680 t was applied on cash crops. A total of 3880 MWhel of the generated electricity was fed to the public grid, whereby 287 MWhel was imported as auxiliary energy for the biogas plant. A total of 4580 MWhth heat was generated, whereof 40% could be exported as useful energy and another 25% was used internally to heat the digester.

2.2.6. Nutrient Recovery Scenario (NR)

For nutrient recovery, the digestate was mechanically separated into a liquid and solid phase by a screw press. The liquid phase was further filtered by an edge gap filter and a microfiltration stage at a maximal flow rate of 200 L∙h−1, Figure 3.
By adding sodium hydroxide (NaOH), phosphorous is precipitated in the form of solid salts and dried using a superheated steam dryer (SHS). The ammonia rich condensate of the drying process is mixed with sulfuric acid (H2SO4) to recover nitrogen in the form of ammonium sulfate ((NH4)2SO4). The effluent of the nutrient recovery process contains potassium. Since the recovery of potassium is technically not feasible using the applied technique, it was considered that the potassium rich wastewater of the process can be used to irrigate fields close to the biogas plant. All data used for modelling was obtained from the GOBi project [8] (Table 5).
Mass and energy flows of the nutrient recovery scenario are presented in Figure 4. Mass flow of the energy crops and manure towards the biogas plant was the same as in the reference scenario. Therefore, the energy production from biogas remained unchanged. In contrast to the reference scenario, a surplus of 1880 t digestate was used to recover 1 t phosphorous salts and 25 t ammonium sulfate. By using 1990 MWhth for the nutrient recovery process, the total heat of 4580 MWhth could be utilized completely.
Although there was a net surplus of nutrients, an additional 10 t N of mineral fertilizer was still needed for energy crop production because N was recovered in the form of ammonium sulfate and only 1 t can be used due to the limited respective plant tolerance.

2.2.7. Lactic Acid Scenario (LA)

In the lactic acid scenario, the entire silage consisting of maize and clover grass was mechanically separated by a screw press and only the solid fraction was used as feedstock for anaerobic fermentation. Since no data was available on the technical feasibility of triticale, the crop cultivation was changed to a bipartite crop rotation system with maize and clover grass alone. The liquid fraction was used to extract lactic acid, which could be performed either by bipolar electrode dialysis (LAE) or by applying chemicals (LAH). In this case, hydrochloric acid (HCl) was used, as shown in Figure 5.
Both techniques differed in energy demand and the consumption of HCl. Data used for modelling and evaluation was obtained from the GOBi research project [8] and is displayed in Table 6. In total, LAE consumed 50 kWh electrical energy per ton of press juice, while LAH uses 30 kWh∙t−1 and an additional 20 L of HCl.
Mass and energy flows of the lactic acid scenario are presented in Figure 6. From 8800 t silage consisting of maize and clover grass, 4800 t of the liquid fraction could be separated, finally resulting in 111 t of lactic acid. For the extraction by bipolar electrode dialysis, 209 MWhel electricity were required and 105 MWhel by using 99 t of HCl. The mechanical separation of the press sap from the silages lead to a reduced mass flow of 4620 t press cake and 1160 t manure to the biogas plant and hence to a reduced energy production of 2760 MWhel and 3260 MWhth. Biogas generation was adapted to the lower water content of the press cake compared to the untreated silage. The maximum organic loading rate (OLR) of the digester was reduced to 2 kg oDM∙m−3∙d−1 to avoid overloading of the biogas process. Accordingly, the power of the installed CHP was reduced from 500 to 160 kW. The reduced amount of digestate was taken into account by increasing the mineral fertilizer application to meet the actual crop requirements.

2.2.8. Summary of the Key Values of the Scenarios

In order to show the differences within the inputs and outputs between the scenarios the relevant key values are compiled in Table 7.

2.2.9. Gaseous Emissions and Nutrient Leaching

Nutrient emission and leaching rates were considered based on previously published data and experience from practical applications, which is widely accepted and used frequently for LCA studies. Since the study represented an average biogas plant in Germany, no site-specific calculation of emissions and leaching rates was conducted.
Diffuse emissions of methane from the biogas plant as well as unburnt methane derived from the CHP were taken into account at 1% and 0.5% of the totally produced methane, respectively. This comes close to the generalized 2%-approach of Dressler et al. [30] and Lansche and Müller [31].
In addition, the application of fertilizers on fields causes emissions even under the assumption of best agricultural practice, especially in the case of nitrogen fertilizers. Nitrogen losses through leaching (NO3) were estimated at 10% of the applied N. Losses to the air in form of ammonia (NH3) were estimated at 8.75% of the applied N. Additionally, nitrous oxide (N2O) is generated and released during fertilization. According to Brentrup et al. [32] N2O emissions were considered at 1.25% of the applied N. Losses of phosphorous to freshwater in the form of phosphate were taken into account based on the fertilizer’s datasets in the software. Environmental impacts of the calculated emission were considered by the embedded algorithms of the GaBi software.

2.2.10. Credits

Since electricity and heat deriving from biogas can substitute energy from fossil sources, credits were issued for the electricity produced and the heat utilized. Credit for electricity was assessed in relation to the environmental impact of 1 kWhel derived from the standard energy mix of Germany in 2016. For the utilized heat, credit was given according to the guidelines of the Federal Ministry for the Environment, Nature Conservation, Building and Nuclear safety in Germany [33].
A part of the biogas digestate in the reference scenario was used as fertilizer for cash crops on additional external areas. A credit could be given for this amount as it replaces mineral fertilizers. Accordingly, the fertilizing value of the digestate was converted into mineral fertilizer equivalents and taken into account in the study. No credits were granted for the avoided storage of manure since it was assumed that it was delivered continuously to the power plant and that gas-tight covered storage is not yet standard in Germany. Furthermore, no credits were granted for the substitution of synthetic lactic acid since the lactic acid previously obtained from silage consisted of a mixture of l-lactic acid and d-lactic acid and could not replace pure substances. Depending on the composition of the digestate, a part of the nitrogen and phosphorous contained was not required for demand oriented plant fertilization. Recovering this surplus of nutrients created a substitute for mineral fertilizers. Therefore, credits according to the environmental impact of the mineral substitutes were granted according the Ecoinvent database.

2.3. Life Cycle Impact Assessment

Results were classified based on the International Reference Life Cycle Data System (ILCD) method recommendation, provided by the European Commission-Joint Research Centre [34], which has been used in several studies on biogas [35,36].
Results from mass balances were assessed relating to the 100-year global warming potential (GWP) based on data from the IPCC 4th assessment report excluding biogenic CO2 [37]. Assessment of the GWP was selected due to the relevant contribution of the agricultural sector to climate change in the form of gaseous emissions. The emission potential is related to the use of fertilizers, machines and methane emissions from husbandry as well as from biogas production. Furthermore, assessment of the primary energy demand (PED) was necessary due to the high energy demand of the investigated processes and the background systems of the agricultural sector. Furthermore, the eutrophication potential (EP) was assessed due to its high relevance in agricultural processes. PED and EP were evaluated based on the methodology introduced by Struijs et al. [38] and recommended for LCA studies by the European Commission-Joint Research Centre.

3. Results

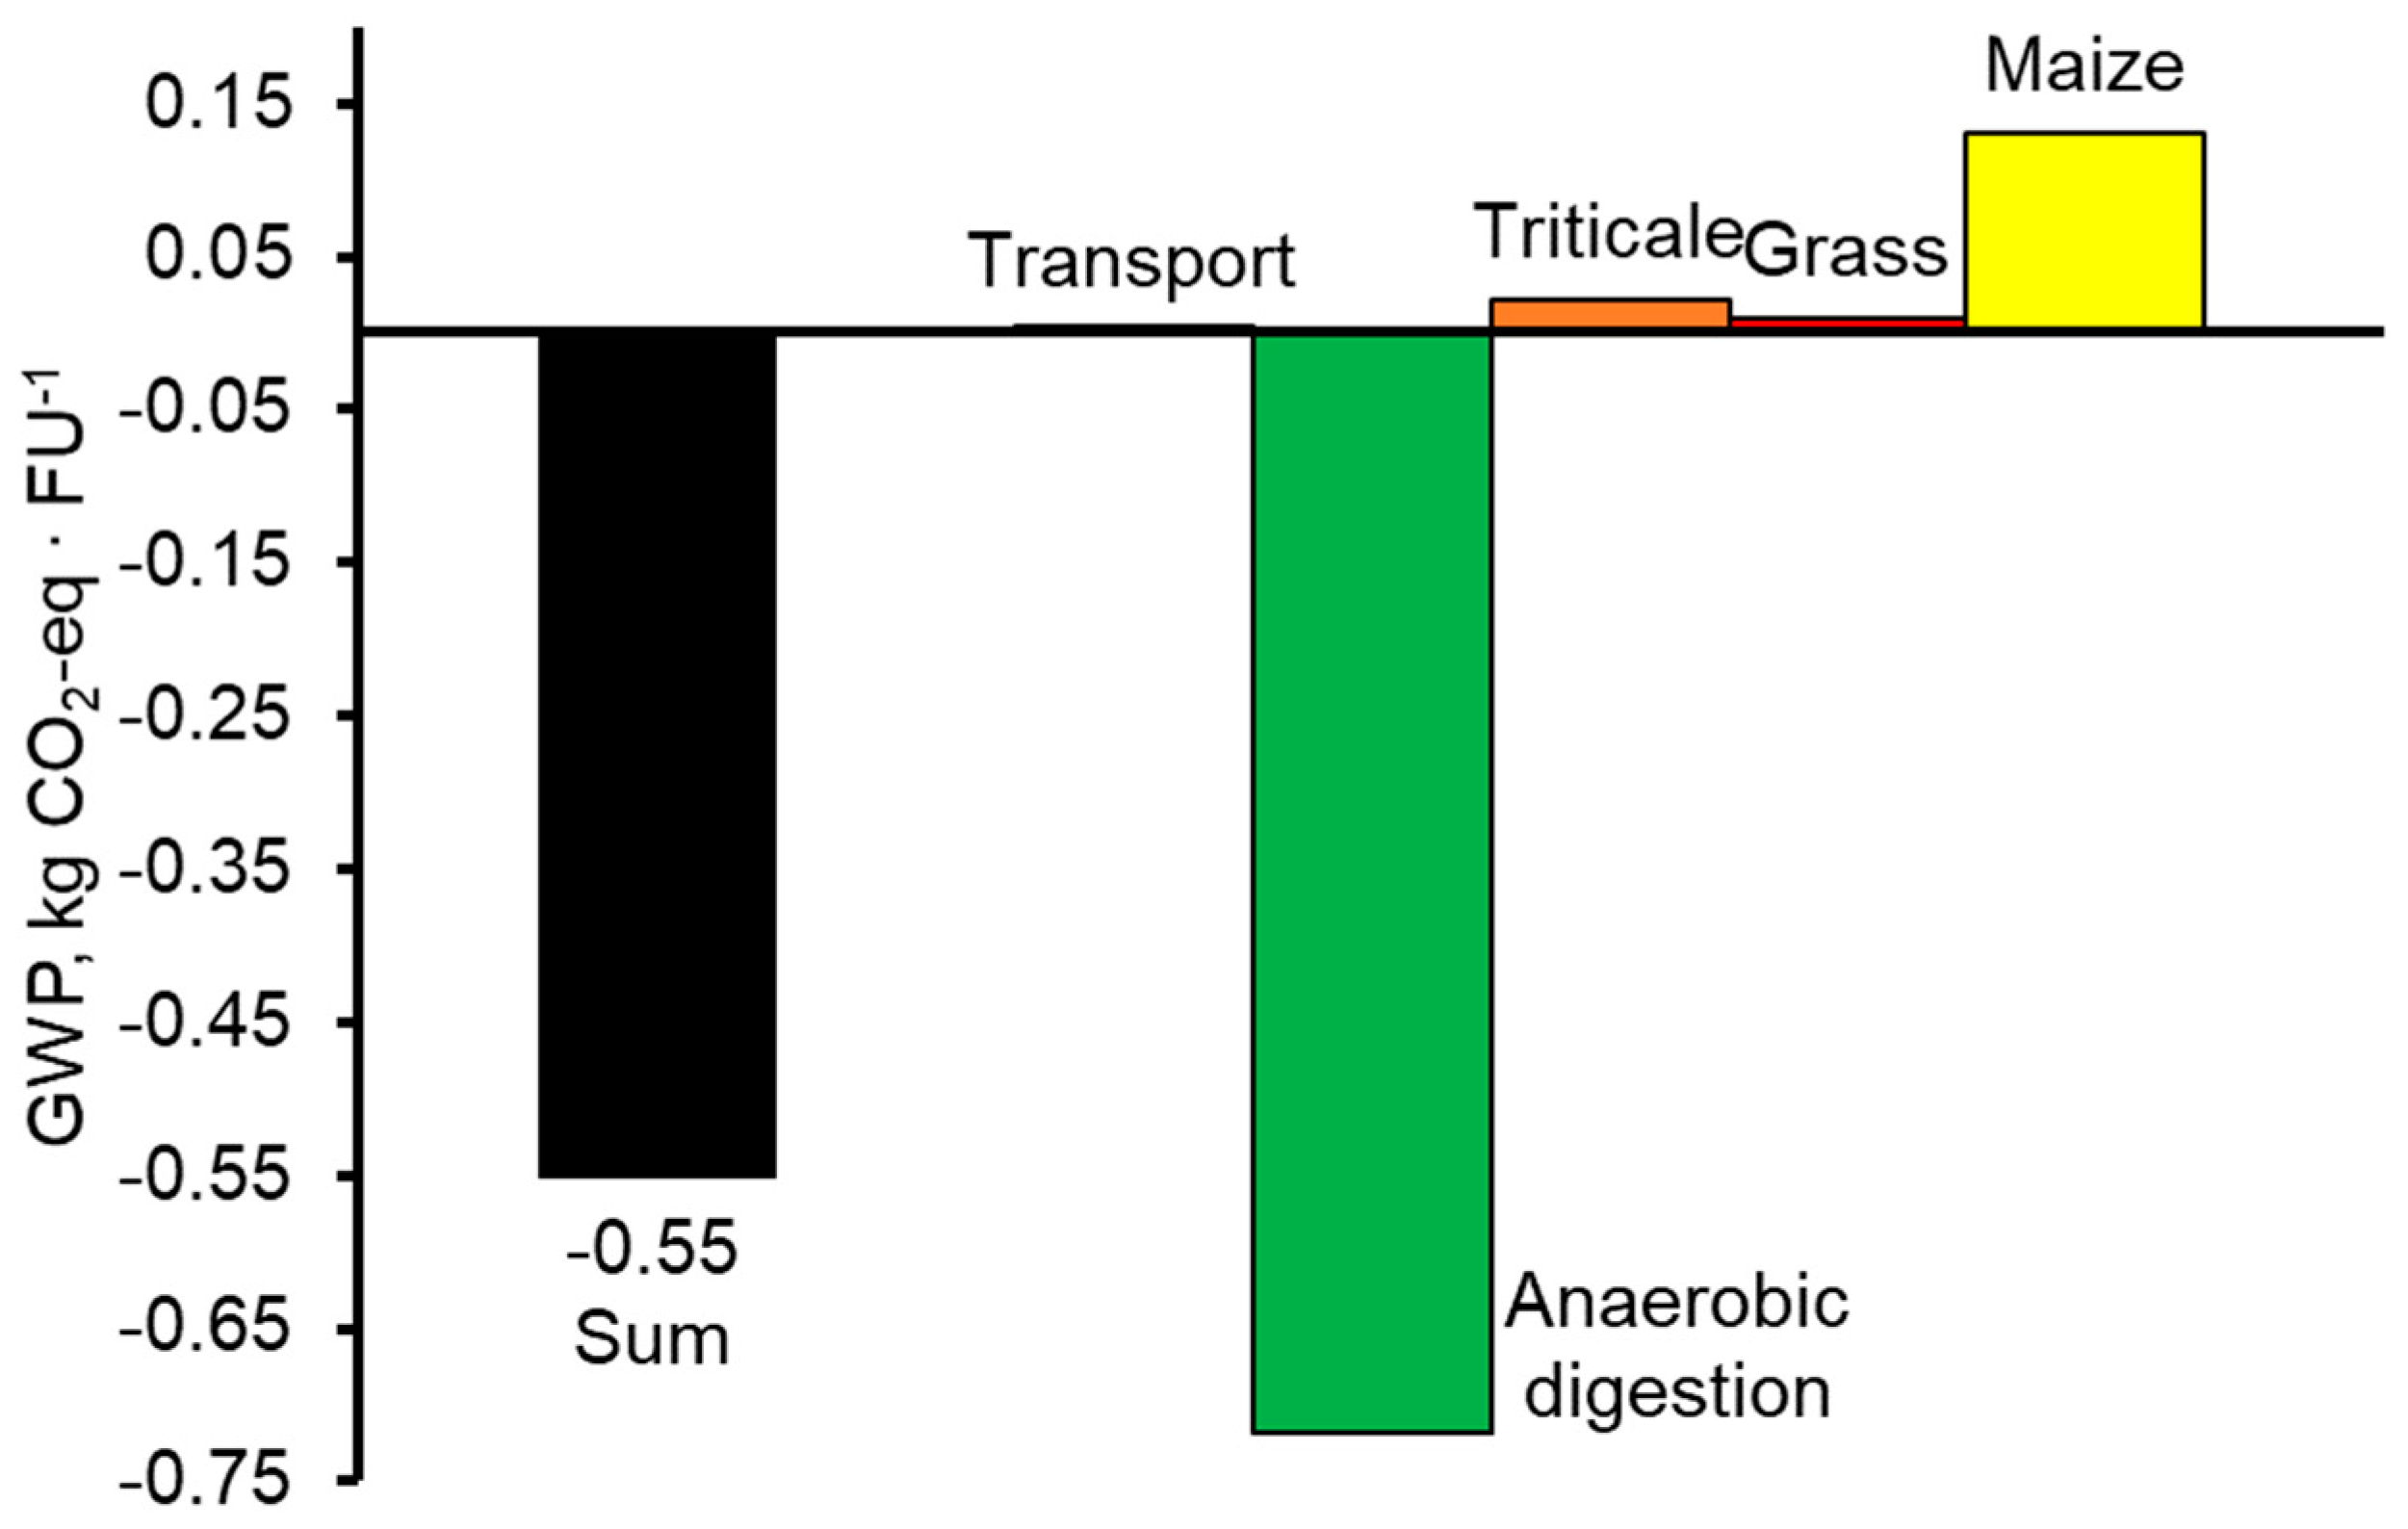
3.1. Reference Scenario

The total GWP of the reference scenario (RF) and the components thereof is presented in Figure 7. Under modelled conditions, the generated electricity from biogas results in a negative GWP of −0.55 kg CO2-eq∙FU−1 when considering the credits for substitution of fossil energy. Negative GWP indicates a net savings of CO2 equivalents.
The energy consumption to operate the biogas plant results in a GWP of 0.047 kg CO2-eq. The substrate supply contributes to the GWP with 0.15 kg CO2-eq. Overall, maize silage contributes the most with 0.13 kg CO2-eq followed by triticale with 0.02 kg CO2-eq and clover grass silage with 0.001 kg CO2-eq. GWP of transportation processes is low with 0.003 kg CO2-eq. The conversion of substrates to biogas and finally to electricity and heat is summarized under the term “anaerobic digestion,” resulting in a GWP of −0.72 kg CO2-eq. The main factors reducing the GWP are credits for the avoided use of fossil fuels and credits for the heat used, totaling −0.95 kg CO2-eq, which are included in “anaerobic digestion.” The main factor that increases the GWP within the anaerobic digestion is the methane slip with 0.23 kg CO2-eq.
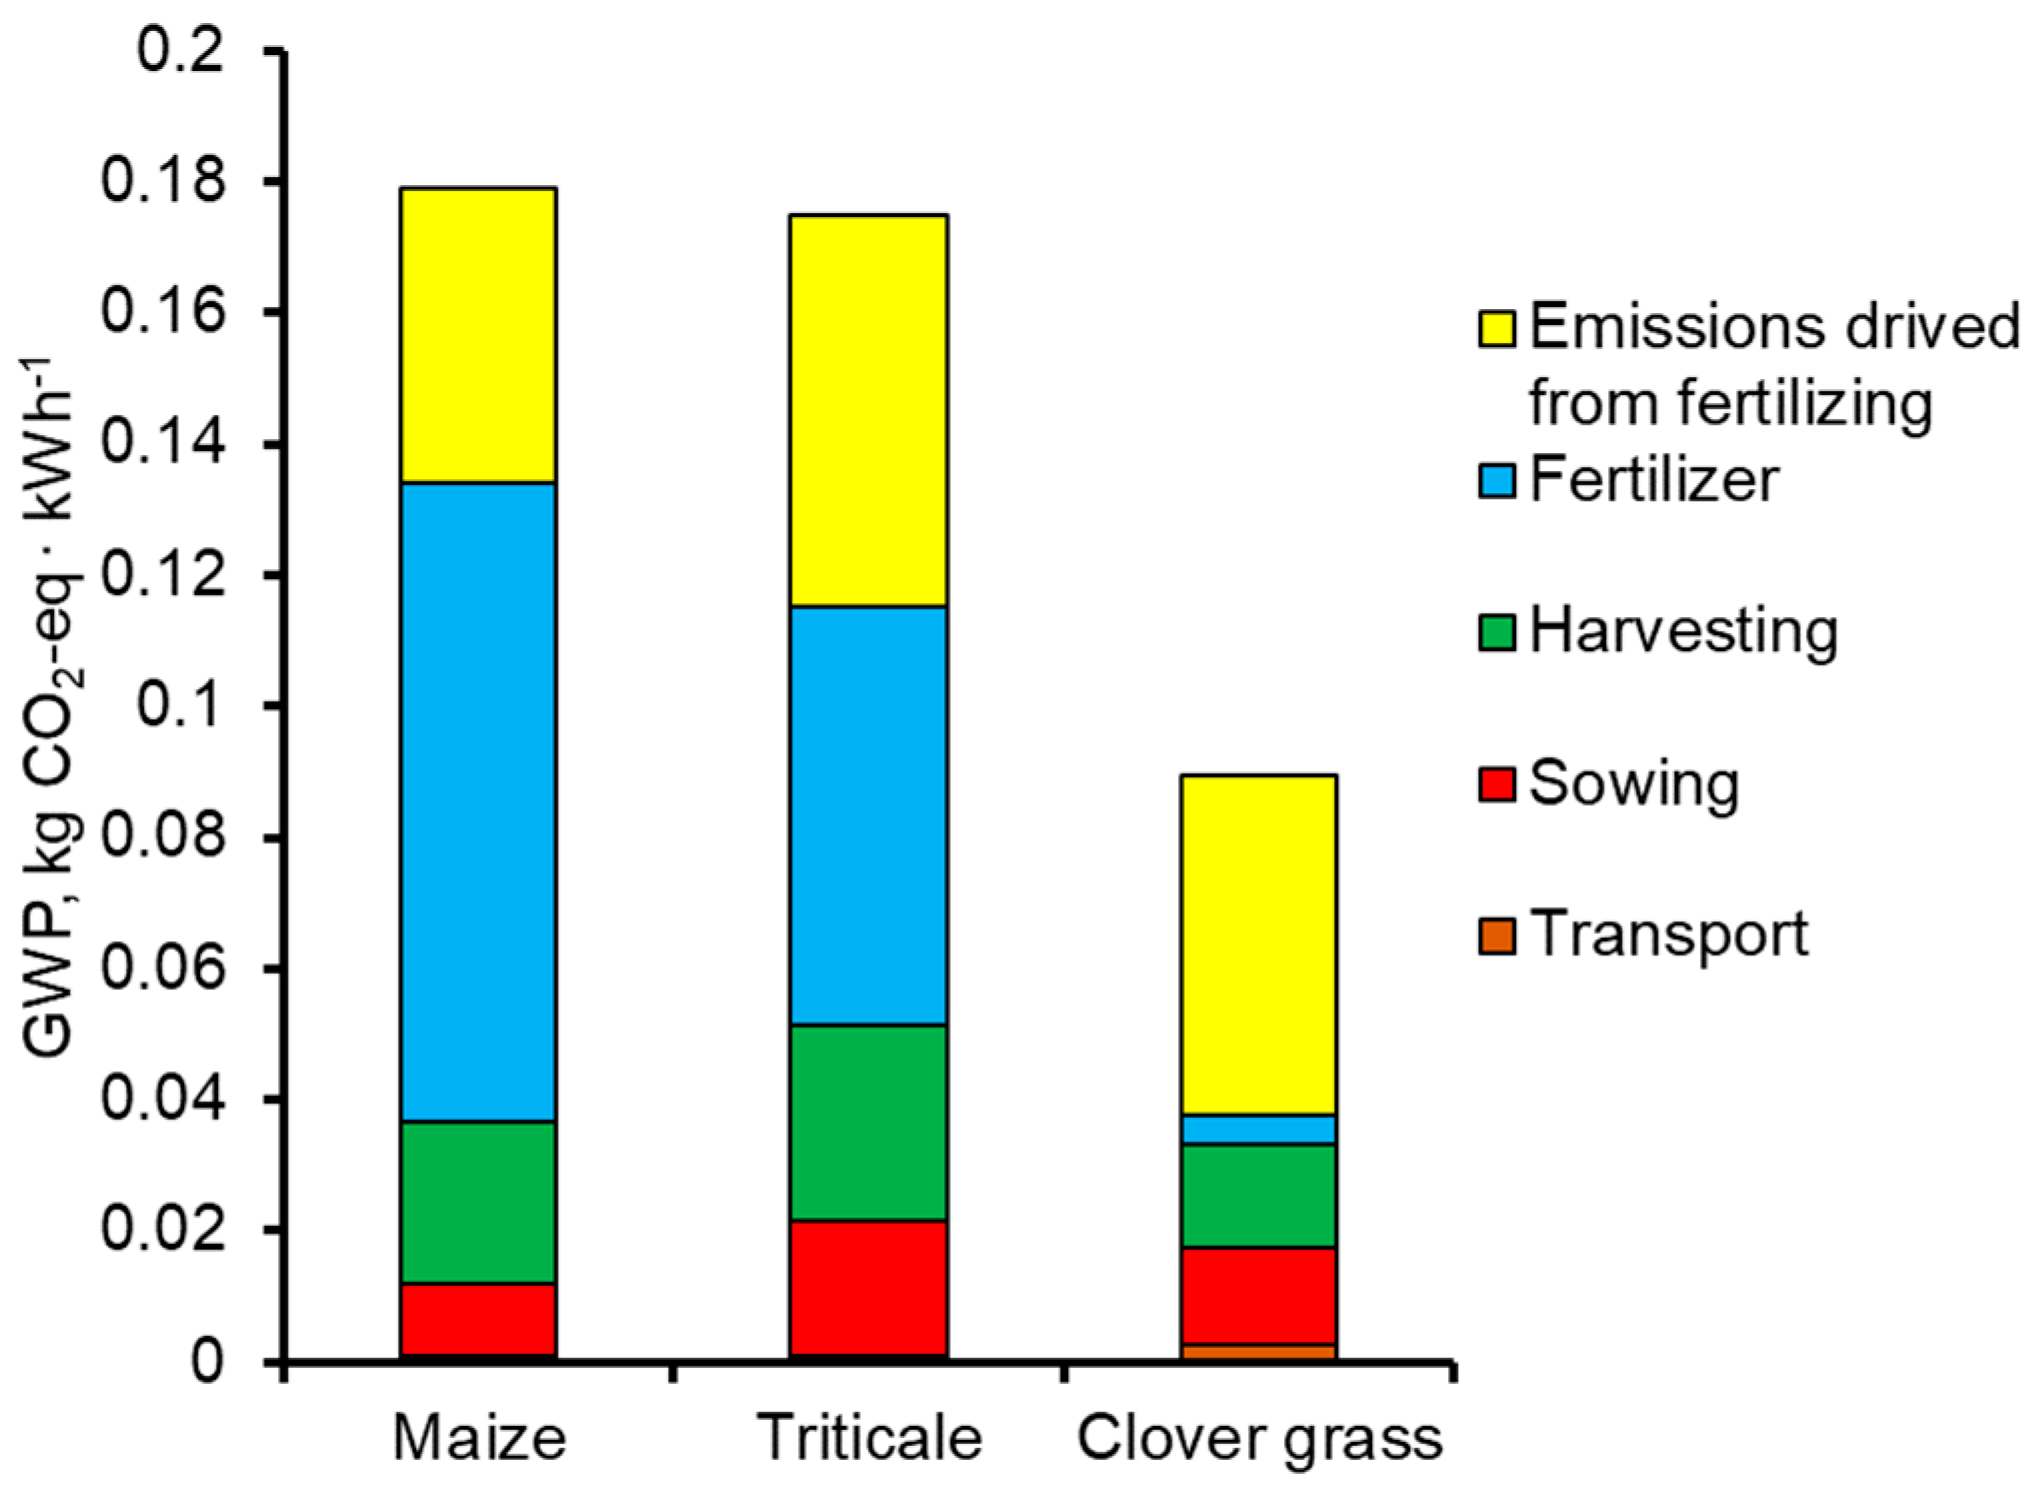
The results for the GWP of the substrates depend on their share in the substrate mix. For a better comparison, the GWP of the different substrates for the sole generation of 1 kWhel is presented in Figure 8.
Results show that the GWP is similar to the energy production from maize with 0.179 kg CO2-eq and triticale with 0.174 kg CO2-eq, while the energy production from clover grass causes a lower GWP with 0.09 kg CO2-eq. The main contributing factor is the application of fertilizers and the resulting emissions. The use of fertilizers in maize has a larger impact on the GWP with 0.1 kg CO2-eq than in triticale with 0.06 kg CO2-eq or clover grass with 0.04 kg CO2-eq. Crop effects like nitrogen-based emissions from fertilization are 0.06 kg CO2-eq in triticale and 0.05 kg CO2-eq in maize and clover grass. Furthermore, sowing and harvesting of the crops lead to minor deviations in the GWP, while the transport processes are negligible.

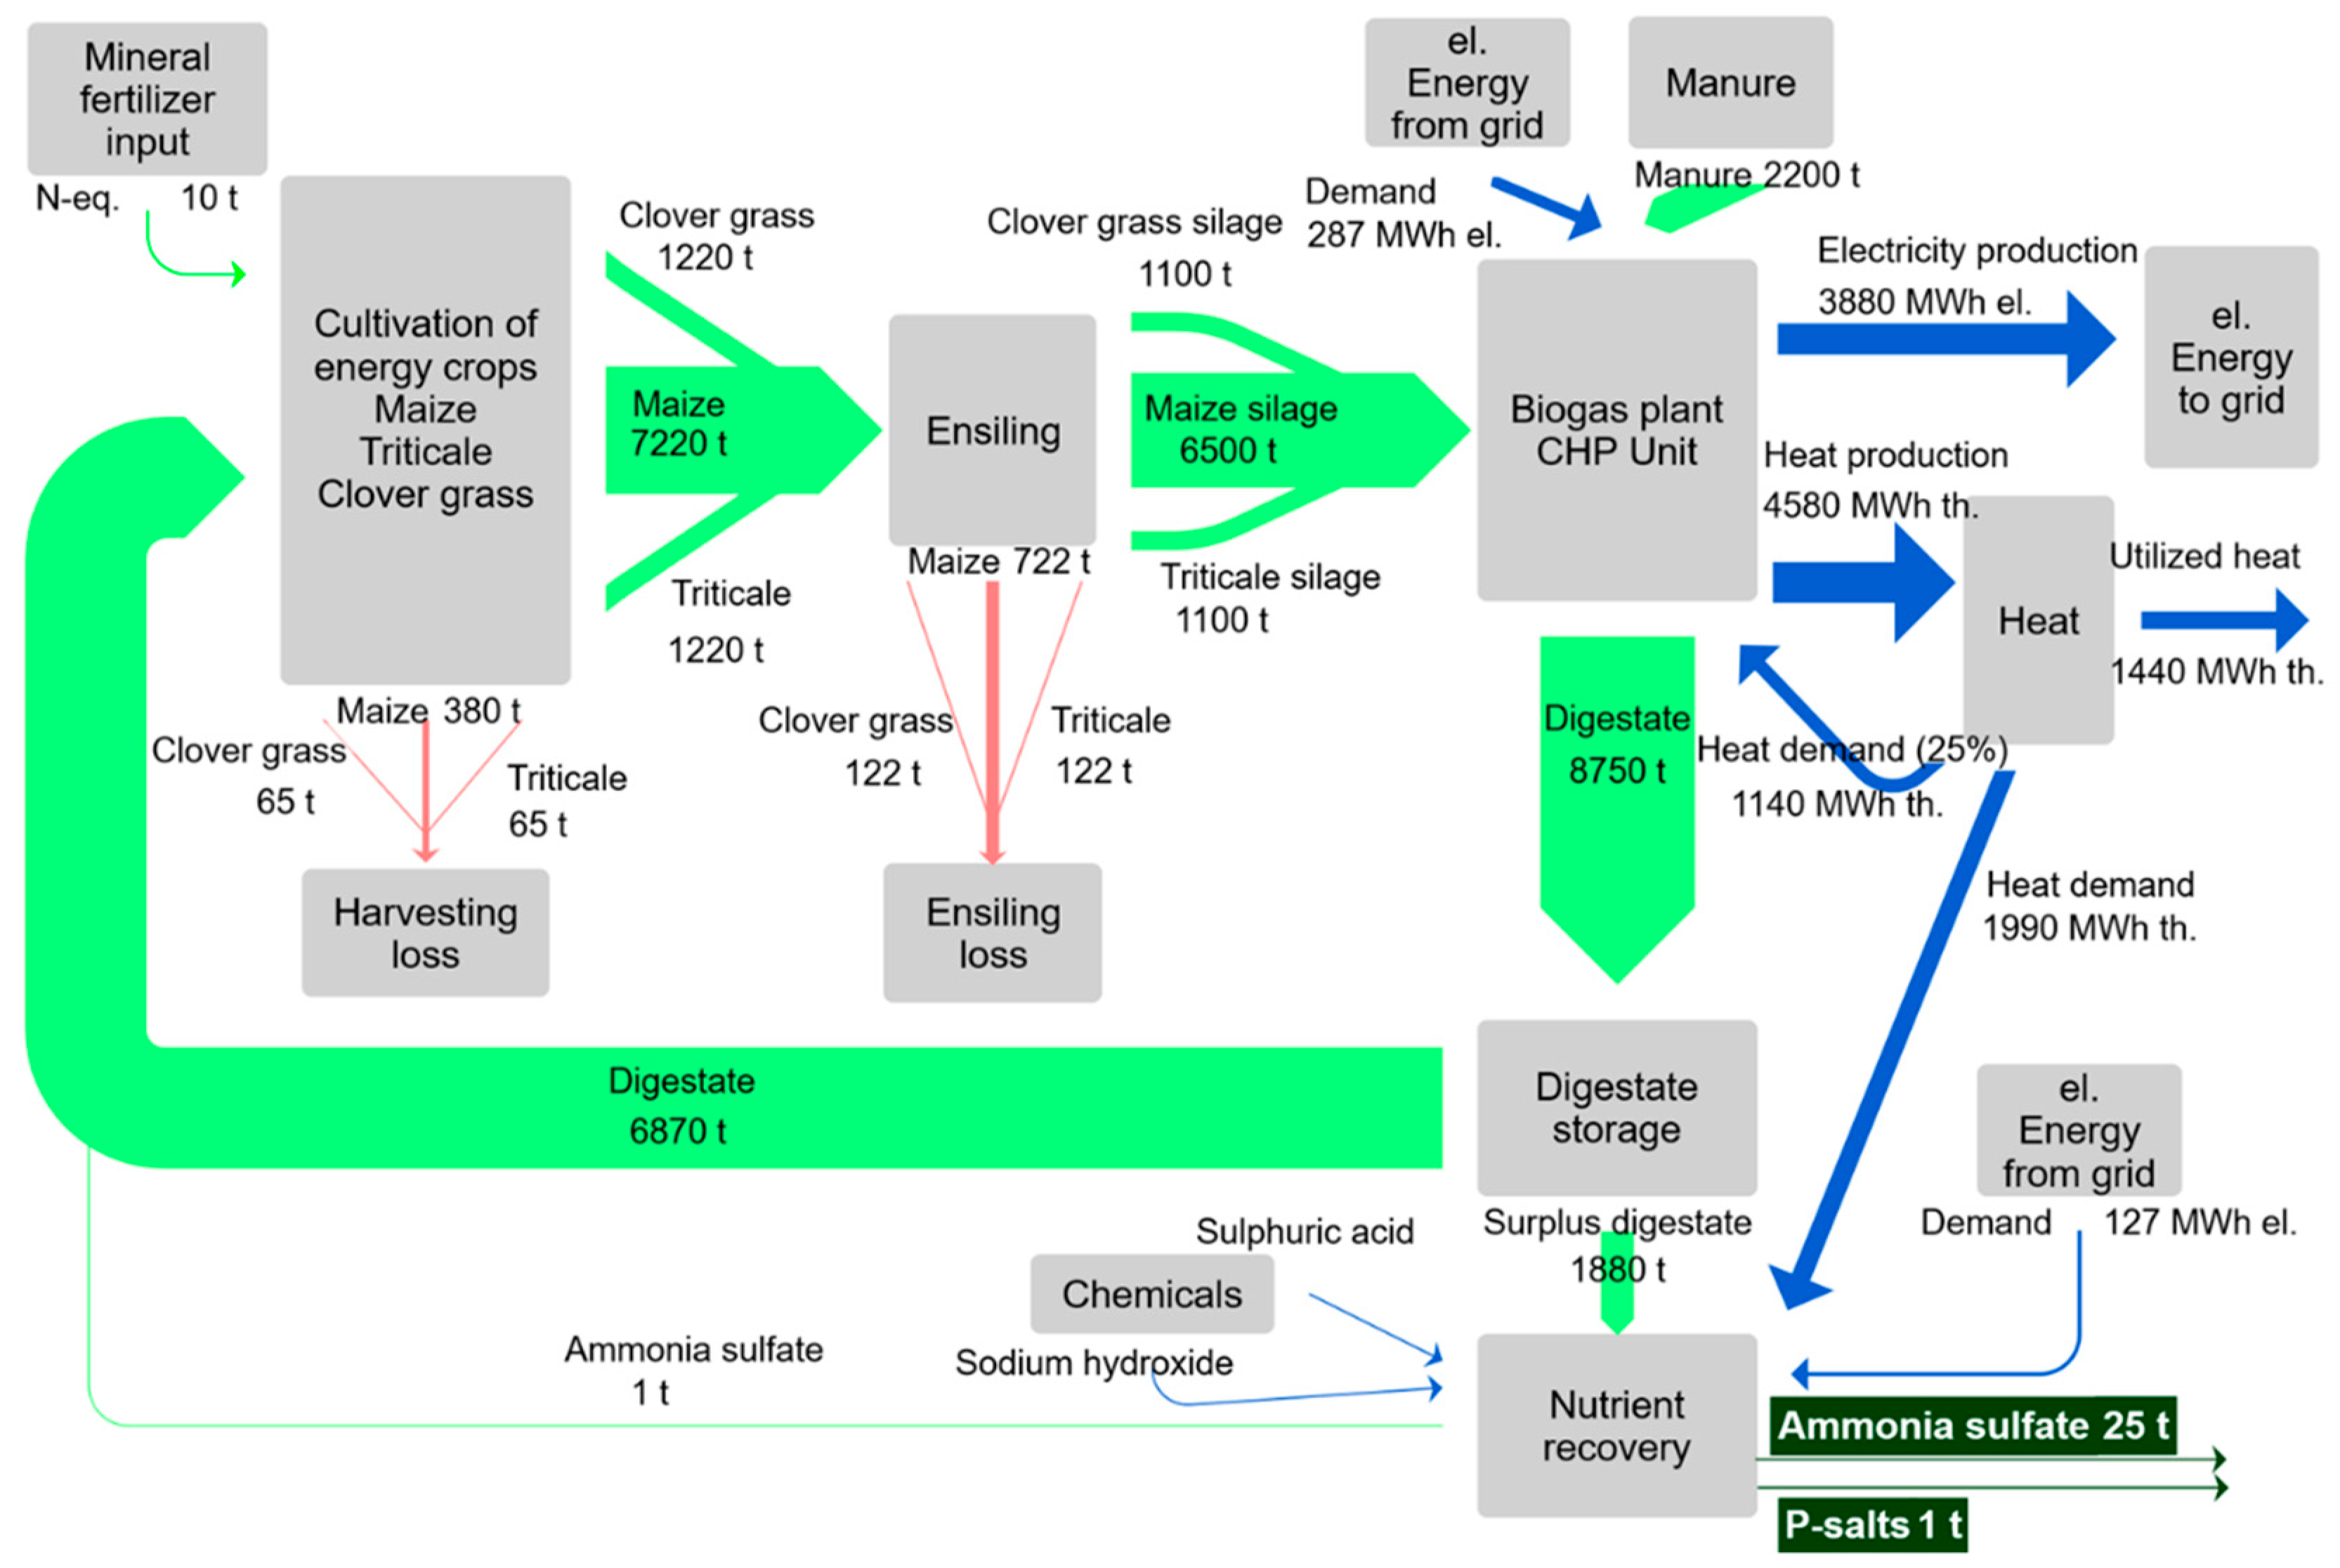
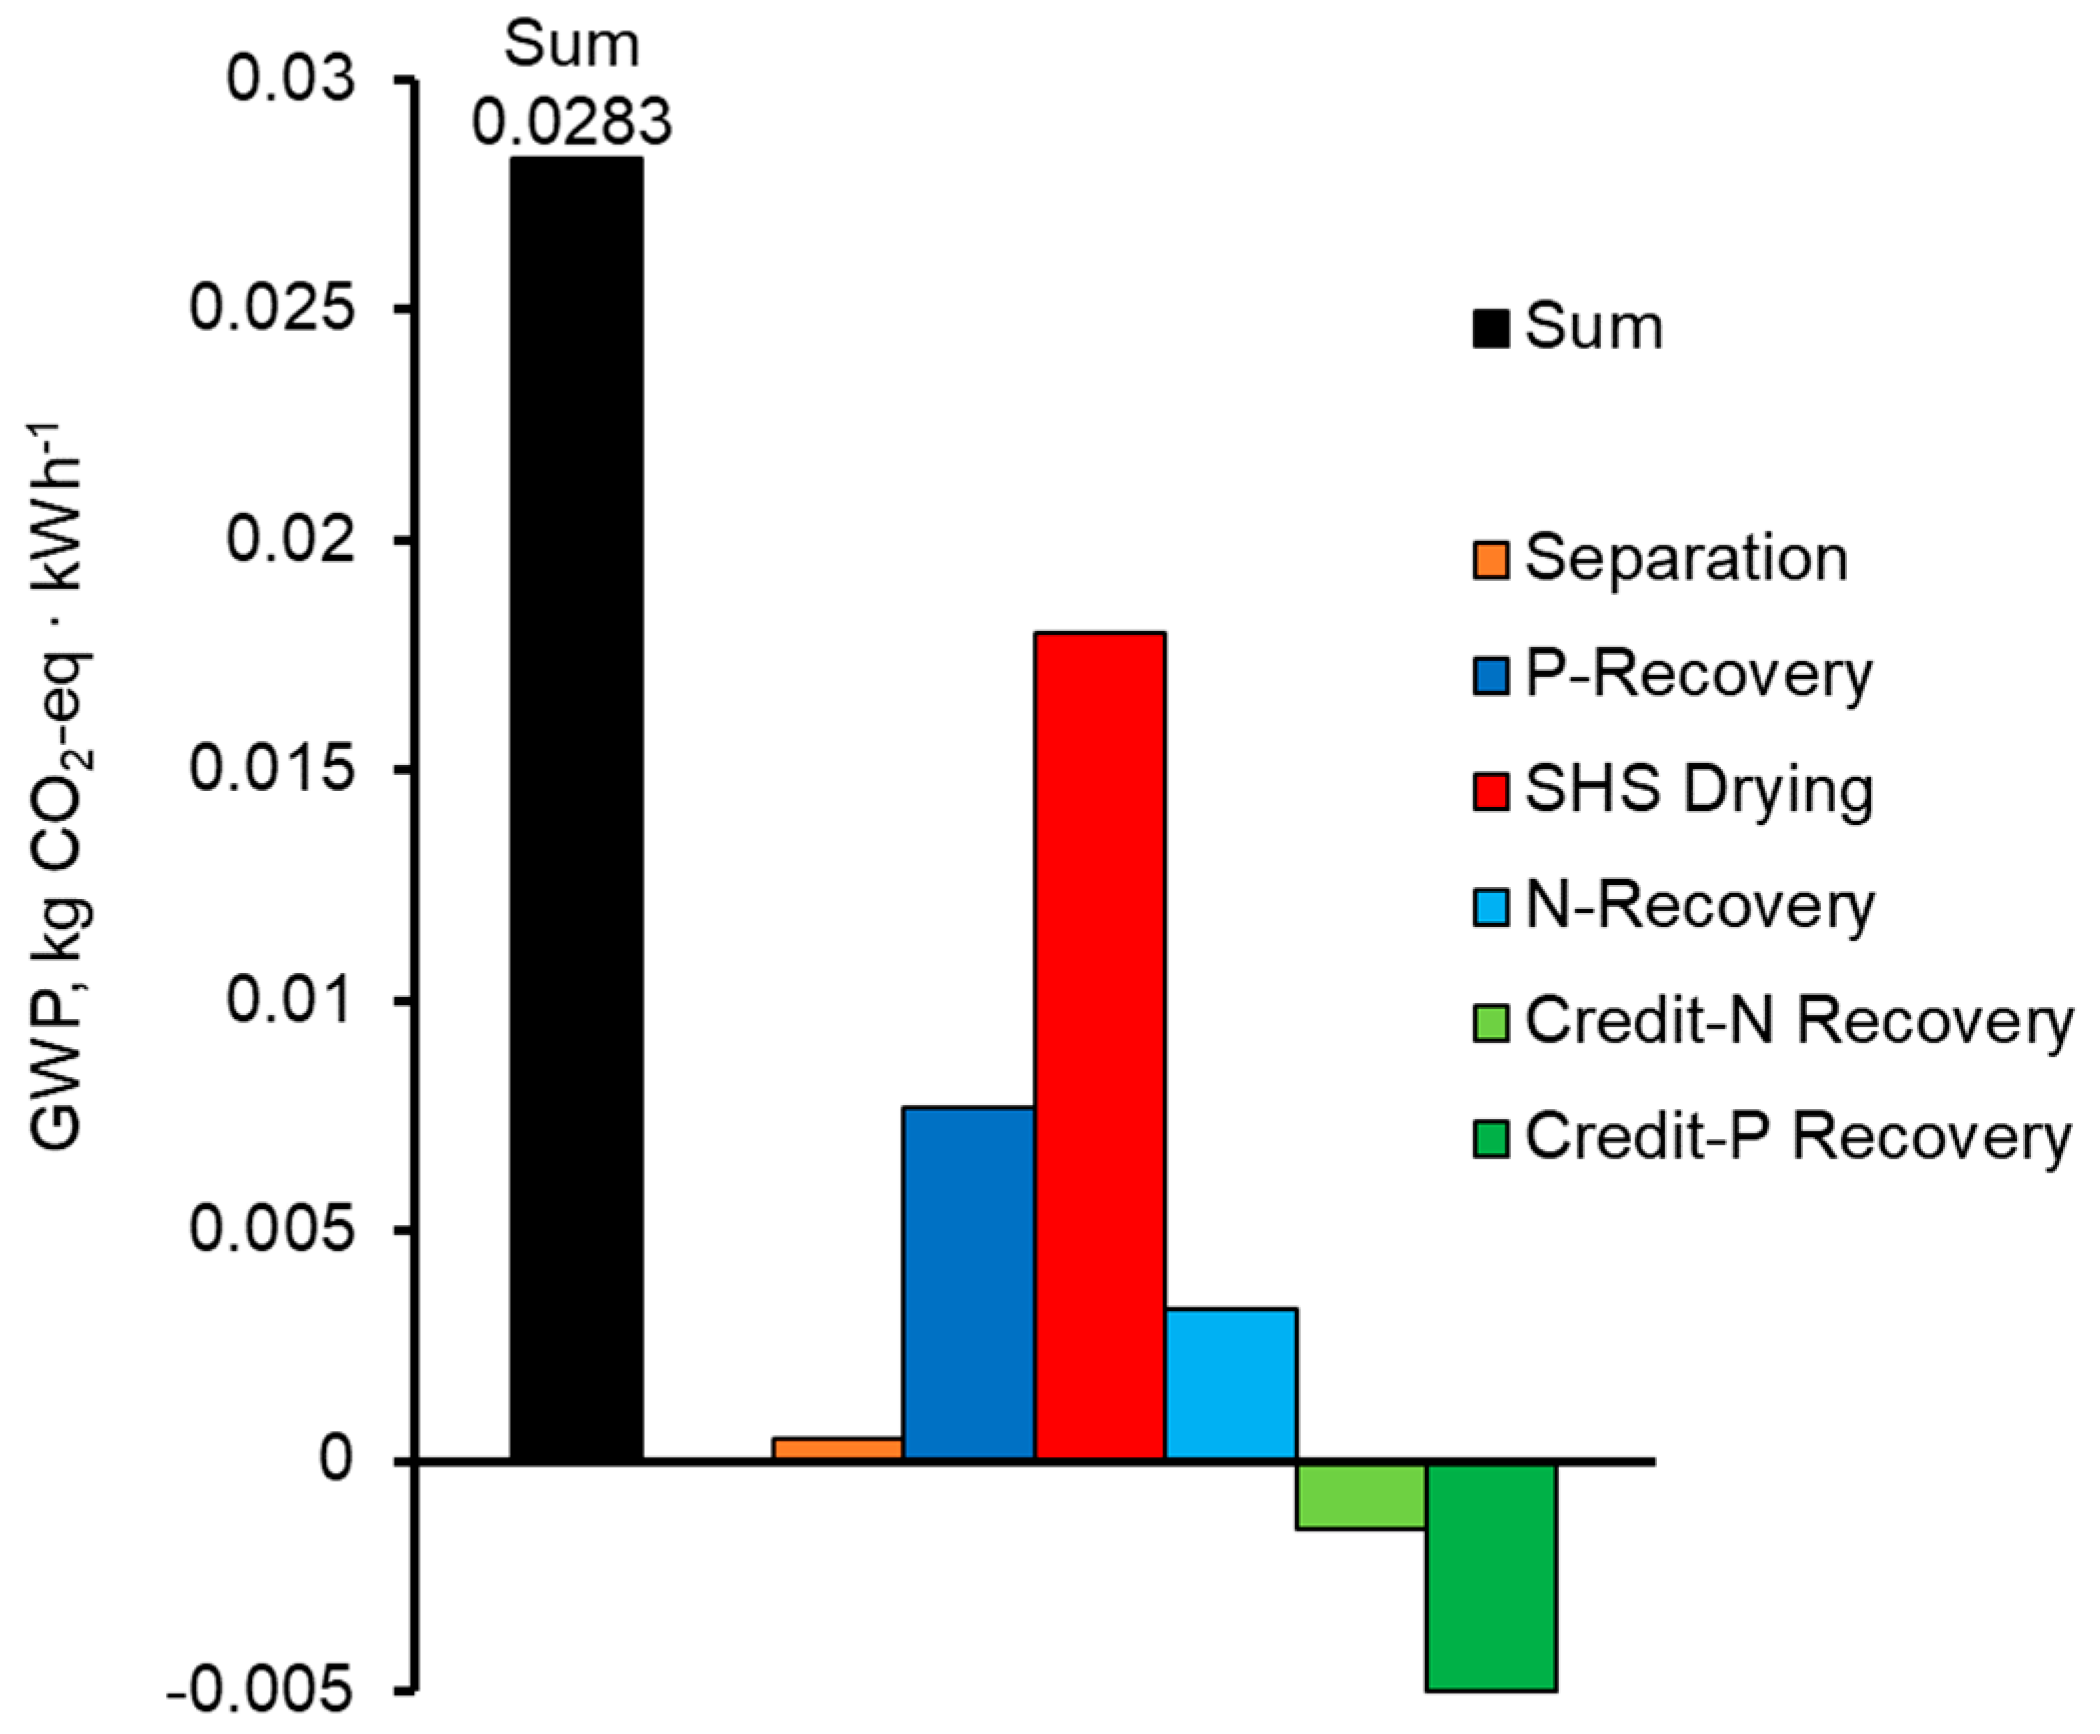
3.2. Nutrient Recovery

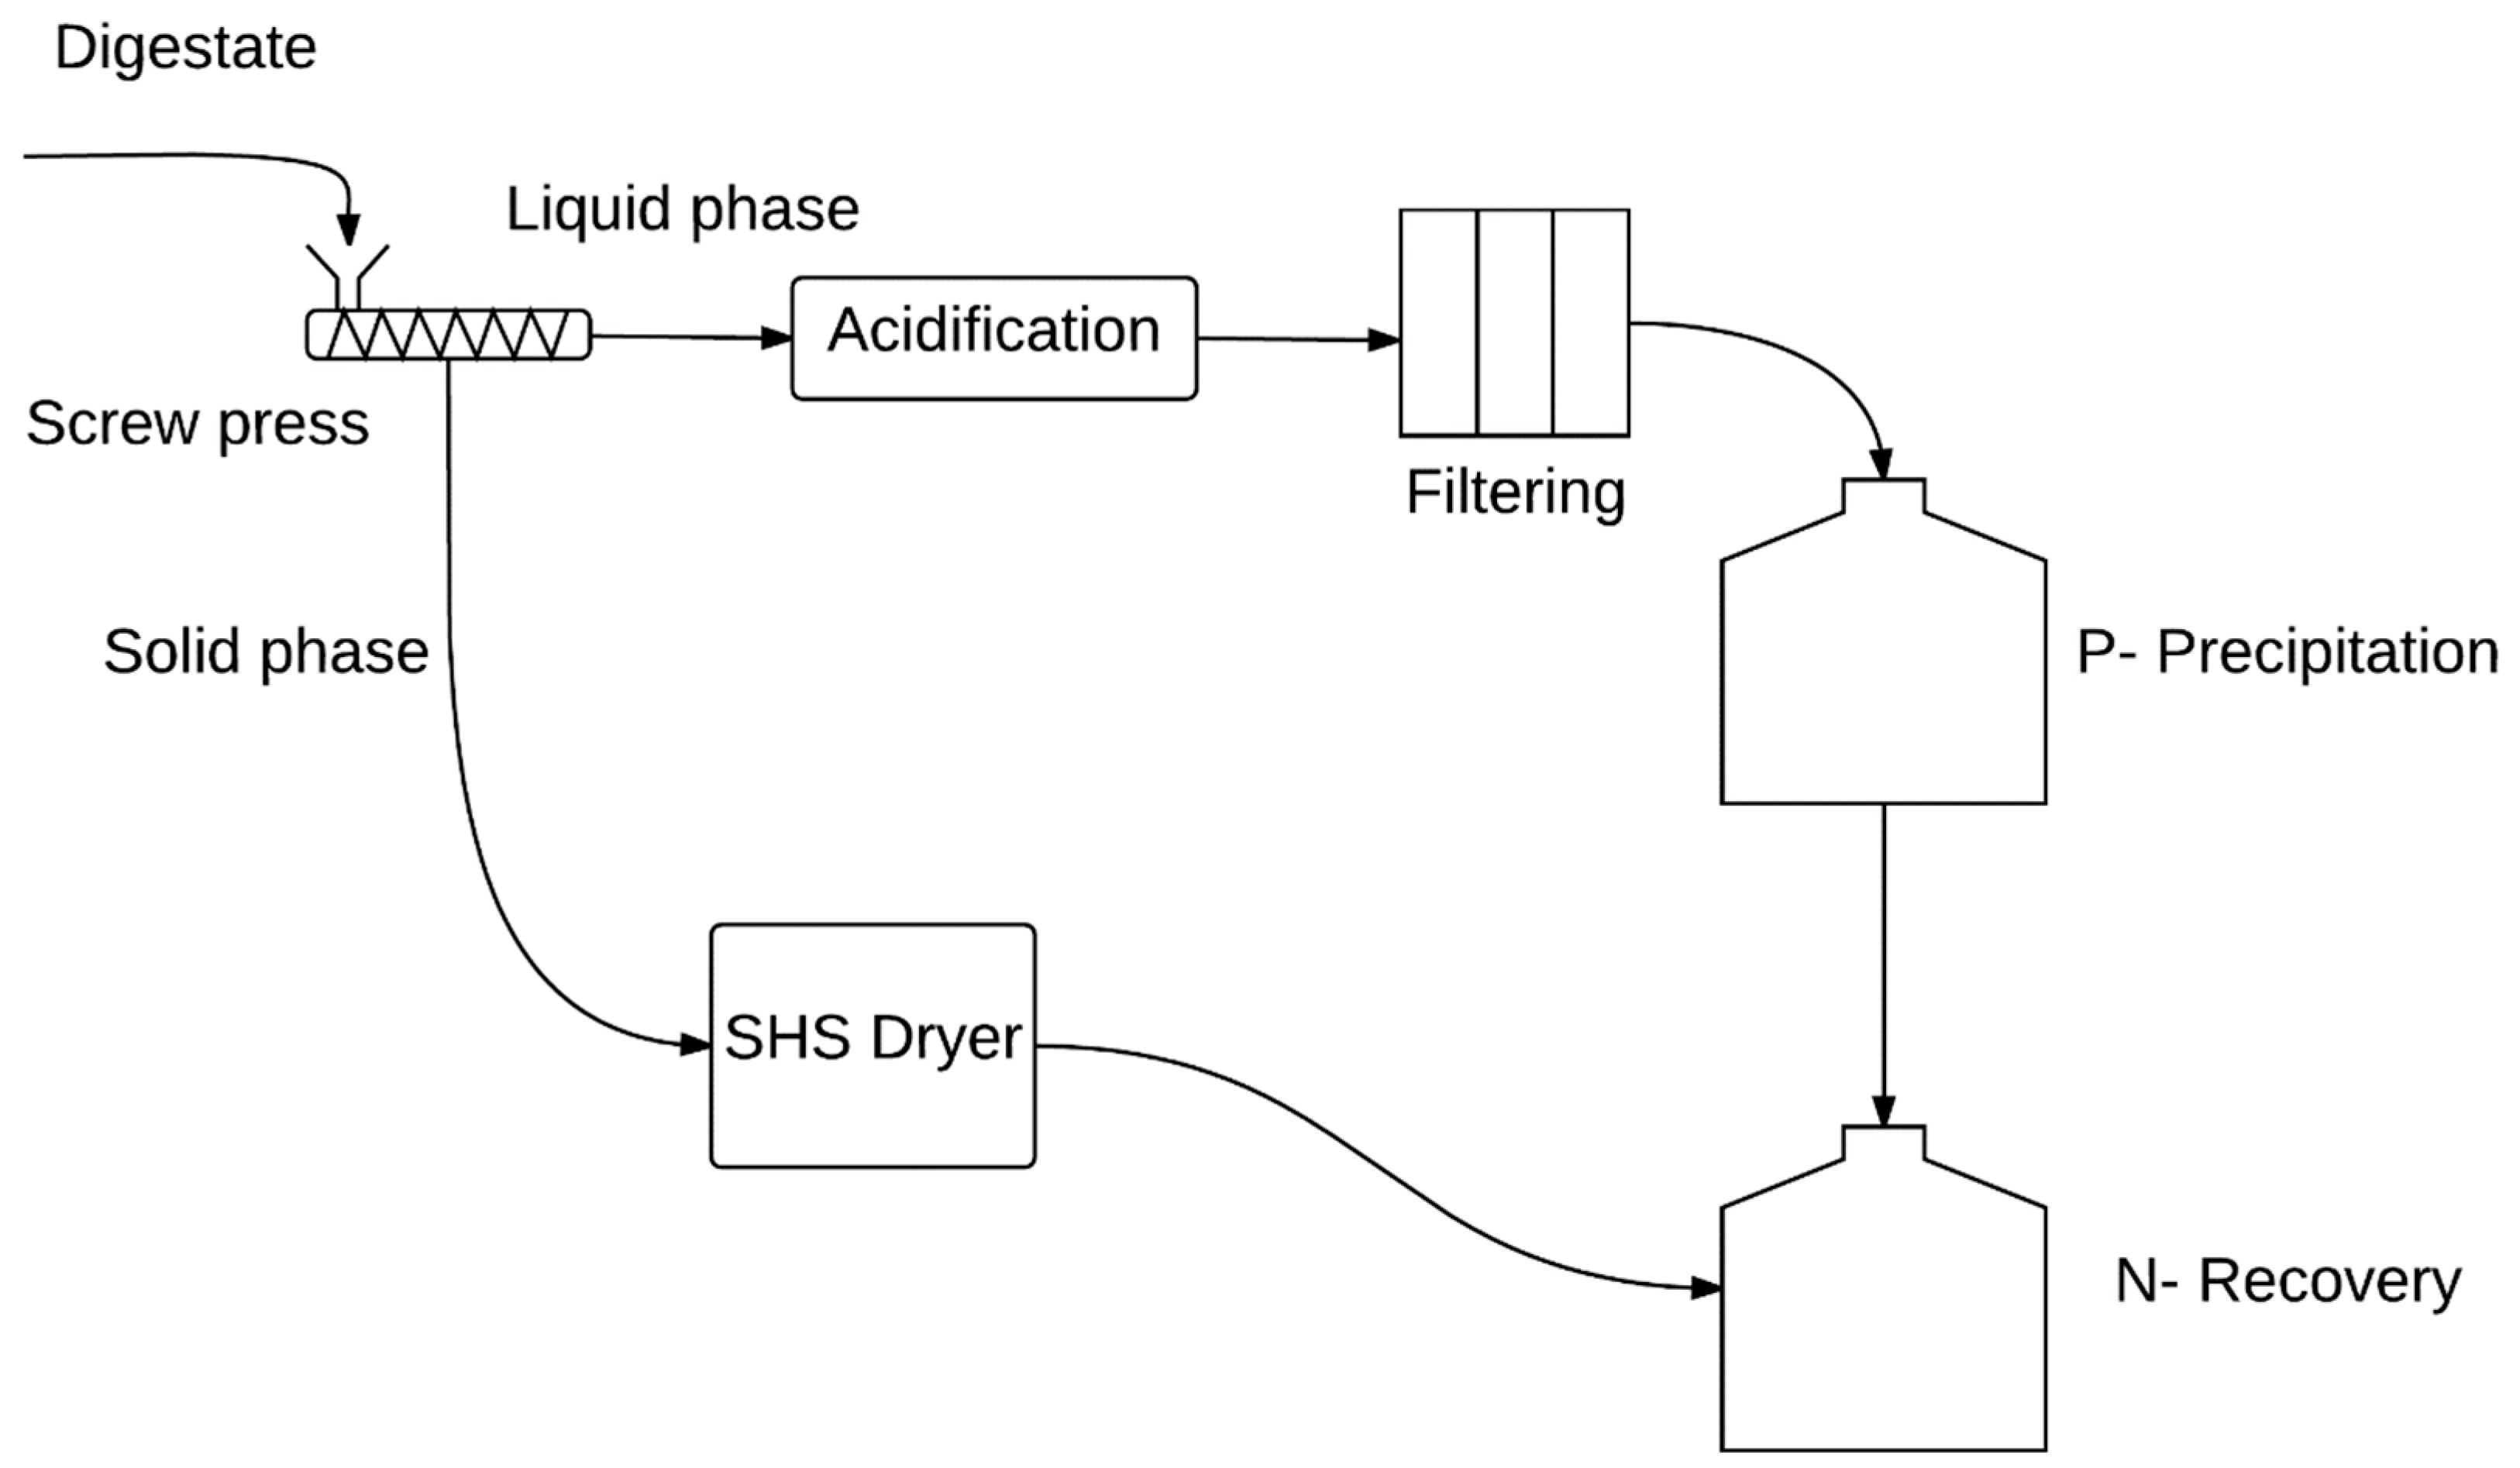
After anaerobic fermentation, 0.0014 kg∙FU−1 of P-salts and 0.029 kg∙FU−1 of (NH4)2SO4 can be recovered from the digestate by nutrient recovery. Detailed GWP burdens and credits of the nutrient recovery scenario are shown in Figure 9.
The total GWP caused by the nutrient recovery scenario beyond the reference scenario lies at 0.028 kg CO2-eq∙FU−1. The largest contributor is the SHS dryer with 0.018 kg CO2-eq, followed by the phosphorous recovery process with 0.007 kg CO2-eq and the nitrogen recovery process with 0.03 kg CO2-eq. The share of the solid/liquid separation of the digestate on the GWP is very small at 0.00047 kg CO2-eq∙FU−1. The use of energy was determined as the main contributing factor within all processes. In total, the energy input causes 80% of the GWP of the nutrient recovery scenario followed by the use of chemicals with 19%. Credits given for recovered N and P lowered the GWP by 0.0015 kg CO2-eq∙FU−1 and 0.0005 kg CO2-eq∙FU−1, respectively.

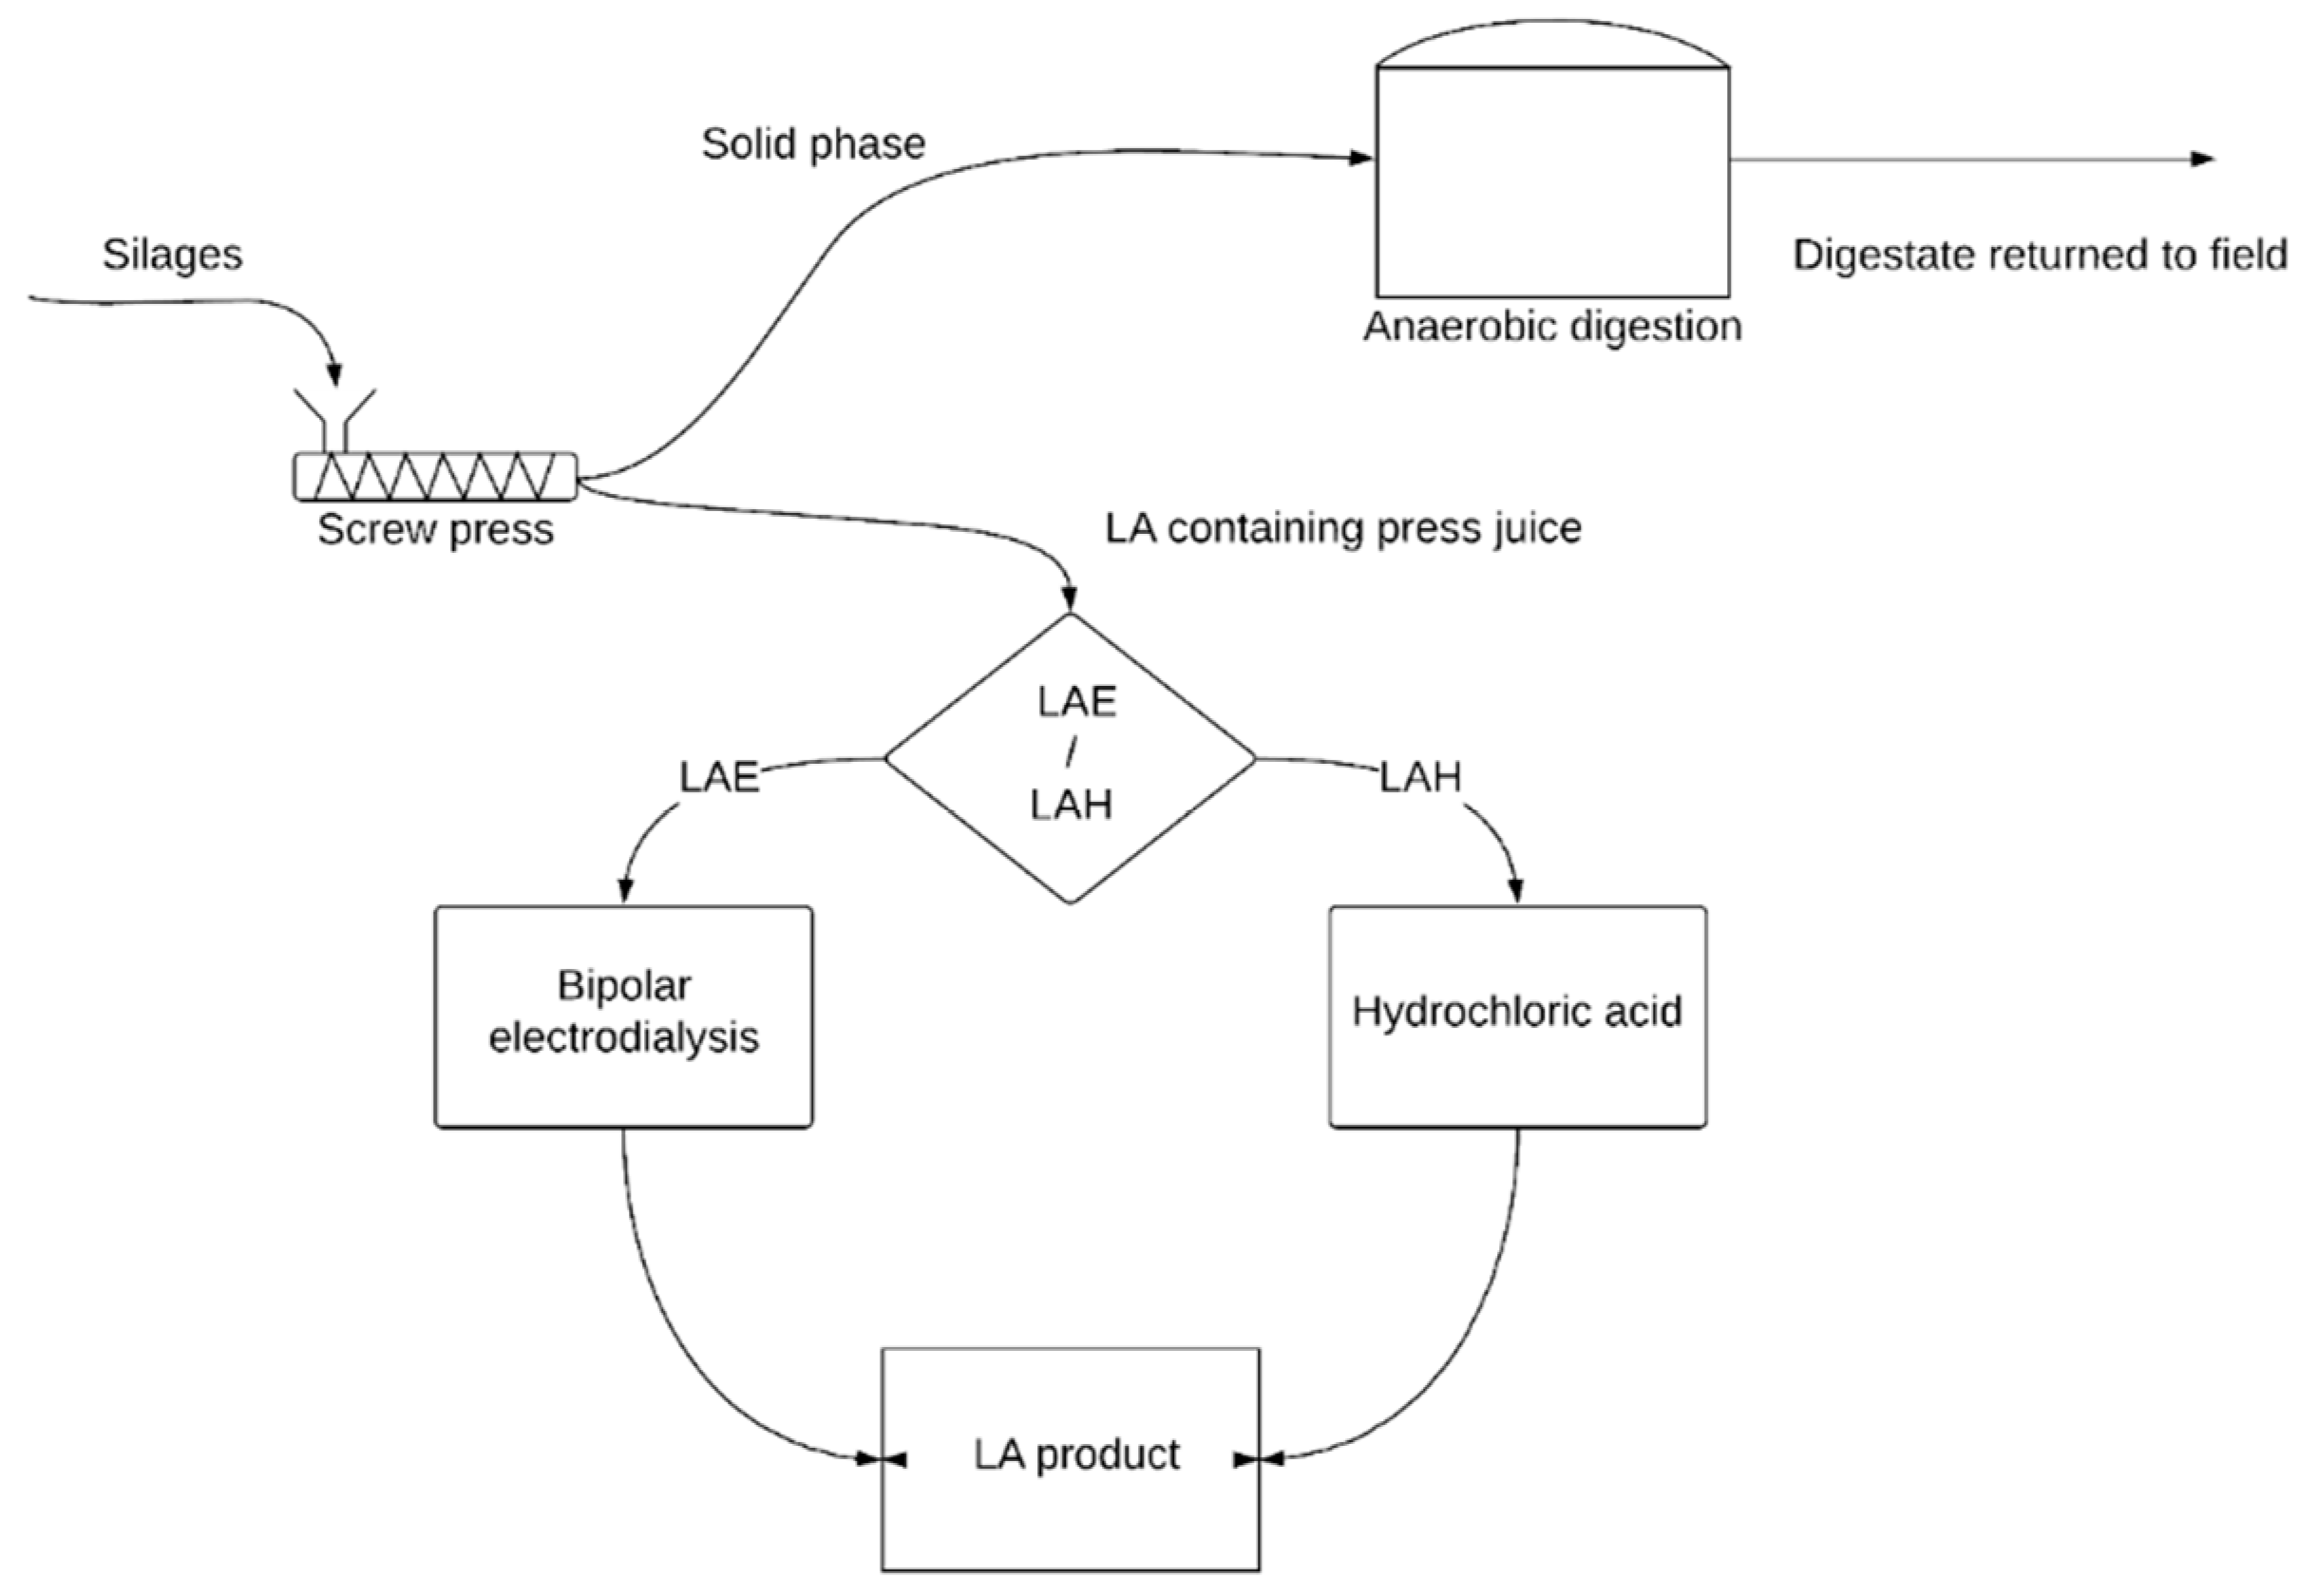
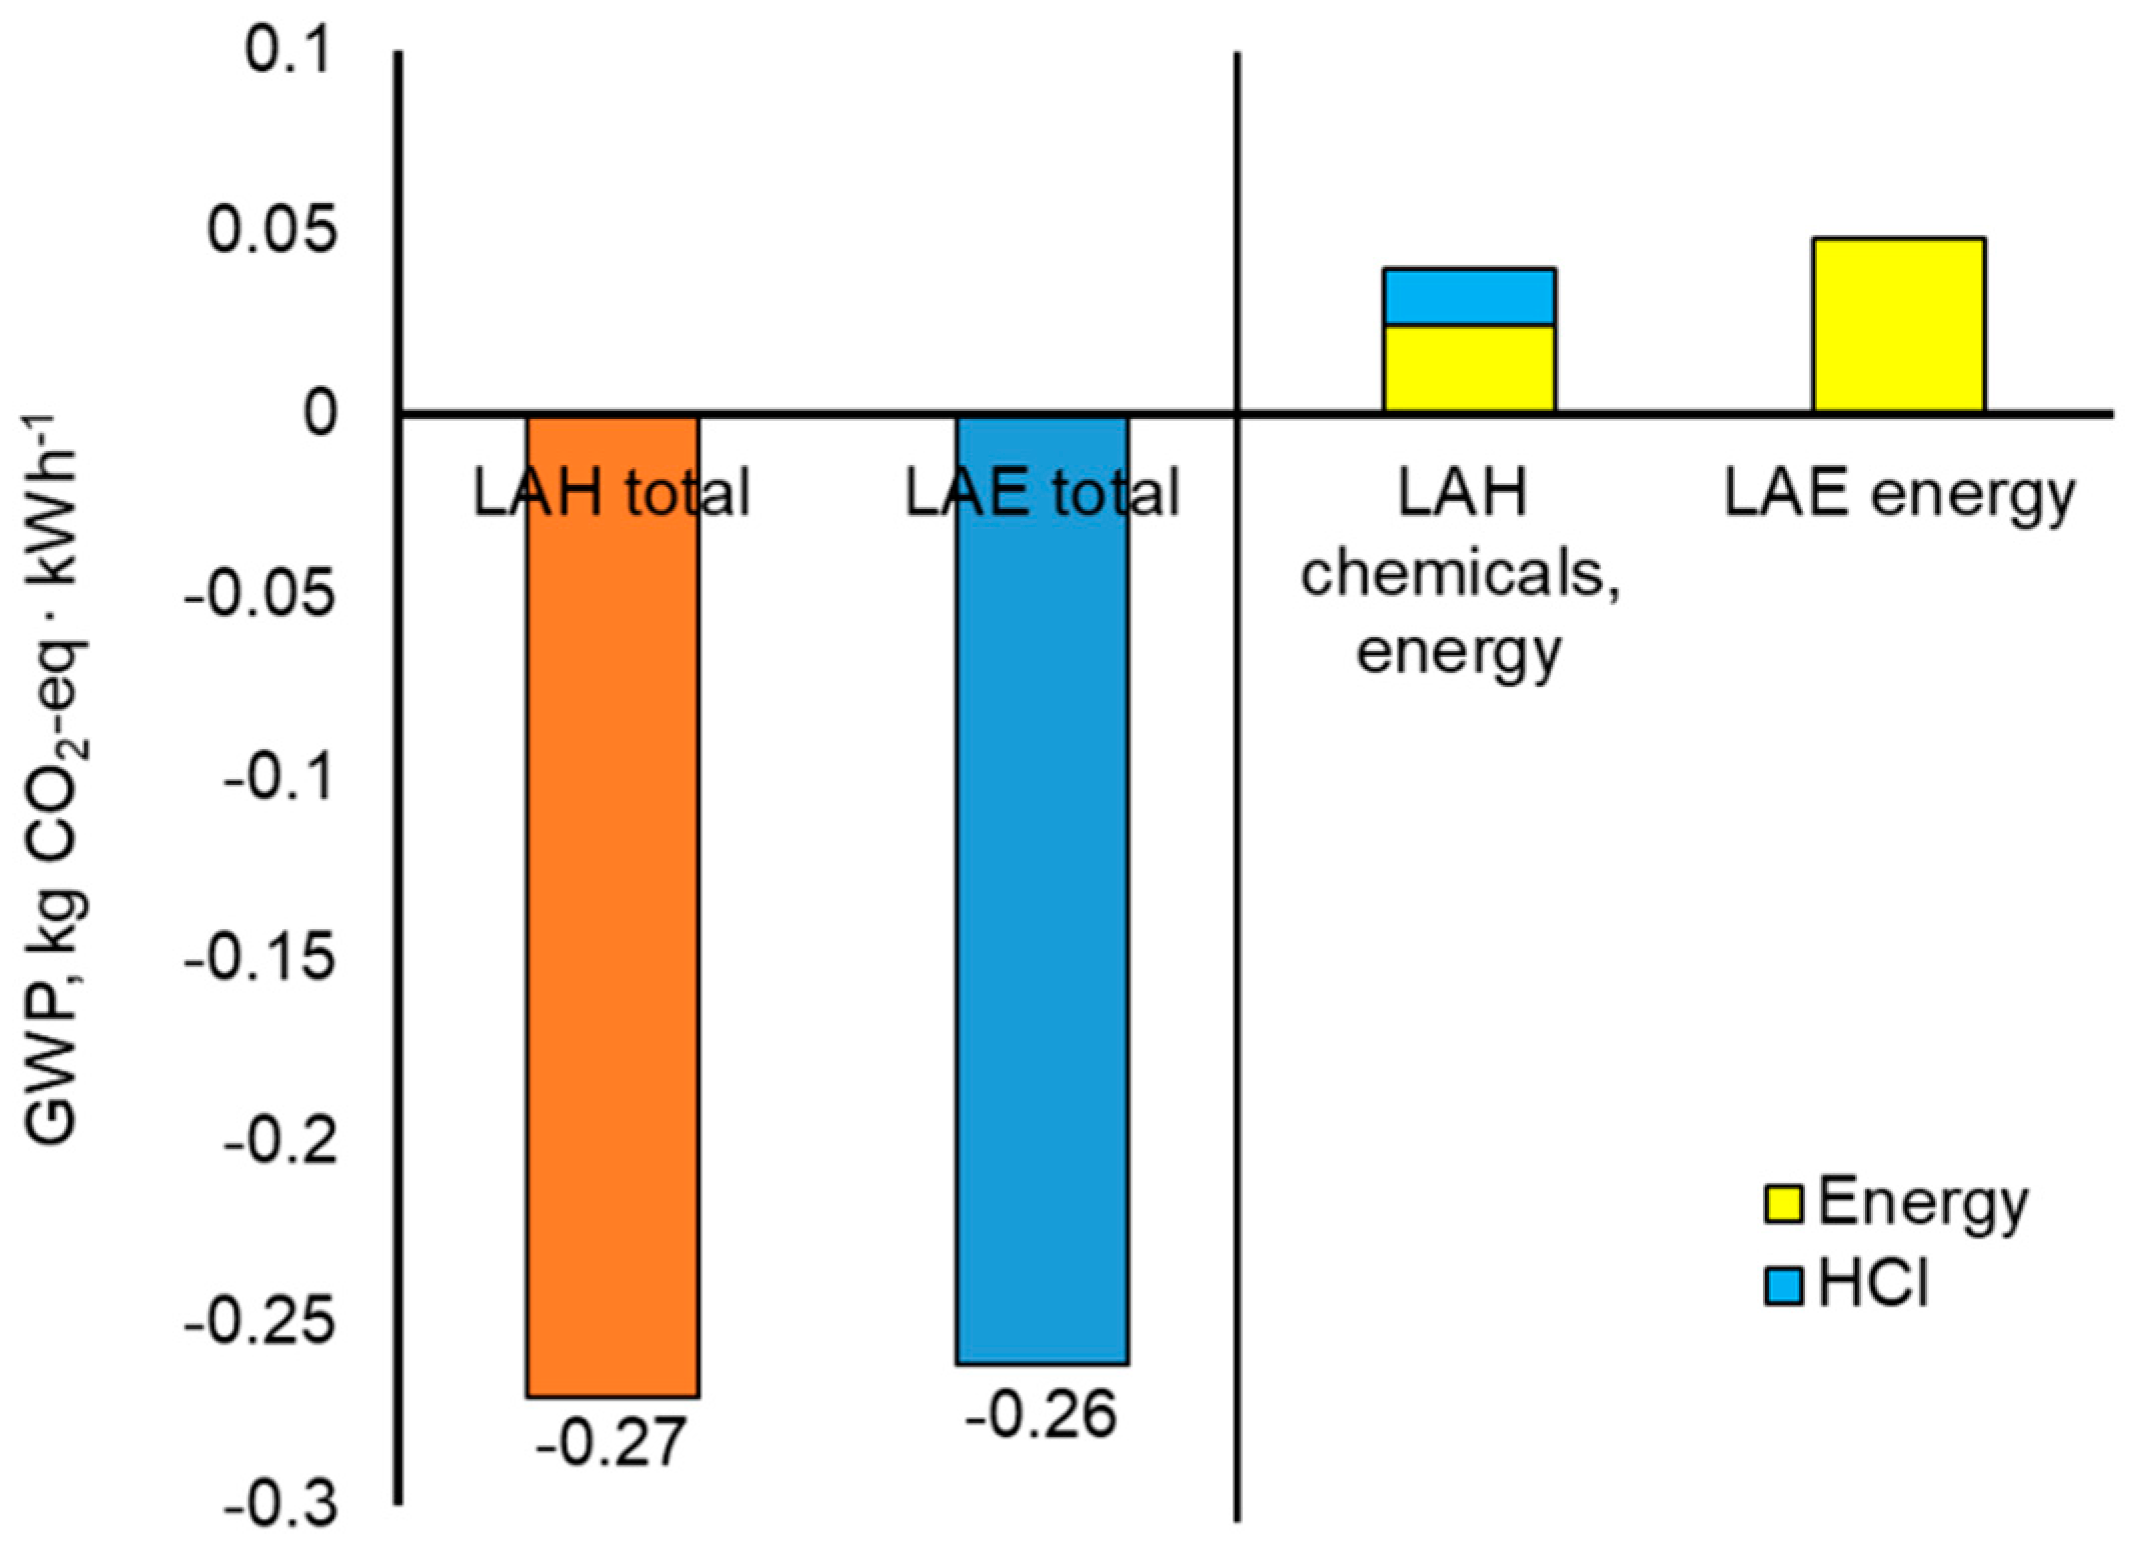
3.3. Lactic Acid Extraction

Lactic acid is extracted from silage by mechanical separation (0.04 kg∙FU−1). Results for the extraction techniques LAE and LAH are displayed in Figure 10.
The total GWP of the lactic acid scenario amounts to −0.27 kg CO2-eq for LAH and −0.26 kg CO2-eq for LAE, respectively. Compared to the reference scenario, the net CO2 savings for the LAH and LAE scenario are about halved. The GWP burdens excluding all identical processes within LAH and LAE are shown on the right in Figure 10. The energy based LAE process causes a slightly higher GWP with 0.05 kg CO2-eq, than the LAH process based on chemicals with 0.04 kg CO2-eq.

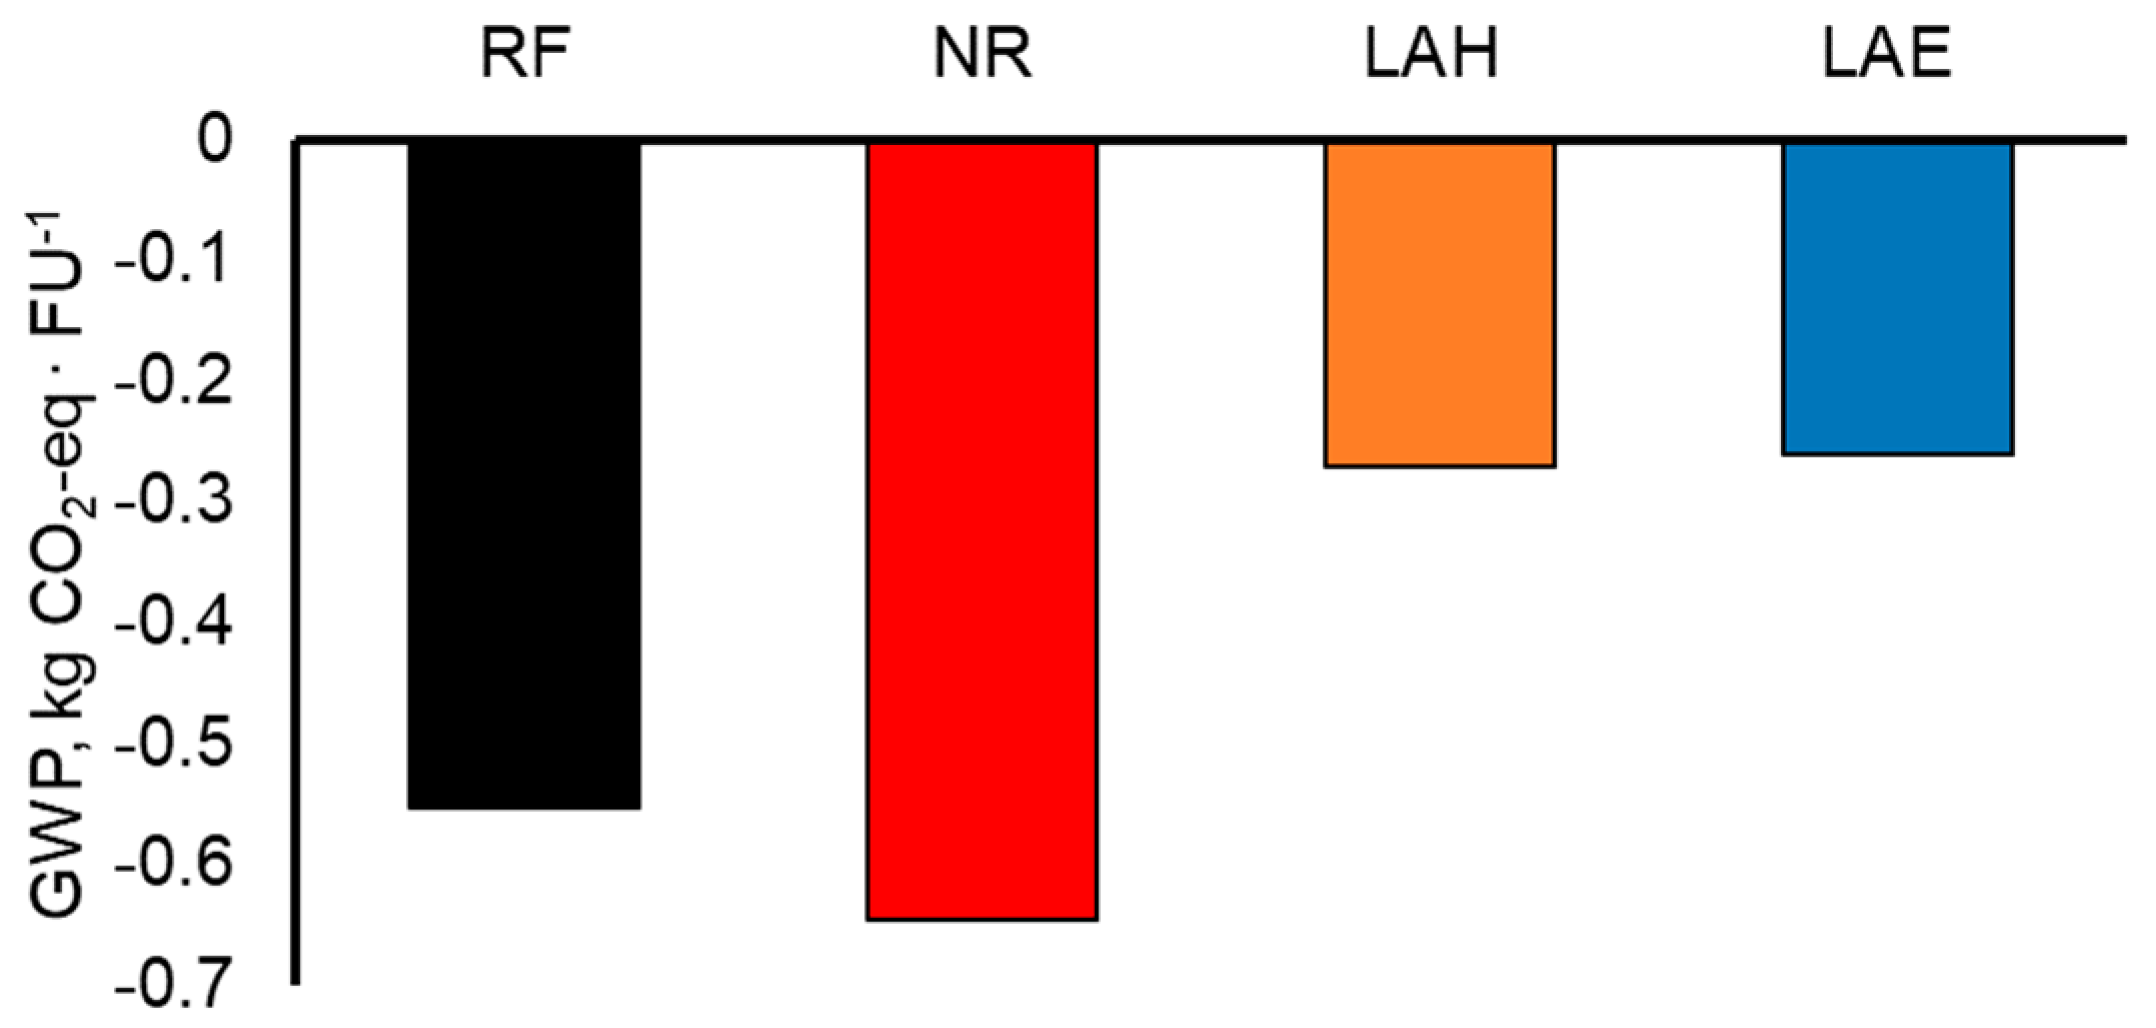
3.4. Comparison of Scenarios

The total GWP of the scenarios including credits is compared in Figure 11.
Results show that all scenarios lead to a net CO2 savings, even if additional processes such as nutrient recovery with −0.65 kg CO2-eq, lactic acid extraction using energy with −0.27 kg CO2-eq or lactic acid extraction based on chemicals and energy with −0.26 kg CO2-eq are applied. In the lactic acid scenarios, the GWP is increased by −0.55 kg CO2-eq in relation to the reference scenario. The recovery of nutrients leads to an increased CO2 savings in relation to the reference scenario if credits for electricity and heat production from biogas are included.
Regarding the nutrient recovery scenario, the burdens are shared as follows: (i) by 97% or 0.03 kg CO2-eq for energy production, (ii) by 2.5% or 7.0∙10−4 kg CO2-eq for N recovery and (iii) by 0.5% or 1.4∙10−4 kg CO2-eq for P recovery. Within the lactic acid extraction processes, 60% or 0.16 kg CO2-eq are caused by energy production and 40% or 0.1 kg CO2-eq from lactic acid by burden sharing based on market prizes.
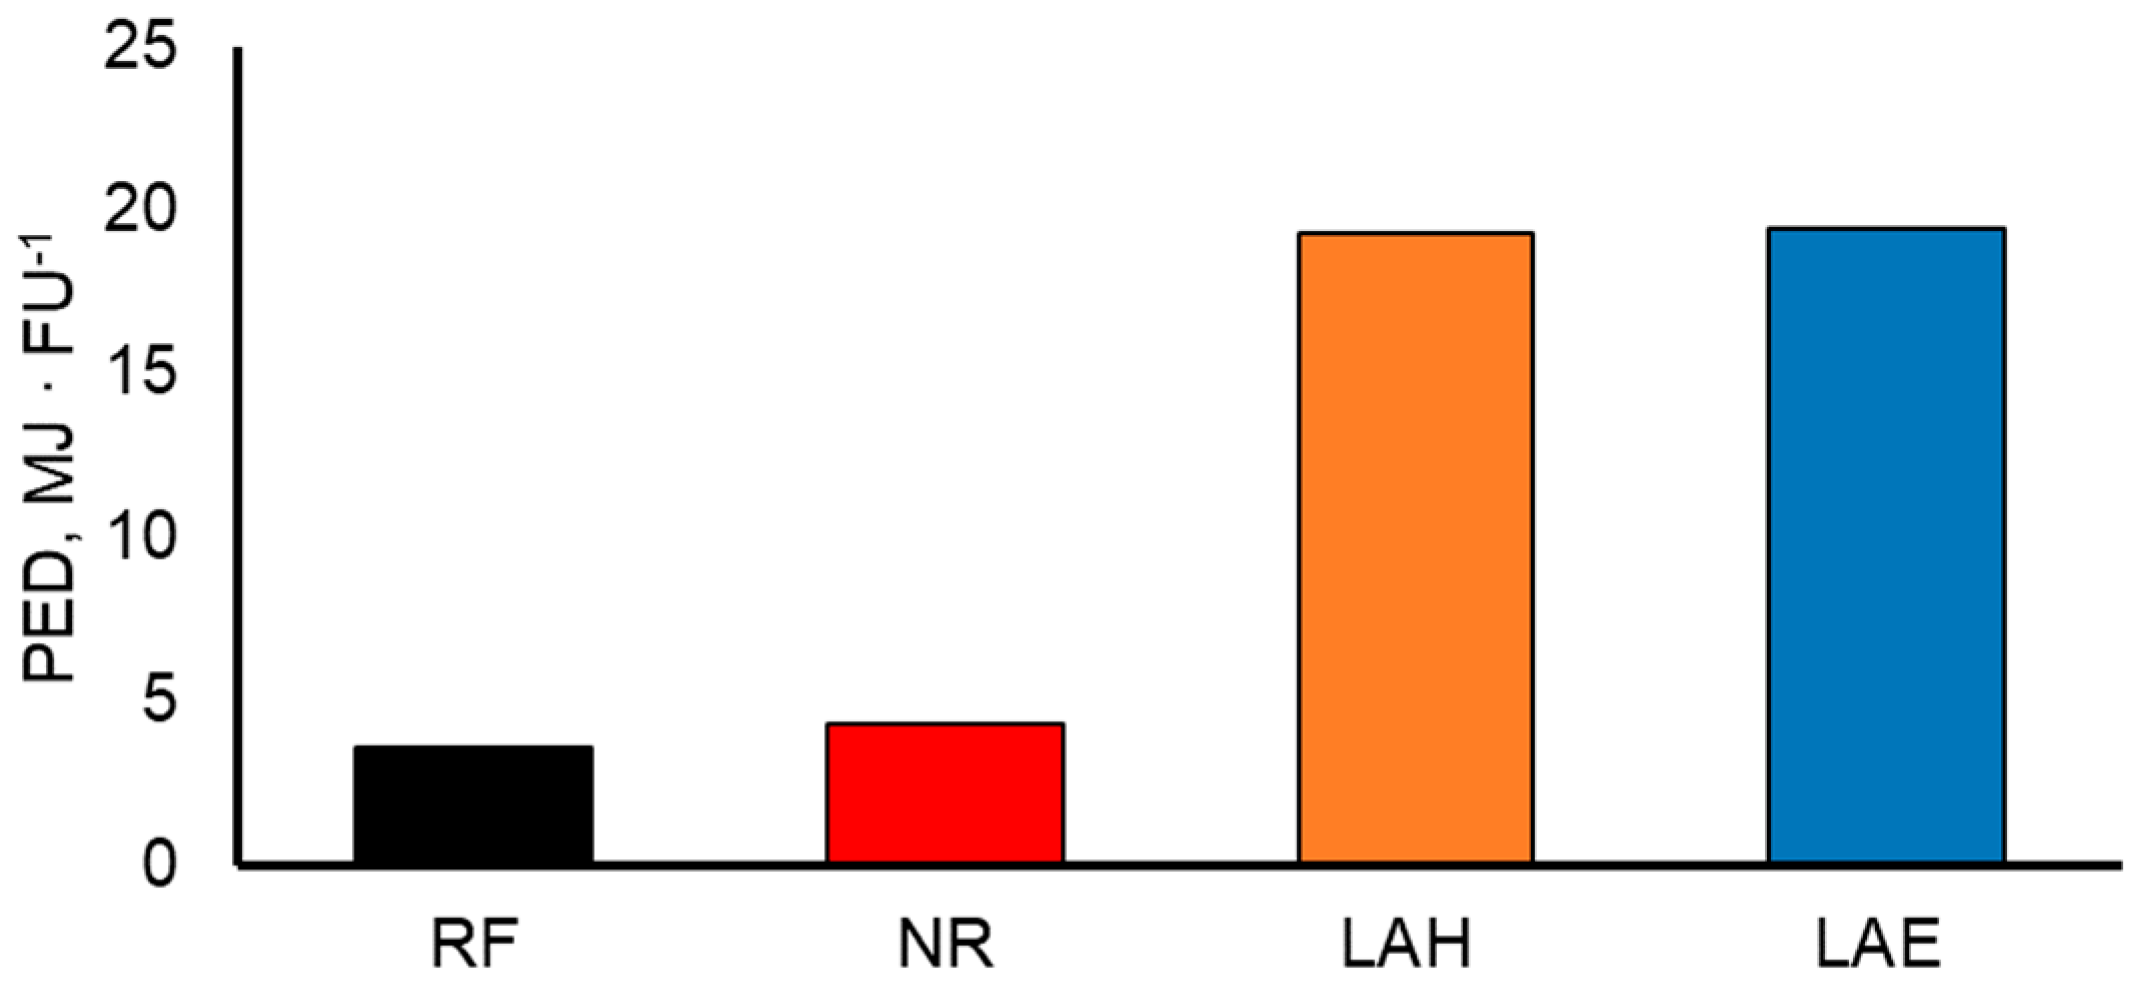
Primary energy demand (PED) of the scenarios is compared in Figure 12.
The demand of primary energy is 3.6 MJ for the reference scenario. Crop production using fertilizers is the main contributor to the PED with 3.3 MJ, which amounts to 93% of the total PED. When nutrient recovery is performed, the PED slightly increases to 4.3 MJ∙FU−1. The additional energy demand of 0.7 MJ comprises 0.3 MJ from the SHS drying, 0.2 MJ from the phosphorus recovery and 0.2 MJ from the nitrogen recovery.
Extraction of lactic acid causes an increased PED compared to the reference scenario. The main contributor is the energy crop production with a share of 83%. Differences between the combined energy, the chemical based LAH and the sole energy based LAE are small. LAH causes almost the same PED with 19.3 MJ as LAE with 19.4 MJ. The production of HCl demands slightly less primary energy than the generation of energy, which is necessary to obtain the same amount of purified lactic acid.
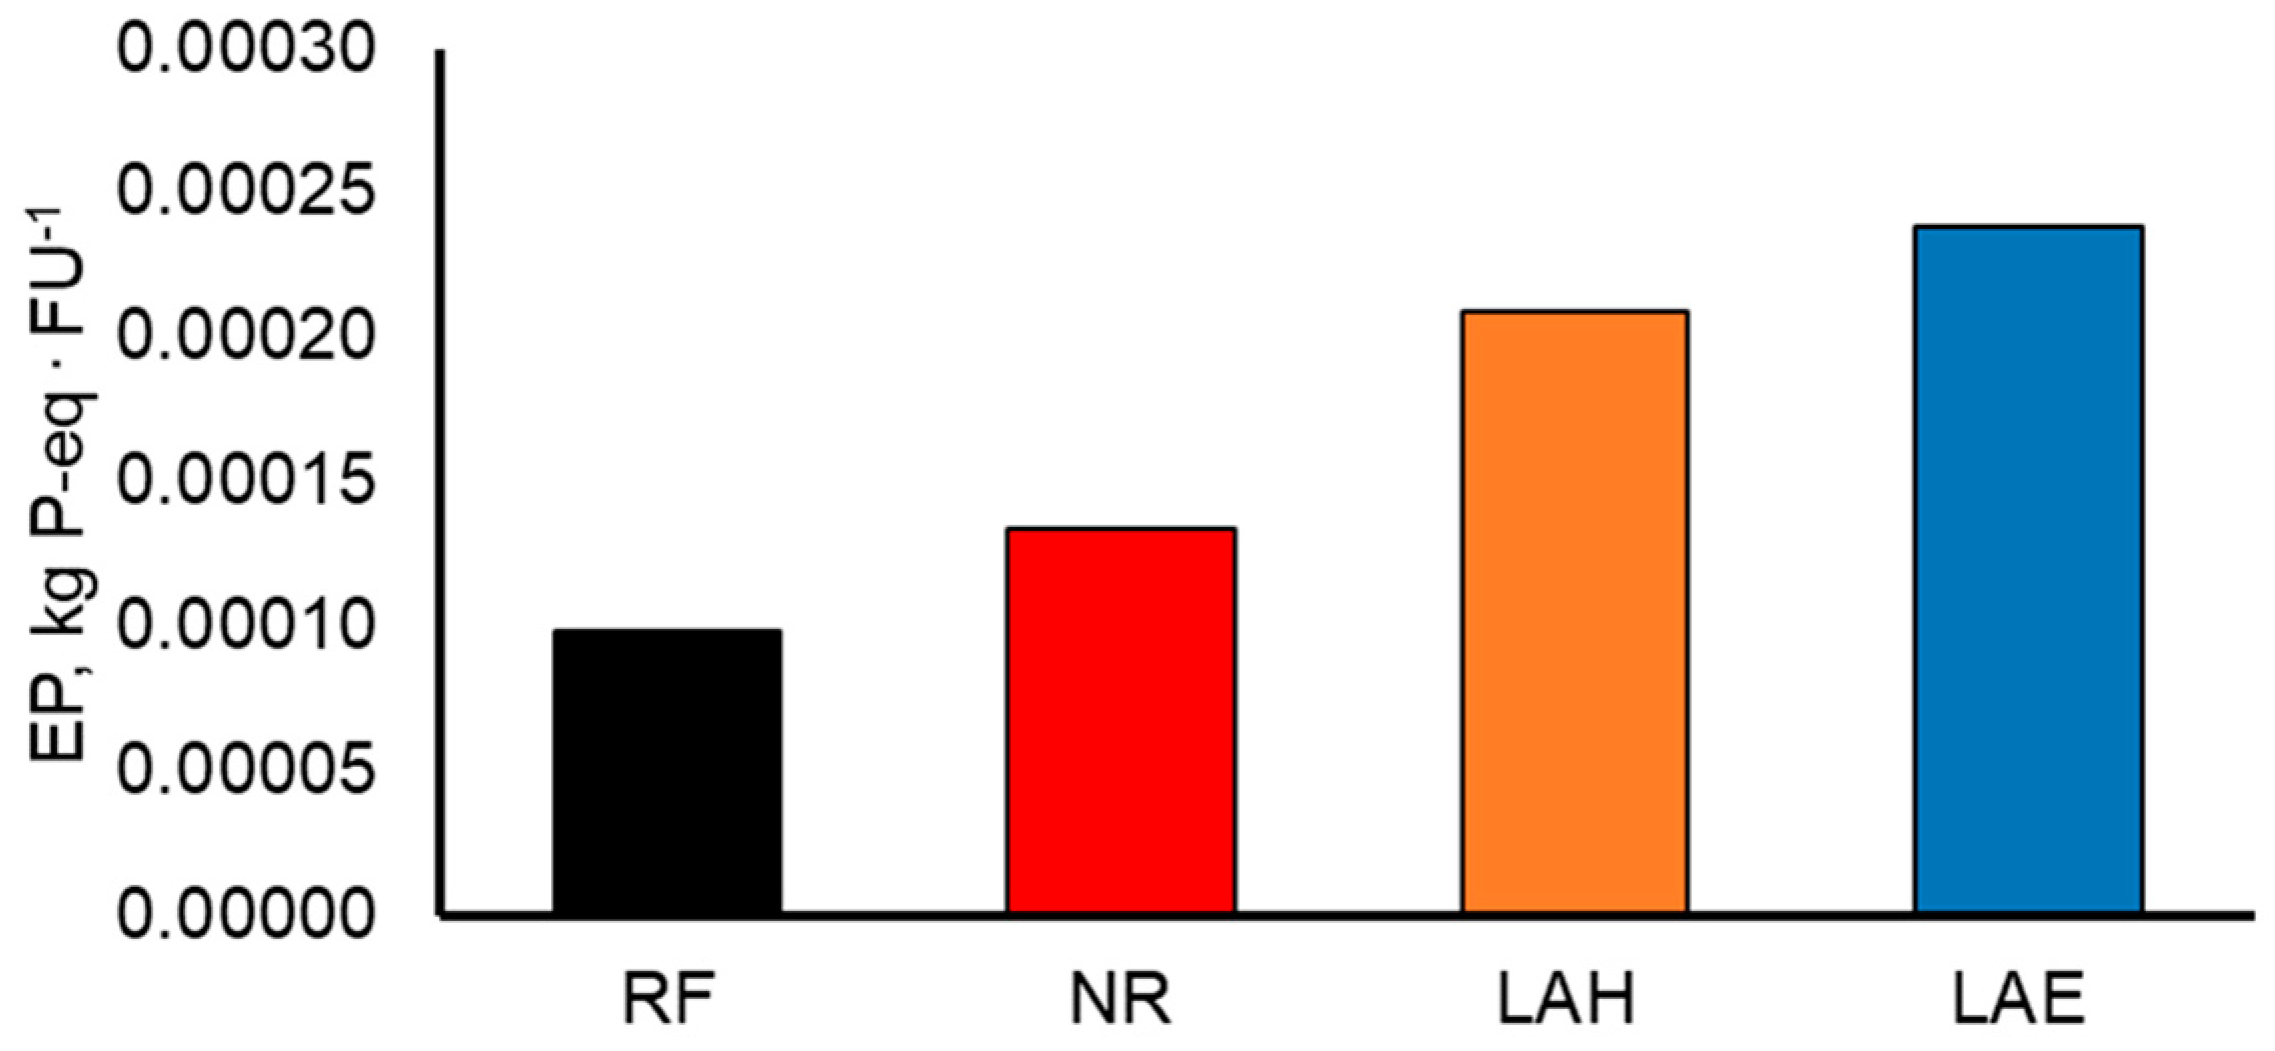
Fresh water eutrophication (EP) caused by the immission of chemicals such as nitrogen in the various scenarios is compared in Figure 13.
The eutrophication potential of the reference scenario is 9.86 × 10⁻⁵ kg P-eq. The main contributors are the utilization of energy with 5.83 × 10⁻⁵ kg P-eq, which equals 60% and the crop production systems with 3.56 × 10⁻⁵ kg P-eq equaling 36%. When nutrients are recovered, EP increases to 1.34 × 10⁻⁴ P-eq, although the main contributing parameters remain the same as in the reference scenario. Extraction of lactic acid in general causes a higher EP than the recovery of nutrients. The EP of LAH and LAE is 2.1 × 10⁻⁴ kg P-eq and 2.4 × 10⁻⁴ kg P-eq, respectively. The main processes contributing to the EP are agricultural production, utilization of energy and the use of HCl in LAH.

4. Discussion

The results calculated for the reference scenario are similar to those stated by different studies for the energy production from biogas, although FU, system boundaries and credits granted for avoided fossil energy are slightly deviating [22,31,39,40]. The contribution of the different biogas substrates to the GWP is remarkable. The effect of maize on the GWP seems to be higher than that of other substrates. Figure 8 shows that this result is mainly based on the mass flow differences of the substrates. Based on energy, the GWP of maize and triticale is similar, and only clover grass has a lower GWP due to the lower mineral fertilizer demand. Furthermore, single substrate specific results are similar to a study of Jacobs et al. [41], who found a GWP of 0.137 to 0.149 kg CO2-eq per kWhel for maize even though the methodology differs slightly [41]. Compared with the models shown in other studies, the reference scenario has a higher energy demand [42]. This is due to the different substrate compositions and feeding conditions of the biogas plants, which have a significant impact on the PED. In addition, the installed power of the CHP (500 kW) in the present study differs from the cited study where it was 186 kW. Regarding the EP, it can be stated that the reference model of the present study is similar to the results of other workgroups using miscanthus and switchgrass as feedstock [39].
The results highly depend on input materials and production processes like crop rotations as well as credits given for heat utilization. Credits in this study were given based on the ratio of the thermal and electrical energy mix in Germany for the year 2016. This mix is continuously changing and will require updating of the study in the future. Furthermore, the nutrient composition of the digestate highly depends on the input substrates, which implies that results of the present work regarding the fertilizing value of the digestate cannot be generalized.
The results show that nutrients can be recovered from digestate resulting in a positive impact on the GWP compared to the reference scenario and further lead to a lower impact on the environment with respect to the PED. The main benefit of the nutrient recovery is the possibility to completely utilize the heat provided by the biogas plant. In this case, fossil energy can be preserved, while no unutilized heat is released to the environment. As the proper use of the generated heat is one of the big challenges in the field of biogas production, the recovery of nutrients shows a conceivable way of reducing energy losses, which is also demanded by Federal legislation [1]. Furthermore, decoupling of the major nutrients nitrogen, phosphorous and potassium, offers the opportunity of demand oriented fertilization by optimal blending and can be considered a positive side effect. Nutrient recovery further provides an opportunity to transport and store nutrients in a cost efficient way. This aspect becomes interesting if this technique is applied in regions with a nutrient oversupply caused by high feedstock density [19,43]. Consequently, the recovery of nutrients from biogas digestate provides a sustainable solution to reduce the impact of the agricultural sector on the groundwater quality due to the leaching of surplus nutrients, which is a current issue in the discussions between Germany and its European partners. Although the additional energy input for the nutrient recovery is relatively low compared to the biogas production (Figure 12), the application needs to be evaluated in the context of the regional nutrient demand. Nutrient recovery should only be applied for the net surplus of nutrients in order to avoid wasting energy and resources.
The agricultural production has a large effect on the EP due to fertilization and subsequent leaching of nutrients to freshwater. This aspect is also described by other authors [39,42]. Furthermore, the utilization of energy and chemicals has a high influence on the EP. This effect becomes visible when comparing the nutrient recovery and the lactic acid extraction scenarios. Lactic acid extraction scenarios and nutrient recovery have a similar total nutrient flow but EP differs significantly. Differences are caused by the high energy demand of SHS drying and to a minor degree by chemicals consumed by P- and N-recovery.
Germany’s present turnaround in energy policy focuses mainly on wind and solar energy. This leads to decreasing feed-in tariffs for energy from biogas [1]. Lactic acid extraction by pressing silages is a possibility to generate an additional source of income for biogas plant operators. Hence, the generation of lactic acid might strengthen the economic competitiveness of the biogas sector within the policy framework in Germany.
However, the environmental impacts of lactic acid extraction are higher than that of the reference scenario. When lactic acid is extracted the total mass flow towards the biogas power plant decreases to about 50%. Furthermore, water is also removed from substrates by lactic acid extraction. Therefore, the OLR was reduced to 2 kg oDM·m−3∙d−1 to avoid an overload of the biogas process. This results in a lower total production of methane and hence electricity and heat. Consequently, credits for heat utilization and substitution of fossil energy are also reduced. At the same time, the effort for energy consuming plant production remains unchanged, which results in a higher GWP per FU. If lactic acid extraction is applied, it has to be considered that the amount of digestate is also reduced, while the cultivation area remains unchanged. Therefore, crop fertilization management needs to be adapted resulting in an additional demand for mineral fertilizers, especially phosphorus. This leads to a higher PED and GWP compared to the reference scenario and subsequently causes further economic uncertainties for the biogas plant operators. If lactic acid should be extracted from silages while obtaining the initially installed power of 500 kW, the cultivation area would have to be increased by 39%, which should be considered in the background of the discussion on food security. Since the present study does not cover the aspect of land use efficiency, an evaluation of the sustainability of an increased cultivation area for the generation of lactic acid is not possible. Furthermore, the aspect of waste recycling and disposal from the lactic acid extraction needs to be addressed if the technique should be applied. Due to the fact that HCl is considered a dangerous substance under German law, it is not permitted to recycle the wastewater from lactic acid extraction in the biogas power plant. On the other hand, recycling the wastewater from the bipolar electrodialysis in the biogas digester could be possible, although the chemical composition and hence its effect on the biogas production is still unknown and not covered by the present study. Finally, the results of the present work may contribute to the scientific discussion and may serve as a clue for policy makers to identify eligible technologies.

5. Conclusions

Results of the present study show that nutrient recovery from digestate and extracting lactic acid from biogas substrates are sustainable solutions in terms of GWP that can be integrated in the energy production from biogas under modelled conditions within a bio-refinery concept. Regarding PED, the recovery of nutrients and the extraction of lactic acid causes a higher consumption of primary energy. However, modelled processes are based on prototypes and it is likely that the PED will be reduced significantly when the techniques become widespread. For the recovery of nutrients, detailed knowledge of regionally available nutrients is essential to benefit from the advantages of decoupled nutrients and the possibility of saving fossil phosphorus recourses. It can be stated that EP increases whenever extensions are added to the reference scenario. EP rises mostly with an increased utilization of energy and an additional consumption of chemicals. In order to decrease EP values, energy consumption in particular must be reduced. The results of this study show the potential of novel technologies as part of bio-refinery concepts that can improve the biogas production and adapt it to actual challenges of the energy sector. Nevertheless, further studies, which also address the potassium loaded effluent of the nutrient recovery process, are required. Due to the low concentration, the effluent application is currently limited to areas near to the nutrient recovery facility. Due to frequent changes in legal and environmental conditions, the model of the present work needs to be continuously updated to serve as a decision-making tool for both, practical users and policy makers. Since the techniques described in the present study are still only applicable on a pilot scale, further research is necessary to bring the technologies to market maturity. The main areas of application are in regions with a high density of raw materials and limited agricultural land. The urgency of the nutrient surplus problem in these regions calls for increased research and the support of policy makers to foster development activities.

Author Contributions

Conceptualization, S.A., K.M., S.R. and J.M.; Methodology, S.A.; Investigation, S.A.; Validation, S.A. and S.R.; Writing—original draft preparation, S.A., S.R.; Writing—review and editing, K.M. and J.M., Supervision, K.M. and J.M.; Project administration, J.M. and K.M.

Funding

The GOBi project was funded by the German Federal Ministry of Education and Research (BMBF), represented by the Project Management Jülich, under grant number 03EK3525A.

Acknowledgments

The authors would like to thank the Agency for Sustainable Management of Agricultural Landscape (ANNA) for their support during data collection and model evaluation.

Conflicts of Interest

The authors declare no conflict of interest. The funders had no role in the design of the study; in the collection, analyses, or interpretation of data; in the writing of the manuscript, or in the decision to publish the results.

References

  1. EEG. German Renewable Energy Act. Germany, F.G.o., Ed. 2014. Available online: https://www.clearingstelle-eeg-kwkg.de/eeg2014 (accessed on 29 March 2019).
  2. German Biogas Association. Biogas Maket Data Ger. 2017/2018; Fachverband Biogas, 2018; Available online: https://www.biogas.org/edcom/webfvb.nsf/id/DE_Branchenzahlen/$file/18-07-05_Biogasindustryfigures-2017-2018_english.pdf (accessed on 28 February 2019).
  3. Le Seigneur, V. The State of Renewable Energies in Europe—16’th EurObserv’ER Report; Observ´ER: Paris, France, 2017. [Google Scholar]
  4. EBA. Biogas Report 2014. Available online: http://european-biogas.eu/2014/12/16/4331/ (accessed on 23 August 2017).
  5. Theuerl, S.; Herrmann, C.; Heiermann, M.; Grundmann, P.; Landwehr, N.; Kreidenweis, U.; Prochnow, A. The Future Agricultural Biogas Plant in Germany: A Vision. Energies 2019, 12, 396. [Google Scholar] [CrossRef]
  6. Döhler, H.; Schliebner, P. Verfahren und Wirtschaftlichkeit der Gärrestaufbereitung. In Verwertung von Wirtschafts- und Sekundärrohstoffdüngern in der Landwirtschaft—Nutzen und Risiko, Proceedings of KTBL Vortragstagung, Osnabrück, Germany, 19 April–20 April 2006; Kuratorium für Technik und Bauwesen in der Landwirtschaft (KTBL): Darmstadt, Germany, 2006; pp. 199–212. [Google Scholar]
  7. Maurer, C.; Müller, J. Ammonia (NH3) emissions during drying of untreated and dewatered biogas digestate in a hybrid waste-heat/solar dryer. Eng. Life Sci. 2012, 12, 321–326. [Google Scholar] [CrossRef]
  8. Müller, J.; Meissner, K. GOBi Abschlussbericht der Universität Hohenheim: Projekttitel: GOBi—Ganzheitliche Optimierung der Biogasprozesskette zur Steigerung der betrieblichen, stofflichen, energetischen und ökologischen Effizienz unter besonderer Berücksichtigung der Produktion eines natürlichen kundenspezifischen Düngemittels. Available online: https://www.tib.eu/suchen/id/TIBKAT:896544370/#documentinfo (accessed on 4 February 2019).
  9. Ehmann, A.; Bach, I.-M.; Laopeamthong, S.; Bilbao, J.; Lewandowski, I. Can Phosphate Salts Recovered from Manure Replace Conventional Phosphate Fertilizer? Agriculture 2017, 7, 1. [Google Scholar] [CrossRef]
  10. Frank, D.; Messmer, J.; Laopeamthong, S.; Bilbao, J.; Egner, S. Nährstoffrückgewinnung aus Gärprodukten im Rahmen des GoBi-Vorhabens. Chem. Ing. Tech. 2014, 86, 1396. [Google Scholar] [CrossRef]
  11. Kocatürk-Schumacher, N.P.; Zwart, K.; Bruun, S.; Stoumann Jensen, L.; Sørensen, H.; Brussaard, L. Recovery of nutrients from the liquid fraction of digestate: Use of enriched zeolite and biochar as nitrogen fertilizers. J. Plant Nutr. Soil Sci. 2018, in press. [Google Scholar]
  12. Bolsen, K.K.; Ashbell, G.; Weinberg, Z.G. Silage fermentation and silage additives—Review. Asian-Australas. J. Anim. Sci. 1996, 9, 483–494. [Google Scholar] [CrossRef]
  13. Lindgren, S.; Pettersson, K.; Kaspersson, A.; Jonsson, A.; Lingvall, P. Microbial dynamics during aerobic deterioration of silages. J. Sci. Food Agric. 1985, 36, 765–774. [Google Scholar] [CrossRef]
  14. Clarke, S.; Eng, P.; Hillborn, D. How to Handle Seepage from Farm Silos; Ministry of Agriculture, Food and Rural Affairs: Toronto, ON, Canada, 2015. Available online: http://www.omafra.gov.on.ca/english/engineer/facts/15-003.htm (accessed on 29 March 2019).
  15. Danner, H.; Madzingaidzo, L.; Holzer, M.; Mayrhuber, L.; Braun, R. Extraction and purification of lactic acid from silages. Bioresour. Technol. 2000, 75, 181–187. [Google Scholar] [CrossRef]
  16. Haag, N.L.; Grumaz, C.; Wiese, F.; Kirstahler, P.; Merkle, W.; Nägele, H.-J.; Sohn, K.; Jungbluth, T.; Oechsner, H. Advanced green biorefining: Effects of ensiling treatments on lactic acid production, microbial activity and supplementary methane formation of grass and rye. Biomass Convers. Biorefinery 2016, 6, 197–208. [Google Scholar] [CrossRef]
  17. Haag, N.L.; Nägele, H.-J.; Fritz, T.; Oechsner, H. Effects of ensiling treatments on lactic acid production and supplementary methane formation of maize and amaranth—An advanced green biorefining approach. Bioresour. Technol. 2015, 178, 217–225. [Google Scholar] [CrossRef]
  18. Righi, S. Life Cycle Assessments of Waste-Based Biorefineries—A Critical Review. Green Energy Technol. 2019, 139–154. [Google Scholar] [CrossRef]
  19. Hanserud, O.S.; Lyng, K.-A.; Vries, J.W.D.; Øgaard, A.F.; Brattebø, H. Redistributing Phosphorus in Animal Manure from a Livestock-Intensive Region to an Arable Region: Exploration of Environmental Consequences. Sustainability 2017, 9, 595. [Google Scholar] [CrossRef]
  20. DIN. Environmental Management—Life Cycle Assessment—Principles and Framework; German Institute for Standardizition, Beuth Verlag GmbH: Berlin, Germany, 2006; Volume DIN EN ISO 14040:2006. [Google Scholar]
  21. DIN. Environmental Management—Life Cycle Assessment—Requirements and Guidelines; German Institute for Standardizition, Beuth Verlag GmbH: Berlin, Germany, 2006; Volume DIN EN ISO 14044:2006. [Google Scholar]
  22. Börjesson, P.; Berglund, M. Environmental systems analysis of biogas systems—Part II: The environmental impact of replacing various reference systems. Biomass Bioenergy 2007, 31, 326–344. [Google Scholar] [CrossRef]
  23. Klöpffer, W.; Grahl, B. Ökobilanz (LCA): Ein Leitfaden für Ausbildung und Beruf; Wiley: Weinheim, Germany, 2012. [Google Scholar]
  24. Rehl, T.; Müller, J. Life cycle assessment of biogas digestate processing technologies. Resour. Conserv. Recycl. 2011, 56, 92–104. [Google Scholar] [CrossRef]
  25. KTBL. Betriebsplanung Landwirtschaft 2010/2011; Kuratorium für Technik und Bauwesen in der Landwirtschaft e.V.: Darmstadt, Germany, 2010; Volume 22. [Google Scholar]
  26. FNR. Leitfaden Biogas, Von der Gewinnung bis zur Nutzung; Fachagentur Nachwachsende Rohstoffe: Gülzow, Germany, 2013; Volume 6. [Google Scholar]
  27. KTBL. Fautzahlen für die Landwirtschaft, 14th ed.; Kuratorium für Technik und Bauwesen in der Landwirtschaft e.V.: Darmstadt, Germany, 2009. [Google Scholar]
  28. Möller, K.; Schulz, R.; Müller, T. Mit Gärresten Richtig Düngen, Aktuelle Informationen für Berater. Available online: https://plantnutrition.uni-hohenheim.de/fileadmin/einrichtungen/plantnutrition/Duengung_mit_Bodenchemie/Leitfaden-Berater09092009.pdf, (accessed on 5 March 2019).
  29. KTBL. Faustzahlen Biogas, 3rd ed.; Kuratorium für Technik und Bauwesen in der Landwirtschaft e.V. (KTBL): Darmstadt, Germany, 2013. [Google Scholar]
  30. Dressler, D.; Loewen, A.; Nelles, M. Life cycle assessment of the supply and use of bioenergy: Impact of regional factors on biogas production. Int. J. Life Cycle Assess. 2012, 17, 1104–1115. [Google Scholar] [CrossRef]
  31. Lansche, J.; Müller, J. Life cycle assessment of energy generation of biogas fed combined heat and power plants: Environmental impact of different agricultural substrates. Eng. Life Sci. 2012, 12, 313–320. [Google Scholar] [CrossRef]
  32. Brentrup, F.; Küsters, J.; Lammel, J.; Kuhlmann, H. Methods to estimate on-field nitrogen emissions from crop production as an input to LCA studies in the agricultural sector. Int. J. Life Cycle Assess. 2000, 5, 349–357. [Google Scholar] [CrossRef]
  33. BMU. Erneuerbare Energien in Zahlen—Nationale und Internationale Entwicklung; Bundesministerium für Umwelt, Naturschutz und Reaktorsicherheit (BMU): Bonn, Germany, 2012; Volume 1.
  34. Wolf, M.; Pant, R.; Chomkhamsri, K.; Sala, S.; Pennington, D. ILCD Handbook—Towards More Sustainable Production and Consumption for a Resourceefficient Europe; JRC Reference Report; European Commission-Joint Research Centre—Publication Office: Luxembourg, 2012. [Google Scholar]
  35. De Meester, S.; Demeyer, J.; Velghe, F.; Peene, A.; Van Langenhove, H.; Dewulf, J. The environmental sustainability of anaerobic digestion as a biomass valorization technology. Bioresour. Technol. 2012, 121, 396–403. [Google Scholar] [CrossRef]
  36. Bacenetti, J.; Duca, D.; Negri, M.; Fusi, A.; Fiala, M. Mitigation strategies in the agro-food sector: The anaerobic digestion of tomato purée by-products. An Italian case study. Sci. Total. Environ. 2015, 526, 88–97. [Google Scholar] [CrossRef]
  37. IPCC. Climate Change 2007: Synthesis Report. Contribution of Working Groups I, II and III to the Fourth Assessment Report of the Intergovernmental Panel on Climate Change; IPCC: Geneva, Switzerland, 2007. [Google Scholar]
  38. Struijs, J.; Beusen, A.; van Jaarsveld, H.; Huijbregts, M.A.J. Aquatic Eutrophication. In ReCiPe 2008 A Life Cycle Impact Assessment Method Which Comprises Harmonised Category Indicators at the Midpoint and the Endpoint Level, 1st ed.; Goedkoop, M., Heijungs, R., Huijbregts, M.A.J., De Schryver, A., Struijs, J., Van Zelm, R., Eds.; Available online: https://www.leidenuniv.nl/cml/ssp/publications/recipe_characterisation.pdf (accessed on 5 March 2019).
  39. Kiesel, A.; Wagner, M.; Lewandowski, I. Environmental Performance of Miscanthus, Switchgrass and Maize: Can C4 Perennials Increase the Sustainability of Biogas Production? Sustainability 2017, 9, 5. [Google Scholar] [CrossRef]
  40. Bachmaier, J.; Effenberger, M.; Gronauer, A. Greenhouse gas balance and resource demand of biogas plants in agriculture. Eng. Life Sci. 2010, 10, 560–569. [Google Scholar] [CrossRef]
  41. Jacobs, A.; Auburger, S.; Bahrs, E.; Brauer-Siebrecht, W.; Christen, O.; Götze, P.; Koch, H.-J.; Rücknagel, J.; Märländer, B. Greenhouse gas emission of biogas production out of silage maize and sugar beet—An assessment along the entire production chain. Appl. Energy 2017, 190, 114–121. [Google Scholar] [CrossRef]
  42. Rehl, T.; Lansche, J.; Müller, J. Life cycle assessment of energy generation from biogas—Attributional vs. consequential approach. Renew. Sustain. Energy Rev. 2012, 16, 3766–3775. [Google Scholar] [CrossRef]
  43. Vaneeckhaute, C.; Lebuf, V.; Michels, E.; Belia, E.; Vanrolleghem, P.A.; Tack, F.M.G.; Meers, E. Nutrient Recovery from Digestate: Systematic Technology Review and Product Classification. Waste Biomass Valorization 2017, 8, 21–40. [Google Scholar] [CrossRef]
Figure 1. System boundaries.
Sustainability 11 02601 g001
Figure 2. Mass and energy flows of the reference scenario (RF).
Sustainability 11 02601 g002
Figure 3. Recovery of phosphorous and nitrogen from separated digestate.
Sustainability 11 02601 g003
Figure 4. Mass and energy flow of the nutrient recovery scenario (NR).
Sustainability 11 02601 g004
Figure 5. Lactic acid extraction by bipolar electrode dialysis (LAE) or by HCl (LAH).
Sustainability 11 02601 g005
Figure 6. Mass and energy flows of the lactic acid scenario (LA).
Sustainability 11 02601 g006
Figure 7. Global warming potential (GWP) per FU (1 kWh electric energy fed into the grid) of the reference scenario (RF).
Sustainability 11 02601 g007
Figure 8. Substrate specific global warming potential (GWP) of energy crop production per 1 kWhel electricity output.
Sustainability 11 02601 g008
Figure 9. Global warming potential (GWP) per FU (1 kWh electric energy fed into the grid) of nutrient recovery from the digestate.
Sustainability 11 02601 g009
Figure 10. Global warming potential (GWP) per FU (1 kWh electric energy fed into the grid) of lactic acid extraction by HCl (LAH) or by bipolar electrode dialysis (LAE).
Sustainability 11 02601 g010
Figure 11. Total global warming potential (GWP) per FU (1 kWh electric energy fed into the grid) of reference scenario (RF), nutrient recovery scenario (NR) and lactic acid extraction scenario with HCl (LAH) and electrode dialysis (LAE).
Sustainability 11 02601 g011
Figure 12. Primary energy demand (PED) per FU (1 kWh electric energy fed into the grid) of the reference scenario (RF), nutrient recovery scenario (NR) and lactic acid extraction scenario with HCl (LAH) and electrode dialysis (LAE).
Sustainability 11 02601 g012
Figure 13. Eutrophication potential (EP) per FU (1 kWh electric energy fed into the grid) of reference scenario (RF), nutrient recovery scenario (NR) and lactic acid extraction scenario with HCl (LAH) and electrode dialysis (LAE).
Sustainability 11 02601 g013
Table 1. Fresh matter yield (FM), dry matter content (DM); organic dry matter content (oDM), biogas yield and methane content (CH4) of chosen feedstock substrates.
SubstrateYield (FM), t∙ha−1 (a)DM, % (b)oDM, % (DM) (b)Biogas Yield, m3∙kg−1 oDM (b)CH4 Content, % (b)
Maize5035950.6552
Clover grass4235900.6053
Triticale4035950.6253
Manure-10800.3855
(a) KTBL [25]; (b) FNR [26].
Table 2. Nutrient demand and supply of energy crops.
Crop Demand (kg·ha−1)Digestate Supply (m3·ha−1)Additional Mineral Fertilizer Supply (kg·ha−1)
NP2O5K2O (b) NP2O5K2O
Maize180–200 (a)90 (a)2403053.2--
Clover grass192 (b)84 (b)26050---
Triticale200 (b)84 (b)1703063.2--
(a) Möller et al. [28]; (b) KTBL [25].
Table 3. Modelling parameters for the ensiling process.
ParameterUnitMaizeTriticale and Clover Grass
Removal rate (a)m∙week−14.242.16
Silo filling height (b)m3.52.5
Width of silosm126
Length of silosm8080
Number of silos-55
Ensiling foil (c)t1.071.07
Densitykg∙m−3950950
Strength (d)µm150150
Durabilitya11
Ensiling rate, fresh mattert∙h−16060
Driving speed during compactionkm∙h−144
Compaction weightt2020
(a) Removal rate has to be more than 2 m silo length per week to prevent quality losses at the cutting Surface. (b) Reduced to 2.5 m for triticale and clover grass for ensuring minimum weekly removal rate. (c) Combination of cover layer and under-layer foil. (d) 115 µm for cover layer, 35 µm for under-layer foil.
Table 4. Operational parameters used for modelling the biogas plant.
ParameterUnitValue
Total volume of digester (a)m32400
Total volume secondary digester (b)m35843
Total hydraulic retention timed125
In digesterd80
In secondary digesterd45
Full load hoursh·a−18030
Energy concept
Auxiliary electricity demand (c)%7.4
Internal heat demand (d)%25
Exported heat%40
(a) Based on maximum organic load of 3.5 kg oDM∙m−3∙d−1. (b) German legislation demands a gas-tight storage period of 150 days and a storage capacity for the digestate of 180 days. (c) Based on total electricity production, KTBL [29]. (d) Based on total heat production.
Table 5. Operational parameters of the nutrient recovery process.
Power Requirement for 200 L·h−1 Liquid FractionChemical Demand, Per m3 of Fresh Digestate
Separation8 kWel-
Acidification0.21 kWel22.6 kg H2SO4
Filtering3.3 kWel-
P-Precipitation0.21 kWel7.9 kg NaOH
SHS dryer21.6 kWth-
N-Recovery-18.6 kg H2SO4
Calculations are based on data obtained from GOBi project [8].
Table 6. Consumption of energy and chemicals in lactic acid extraction by HCl (LAH) or by bipolar electrode dialysis (LAE).
LAHLAE
Energy demand
Bipolar electrode dialysis-30 kWh
Separation of organic acids and anorganic salts15 kWh10 kWh
Separation of organic and non-polar compounds10 kWh10 kWh
Chemical demand
HCl20 L-
Data was obtained from the GOBi project [8].
Table 7. Mass flows of the reference scenario, the nutrient recovery scenario and the lactic acid scenario.
ParameterUnitReference ScenarioNutrient Recovery ScenarioLactic Acid Scenario
LAHLAE
Energy from biogas
Electricity productionMWh3880388027602760
Heat productionMWh4580458032603260
Waste heatMWh1600-11401140
External utilized heatMWh1830144013001300
Bio-refinery products
Lactic acidt--111111
Ammonia sulfatet-25--
P-Saltst-1--
Press juice from silagest--41804180
Biogas substrates
Manuret2200220011601160
Maizet6500650033003300
Triticalet11001100--
Clover grasst1100110013201320
Digestate
Fertilizing energy cropst7070687046304630
Fertilizing cash cropst1680---
Nutrient recoveryt-1880--
Mineral fertilizer demand
N-eq.t10101616
K2O-eq.t--2424
P2O5-eq.t--99
Energy demand
Auxiliary electricityMWh287414440544
Fermenter heatingMWh11401140815815
Process heatMWh-1990--
Chemical demand
Hydrochloric acidt--99-
Sulfuric acidt-77.5--
Sodium hydroxidet-14.9--

