Characterizing the Embodied Carbon Emissions Flows and Ecological Relationships among Four Chinese Megacities and Other Provinces


1
China Academy of Transportation Sciences, Beijing 100029, China
2
School of Business Administration, China University of Petroleum, Beijing 102249, China
*
Author to whom correspondence should be addressed.
Sustainability 2019, 11(9), 2591; https://doi.org/10.3390/su11092591
Submission received: 13 February 2019
/
Revised: 19 April 2019
/
Accepted: 27 April 2019
/
Published: 5 May 2019
(This article belongs to the Special Issue The Dynamic Relationship between Energy Consumption, Greenhouse Gas (GHG) Emissions, and Economic Growth)
Abstract
:China has been undergoing a rapid process of urbanization. The urbanization rate, increased from 35% in 2000 to 59.58% in 2018, and is expected to increase to 70% by 2030. As Chinese cities consumed approximately 77% of China’s total energy and emitted about 81% of all carbon emissions in 2017, it has become increasingly necessary to quantitatively analyze city-level carbon emissions and related issues. The present study adopted single regional and multi-regional input-output (MRIO) models to analyze the features of four Chinese municipalities (Beijing, Tianjin, Shanghai and Chongqing) and calculate their embodied carbon emissions (ECE). In addition, we used ecological relationship concepts to analyze the relationships between those municipalities and other regions based on ECE flows through an ecological network analysis (ENA) model. The results show that all four megacities were net importers of ECE, and their imported ECE typically flowed from nearby geographic regions. In addition, exploitation was the main ecological relationship between these four megacities and China’s other regions. Knowing the detailed data related to ECE, ECE flows and the ecological relationships among these megacities could help policymakers establish more comprehensive environment-related policies, which are crucial for achieving sustainable development targets.
1. Introduction
As a gathering place of production, life and people, cities serve as the main drivers of energy consumption and carbon emissions, accounting for 60% of world energy consumption and 73% of global carbon emissions [1,2]. This is especially true for China, as the latest data show that China has experienced a process of rapid urbanization [3,4]. Based on the size of the urban population, the urbanization rate—which is measured as the percentage of urban residents nationwide—increased from 35% in 2000 to 59.58% in 2018 [5], while a plan to increase the urbanization rate to 70% by 2030 exists [6]. Because of the high population density and excessive industrial agglomeration in China [7], cities will need to play an important role in decreasing China’s total carbon emissions and maintaining sustainable development.
With the rapid processes of urbanization and industrialization, China has become the world’s largest energy consumer and carbon emitter, accounting for 23.7% of world energy consumption and 29.5% of global carbon emissions in 2017 [8]. Because Chinese cities consumed about 77% of China’s total energy and emitted about 81% of carbon emissions in 2017 [9], it has become increasingly necessary to quantitatively analyze city-level carbon emission-related issues. China’s cities, especially megacities such as Beijing, Tianjin, Shanghai and Chongqing, produce massive amounts of direct carbon emissions. The total volume of the carbon emissions of these four cities in 2016 was 927 Mt (million tons), which accounted for almost 9% of China’s total carbon emissions [10]. Meanwhile, as the center of China’s economic activity, these four megacities exchange large quantities of goods and products with other regions, generating massive amounts of carbon emission flows among them [11]. This trading of goods not only separates the emissions of producers and consumers geographically, but also transfers environmental effects between the producers and consumers of carbon emissions [12]. Considering the fact that there are large quantities of commercial trade flows between megacities and other regions in China, carbon emissions duties are transferred from the consumer to the producer [13]. Researchers need to consider both direct carbon emissions and interregional carbon emission flows when analyzing city-level issues [14].
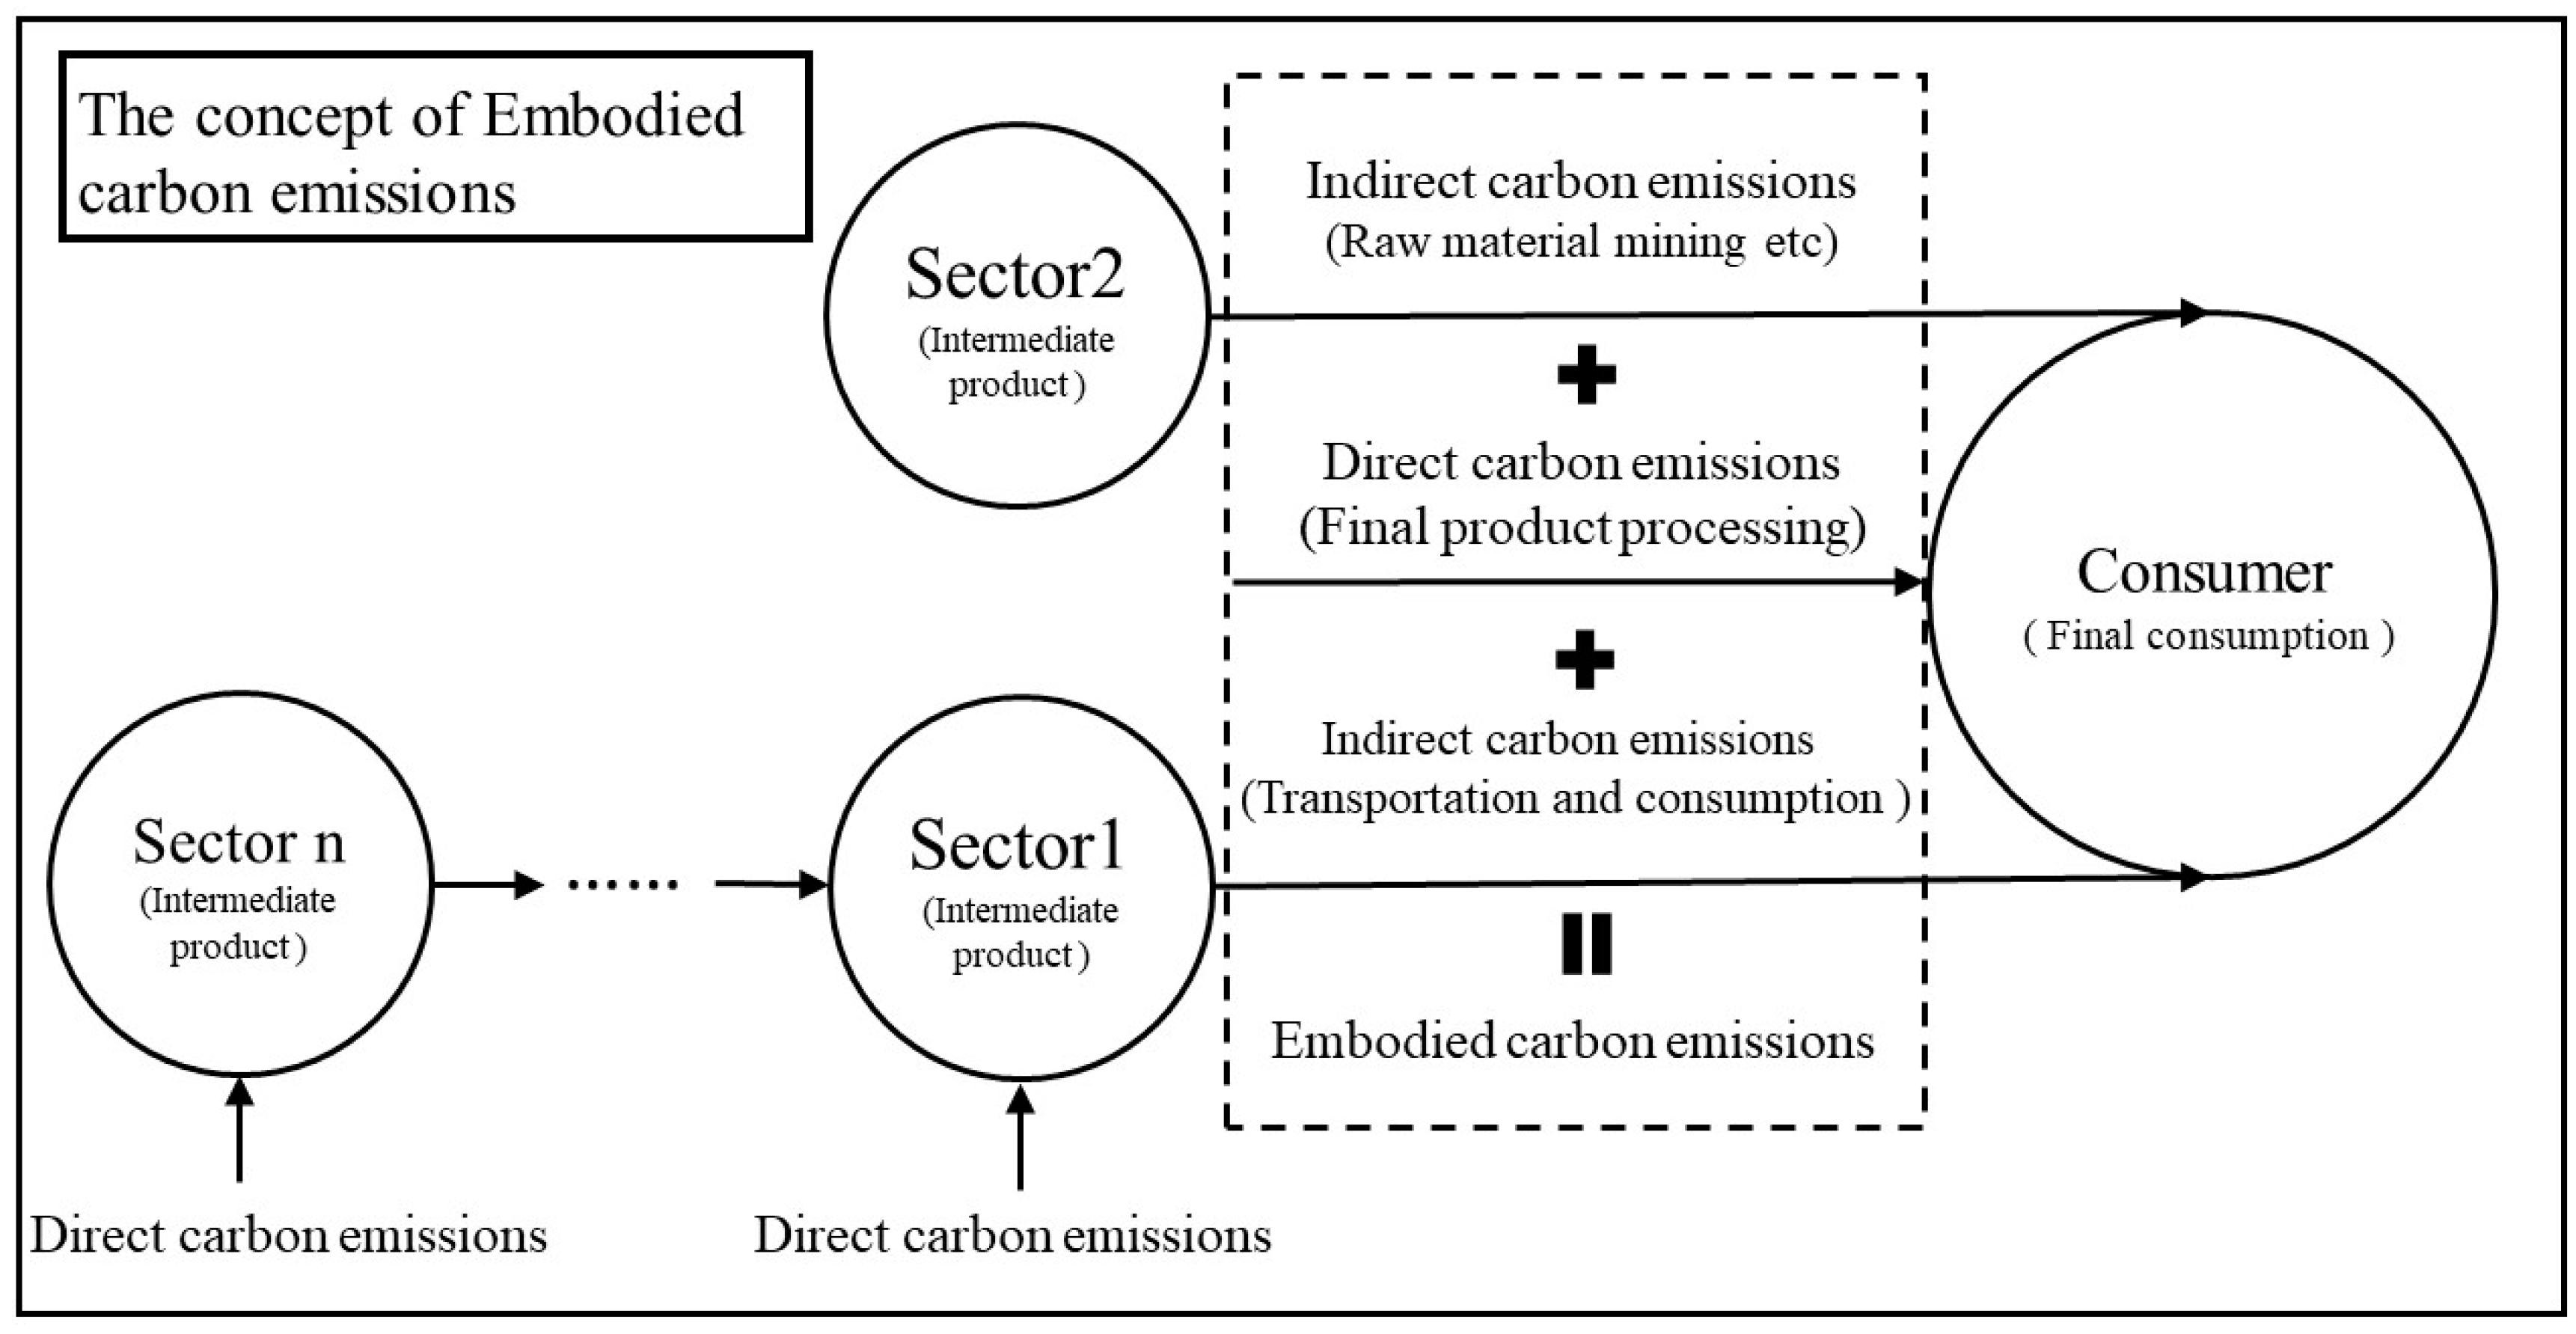
As megacities have a relatively manageable area, both carbon emission reduction tasks and carbon emission reduction-related regulations and standards are easier to implement compared with China’s provinces [15]. These four megacities were the main carbon emission sources in China and should take responsibility for their corresponding carbon emission reduction duty [16]. Since these megacities have a large amount of trade exchange with other regions in China, there will be massive embodied carbon emissions (ECE), which refer to the carbon dioxide directly or indirectly emitted throughout the production chain in order to obtain a certain product. The definition of embodied carbon emissions is shown in Appendix A, Figure A1. In addition, ECE refers to the total amount of carbon emissions during the entire process of processing, manufacturing and transportation. To fully understand the ECE among economic activities, various previous research studies [17,18] have used fundamental ECE calculation models based on input-output analysis (IOA), as proposed by Leontief, which can access ECE from a systematic perspective [19]. IOA can construct an interacted carbon flow network in a country and trace ECE back to the sources [17]. Accurate data of direct carbon emissions, ECE and ECE flows, therefore play a fundamental role in making carbon emission reduction policies and determining whether a megacity should take carbon emission reduction responsibility for a certain province. In this paper, single regional and multi-regional input-output (MRIO) models were adopted to analyze the features of the four Chinese municipalities and calculate their ECE. Ecological network analysis (ENA) was used to analyze the ecological relationships between these megacities and other regions based on their internal ECE flows. As a result, we analyzed the characteristics of these four megacities and compared the differences in ECE, ECE flows and ecological relationships. Understanding the detailed data of ECE, ECE flows and ecological relationships among these megacities can help researchers and policy makers to establish more comprehensive carbon emission reduction plans for megacities.
The remainder of this paper is organized as follows: Section 2 presents the related literature; Section 3 introduces research models and detailed data analysis methods; the research results are presented in Section 4; Section 5 compares the research calculations related to the four Chinese megacities and finally, the conclusions are shown in Section 6.
2. Literature Review
Researchers are currently studying city-level trends by focusing on topics related to direct carbon emissions, which can be divided into three categories. First, some researchers have analyzed accounting issues related to city-level carbon emissions. For example, Bi et al. calculated the amount of carbon emissions produced in Nanjing and analyzed the potential this city had related to carbon emissions reduction (CER) [20]. Dhakal estimated the amount of transformed carbon emissions based on data from urban areas in China [21]. Mi et al. calculated carbon emissions consumed, imported and exported by 13 large Chinese cities based on consumption accounting [22]. Tan et al. estimated the potential carbon emission reduction available for Chongqing [23]. Second, the driving force and factors influencing city-level carbon emissions have been analyzed by some scholars. For example, Su et al. quantitatively assessed the driving forces of city-level carbon emissions in China, which could help policymakers reduce future carbon emission rates [24]. Liu et al. calculated the driving forces of carbon emissions caused by rapid economic development in Chinese megacities [25]. Wei et al. decomposed the driving forces of carbon emissions in Beijing and quantitatively analyzed the influencing factors [26]. Third, some studies have focused on simulating city-level carbon emission reduction policies in China. Hao et al. assessed the carbon emission reduction potential of Guangyu and analyzed carbon emission reduction policies under different types of carbon emission requirements [27]. Lehmann put forwarded five carbon emission reduction suggestions for policymakers who desire to develop a green city [28]. Lo analyzed the gap in implementing low-carbon policies in Changchun [29].
To develop a comprehensive understanding of carbon emission flows, the concept of ECE has been previously introduced to help researchers analyze carbon emissions across the entire production and consumption lifecycle. Many researchers have focused on ECE accounting studies, including international [30,31], interprovincial [32,33] and industrial-level accounting [34,35], which provided detailed data for decision makers to help them implement climate policy from a consumption-based perspective [17,36]. In addition, some researchers have developed an ecological network based on certain material flows to determine the specific ecological relationships in a carbon emission trade. Zhang et al. described the ecological relationships among China’s seven regions based on energy flows, providing baseline data that can be used to evaluate the effects of economic development policies among these regions [18]. Zhang et al. studied the ecological relationships among Beijing, Tianjin and Hebei Province with the goal of identifying whether this Jing-Jin-Ji (Beijing-Tianjin-Hebei) urban agglomeration is being developed sustainably [19]. Wang et al. analyzed the ecological connections and properties among the provinces of China based on water and energy flows [32].
Specifically, some researchers have calculated the amount of direct carbon emissions, as well as carbon emissions embodied in trade, and analyzed their driving force at the city level. Few studies, however, have focused on calculating the amount of ECE at the city level and the city level ECE flows in the entire system. Parshall’s study found that the increased energy consumption and direct carbon emissions caused by urban expansion could be offset by an improvement in energy efficiency and emission intensity [37]. For the four Chinese megacities, considering that they consumed a large amount of ECE, their direct energy consumption and carbon emissions could not indicate those megacities are higher in energy efficiency and lower in carbon emissions. Therefore, the question is what is its influence on ECE flows between the four megacities and other Chinese regions.
3. Methodology and Data
In this paper, we used three kinds of models to calculate embodied carbon emission flows and the ecological relationships among the four Chinese megacities. Firstly, the initial model is the embodied carbon emission calculation model, based on the input-output table, which is used to calculate the ECE in a sector. Secondly, considering that the multi-regional input-output table contains the input and output relationships between different sectors in different provinces (megacities), we introduced the multi-regional input-output model, which is based on the multi-regional input-output table, to quantify embodied carbon emissions flows between different regions. Thirdly, ENA is derived from the input-output models, which can be used to determine the relationships among the nodes of the network based on material flows. ENA can visualize the import and export ECE in a system, which could broaden the research view of ECE flows [38].
3.1. ECE Calculation Model
The basic input output table is shown in Figure 1.
The basic equation can be expressed as:
where is the intermediate use of sector j supplied by sector i; represents final consumption of sector i; is the total output of sector i.
The Leontief inverse matrix can be expressed as:
where ; ; I represents the identity matrix ; A represents the direct consumption coefficient matrix, and
The ECE calculation equation can be expressed as:
where is the total output of sector i; is the direct energy consumption index of sector i; is the carbon emission factor of sector i.
3.2. MRIO Model
The MRIO analysis has been widely adopted to quantify ECE flows between different regions [39,40]. The basic MRIO table is shown in Figure 2.
In the MRIO table, different regions are connected by interregional trade, , which is shown in Figure 2. The fundamental framework of MRIO analysis can be expressed as:
where is the technical coefficient matrix consisting of the elements of , which can be calculated by . is the intermediate use of sector j in region s supplied by sector i in region r; is the total output of sector j in region s; is the final demand for goods of sector i from region r; consists of .
The total ECE of sector i in region r can be expressed as:
where is the ECE intensity of output from sector i in region s; is the final demand of sector i in region r.
In this paper, we use the Chinese MRIO table as the data source for MRIO analysis. For simplicity, we introduce the following description:
where , , and are the transposes of , and .
ECE of a specific region can be expressed as matrix notation:
The detailed method and calculation process can be found in the study by Liu et al. [41].
3.3. ENA
In this paper, we tried to describe the relationships between four Chinese municipalities and other regions of China based on ECE flows. The detailed models are shown as follows: first, we calculated the ratio () of direct carbon flows () to total flow flux into a certain node i, which can be expressed as shown below [41,42]:
where which represents the total ECE flow from a system into node i, and is the original input. Figure 3 shows a containing node and its simple flow.
fij represents a flow from node j to node i, and l represents the path length (the number of flows between nodes) before a flow reaches its destination node.
We use , to represent the direct interaction flow matrices. The dimensionless integral flow intensity matrix can be expressed as follows:
where is the non-dimensional integral ECE flow among nodes in the network; indicates that the initial and end points of the node flow Self node; means that ECE flow passes one node; indicates that the ECE flow passes two nodes, and so on.
Then, the different relationships between nodes in a system were calculated as follows:
where are the elements of D, which represent the utility of the net flow from node j to node i. The matrix U represents the intensity and pattern of integrated actions between any of the compartments in the network (e.g., the utility ). The path lengths range from 0 (flows of carbon within a node) to infinity.
The positive and negative results of U determine the relationships between different nodes. Four types of relationships exist between two nodes. Exploitative relationships (+, −) and control relationships (−, +) reflect situations where one node benefits from the other node and when the two nodes have trade flows [43]. Competitive relationships (−, −) exist as relationships that reflect a situation where two nodes compete with a specific material flow. Mutualism relationships (+, +) exist when both nodes benefit from the material flows between them [43,44].
3.4. Data
In this paper, we introduced ECE to analyze the emissions feature of four Chinese municipalities and their relationships with other Chinese nodes. Based on ECE calculation models, detailed energies related to data exist as needs. The energy consumption data employed here, including data related to the use of raw coal, crude oil, natural gas, etc., were obtained from the Chinese Energy Statistical Yearbook 2013. The value of carbon emission factors of different energies come from the Intergovernmental Panel on Climate Change database and the latest Chinese MRIO table for 2012 was published in 2017.
4. Results
4.1. The Characteristics of Four Chinese Municipalities
Only four Chinese municipalities, Beijing, Tianjin, Shanghai and Chongqing, are directly accountable to the Chinese central government. These municipalities, however, have considerably different features.
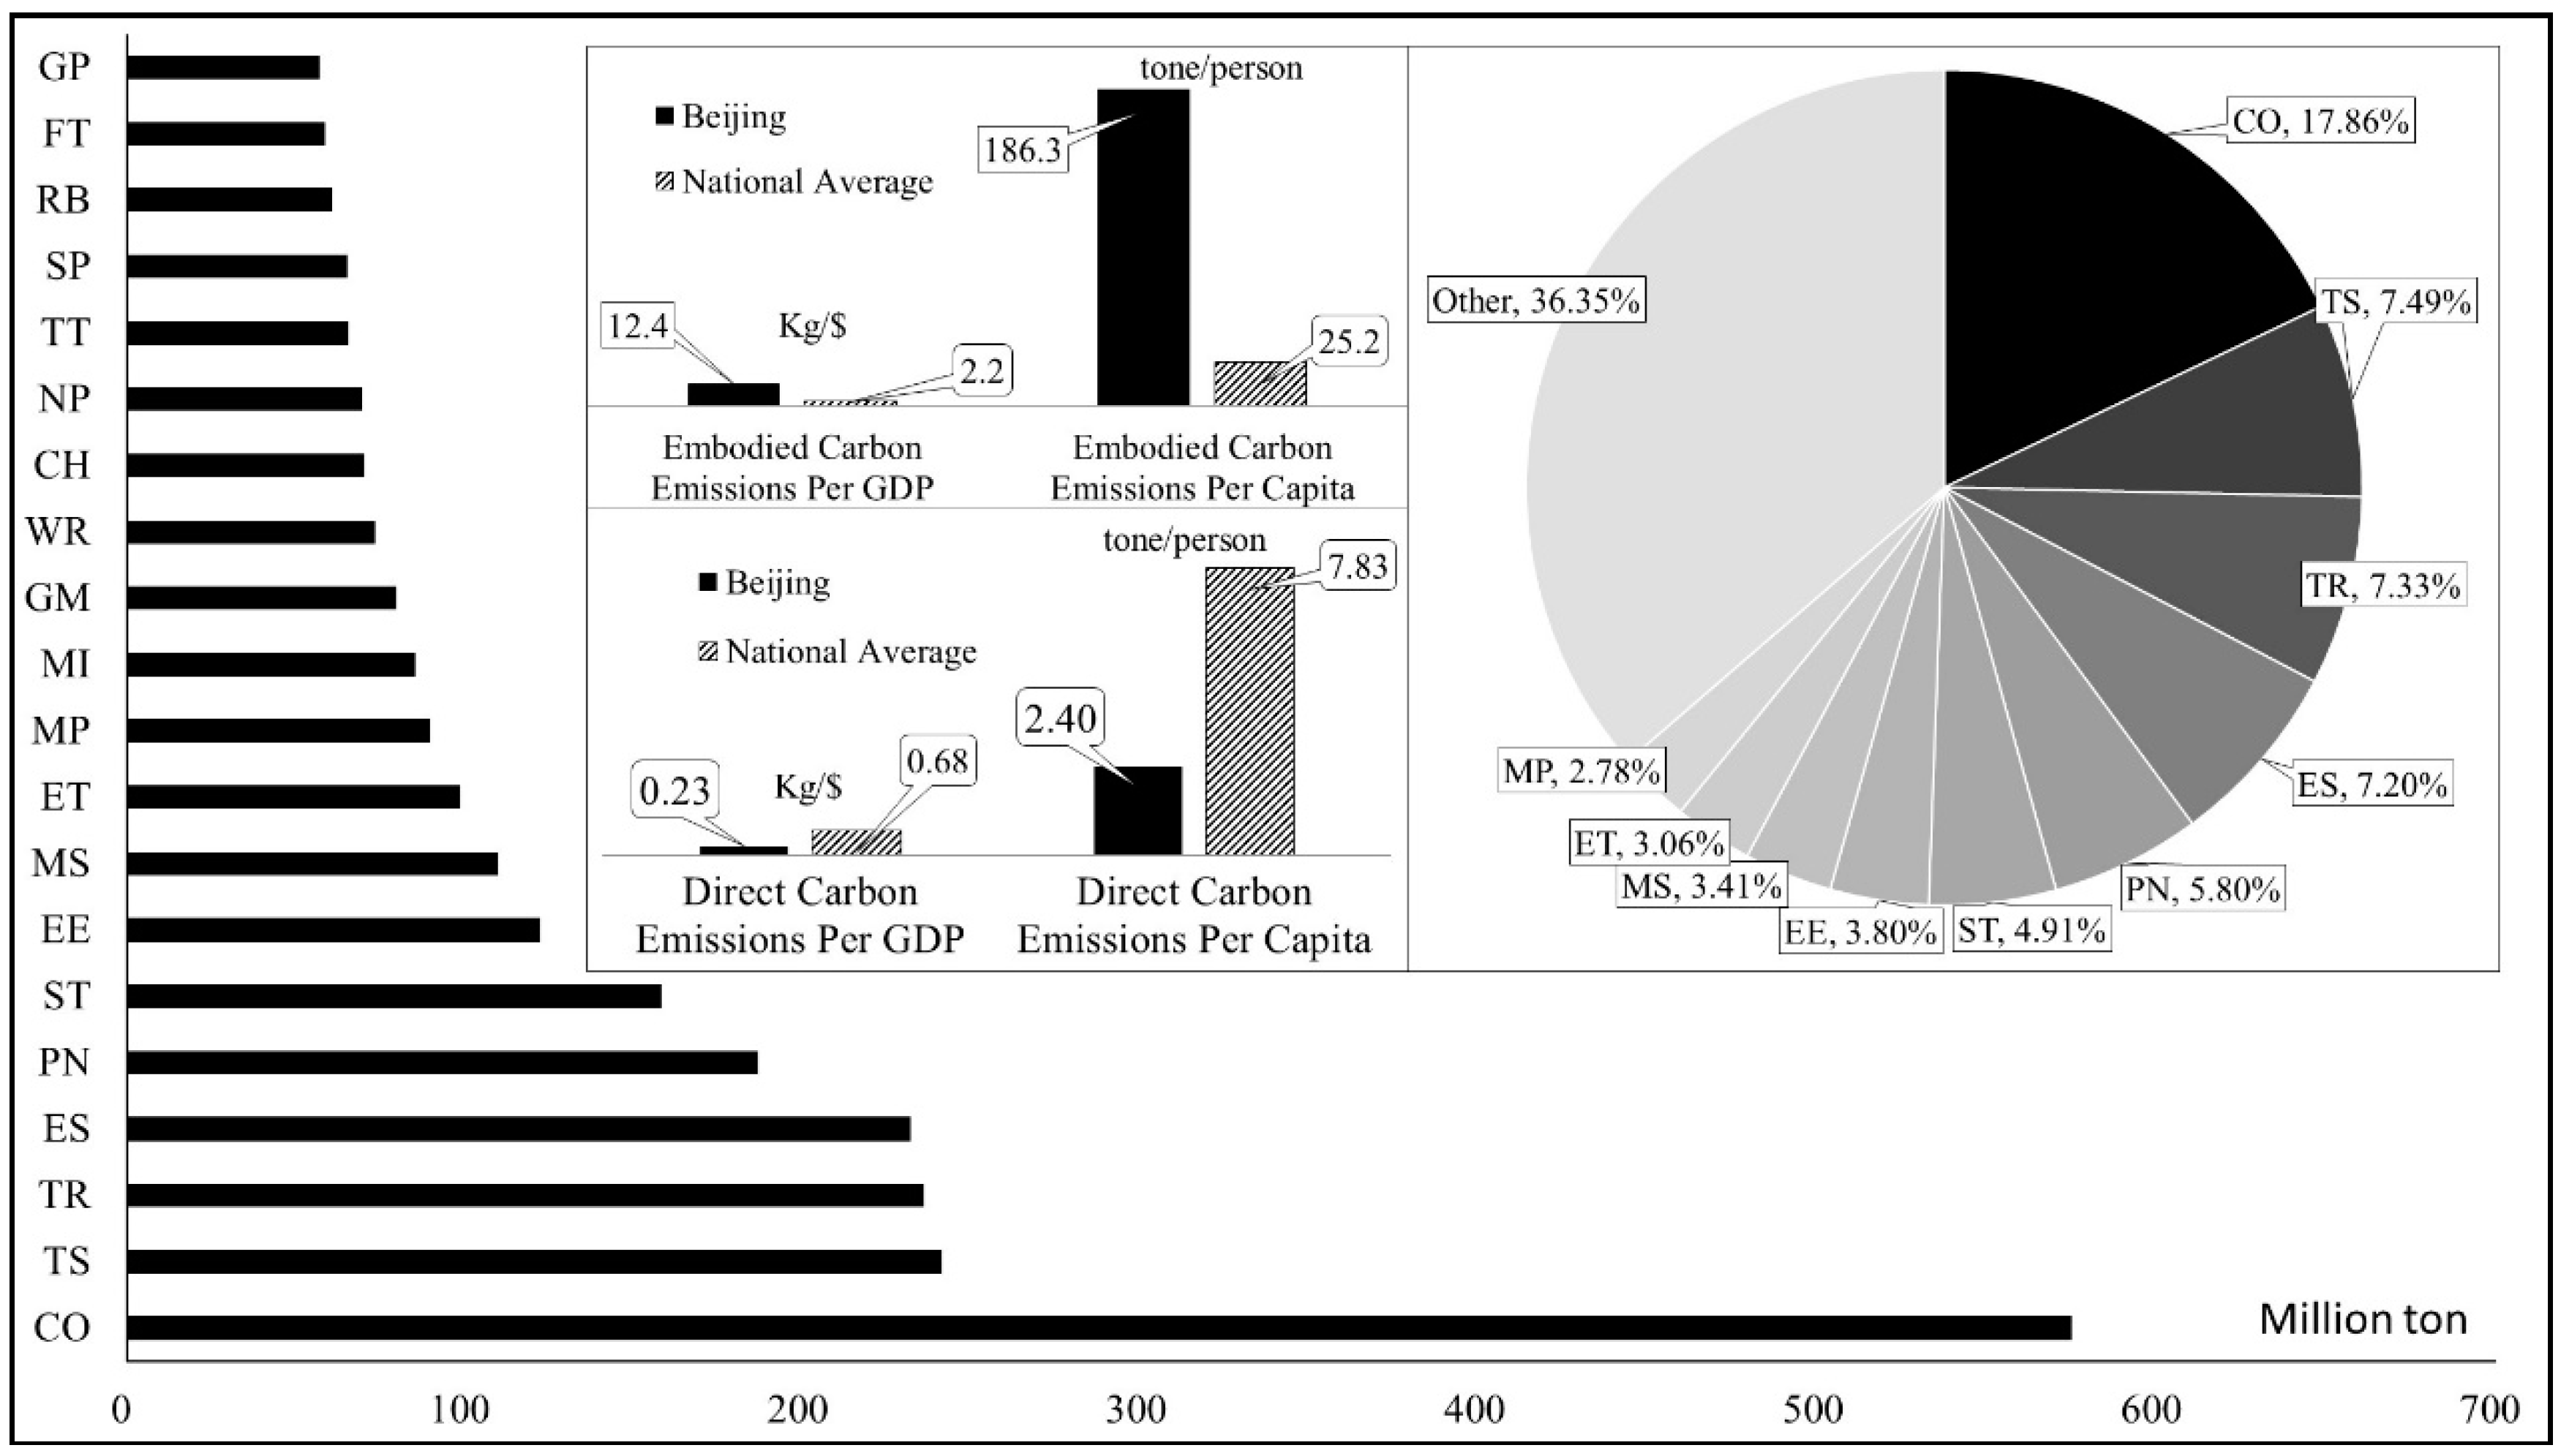
Figure 4 shows Beijing’s detailed emissions information. In 2012, Beijing consumed 0.87 billion tons of ECE. Specifically, construction (CO) was the largest ECE sector in Beijing, accounting for 17.8% of the total ECE amount. A large number of infrastructure projects have been completed since 2000 and the CO industry has seen a rapid increase in production. However, the CO industry, as an energy- and labor-intensive industry, consumes a huge amount of energy across its entire lifecycle, which contributes to consuming a massive amount of ECE. As the center of China’s transportation and logistics systems, the transportation, warehousing and postal services industry (TS) consumed the second largest amount of ECE in Beijing. The transportation and equipment industry (TR) ranked third among ECE consumption industries of Beijing. Currently, TR is the pillar industry of Beijing, even though it is an energy-intensive industry that consumes massive amounts of ECE during its entire lifecycle. Although the total figure of Beijing’s direct carbon emissions (DCE) per gross domestic product GDP) is only one third of the national average, the figure for Beijing’s ECE per GDP (ECE/GDP) is five times larger than the national average. The contrasting figure between DCE and ECE per capita in Beijing and the national average was even larger. These figures indicate that Beijing consumed a huge amount of immediate goods as part of its overall economic activity.
From an industry perspective, Tianjin mainly produces sub-industrial goods within the Jing-Jin-Ji urban agglomeration. Specifically, the smelting and pressing of metals (MS), CO, and chemical production (CH) industries were the largest ECE consumption sectors in Tianjin in 2012 (Figure 5). Despite their relatively high carbon use and production intensity, these industries were the development priority for this area. As a harbor city, Tianjin is the most important shipping core area in North China. Thus, it became the production base of ship manufacturing in China, requiring a large amount of production material from the MS industry. Because the process of urbanization has occurred rapidly, Tianjin’s CO industry has been well developed for decades. These main ECE consumption sectors belong to a group of final goods production industries, which produce more ECE than DCE. As a result, the figure of DCE/GDP between Tianjin and the national average is smaller than the figure of ECE/GDP between Tianjin and the national average.
Shanghai, as China’s most important hub for international trade, has the world largest and busiest port (in Figure 6). Due to its geographic advantage, related industries such as TS, CH, TR and petroleum processing, coking and nuclear fuel processing (PN) became the main ECE consumption sectors, accounting for 43% of total ECE consumption. The DCE/GDP of Shanghai was only 0.48 Kg/$, smaller than the figure of the national average (0.68 Kg/$). Meanwhile, the ECE/GDP of Shanghai was 14.8 Kg/$, almost seven times larger than the figure of the national average. The relatively smaller DCE/GDP figure indicates that Shanghai’s energy efficiency was quite high and industries also had advanced technologies. The relatively large ECE/GDP figure reflects the fact that Shanghai’s industry structure is mainly focused on high value-added manufacturing and the tertiary industry, which consumed more immediate goods in their production cycles.
Chongqing, one of China’s four independent municipalities, has the largest population and area of the four. The urbanization rate, however, only reached 48% in 2012 [5]. As a result, the DCE/GDP of Chongqing was lower than the figure of the national average in 2012. The ECE/GDP was 5.6 Kg/$, only twice the national average. Specifically, Chongqing’s ECE mainly focused on high ECE intensity industries such as CO, TR and MS, which consumed over 51% of the total ECE of Chongqing in 2012 (Figure 7). Note that the communication equipment, computers and other electronic equipment (EE) and the electric equipment and machinery manufacturing (ET) industries are the core industries Chongqing plans to develop in the future.
4.2. ECE Flows
According to MRIO models, all of the ECE flowed among the four megacities and other regions of China (mainly referred to as provinces). The total exported ECE of the four megacities accounted for 18.4% of China’s total exported ECE. This figure shows that the ECE flows between the four megacities and China’s provinces have a considerable impact on China’s overall emissions system. In this section, we will show the detailed information of these ECE flows.
Beijing was a net ECE importer in 2012 (Figure 8), importing almost 1.7 times the amount of ECE than it exported. From the perspective of Beijing’s imported ECE, Hebei is Beijing’s largest ECE provider, giving approximately 18%, while Inner Mongolia, Liaoning, Tianjin and Shandong ranked second to fifth, respectively. These regions all lie geographically close to Beijing and transfer a large amount of immediate goods to Beijing. For example, Hebei, as a steel production base, exports a considerable amount of steel to Beijing for the use of the CO, TS and TR industries. A similar situation occurs in Inner Mongolia, Liaoning, Tianjin and Shandong where they all export immediate goods to Beijing, which supports Beijing’s daily economic activity.
Similar to Beijing’s situation, Hebei served as the largest ECE importing province among Tianjin’s ECE trade with other regions of China, accounting for 14% of total imported ECE (Figure 8). Most immediate goods produced by Hebei contain large amounts of ECE. However, Hebei is geographically close to Tianjin and is its largest trade partner, while Inner Mongolia, Liaoning, Henan and Jilin ranked second to fifth, respectively. The trade relationships between these provinces and Tianjin was similar to the relationship between Hebei and Beijing. For example, over 65% of the electricity from Tianjin was imported from Inner Mongolia in 2012 [9].
Shanghai was a net ECE importer and had the largest amount of total imported and exported ECE among the four megacities (Figure 8). The total amount of ECE imported to Shanghai was 1.63 larger than the amount of ECE exported. Jiangsu exported the largest ECE to Shanghai, accounting for 17% of its total imports. Zhejiang ranked second among all ECE importers to Shanghai, with 14% of total imports. When it comes to Shanghai’s exports, a similar situation was found. Jiangsu and Zhejiang, the two largest ECE importers for Shanghai, accounted for 15% and 14% of total ECE imports, respectively. Note that Jiangsu, Zhejiang and the other main ECE trade regions are also geographically close to Shanghai.
Chongqing was a net ECE importing city (Figure 8) with the ratio of ECE imports and exports at 1.31 in 2012. Guizhou, Henan and Sichuan exported the three largest amounts of ECE to Chongqing, taking up to 8.9%, 8.7%, and 8.4% of all such exports, respectively. Yunnan, Shaanxi and Guangxi were the top three importers to Chongqing, accounting for 10.2%, 9.8%, and 7.9% of all such imports, respectively. These provinces all are geographically close to Chongqing.
4.3. The Ecological Relationships between the Four Cities and Other Regions of China
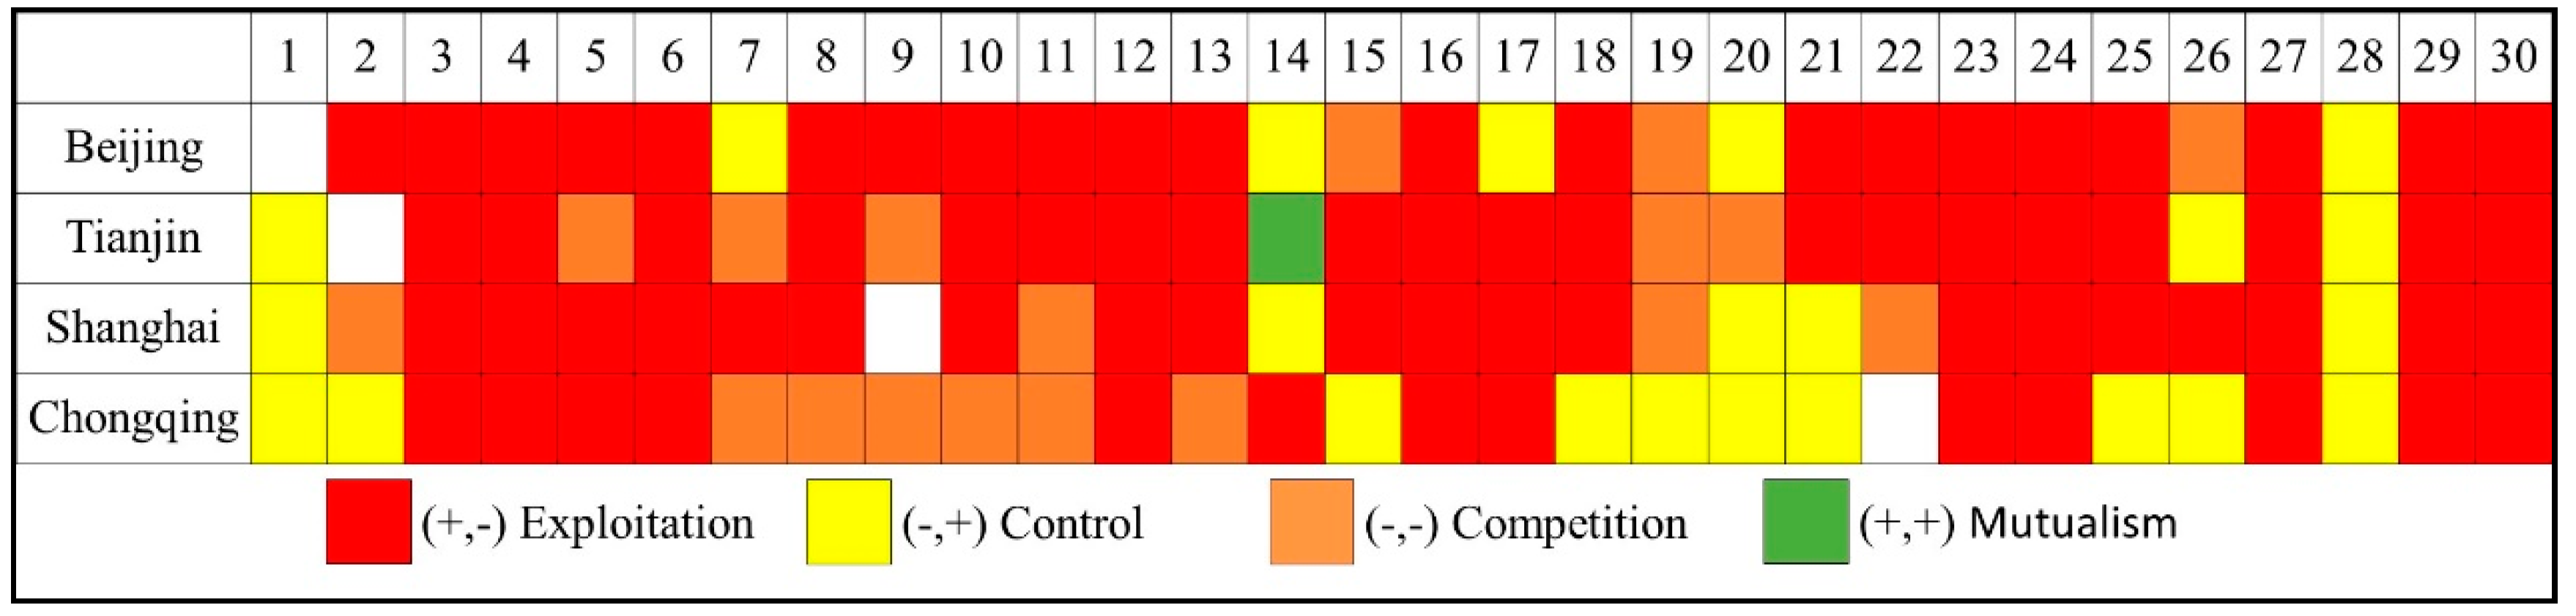
Our analysis looked at four ecological relationships among cities and regions based on an analogy with the similar relationships that exist among natural organisms. An exploitative relationship indicates that a certain node in the system receives more materials than it transfers to anther node when these two nodes exchange materials. A control relationship reflects the opposite situation; compared to an exploitative relationship, a control relationship signifies that one node’s output is controlled by another node. A competitive relationship reflects a situation where the two nodes have no effect on each other. A mutualistic relationship indicates that two nodes can benefit from a reciprocal relationship.
Figure 9 shows the ecological relationships the four cities have with other regions of China based on the ECE flows among them. The numbers in the first line of Figure 9 represent different regions in China; for example, No. 1 represents Beijing (see the Supplemental Material Table S2 for details). Taking Beijing as an example, exploitative is the main relationship between Beijing and the other 29 regions, accounting for 69% of the sum total of all four ecological relationships. The percentages of control and competitive relationships were 17% and 10%, respectively. There are two types of regions that have exploitative relationships with Beijing. One is a region with heavy industry, such as Hebei, Liaoning and Hunan, which mainly export high amounts of ECE-containing goods to another region, in this case, Beijing, contributing a large amount of the ECE flow into Beijing. Another type is a region that provides resources to Beijing, such as Inner Mongolia, Shanxi and Gansu. Beijing imports energy, such as coal, oil, natural gas and electricity, which leads to importing a large amount of net ECE. According to the principles of ENA, Beijing should take responsibility for the carbon emissions produced to supply its needs. At the same time, Shandong, Guangdong and Shaanxi have competitive relationships with Beijing, which means that they have no effect on each other, such as in competing for resources. Therefore, they do not need to take any responsibility for their ECE flows. Control relationships in regions such as Jilin, Jiangxi and Hubei should have Beijing take a certain level of responsibility for the conditions Beijing helps to create. Meanwhile, Tianjin has an exploitative relationship with Hebei, Liaoning, Heilongjiang, Jiangsu and Zhejiang; a competitive relationship with Inner Mongolia, Jilin and Shanghai; a control relationship with Beijing, Jiangxi, Shaanxi, and Qinghai and a mutualistic relationship with Jiangxi. Specifically, exploitative is the main type of relationship that exists among all relationships for Tianjin, accounting for 69%, which indicates that Tianjin needs to import a large amount of ECE to maintain its economic activity. As a result, Tianjin should take responsibility for these ECE flows. Shanghai, faces a similar situation as Beijing and needs to import a large amount of ECE from other regions of China [45]. As a result, exploitative relationships are the main relationship that exist between Shanghai and other regions. Exploitative and control relationships were the two of main ecological relationships between Chongqing and other regions of China, taking up to 45% and 35% of all relationships, respectively.
5. Discussion
5.1. Similarities in ECE between the Four Megacities
Some similarities that exist between the four Chinese megacities are analyzed here. First, the four megacities are all net ECE importing cities, as shown from the results calculated in the present study. The ratios between imports and exports among Beijing, Tianjin, Shanghai and Chongqing were 1.46, 1.35, 1.61 and 1.31, respectively. Urbanization, which is considered to be the main driver of ECE in the consumption patterns of these four megacities in the past decade, will continue to influence their ECE consumption. The process of urbanization will inevitably stimulate the development of the CO industry, which is an energy- and emissions-intensive industry. Thus, the CO industry had the largest ECE consumption of all industries in Beijing and Chongqing, while ranking second in Tianjin and fourth in Shanghai (Figure 1, Figure 2, Figure 3 and Figure 4). For the CO industry to develop, it requires an adequate amount of various materials such as steel and cement, which contain a large amount of ECE. These materials were mainly imported from other regions outside of the four megacities. The exports of these four megacities, however, were mostly concentrated in the service sector, which involves less energy- and emissions-intensive industries. In particular, Beijing and Shanghai tend to export financial services, software, design proposals, etc. As a result, these four megacities import more ECE than they export, causing a dependence on other regions related to ECE consumption. Therefore, an improvement in energy conservation and emissions efficiency in CO and related industries in these four megacities will significantly reduce their ECE consumption.
Second, the main ECE sources of these four megacities flow from regions located in their immediate geographic vicinity. For example, Hebei, Inner Mongolia and Shanxi are the most important ECE import regions for Beijing and Tianjin. Shanghai imports a large amount of ECE from Zhejiang, Jiangsu and Anhui. The main ECE imports for Chongqing flow from Sichuan, Guizhou and Hunan. This phenomenon indicates that all regions of China are included in China’s comprehensive trade system [1] and that the main trade partners of these four megacities lie in their immediate geographic vicinity. Considering the fact that these four megacities are all developed regions with relatively advanced energy consumption and emission technology, little potential room exists for them to improve their emission efficiency and reduce their carbon emissions [2]. Meanwhile, less developed regions have great potential for improving this type of technology. Therefore, an efficient way to improve China’s entire emission efficiency would be to transfer the energy saving and emission reduction technology of these four megacities to those areas that have a close trade connection with them. For example, steel is the main ECE consumption source in Beijing’s CO industry. Improving the emissions technology in steel production in Hebei will considerably reduce the ECE contained in steel, which will reduce Beijing’s ECE consumption.
Third, exploitative is the main relationship that exists between the four megacities analyzed here and the other regions of China, while two different types of regions exist among these exploitative relationships. First, these megacities are highly dependent on the other regions of China. They need to import energy (oil, natural gas and electricity) and natural resources (water, wood and food) to maintain their current level of economic activity. The regions that supply resources such as Shanxi, Heilongjiang, Inner Mongolia and Xinjiang, therefore have an exploitative relationship with these four megacities. Second, heavily industrialized regions, such as Hebei, Liaoning, Hunan, Anhui and Sichuan, also have exploitative relationships with these four megacities. According to the ENA principle, an exploitative relationship means that one node takes advantage of the other node in their trade flows, which provides a criterion for the four megacities to decide whether they should take responsibility for the ECE produced in other regions of China. We believe these four megacities should take responsibility for the reduction of ECE in the regions where they have exploitative relationships.
5.2. Differences in ECE between the Four Megacities
The four megacities analyzed here had their own characteristics and were significantly different in industrial structure, ECE flows and in their relationships with other regions of China.
First, the four megacities have quite different industrial structures. Beijing and Shanghai are more service-oriented cities, and their percentages of the tertiary industry were 80.2% and 70.1%, respectively, in 2016. Chongqing and Tianjin, however, rely more on manufacturing and their percentages of the secondary industry were 42% and 44%, respectively, in 2016. Specifically, Beijing concentrated on the education, medical and technology industries, while Shanghai focused on the financial industry. The chemical and shipbuilding industries are the pillar industries of Tianjin, while special and general machinery and transport equipment manufacturing are the main industries of Chongqing. In addition, the urbanization ratios in 2017 of Beijing, Tianjin, Shanghai and Chongqing were 86.5%, 82%, 89% and 60%, respectively, which means that they have different potential for future development. Different industrial structures and urbanization ratios control their different emission situations, which indicates that the four megacities need to adopt different emission-related policies.
Second, the amount of ECE flows varied widely among these four megacities. Although they were all net ECE importing cities, the amount of ECE they import from China’s different regions varied significantly. For example, Hebei was the largest ECE exporter to both Beijing and Tianjin. Beijing imported 919 million tons of ECE from Hebei, which was almost twice as large as the import figure of Tianjin from Hebei. As a result, the four megacities need to undertake different degrees of ECE reduction responsibility for other regions of China.
Third, the relationship between each outer region and the four megacities varied. Generally, the resource producing regions (Shanxi and Xinjiang) and industrialized regions (Hebei, Liaoning, Anhui and Henan) have exploitative relationships with all four megacities. Other regions have different relationships with the four megacities, which indicates that these four megacities need to take different levels of ecological responsibility for each specific region. When it comes to implementing policies, policymakers should consider all the details of these relationships.
5.3. The Carbon Emission Reduction Duty of the Four Megacities
According to the calculation of MRIO models, we get the detailed data of ECE flows between four megacities and other provinces in China. Meanwhile, we get the relationships between these four megacities and other provinces in China by ENA. These ECE flows and relationships provide a quantitative standard for policymakers to decide specific responsibility that a megacity should undertake for a certain province. According to the principle of ENA, the control and exploitative relationships among megacities and provinces decide whether megacities should take responsibility for the provinces. The amount of ECE flows provides the quantitative data, which is calculated by the ECE flows data divided by their total ECE consumption. As a result, we can get the specific data of carbon emission reduction duty that megacities should undertake for other provinces, as shown in Figure 10.
Specifically, Beijing has exploitative relationships with Tianjin, Hebei, Shanxi and Inner Mongolia, which means Beijing should take responsibility for these ECE flows. The figures are 2.56%, 3.14%, 1.58% and 1.92%, respectively, of Beijing’s total ECE consumption, which means that Beijing should take the corresponding responsibility for its ECE import. At the same time, Beijing has control relationships with Jilin, Jiangxi, Guanxi and Qinghai, which means these provinces should undertake Beijing’s export ECE, accounting for 0.83%, 0.2%, 0.11%, 0.15% and 0.04%, respectively. Similar analysis was found in Tianjin, Shanghai and Chongqing. Therefore, the figures, shown in Figure 10, provide quantitative data for policymakers and researchers when they need to implement carbon emission reduction related policy.
5.4. The ECE Flows between Four Megacities and Other Regions of China in 2007
From Figure 11 we can see details of ECE flows between four megacities and other regions of China in 2007.
Comparing the ECE flows between four megacities and other regions of China in 2007, we can see that there are some changes in ECE flows between the four megacities and other regions of China in 2012. Firstly, the amount of ECE flows among the four megacities conspicuously increased, which means that the trade between the four megacities and other regions of China increased significantly from 2007 to 2012. The reason for this phenomenon is that, on the one hand, the economy of the four megacities increased steadily [5], which increased the trade demand. On the other hand, these four megacities, especially Beijing and Shanghai, have continued to promote industrial transformation and upgrading. Their tertiary industry’s scale grew faster than other industries, which means that they required more resource input. Secondly, in the past decade, the Chinese government has promoted an interregional coordinated development strategy, which has increased the economic cooperation among specific regions, such as the Beijing-Tianjin-Hebei and the Yangtze River Delta integration plans. This strategy has obtained a certain result. For example, the ECE flows between Jing-Jin-Ji increased by almost 15% from 2007 to 2012, higher than the ratio (8%) of the total amount of ECE flows between megacities and other regions of China. Thirdly, the four megacities should take more responsibility for carbon emission reduction duty, as they consumed more ECE and imported more ECE.
6. Conclusions
As China continues on its path of rapid urbanization and industrialization, Chinese cities, especially the four megacities analyzed here, consume most of the energy used in China and produce large amounts of carbon emissions. In the present study, we introduced single regional and MRIO models to analyze the features of the four Chinese municipalities of Beijing, Tianjin, Shanghai and Chongqing and calculated the ECE flows among them. In addition, we analyzed the ecological relationships between these megacities with other regions based on ECE flows through the use of an ENA model. The results show the following:
- There are some similarities between the four Chinese megacities. Firstly, both the DCE per GDP and the DCE per capita of these four megacities were lower than average for all of China. The ECE per GDP and the ECE per capita, however, were much larger than average for all of China, which means that these four megacities have relatively advanced energy and emission technology. Secondly, exploitative is the main relationship that exists between these four megacities and the other regions of China. As a result, the four megacities should take responsibility for reducing the ECE for the regions on which they depend for resources. These results provide quantitative data for policymakers to formulate megacities emission reduction policies from the perspective of China as a whole. However, further studies should focus on how these megacities should take the carbon emission reduction responsibility. For example, whether Beijing should apply carbon emission reduction technology to take carbon emission reduction responsibility or provide complete carbon emission reduction design plans along with corresponding financial support to other provinces which have ECE flows with Beijing.
- The four megacities had their own characteristics and were significantly different in industrial structure, ECE flows and their relationships with other regions of China. For example, all four megacities were net ECE importers, with Shanghai being the largest net ECE importer. Even though these four megacities have ECE flows with all other regions of China, the main ECE sources flowed from locations in their immediate geographic vicinities. These results provide policymakers with a comprehensive understanding of the four megacities’ ECE consumption situation, which will help them to formulate industrial policies. For example, from a low carbon development perspective, Shanghai should give priority to the development of industry, which not only produces less direct carbon emissions, but also consumes less ECE imported from nearby provinces.
Supplementary Materials
The following are available online at https://www.mdpi.com/2071-1050/11/9/2591/s1, Table S1: Abbreviated names of China’s Sectors; Table S2: Detailed embodied flows between four megacities and other regions of China in 2012 (units: million); Table S3: Detailed embodied flows between four megacities and other regions of China in 2007 (units: million tons).
Author Contributions
Lead author X.W. developed the ENA and MRIO modes, analyzed the data and wrote this paper. X.T., Z.F. and Y.Z. contributed to the literature review, the sample selection, the data collection and the preparation of the manuscript. Y.Z. contributed to the review of this paper and edited the English.
Funding
The manuscript is funded by the National Key R&D Program of China (2016YFF0204402); National Natural Science Foundation of China (71503115, 71673297, 71303258, 71373285, 71503264); National Social Science Funds of China (13&ZD159); MOE (Ministry of Education in China) Project of Humanities and Social Sciences (13YJC630148, 15YJC630121); Transport Strategic Planning Project (Grant no. 2018-20-1); Energy Foundation (Grant no. G-1811-28753); Science and Technology Project of Henan Transportation Department (2018G8) for sponsoring this research.
Conflicts of Interest
The authors declare no conflict of interest.
Appendix A
Figure A1.
The definition of embodied carbon emissions.


Table A1.
The code of each province in China.
| Code | Province | Code | Province | Code | Province |
|---|---|---|---|---|---|
| 1 | Beijing | 11 | Zhejiang | 21 | Hainan |
| 2 | Tianjin | 12 | Anhui | 22 | Chongqing |
| 3 | Hebei | 13 | Fujian | 23 | Sichuan |
| 4 | Shanxi | 14 | Jiangxi | 24 | Guizhou |
| 5 | Inner Mongolia | 15 | Shandong | 25 | Yunnan |
| 6 | Liaoning | 16 | Henan | 26 | Shannxi |
| 7 | Jilin | 17 | Hubei | 27 | Gansu |
| 8 | Heilongjiang | 18 | Hunan | 28 | Qinghai |
| 9 | Shanghai | 19 | Guangdong | 29 | Ningxia |
| 10 | Jiangsu | 20 | Guangxi | 30 | Xinjiang |
Figure A2.
Map of China’s provinces.

References
- Feng, K.; Hubacek, K.; Sun, L.; Zhu, L. Consumption-based CO2, accounting of China’s megacities: The case of Beijing, Tianjin, Shanghai and Chongqing. Ecol. Indic. 2014, 47, 26–31. [Google Scholar] [CrossRef]
- Chen, G.; Hadjikakou, M.; Wiedmann, T. Urban carbon transformations: Unravelling spatial and inter-sectoral linkages for key city industries based on multi-region input–output analysis. J. Clean. Prod. 2016, 163, 220–224. [Google Scholar] [CrossRef]
- Zhang, N.; Yu, K.; Chen, Z. How does urbanization affect carbon dioxide emissions? A cross-country panel data analysis. Energy Policy 2017, 107, 678–687. [Google Scholar] [CrossRef]
- Zhang, Y.J.; Yi, W.C.; Li, B.W. The Impact of Urbanization on Carbon Emission: Empirical Evidence in Beijing. Energy Procedia 2015, 75, 2963–2968. [Google Scholar] [CrossRef] [Green Version]
- National Bureau of Statistics. China Energy Statistical Yearbook, Beijing. China Statistics Press, 1998–2018. Available online: http://www.stats.gov.cn/english/ (accessed on 27 April 2019).
- Guan, X.; Wei, H.; Lu, S.; Dai, Q.; Su, H. Assessment on the urbanization strategy in China: Achievements, challenges and reflections. Habitat Int. 2018, 71, 97–109. [Google Scholar] [CrossRef]
- Shuai, C.; Shen, L.; Jiao, L.; Wu, Y.; Tan, Y. Identifying key impact factors on carbon emission: Evidences from panel and time-series data of 125 countries from 1990 to 2011. Appl. Energy 2017, 187, 310–325. [Google Scholar] [CrossRef]
- U.S. Energy Information Administration (EIA). International Energy Outlook. 2018. Available online: https://www.eia.gov/outlooks/aeo/ (accessed on 27 April 2019).
- Chen, Q.; Cai, B.; Dhakal, S.; Pei, S.; Liu, C.; Shi, X.; Hu, F. CO2 emission data for Chinese cities. Resour. Conserv. Rec. 2017, 126, 198–208. [Google Scholar] [CrossRef]
- CCSY. China City Statistical Yearbook (2003–2016). China Statistical Publishing House: Beijing, China, 2017. Available online: http://www.stats.gov.cn/tjsj/ndsj/2016/indexeh.htm (accessed on 27 April 2019).
- Kang, Y.Q.; Zhao, T.; Yang, Y.Y. Environmental Kuznets curve for CO2 emissions in China: A spatial panel data approach. Ecol. Indic. 2016, 63, 231–239. [Google Scholar] [CrossRef]
- Chen, G.; Wiedmann, T.; Wang, Y.; Hadjikakou, M. Transnational city carbon footprint networks – Exploring carbon links between Australian and Chinese cities. Appl. Energy 2016, 184, 1082–1092. [Google Scholar] [CrossRef] [Green Version]
- Schulz, N.B. Delving into the carbon footprints of Singapore—Comparing direct and indirect greenhouse gas emissions of a small and open economic system. Energy Policy 2010, 38, 4848–4855. [Google Scholar] [CrossRef]
- Meng, F.; Liu, G.; Yang, Z.; Hao, Y. Structural analysis of embodied greenhouse gas emissions from key urban materials: A case study of Xiamen City, China. J. Clean. Prod. 2016, 163. [Google Scholar] [CrossRef]
- Zhang, L.; Feng, Y.; Chen, B. Alternative Scenarios for the Development of a Low-Carbon City: A Case Study of Beijing, China. Energies 2011, 4, 2295–2310. [Google Scholar] [CrossRef] [Green Version]
- Cai, B.; Zhang, L. Urban CO2, emissions in China: Spatial boundary and performance comparison. Energy Policy 2014, 66, 557–567. [Google Scholar] [CrossRef]
- Wang, S.; Liu, Y.; Chen, B. Multiregional input–output and ecological network analyses for regional energy–water nexus within China. Appl. Energy 2017, 227, 353–364. [Google Scholar] [CrossRef]
- Parshall, L.; Gurney, K.; Hammer, S.A.; Mendoza, D.L. Modeling energy consumption and CO emissions at the urban scale: Methodological challenges and insights from the United States. Energy Policy 2010, 38, 4765–4782. [Google Scholar] [CrossRef]
- Liu, Y.; Chen, S.; Chen, B.; Yang, W. Analysis of CO2, emissions embodied in China’s bilateral trade: A non-competitive import input–output approach. J. Clean. Prod. 2016, 163, S410–S419. [Google Scholar] [CrossRef]
- Bi, J.; Zhang, R.; Wang, H.; Liu, M.; Wu, Y. The benchmarks of carbon emissions and policy implications for China’s cities: Case of Nanjing. Energy Policy 2011, 39, 4785–4794. [Google Scholar] [CrossRef]
- Dhakal, S. Urban energy use and carbon emissions from cities in China and policy implications. Energy Policy 2009, 37, 4208–4219. [Google Scholar] [CrossRef]
- Mi, Z.; Zhang, Y.; Guan, D.; Shan, Y.; Liu, Z.; Cong, R.; Yuan, X.-C.; Wei, Y.-M. Consumption-based emission accounting for Chinese cities. Appl. Energy 2016, 184, 1073–1081. [Google Scholar] [CrossRef] [Green Version]
- Tan, X.; Dong, L.; Chen, D.; Gu, B.; Zeng, Y. China’s regional CO2, emissions reduction potential: A study of Chongqing city. Appl. Energy 2016, 162, 1345–1354. [Google Scholar] [CrossRef]
- Su, Y.; Chen, X.; Li, Y.; Liao, J.; Ye, Y.; Zhang, H.; Huang, N.; Kuang, Y. China’s 19-year city-level carbon emissions of energy consumptions, driving forces and regionalized mitigation guidelines. Renew. Sustain. Energy Rev. 2014, 35, 231–243. [Google Scholar] [CrossRef]
- Liu, Z.; Liang, S.; Geng, Y.; Xue, B.; Xi, F.; Pan, Y.; Zhang, T.; Fujita, T. Features, trajectories and driving forces for energy-related GHG emissions from Chinese mega cites: The case of Beijing, Tianjin, Shanghai and Chongqing. Energy 2012, 37, 245–254. [Google Scholar] [CrossRef]
- Wei, J.; Huang, K.; Yang, S.; Li, Y.; Hu, T.; Zhang, Y. Driving forces analysis of energy-related carbon dioxide (CO2) emissions in Beijing: An input–output structural decomposition analysis. J. Clean. Prod. 2016, 163, 58–68. [Google Scholar] [CrossRef]
- Hao, Y.; Cai, Y.; Zhang, L.; Su, M.; Yang, Z. Identification of low-carbon strategies for post-earthquake development in the city of Guangyuan based on an inexact two stage stochastic programming approach. Habitat Int. 2016, 53, 413–429. [Google Scholar] [CrossRef]
- Lehmann, S. Low-to-no carbon city: Lessons from western urban projects for the rapid transformation of Shanghai. Habitat Int. 2013, 37, 61–69. [Google Scholar] [CrossRef]
- Lo, K. China’s low-carbon city initiatives: The implementation gap and the limits of the target responsibility system. Habitat Int. 2014, 42, 236–244. [Google Scholar] [CrossRef]
- Yu, Y.; Chen, F. Research on carbon emissions embodied in trade between China and South Korea. Atmos. Pollut. Res. 2016, 8, 56–63. [Google Scholar] [CrossRef]
- Long, R.; Li, J.; Chen, H.; Zhang, L.; Li, Q. Embodied carbon dioxide flow in international trade: A comparative analysis based on China and Japan. J. Environ Manag. 2018, 209, 371. [Google Scholar] [CrossRef]
- Jiang, J.; Ye, B.; Xie, D.; Tang, J. Provincial-level carbon emission drivers and emission reduction strategies in China: Combining multi-layer LMDI decomposition with hierarchical clustering. J. Clean. Prod. 2017, 169, 178–190. [Google Scholar] [CrossRef]
- Ye, B.; Jiang, J.J.; Li, C.; Miao, L.; Tang, J. Quantification and driving force analysis of provincial-level carbon emissions in China. Appl. Energy 2017, 198, 223–238. [Google Scholar] [CrossRef]
- Zhang, X.; Wang, F. Assessment of embodied carbon emissions for building construction in China: Comparative case studies using alternative methods. Energy Build. 2016, 130, 330–340. [Google Scholar] [CrossRef]
- Kang, G.; Kim, T.; Kim, Y.W.; Cho, H.; Kang, K.-I. Statistical analysis of embodied carbon emission for building construction. Energy Build. 2015, 105, 326–333. [Google Scholar] [CrossRef]
- Hu, Y.; Lin, J.; Cui, S.; Khanna, N.Z. Measuring urban carbon footprint from carbon flows in the global supply chain. Environ. Sci. Tech. 2016, 50, 6154. [Google Scholar] [CrossRef]
- Wassily, L. Environmental Repercussions and the Economic Structure: An Input-Output Approach: A Reply. Rev. Econ.Stat. 1970, 52, 109–110. [Google Scholar]
- Fath, B.D.; Patten, B.C. Network synergism: Emergence of positive relations in ecological systems. Ecol. Model. 1998, 107, 127–143. [Google Scholar] [CrossRef] [Green Version]
- Sun, X.; Li, J.; Qiao, H.; Zhang, B. Energy implications of China’s regional development: New insights from multi-regional input-output analysis. Appl. Energy 2016, 196, 118–131. [Google Scholar] [CrossRef]
- Zhang, Z.; Zhu, K.; Hewings, G.J.D. A Multi-regional Input–output Analysis of the Pollution Haven Hypothesis from the Perspective of Global Production Fragmentation. Energy Econ. 2017, 64, 13–23. [Google Scholar] [CrossRef]
- Liu, Z.; Guan, D.; Wei, W.; Davis, S.J.; Ciais, P.; Bai, J.; Peng, S.; Zhang, Q.; Hubacek, K.; Marland, G.; et al. Reduced carbon emission estimates from fossil fuel combustion and cement production in China. Nature 2015, 524, 335. [Google Scholar] [CrossRef]
- Zhang, Y.; Zheng, H.; Fath, B.D.; Liu, H.; Yang, Z.; Liu, G.; Su, M. Ecological network analysis of an urban metabolic system based on input–output tables: Model development and case study for Beijing. Sci. Total Environ. 2014, 642, 468–469. [Google Scholar] [CrossRef]
- Yuan, Z.; Bi, J.; Moriguichi, Y. The circular economy: A new development strategy in China. J. Ind. Ecol. 2006, 10, 4–8. [Google Scholar] [CrossRef]
- Mathews, J.A.; Tan, H. Progress toward a circular economy in China. J. Indust. ecol. 2011, 15, 435–457. [Google Scholar] [CrossRef]
- Wang, X.; Tang, X.; Zhang, B.; McLellan, B.C.; Lv, Y. Provincial Carbon Emissions Reduction Allocation Plan in China Based on Consumption Perspective. Sustainability 2018, 10, 1342. [Google Scholar] [CrossRef]
Figure 1.
The input-output table.

Figure 2.
Multi-regional input-output table.

Figure 3.
The carbon emission flows among the nodes of a simple system.

Figure 4.
Embodied emissions and shares of emissions in different sectors, and embodied carbon per gross domestic product (GDP; Kg/$) and per person in Beijing in 2012. Note: CO is the abbreviated name of construction; detailed abbreviated names of the 42 sectors are shown in the Supplemental Material Table S1.

Figure 5.
Embodied emissions and shares of emissions in different sectors, and embodied carbon per GDP (GDP; Kg/$) and per person in Tianjin in 2012.
Figure 5.
Embodied emissions and shares of emissions in different sectors, and embodied carbon per GDP (GDP; Kg/$) and per person in Tianjin in 2012.

Figure 6.
Embodied emissions and shares in different sectors and the carbon emission related index in Shanghai.
Figure 6.
Embodied emissions and shares in different sectors and the carbon emission related index in Shanghai.

Figure 7.
Embodied emissions and shares of emissions in different sectors, and a carbon emission related index of Chongqing.
Figure 7.
Embodied emissions and shares of emissions in different sectors, and a carbon emission related index of Chongqing.

Figure 8.
The embodied carbon emissions (ECE) flows between Beijing, Tianjin, Shanghai, Chongqing and other regions of China in 2012 (units: million tons; the outgoing versus incoming flows are differentiated by colors; detailed data can be found in the Supplemental Material Table S2).
Figure 8.
The embodied carbon emissions (ECE) flows between Beijing, Tianjin, Shanghai, Chongqing and other regions of China in 2012 (units: million tons; the outgoing versus incoming flows are differentiated by colors; detailed data can be found in the Supplemental Material Table S2).

Figure 9.
The ecological relationships between the four cities and other regions of China (the code numbers, 1,2, …, 30, represent the Chinese provinces, which are shown in Appendix A, Table A1 and Figure A2).
Figure 9.
The ecological relationships between the four cities and other regions of China (the code numbers, 1,2, …, 30, represent the Chinese provinces, which are shown in Appendix A, Table A1 and Figure A2).

Figure 10.
The proportion that one province should undertake for other provinces in an ECE ecological system (the numbers in this figure represent the percentage of one province’s carbon emissions reduction CER).
Figure 10.
The proportion that one province should undertake for other provinces in an ECE ecological system (the numbers in this figure represent the percentage of one province’s carbon emissions reduction CER).

Figure 11.
The ECE flows between four megacities and other regions of China in 2007, (units: million tons; the outgoing versus incoming flows are differentiated by colors; detailed data can be found in the Supplemental Material Table S3).
Figure 11.
The ECE flows between four megacities and other regions of China in 2007, (units: million tons; the outgoing versus incoming flows are differentiated by colors; detailed data can be found in the Supplemental Material Table S3).

© 2019 by the authors. Licensee MDPI, Basel, Switzerland. This article is an open access article distributed under the terms and conditions of the Creative Commons Attribution (CC BY) license (http://creativecommons.org/licenses/by/4.0/).
Share and Cite
MDPI and ACS Style
Wang, X.; Tang, X.; Feng, Z.; Zhang, Y. Characterizing the Embodied Carbon Emissions Flows and Ecological Relationships among Four Chinese Megacities and Other Provinces. Sustainability 2019, 11, 2591. https://doi.org/10.3390/su11092591
AMA Style
Wang X, Tang X, Feng Z, Zhang Y. Characterizing the Embodied Carbon Emissions Flows and Ecological Relationships among Four Chinese Megacities and Other Provinces. Sustainability. 2019; 11(9):2591. https://doi.org/10.3390/su11092591
Chicago/Turabian StyleWang, Xuecheng, Xu Tang, Zhenhua Feng, and Yi Zhang. 2019. "Characterizing the Embodied Carbon Emissions Flows and Ecological Relationships among Four Chinese Megacities and Other Provinces" Sustainability 11, no. 9: 2591. https://doi.org/10.3390/su11092591
Note that from the first issue of 2016, this journal uses article numbers instead of page numbers. See further details here.