Article

Selection Criteria for Drought-Tolerant Bread Wheat Genotypes at Seedling Stage

by
Hafiz Ghulam Muhu-Din Ahmed
1,*,
Muhammad Sajjad
2,
Mingju Li
3,*,
Muhammad Abubakkar Azmat
1,
Muhammad Rizwan
1,
Rana Haroon Maqsood
1 and
Sultan Habibullah Khan
4
1
Department of Plant Breeding and Genetics, Sub Campus Burewala-Vehari, University of Agriculture Faisalabad, Punjab 38000, Pakistan
2
Department of Biosciences, COMSATS University Islamabad (CUI), Park Road, Islamabad 45550, Pakistan
3
Institute of Agricultural Environment and Resources, Yunnan Academy of Agricultural Sciences, Kunming 650205, China
4
Center of agricultural biotechnology and biochemistry, University of Agriculture Faisalabad, Punjab 38000, Pakistan
*
Authors to whom correspondence should be addressed.
Sustainability 2019, 11(9), 2584; https://doi.org/10.3390/su11092584
Submission received: 23 March 2019 / Revised: 17 April 2019 / Accepted: 18 April 2019 / Published: 5 May 2019
(This article belongs to the Special Issue Sustainable Crop Production Systems)

Abstract

:
Diminishing water resources as a result of excessive use of water for irrigation and climate change posture a severe global threat to food security. Herein, an experiment was conducted to determine the selection criteria for drought-tolerant bread wheat genotypes at the seedling stage using morphological and photosynthetic pigmentation-related traits. A panel of 105 wheat landraces, historical Pakistani varieties, and advance breeding lines were evaluated under normal and drought stress using factorial completely randomized design. The root length, fresh weight, dry weight, cell membrane thermo-stability, and chlorophyll b were positively correlated among themselves under both normal and stress conditions. Hence, selection of any one of these traits enhances the performance of other traits. The shoot length was non-significant and negatively associated with all other studied characters except relative water content. The results suggested that selection for shoot length could not improve genetic gain for drought tolerance. Out of 10 principal components (PCs), the first three PCs were showed significant genetic variation under both conditions. The first three PCs showed 74.6% and 76% cumulative genetic variation under normal and drought conditions, respectively. Based on PCA, 10 drought-tolerant and five drought-susceptible genotypes were identified. Overall results suggested that selection for root length, fresh weight, dry weight, cell membrane thermo-stability, and chlorophyll b at the seedling stage would improve genetic gain for drought tolerance. The outperforming genotypes under drought stress conditions can be useful in future wheat breeding programs, and early selection for the traits recommended in this study will be effective for developing high-yielding and drought-tolerant wheat varieties.

1. Introduction

Wheat demand is increasing with the continuous increase in human population and it is expected to reach up to 40% in 2030. Hence, there is a dire need to increase wheat production to ensure sustainable food security [1,2]. There are many constraints which are responsible for low yield including poor-quality seed, non-recommended sowing methods, delayed sowing, poor soil management, unbalanced fertilizer application, improper weed eradication, diseases, shortage of water, and heat and drought stress due to climatic changes [3,4]. Among cereal crops, wheat crop status is imperative because of its nutritional value and high consumption. The rapid increase in population and better lifestyle render new challenges for wheat scientists to breed wheat varieties with improved yield, quality, and resistance against biotic and abiotic stresses [5].
Wheat production is compromised due to various constraints including drought. Drought is predominantly caused by erratic changes in precipitation and low rainfall [6].Water shortage is reported to cause 17% to 70% yield losses. Wheat yield reduced to 50% to 90% of its irrigated potential in developing countries due to water deficit [7]. Wheat plant suffers a severe response to water deficit stress at tillering, jointing, booting, anthesis, and filling stages. Tillering is a very important stage at which the plant develops tillers, primodia of spike, spikelets, and florets in the wheat plant. Water deficit stress at this stage can cause a 46% decrease in total wheat yield [8].
For creating drought-tolerant genotypes, it is essential to primarily understand the mechanism and response of plants in water-deficient conditions. The factors like crop species, drought intensity, duration of drought, and stages of plant growth make the mechanism of drought tolerance complex. [9]. Survival of the plant under drought stress conditions assumes many mechanisms simultaneously. Three basic mechanisms involved in adaptation to drought stress are escape, avoidance or tolerance, and resistance mechanisms [10,11]. In the escape mechanism, the plant completes its life cycle before the presence of drought. In the tolerance mechanism, plants compete with water-deficient environments, e.g., stomata closure and decreased transpiration rate. In the drought-resistance mechanism, the plant continues normal growth stages during drought by increasing the amount of photosynthetic pigments and sustaining root-to-shoot ratio for meritorious distribution of the total assimilates [12].
Vigorous seedling is a vital index in describing the yield of a plant in a short period of time [13]. A genotype with drought stress tolerance has more impermeable rooting abilities to boost the preoccupation of soil moisture and to lessen the distinct effects of drought during development and growth [14]. The root, the principal part of the wheat plant, is affected mainly by water shortage. Maximum root length endorses the availability of moisture from the depth of the soil and promotes the adaptation in water-deficient conditions. Root length at the seedling stages of the plant is a key genetic trait for increasing yield under drought conditions [15]. According to the wheat scientists, seedling growth is influenced under drought stress, but the influence changes from variety to variety. The selection of wheat variety with the best performance under water stress environments could increase the production of rainfed areas [10,11,13]. Various methods were designed for screening of wheat genotypes at the seedling stage for drought tolerance. Bilal et al. [16] suggested root-to-shoot ratio and relative water content as selection criteria in wheat for drought tolerance. Almeselmani [17] concluded relative water content (RWC) as a good criterion for the selection of drought-tolerant wheat varieties at the seedling stage. RWC in terms of its relationship with the volume of cell can correctly show the balance between water absorbed by the plant and disbursed through transpiration [18]. Datta et al. [19] applied both normal and water-deficient conditions to wheat genotypes and observed that genotypes performed better under environments which had optimum RWC and root and shoot length, which were considered drought-tolerant genotypes. Selection of wheat varieties on the basis of seedling traits is easy, cheap, and less laborious. Similarly, seedling attributes expose moderate-to-high variability with an additive gene effect across environments [2,11].
Leaf chlorophyll content is an indicator of the photosynthetic capability of plant tissues. The amount of chlorophyll pigments varies under drought environments. Carotenoid contents play dynamic roles in plant resistance to drought stress [20]. Water-deficient environments inhibit the production of chlorophyll a/b and reduce the amount of protein useful in binding, while also declining the level of pigment protein useful in light harvesting, as well as other proteins associated with photosystem II [21]. The effects of drought on chlorophyll and carotenoid contents were inspected in several major field crops. Chlorophyll and carotenoid concentrations were identified as attributes for the assessment of drought stress. Therefore, a reduction of these values can be considered as a non-stomata limiting factor under drought stress conditions [22].
The experiment herein was directed for the screening of 105 miscellaneous wheat accessions for drought tolerance on the basis of seedling attributes so as to define the correlation of studied seedling indices and to determine suitable selection criteria under both normal and drought conditions. This will provide the basis of drought tolerance for dry land farming in semiarid and rainfed regions.

2. Materials and Methods

The proposed experiment was performed to assess the effects of normal and drought stress on root-related traits and photosynthetic pigmentation in bread wheat genotypes at the seedling stage. The seeds of 105 spring wheat accessions were taken from the Department of Plant Breeding and Genetics, University of Agriculture (PBG-UAF), Faisalabad, Pakistan. The name, pedigree (if available), and origin of selected wheat genotypes are listed in Supplementary 1. The greenhouse experiments at the seedling stage were conducted in the research station of PBG-UAF under normal and drought conditions during 2017–2018.
Experimental wheat accessions were planted in15 × 15 cm polyethylene bags filled with sand using a completely randomized design (CRD) in a triplicate fashion under normal and drought conditions. Two seeds were sown in each bag and, after germination, a thinning practice was performed to obtain one seedling. For every replication, five bags were used for each variety. After the application of watering upon sowing, one set of genotypes was regularly watered (100% of field capacity) while another similar set of genotypes was kept in water-deficient stress (at 50% field capacity). The field capacity (FC) of the soil used in the experiments was measured with a pressure chamber apparatus [23,24]. Data of the studied traits, namely shoot length, root length, root/shoot ratio, fresh seedling weight, dry seedling weight, relative water contents [25], cell membrane thermo-stability [26], chlorophyll a,b, and carotenoid, were recorded from three-week-old wheat seedlings from both environments. The chlorophyll (Chl) a, b was measured using the following equations [27]:
Chl .   a ( mgg 1 ) = [ 12.7   ( OD 663 ) 2.69   ( OD 645 ) ] × V 1000 × W ,
Chl .   b ( mgg 1 ) = [ 22.9   ( OD 645 ) 4.68   ( OD 663 ) ] × V 1000 × W ,
where V is the volume of extract, W is the weight of fresh leaves, and OD is the optimal density.
The carotenoid content was calculated using the following equation [28]:
Carotenoids   ( mgg 1 )   = [ ( Acar / EM ) × 100 ] ,
where   Acar = [ ( OD 480 ) + 0.114 ( OD 663 ) ] 0.638 ( OD 645 ) , and EM   = 2500 .
Recorded data were subjected to analysis of variances (ANOVA) [29] using the GenStat (v10) software. The significance level α = 0.01 was used for highly significant effects and α =0.05 was used for significant effects. The traits which were found significant were used for further exploration through correlation and principal component analysis (PCA) to determine the linkage between traits and genotypes under drought stress conditions. The software Minitab16 was used for correlation and principal component analysis [30]. For correlation analysis significance levels, α = 0.01 was used for highly significant effects and α =0.05 was used for significant effects. For PCA, the principal components (PCs) with eigenvalue >1 were considered as significant PCs. Based on the results of correlation and principal component analysis, the drought-tolerant genotypes and favorable seedling traits were selected to determine the selection criteria for drought stress tolerance.

3. Results and Discussion

Highly significant differences were exhibited among accessions under normal and drought conditions for all studied traits (Table 1), indicating the variation in germplasm. The mean variability of 10seedling traits revealed the accessions that presented a variation in performance as compared to the examined genotypes for studied attributes under drought conditions; those with the best performance were considered drought-tolerant (Table 2).

3.1. Mean Variability

Mean values of root length changed significantly, ranging from 7.22 to 23.00 cm under normal water conditions, while, under drought stress, mean values ranged from 5.31 to 17.65 cm (Table 2). Root length appeared an important trait for drought stress tolerance, as reported in previous studies [31]. The genotypes CHAKWAL-86, 10117, and DPW-621-50 showed maximum mean values of root length as compared to other tested genotypes, and they were classified as drought-tolerant; on the other hand, MOOMAL-2002 was classified as drought-susceptible due to its low performance, as mentioned in Table 3. It was recommended that an improvement in wheat breeding for drought resistance can be predicted from the selection for maximum root length [32]. The impact of root architecture and its mechanism on yield and yield-related attributes, especially in drought conditions, was comprehensively discussed in all major crops [33,34]. Stimulated root growth of wheat genotypes in water-deficient conditions was also described by wheat scientists [2,35].
The shoot length of wheat plant is an imperative trait which is influenced by water shortage. The phenotypic response of any trait is due to the interaction of genotype and environment. Mean values for this trait ranged from 13.16 to 29.17 cm in non-stress conditions, while, in stress conditions, they ranged from 11.00 to 25.19 cm (Table 2). For drought tolerance, minimum shoot length and maximum root length is required. In this experiment, CHAKWAL-86 had the maximum root length and was found to be drought-tolerant, while 9508 had the maximum shoot length and was considered as a drought-susceptible genotype (Table 3). Screening based on seedling length, along with a widespread root system, give rise to good adaptation in rainfed areas. Many researchers [36,37] also assessed the decline in the growth, length, and weight of seedlings with the increase in drought conditions; their findings were similar with the current experiment.
Root/shoot length ratio for tested genotypes varied significantly, ranging from 0.27 to 0.94 under normal conditions, and from 0.29 to 0.92 under drought conditions, as presented in Table 2. A reducing trend was observed with the increase in drought stress among all genotypes. In this experiment, CHAKWAL-86 appeared to be drought-tolerant, while 9508 was found to be a drought-susceptible genotype. Plant growth-related indices, such as root length and shoot length, and seedling fresh weight, are characterized as major indices for choosing efficient wheat genotypes under drought conditions [38]. Similar results were stated by wheat scientists, where by a decrease in shoot length and root length, and in seedling fresh and dry weight was observed in all genotypes under water-deficient conditions [39].
Data recorded for fresh weight of wheat seedlings varied significantly, ranging from 0.75 to 1.11 g under normal conditions and from 0.45 to 0.91 g under water stress conditions (Table 2). Wheat scientists [36,40] described that genotypes with higher fresh weight of wheat seedlings under drought environment were categorized as drought-tolerant. The genotypes 9797, 9493, and 9930exhibited the best performance and were considered as-drought tolerant, while MOOMAL-2002 was found to be drought-susceptible due to low performance (Table 3).
The dry weight of wheat seedlings is a significant index also influenced by drought. Dry weights for all genotypes are recorded in Table 2, and they varied significantly, ranging from 0.18 to 0.49 g under normal conditions and from 0.10 to 0.27 g under drought conditions. In this study, the genotypes 9493, 9797, and 10115 depicted a high percentage of RWC as compared to other tested genotypes and they were considered as drought-tolerant, while BARS-2009 was found to be drought susceptible due to low performance for this trait, as exhibited in Table 3. A superior root and shoot mass following drought stress was proposed as a reliable drought selection criterion for different plant species, including wheat [32,41]. Root morphology and biomass are very important traits while selecting drought-tolerant genotypes. A reducing pattern in seedling dry weight was found by many scientists [36,42,43], who observed that drought conditions had a noteworthy effect on plant dry mass.
Soil moisture deficit is a major adverse factor in arid and semi-arid zones, causing lower leaf water potential, leading to reduced turgor and, ultimately, lower crop productivity [44]. Data collected for relative water content for 105 genotypes varied significantly, ranging from 61.00% to 82.33% under normal conditions and from 51.45% to 72.78%under drought stress conditions, as depicted in Table 2. Drought-induced reduction in the relative water content was reported in many crops including wheat [45]. In the current experiment, genotypes 9618, 10111, and 10117 depicted a high percentage of RWC as compared to other tested genotypes and were considered as drought-tolerant, while BARS-2009 was deemed to be drought-susceptible due to low performance for this trait, as exhibited in Table 3. The decline in relative water content under water-deficient stress in wheat seedlings was also observed in the present study. Similarly, a higher reduction in relative water content in drought-susceptible wheat genotypes as compared to drought-tolerant ones was also observed earlier [12,46,47,48]. This physiological characteristic has great importance when screening wheat genotypes for drought tolerance. Plant scientists showed that wheat cultivars having high RWC are more resistant to drought stress. Generally, it seems that osmoregulation is one of the main mechanisms preserving turgor pressure in most plant species, preventing water loss, causing the plant to continue water absorption and retain metabolic activities [49,50]. The ability of some genotypes to maintain RWC amount for the maximum duration may be the result of higher cell-wall strength or the ability to reduce mechanical damage to the cells [51].
Data collected for cell membrane thermo-stability (CMT) for all genotypes varied significantly, ranging from 55.00% to 74.00% under normal conditions and from 44.47% to 63.47% under drought stress conditions (Table 2). In the current study for CMT, genotypes 9493, 9797, and CHAKWAL-86 showed the best performance and were classified as drought-tolerant, while 9508 was found to be drought-susceptible due to low performance (Table 3). The positive association of electrolyte leakage with drought was also found by others [52,53,54,55]. From these results, it was concluded that heat-tolerant genotypes had greater cell membrane thermo-stability, which ultimately increased the survival potential of genotypes following drought and heat-shock treatments. Thus, CMT assays could be used as a selection criterion for drought and heat stress tolerance at the seedling stage, thus reducing the time and cost needed for the field experiments. RWC and CMT are useful indices for the rapid evaluation of drought response in wheat breeding. This is the only adaptive and positive response beneficial to the plant under drought conditions. Osmoregulation enables the plant to maintain high turgor pressure, as well as survive under drought conditions. The relative water content and cell membrane thermo-stability are also considered important selection criteria for wheat under drought stress [56,57].
All studied wheat varieties responded contrarily in terms of seedling photosynthetic traits under water stress conditions. The mean data of chlorophyll a for examined genotypes ranged from 1.36 to 1.65 mg/g in non-stress environments and ranged from 1.34 to 1.61mg/gin drought conditions. The data of mean values for chlorophyll bin studied germplasms (Table 2) ranged from 0.46 to 0.64 mg/g in non-stress conditions and from 0.39 to 0.57mg/g under stress environments. In plant cells, photosynthesis is the main course in plant cells which regulates a low concentration of water culture medium. If chlorophyll contents are higher, then photosynthesis mechanisms will be more efficient. In the current study, the genotypes CHAKWAL-86, 10115, and 9493 had a high amount of chlorophyll a and CHAKWAL-86, BWL-812, and 9618 showed better performance for chlorophyll b; they were classified as drought-tolerant genotypes. BARS-2009 was categorized as drought-susceptible due to its low performance for both traits, as exhibited in Table 3. Photosynthetic pigments are reduced in wheat with the increase in water deficit due to thylakoid membranes splitting upon dehydration of cells [54]. Some wheat breeders emphasized lessening chlorophyll contents in drought environments [58], while drought-resistant varieties sustained a high quantity of these pigments in water stress conditions [54,56,57]. Drought stress can abolish the chlorophyll content and inhibit its synthesis [59]. Chlorophyll content decreased or destroyed by drought produces reactive oxygen species (ROS) such as O2 and H2O2, which can lead to lipid peroxidation [60]. Changing of leaf color from green to yellow was observed due to decreasing chlorophyll contents under drought conditions [61].
Carotenoids have a significant role in photosynthesis. The biosynthesis of carotenoids in plants is controlled by its genetic constitutions, but environmental conditions also affect synthesis due to interactions with genotype [22]. In this study, data collected (Table 2) for carotenoids under the observed germplasm ranged from 0.32 to 0.49 mg/g in non-stress conditions and from 0.24 to 0.41 mg/g under stress environments. Chlorophyll maintenance is essential for photosynthesis in water-deficient environments. Carotenoids play a vital role in scavenging singlet oxygen; hence, their comparative amount in a plant decides its relative tolerance. In the present experiment, the maximum amount of carotenoid in genotypes 9618, BWL-812, and 9930resulted in them being considered as drought-tolerant varieties (Table 3). The maximum amounts of chlorophyll and carotenoid in tolerant varieties were also described in previous findings of wheat breeders [27,62,63]. These pigments were reduced upon increasing the drought intensity, and the varieties which displayed maximum chlorophyll amounts in water-deficient environments were considered drought-tolerant. Photosynthetic pigments of bread wheat varieties were influenced by drought [58,64].

3.2. Correlation Analysis

Correlation coefficients define the level of relationship between two variables or factors. It is valuable in plant breeding since it can show a foretelling association that can be exploited in practice, and it offers evidence about the relationship between several preferred traits. It offers a core concept of the association among various yield-contributing traits, which is beneficial for plant breeders in choosing varieties having desired attributes [65,66]. In this experiment, evidence of the correlation of seedling traits in non-stress and stress conditions may help advance strategies for the assortment of required varieties with preferred traits (Table 4).
In this study, simple correlation coefficients of root length exhibited a positive and strong correlation with root/shoot ratio, fresh weight, dry weight, cell membrane thermo-stability, carotenoid, and chlorophyll a, while a negative association was exhibited with shoot length and relative water content, as also reported by wheat scientists [36]. The association of shoot length was negative with other tested characters, except for RWC, which showed a significant and positive association, and chlorophyll a, which showed a non-significant association. Some scientists showed contrasting findings, whereby root length was positively correlated with shoot length, while root/shoot ratio was highly significantly associated with fresh weight, dry weight, cell membrane thermo-stability, carotenoid, and chlorophyll a.
In the current experiment, relative water content only showed a positive association with shoot length, while it was negatively correlated with all other studied traits. Wheat breeders [67] conducted an experiment and they observed a positive and highly significant correlation between fresh shoot weight and dry shoot weight under normal and drought conditions. Higher chlorophyll and carotenoid contents in tolerant genotypes were also reported earlier by wheat scientists [27,62]. In the current experiment, a highly significant association was recorded between cell membrane thermo-stability and carotenoid, chlorophyll a, and chlorophyll b. Some findings [32] related to the current study in terms of shoot length showed that it was negatively correlated with root/shoot ratio and root length, while relative water content was negatively correlated with root length under normal conditions. In this experiment, a strong association existed between carotenoid and chlorophyll a and chlorophyll b.
RWC had a positive association with shoot length, but a negative association with the remaining traits. Chlorophyll b had a negative association with shoot length and relative water content. Chlorophyll a showed a negative association with RWC and had a non-significant positive correlation with shoot length, while the remaining studied traits exhibited a significant positive correlation. The present results are supported by the findings of Dhanda et al. [32].
Under drought conditions (Table 4), simple correlation showed that root length was positively associated with fresh weight, dry weight, and relative water content. Cell membrane thermo-stability showed a non-significant association with shoot length, chlorophyll a, and chlorophyll b, but a negative association with carotenoid and root/shoot ratio. Under drought conditions, the correlation of root length with root/shoot ratio was non-significant. Fresh weight and dry weight also showed a found positive and significant relationship, whereas its relationship with root/shoot ratio was non-significant. The results of Reference [68] support our findings, whereby their correlation coefficients depicted that root length showed a highly positive and significant association with fresh weight and dry weight under drought conditions.
Relative water content was positively associated with root length, fresh weight, dry weight, cell membrane thermo-stability, chlorophyll a, and chlorophyll b, while a negative non-significant relationship with shoot length, root/shoot ratio, and carotenoid was displayed (Table 4). Wheat breeders [54] investigated six wheat genotypes for their capacity to stand in drought conditions. Results showed that Sardari had the highest relative water content (74.43%) and Ghods contained 44.26% relative water content. The results of a wheat experiment [68] similar with this experiment showed that root/shoot ratio had a non-significant correlation with fresh weight, dry weight, root length, and shoot length. Many scientists [69] observed that genotypes retained the maximum percentage of relative water content and survived well in drought environments. The relative water content of a leaf is an essential sign of water status in plants; it reveals the stability between water supply to the leaf tissue and transpiration rate. The difference in the RWC of genotypes in water-deficient conditions may explain the difference in the maximum uptake of water from soil or the ability of stomata to reduce the loss of water [50].
Cell membrane thermo-stability was positively associated with root length, fresh weight, dry weight, relative water content, chlorophyll a, and chlorophyll b, while a negative relationship with shoot length, root/shoot ratio, and carotenoid was observed. The relationship between chlorophyll a and chlorophyll b was positive and highly significant, while they were both negatively correlated with carotenoids. Earlier findings [32] supported current results, indicating that the cell membrane thermo-stability of wheat seedlings was the most important trait, followed by root length, fresh weight, and dry weight, on the basis of their relationships with other traits. The results of a wheat experiment under drought conditions [36] supported the present findings, whereby root/shoot ratio expressed a negative correlation with shoot length under both conditions. This indicated that the underground part of the plant plays an important role under drought stress conditions [32]. Plant scientists [65] evaluated physiological traits as indicators of drought tolerance, and they concluded that those genotypes which possessed a high percentage of RWC and CMT resist more against drought than those genotypes which possess a low percentage of RWC and CMT in wheat. It was stated that maximum RWC is a resistance mechanism against water-deficient stress; it is the result of high osmotic regulation or a low elasticity of cell-wall tissue [18].
The different behavior of the indices in various conditions and their association may be due to an altered behavior of varieties under different environments [32]. The traits that were negatively correlated can affect he performance of other traits during the selection process. As root length, fresh weight, dry weight, cell membrane thermo-stability, and chlorophyll b were positively correlated with each other in both conditions, selection of any one trait would improve the performance of studied attributes. Chlorophyll destruction was revealed to be accompanied by the injury of mesophyll chloroplasts, which led to a lesser photosynthetic rate [70]. Furthermore, the reduction in chlorophyll and carotenoid levels in crop plants under water-deficient environments was deliberated as a typical symptom of oxidative stress and may be the result of pigment photo-oxidation and chlorophyll degradation [71]. As shoot length was non-significant and negatively correlated with the examined attributes, except for relative water content, selection for this trait seems to be a less promising criterion for this germplasm for the studied attributes.

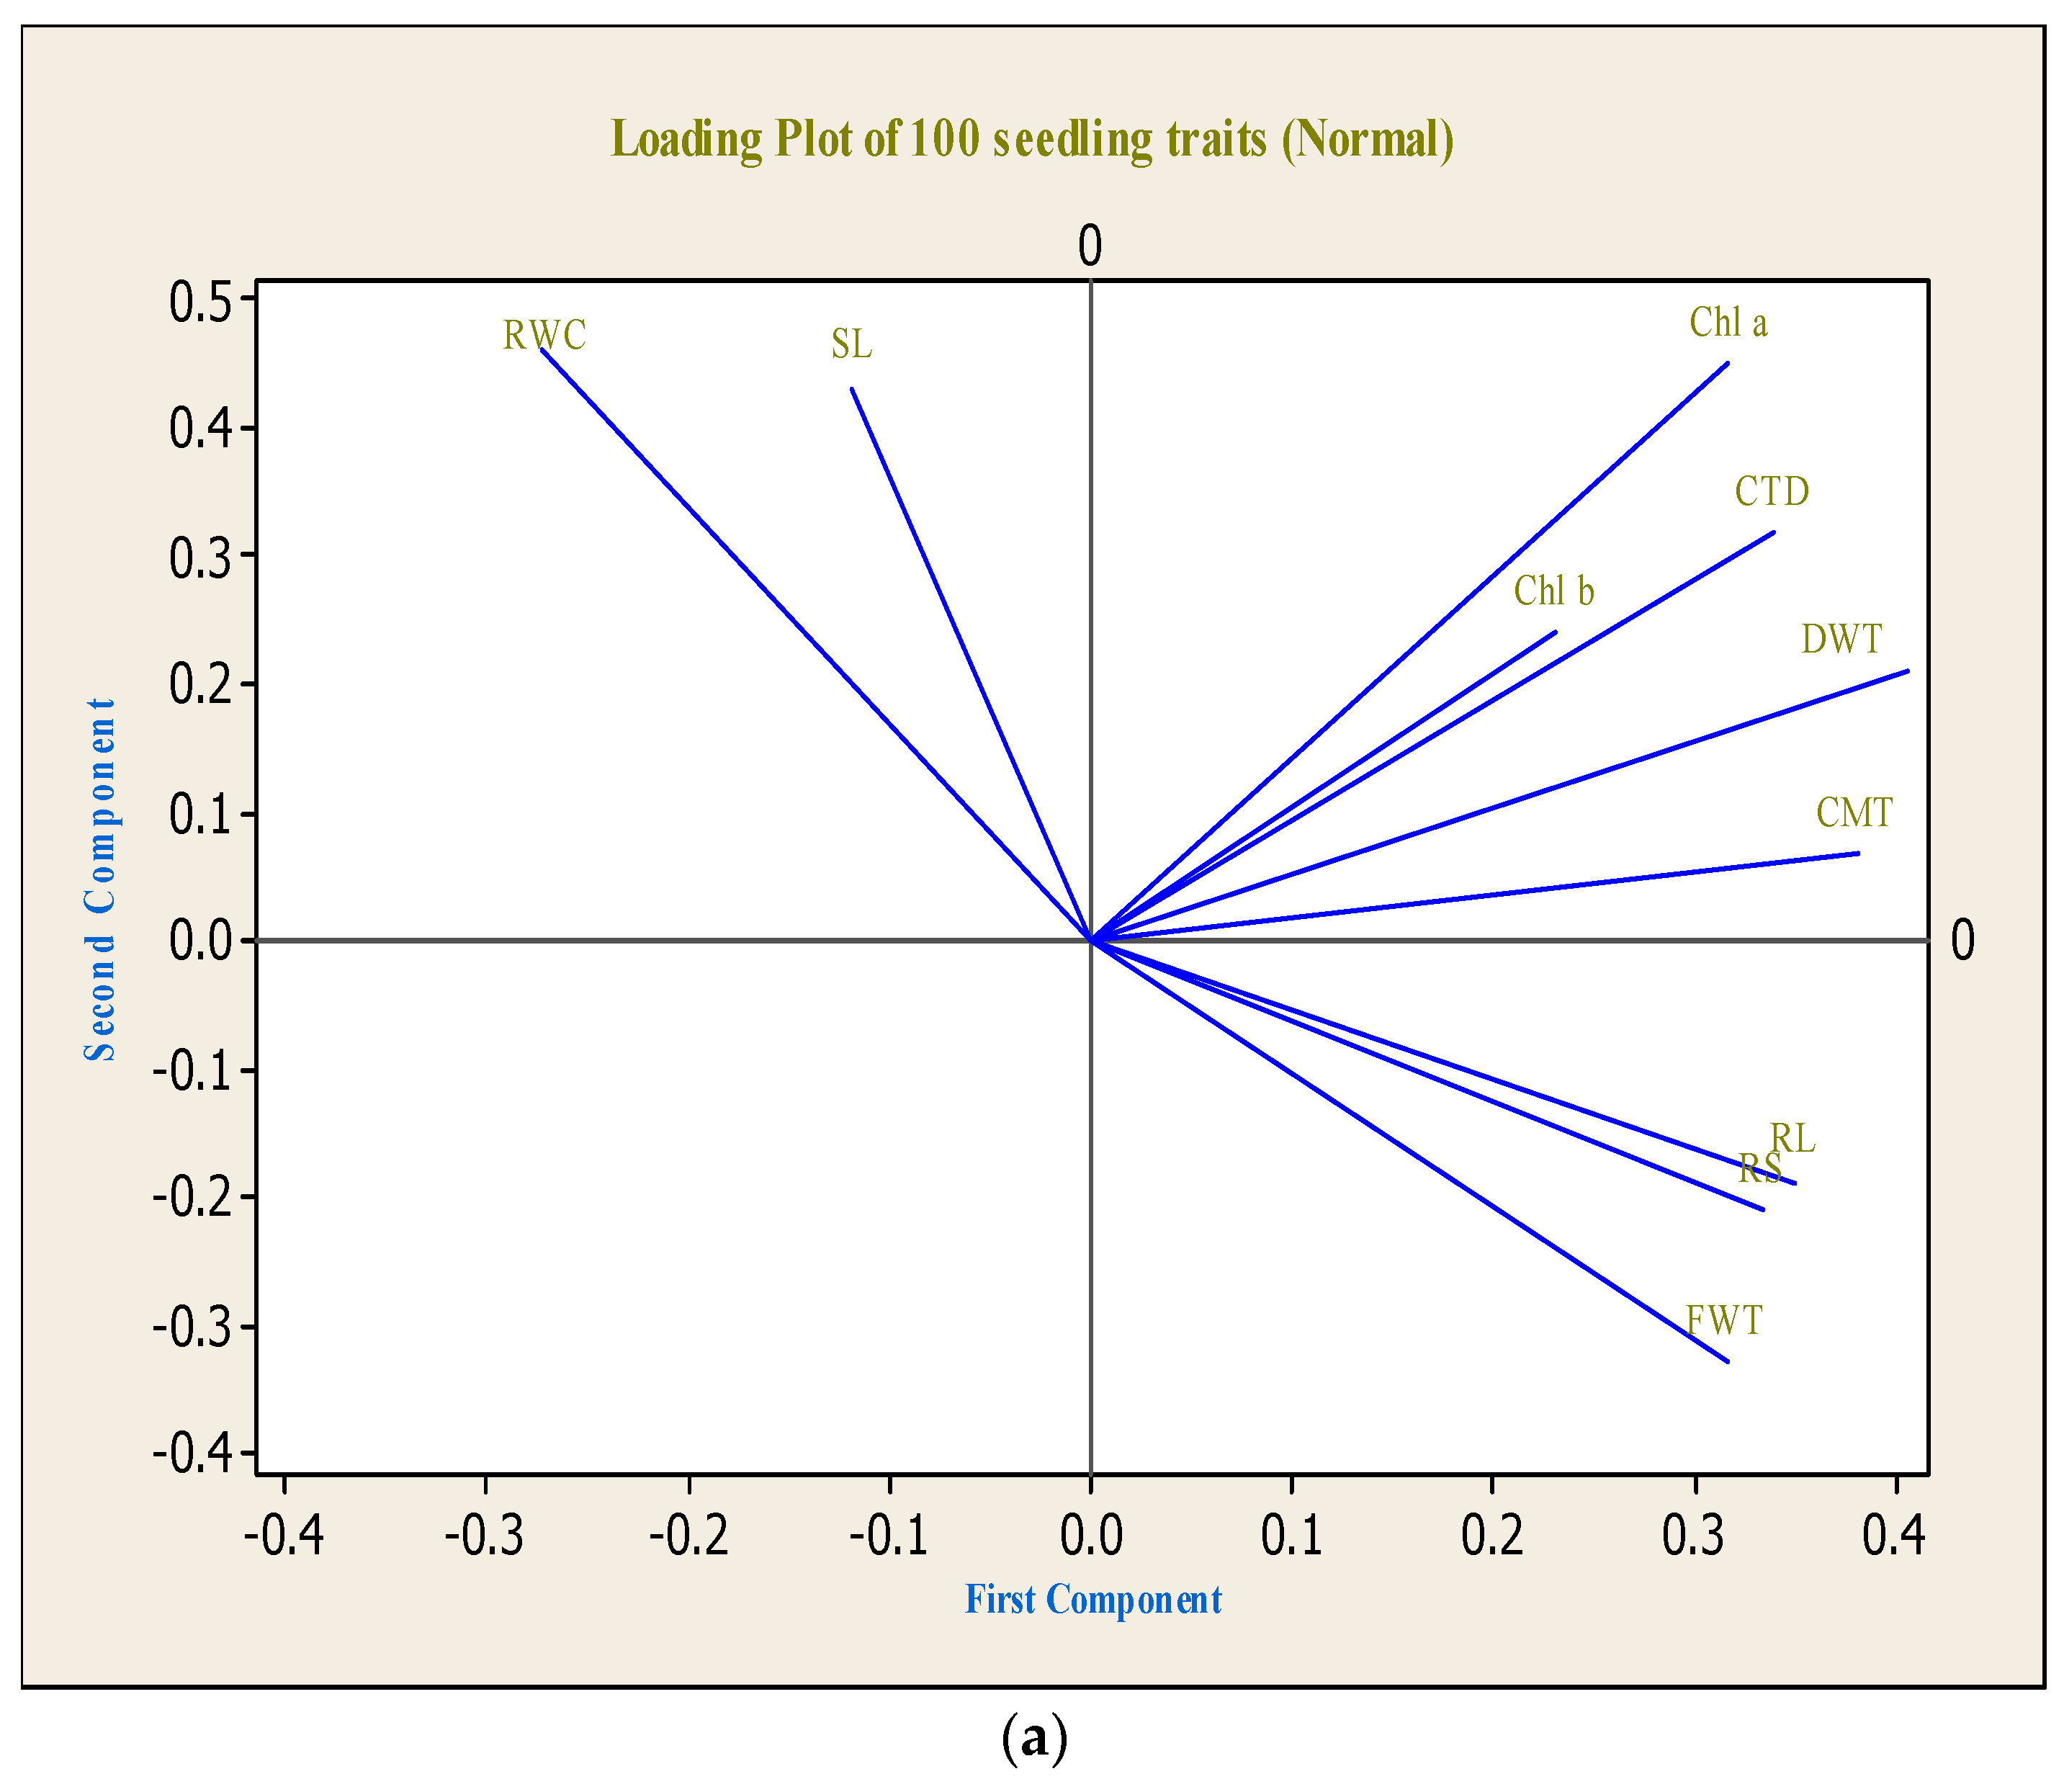
3.3. Principal Component Analysis (PCA)

Patterns of variation were studied in 105 wheat genotypes using principal component analysis (PCA) based on the correlation matrix to evaluate the diversity of the germplasm and the association of wheat seedling indices under normal and drought conditions. The significance of the eigenvalues, established by Kaiser [72], was used to choose the statistically significant principal components (PCs). Only the PCs that exhibited eigenvalues higher than one were measured as significant.
Principal component (PC) analysis is a multivariate statistical analysis for examining and simplifying complex and large datasets. This analysis transforms the larger number of correlated variables into smaller ones, as explained by El-Deeb and Mohamed [73]. Similarly, a biplot analysis can be utilized to select variables that can be categorized into main groups and subgroups based on homogeneity and dissimilarity. For parental selection in breeding programs, biplot analysis was previously used for this purpose [74,75,76].
Out of 10 principal components (Table 5), the first three PCs exhibited eigen values higher than one (significant) under both conditions. The other seven PCs exhibited non-significant variation and were not worthy of further interpretation (eigen values less than one). Under normal and stress conditions, the first three PCs showed 74.6% and 76% total variation, respectively, in the studied germplasm. The first PC accounted for 46.5% of the variance, the second accounted for 14.9%, and the third accounted for 13.2% under normal conditions. In drought conditions, the first PC contributed 48.1% of the total variance, the second contributed 15.5%, and the third contributed 12.4%.
The first PC was highly related to dry weight (0.406) and cell membrane thermo-stability (0.381) under normal conditions, while, under stress conditions, it was highly related to relative water content and cell membrane thermo-stability (Table 6). PC2 was related to relative water content and chlorophyll a, with a maximum negative value for fresh weight under normal conditions; in drought conditions, it was positively related to carotenoid and root/shoot ratio, and displayed the highest negative value for root length, while chlorophyll a had no relationship (Table 6). The third PC was highly related to chlorophyll b and chlorophyll a, and negatively related to root length under normal conditions. Under drought conditions, PC3 was positively related to root/shoot ratio and root length, while it was negatively related to shoot length and chlorophyll b (Table 6). Water stress causes water loss from plant tissues, which seriously impairs both membrane structure and function [32]. The membrane of plant cells is one of the first targets of drought stress, and the ability of plants to maintain membrane integrity under drought is what determines tolerance toward drought; this is used as a criterion for discriminating among tolerant and susceptible varieties.
The projection of traits on PC1 and PC2 under normal conditions revealed that root length and root/shoot ratio were highly and positively related to seedling fresh weight. Relative water content and shoot length were associated with each other and had a negative relationship with all other studied traits (Figure 1a). This deviation in RWC may be attributed to differences in the ability of the varieties to absorb more water from the soil and/or the ability to control water loss through the stomata. It may also be due to differences in the ability of the examined genotypes to accumulate water and adjust osmotically. Chlorophyll a, b, carotenoid, and cell membrane thermo-stability showed a positive association with seedling dry weight, but a negative association with all other remaining traits under normal conditions (Figure 1a). The major role of carotenoid through the direct quenching of triplet chlorophyll prevents the generation of singlet oxygen and protects the plant from oxidative damage. Chlorophyll and carotenoid absorb radiant energy, which is used for photosynthesis [60,77]. The projection of traits on PC1 and PC2 under drought conditions revealed that root length, shoot length, and carotenoid were negatively associated with each other, and had no relationship with other studied traits. Chlorophyll a,b, relative water content, cell membrane thermo-stability, and fresh weight were highly and positively related to dry weight (Figure 1b).
Principal component analysis is also helpful in selecting diverse parents for hybridization and other plant breeding techniques [78]. The projection of genotypes on PC1 and PC2 was useful in the selection of the diverse groups of parents. The projected pattern of genotypes on the two PCs showed the population structure under normal and drought conditions. The genotypes appearing in the same square box in Figure 2a,b, had the same performance, while those appearing in different squared boxes had differing performance.
Under normal conditions, G21 (BWL-812), G61 (CHAKWAL-86), G16 (9930), and G11 (9797) were opposite to G105 (BARS-2009) and G98 (MOOMAL-2002). Genotypes G1 (9493) and G4 (9515) were opposite to genotype G102 (Nowshera-96), while G104 (Parwaz-94) and G3 (9508) were opposite to each other and showed clear diversity among all genotypes (Figure 2a). There was a clear difference between drought-tolerant and drought-susceptible genotypes. Under drought conditions, the genotypes G1 (9493) and G6 (9618) were opposite to G105 (BARS-2009), G98 (MOOMAL-2002), and G3 (9508), while G96 (FSD-83) was opposite to G11 (9930) and G14 (9877). Genotype G11 (9797) and genotype G1 (9493) showed clear diversity from G3 (9508) and G105 (BARS-2009) (Figure 2b). Principal component analysis was also used by plant scientists [79] in wheat seedling traits to determine diversity and grouping [75]. Numerous plant breeders [79,80,81] used principal component analysis in spring wheat genotypes to obtain genetic diversity. Therefore, there is a dire need to investigate genetic diversity in the currently used germplasm in order to maintain a desirable level of genetic variation for future wheat breeding. The different behavior of wheat genotypes under drought stress conditions detected in this experiment may reflect the effect of genetic factors and the influence of environments [49,50,51].

4. Conclusions

In total, 105 wheat genotypes were screened against drought stress under factorial CRD using root length, shoot length, root/shoot ratio, seedling fresh weight, seedling dry weight, relative water content, cell membrane thermo-stability, chlorophyll a, b, and carotenoid as drought indices in wheat. The projection of traits on PC1 and PC2 under drought conditions revealed that root length, shoot length, and carotenoid were negatively associated with each other, and no relationship was found with other studied traits. Thus, selection for shoot length is not a promising criterion for this germplasm. The genotypes which performed better among the 105 spring wheat genotypes were considered as drought-tolerant, and those having the lowest performance under both conditions were considered as drought-susceptible. Therefore, using these criteria, 10 genotypes were selected as drought-tolerant (9493, 9618, 9797, 9930, BWL-812, DPW-621-50, C-128196, 10115, 10117 and CHAKWAL-86) and five genotypes were selected as drought-susceptible (9508, MILLAT-2011, UFAQ-2002, MOOMAL-2002 and BARS-2009). The present investigations also showed a clear-cut identity of genotypes and selection criteria for preferred traits, which would be of great utility in wheat breeding programs for developing drought-tolerant wheat genotypes.

Supplementary Materials

The following are available online at https://www.mdpi.com/2071-1050/11/9/2584/s1.

Author Contributions

H.G.M.-D.A. methodology and writing original draft preparation also collected experimental data. M.S. Investigations and improving the first draft. S.H.K. Supervision. M.A.A. reviewed the manuscript. M.R. and R.H.M. data analysis. M.L. reviewing and editing the manuscript.

Funding

The authors gratefully acknowledge the National Key R&D Program of China (2018YFD0200500) for the financial support.

Conflicts of Interest

The authors declare no conflict of interest.

References

  1. Dixon, J.; Braun, H.-J.; Kosina, P.; Crouch, J.H. Wheat Facts and Futures 2009; Cimmyt: Mexico City, Mexico, 2009. [Google Scholar]
  2. Ahmed, H.G.M.-D.; Khan, A.S.; Kashif, M.; Khan, S. Genetic analysis of yield and physical traits of spring wheat grain. J. Natl. Sci. Found. Sri Lanka 2018, 46, 23–30. [Google Scholar] [CrossRef]
  3. Abbas, M.; Sheikh, A.; Sabir, H.M.; Nighat, S. Factors responsible for low wheat productivity in Central Punjab. Pak. J. Agric. Sci. 2005, 42, 3–4. [Google Scholar]
  4. Bashir, A.; Mahmood, M.A.; Sheikh, A.; Kashif, M. Causes of wheat yield decline in the irrigated Punjab. J. Agric. Res. 2006, 44, 71–83. [Google Scholar]
  5. Yagdi, E.A.C.K. Study of genetic diversity in wheat (Triticum aestivum) varities using Random Amplified Polymorphic DNA (RAPD) analysis. Turk. J. Field Crops 2012, 17, 91–95. [Google Scholar]
  6. Toker, C.; Canci, H.; Yildirim, T. Evaluation of perennial wild Cicer species for drought resistance. Genet. Resour. Crop Evol. 2007, 54, 1781–1786. [Google Scholar] [CrossRef]
  7. Ali, A.; Ali, N.; Ullah, N.; Ullah, F.; Adnan, M.; Ahmed, Z. Effect of drought stress on the physiology and yield of the Pakistani wheat germplasms. Int. J. Adv. Res. Technol. 2013, 2, 419–430. [Google Scholar]
  8. Batool, A.; Noorka, I.R.; Afzal, M.; Syed, A.H. Estimation of heterosis, heterobeltiosis and potence ratio over environments among pre and post Green Revolution Spring wheat in Pakistan. J. Basic Appl. Sci. 2013, 9, 36–43. [Google Scholar]
  9. Mir, R.R.; Zaman-Allah, M.; Sreenivasulu, N.; Trethowan, R.; Varshney, R.K. Integrated genomics, physiology and breeding approaches for improving drought tolerance in crops. Theor. Appl. Genet. 2012, 125, 625–645. [Google Scholar] [CrossRef] [PubMed] [Green Version]
  10. Ahmad, I.; Khaliq, I.; Khan, A.S.; Farooq, M. Screening of spring wheat (Triticum aestivum L.) genotypes for drought tolerance on the basis of seedling traits. Pak. J. Agric. Sci. 2014, 51, 367–372. [Google Scholar]
  11. Ahmed, H.; Khan, A.S.; Khan, S.H.; Kashif, M. Genome wide allelic pattern and genetic diversity of spring wheat genotypes through SSR markers. Int. J. Agric. Biol. 2017, 19, 1559–1565. [Google Scholar]
  12. Ashfaq, W.; Ul-Allah, S.; Kashif, M.; Sattar, A.; Nabi, H.G. Genetic variability study among wheat genotypes under normal and drought conditions. J. Glob. Innov. Agric. Soc. Sci. 2016, 4, 111–116. [Google Scholar] [CrossRef]
  13. Noorka, I.R.; Batool, A.; Rauf, S.; Teixeira da Silva, J.; Ashraf, E. Estimation of heterosis in wheat (Triticum aestivum L.) under contrasting water regimes. Int. J. Plant Breed. 2013, 7, 55–60. [Google Scholar]
  14. Zhang, H.; Wang, H. Evaluation of drought tolerance from a wheat recombination inbred line population at the early seedling growth stage. Afr. J. Agric. Res. 2012, 7, 6167–6172. [Google Scholar]
  15. Shahbazi, H.; Bihamta, M.R.; Taeb, M.; Darvish, F. Germination characters of wheat under osmotic stress: Heritability and relation with drought tolerance. Int. J. Agric. Res. Rev. 2012, 2, 689–698. [Google Scholar]
  16. Bilal, M.; Rashid, R.; Rehman, S.; Iqbal, F.; Ahmed, J.; Abid, M.; Ahmed, Z.; Hayat, A. Evaluation of wheat genotypes for drought tolerance. J. Green Physiol. Genet. Genom. 2015, 1, 11–21. [Google Scholar]
  17. Almeselmani, M.; Abdullah, F.; Hareri, F.; Naaesan, M.; Ammar, M.A.; ZuherKanbar, O.; Saud, A.A. Effect of drought on different physiological characters and yield component in different varieties of Syrian durum wheat. J. Agric. Sci. 2011, 3, 127. [Google Scholar] [CrossRef]
  18. Arjenaki, F.G.; Jabbari, R.; Morshedi, A. Evaluation of drought stress on relative water content, chlorophyll content and mineral elements of wheat (Triticum aestivum L.) varieties. Int. J. Agric. Crop Sci. 2012, 4, 726–729. [Google Scholar]
  19. Datta, J.; Mondal, T.; Banerjee, A.; Mondal, N. Assessment of drought tolerance of selected wheat cultivars under laboratory condition. J. Agric. Technol. 2011, 7, 383–393. [Google Scholar]
  20. Jaleel, C.A.; Manivannan, P.; Wahid, A.; Farooq, M.; Al-Juburi, H.J.; Somasundaram, R.; Panneerselvam, R. Drought stress in plants: A review on morphological characteristics and pigments composition. Int. J. Agric. Biol. 2009, 11, 100–105. [Google Scholar]
  21. Anjum, S.A.; Xie, X.-Y.; Wang, L.-C.; Saleem, M.F.; Man, C.; Lei, W. Morphological, physiological and biochemical responses of plants to drought stress. Afr. J. Agric. Res. 2011, 6, 2026–2032. [Google Scholar]
  22. Bojović, B.; Stojanović, J. Chlorophyll and carotenoid content in wheat cultivars as a function of mineral nutrition. Arch. Biol. Sci. 2005, 57, 283–290. [Google Scholar] [CrossRef] [Green Version]
  23. Gugino, B.K.; Abawi, G.S.; Idowu, O.J.; Schindelbeck, R.R.; Smith, L.L.; Thies, J.E.; Wolfe, D.W.; Van Es, H.M. Cornell Soil Health Assessment Training Manual; Cornell University College of Agriculture and Life Sciences: Ithaca, NY, USA, 2009. [Google Scholar]
  24. Moebius-Clune, B.; Moebius-Clune, D.; Gugino, B.; Idowu, O.; Schindelbeck, R.; Ristow, A. Comprehensive Assessment of Soil Health: The Cornell Framework Manual, Edition 3.1; Cornell University: Ithaca, NY, USA, 2016. [Google Scholar]
  25. Dhanda, S.; Sethi, G. Inheritance of excised-leaf water loss and relative water content in bread wheat (Triticum aestivum). Euphytica 1998, 104, 39–47. [Google Scholar] [CrossRef]
  26. Blum, A.; Ebercon, A. Cell membrane stability as a measure of drought and heat tolerance in wheat 1. Crop Sci. 1981, 21, 43–47. [Google Scholar] [CrossRef]
  27. Lohithaswa, H.; Desai, S.; Hanchinal, R.; Patil, B.; Math, K.; Kalappanavar, I.; Bandivadder, T.; Chandrashekhara, C. Combining ability in tetraploid wheat for yield, yield attributing traits, quality and rust resistance over environments. Karnataka J. Agric. Sci. 2014, 26, 190–193. [Google Scholar]
  28. Röbbelen, G. Untersuchungen an strahleninduzierten Blattfarbmutanten von Arabidopsis thaliana (L) Heynh. Zeitschrift für Induktive Abstammungs- und Vererbungslehre 1957, 88, 189–252. [Google Scholar]
  29. Steel, R.G.D.; Torrie, J.H. Principles and Procedures of Statistics, a Biometrical Approach; McGraw-Hill Kogakusha: Tokyo, Japan, 1980. [Google Scholar]
  30. Ogunbayo, S.; Ojo, D.; Guei, R.; Oyelakin, O.; Sanni, K.L. Phylogenetic diversity and relationships among 40 rice accessions using morphological and RAPDs techniques. Afr. J. Biotechnol. 2005, 4, 1234–1244. [Google Scholar]
  31. Leishman, M.R.; Westoby, M. The role of seed size in seedling establishment in dry soil conditions—Experimental evidence from semi-arid species. J. Ecol. 1994, 82, 249–258. [Google Scholar] [CrossRef]
  32. Dhanda, S.; Sethi, G.; Behl, R. Indices of drought tolerance in wheat genotypes at early stages of plant growth. J. Agron. Crop Sci. 2004, 190, 6–12. [Google Scholar] [CrossRef]
  33. Tuberosa, R.; Salvi, S. Genomics-based approaches to improve drought tolerance of crops. Trends Plant Sci. 2006, 11, 405–412. [Google Scholar] [CrossRef]
  34. De Dorlodot, S.; Forster, B.; Pagès, L.; Price, A.; Tuberosa, R.; Draye, X. Root system architecture: opportunities and constraints for genetic improvement of crops. Trends Plant Sci. 2007, 12, 474–481. [Google Scholar] [CrossRef] [PubMed]
  35. Sehgal, D.; Skot, L.; Singh, R.; Srivastava, R.K.; Das, S.P.; Taunk, J.; Sharma, P.C.; Pal, R.; Raj, B.; Hash, C.T. Exploring potential of pearl millet germplasm association panel for association mapping of drought tolerance traits. PLoS ONE 2015, 10, e0122165. [Google Scholar] [CrossRef]
  36. Ahmad, M.; Shabbir, G.; Minhas, N.; Shah, M.K.N. Identification of drought tolerant wheat genotypes based on seedling traits. Sarhad J. Agric. 2013, 29, 21–27. [Google Scholar]
  37. Faisal, S.; Mujtaba, S.; Khan, M.; Mahboob, W. Morpho-Physiological assessment of wheat (Triticum aestivum L.) genotypes for drought stress tolerance at seedling stage. Pak. J. Bot. 2017, 49, 445–452. [Google Scholar]
  38. Foito, A.; Byrne, S.L.; Shepherd, T.; Stewart, D.; Barth, S. Transcriptional and metabolic profiles of Lolium perenne L. genotypes in response to a PEG—Induced water stress. Plant Biotechnol. J. 2009, 7, 719–732. [Google Scholar] [CrossRef] [PubMed]
  39. Khodarahmpour, Z. Effect of drought stress induced by polyethylene glycol (PEG) on germination indices in corn (Zea mays L.) hybrids. Afr. J. Biotechnol. 2011, 10, 18222–18227. [Google Scholar] [CrossRef]
  40. Soltani, A.; Gholipoor, M.; Zeinali, E. Seed reserve utilization and seedling growth of wheat as affected by drought and salinity. Environ. Exp. Bot. 2006, 55, 195–200. [Google Scholar] [CrossRef]
  41. Sassi, K.; Abid, G.; Jemni, L.; Dridi-Al-Mohandes, B.; Boubaker, M. Comparative study of six varieties of durum wheat (Triticum durum Desf.) Vis-a-vis water stress. JAPS 2012, 15, 2157–2170. [Google Scholar]
  42. Kamran, M.; Shahbaz, M.; Ashraf, M.; Akram, N.A. Alleviation of drought-induced adverse effects in spring wheat (Triticum aestivum L.) using proline as a pre-sowing seed treatment. Pak. J. Bot. 2009, 41, 621–632. [Google Scholar]
  43. Marcińska, I.; Czyczyło-Mysza, I.; Skrzypek, E.; Filek, M.; Grzesiak, S.; Grzesiak, M.T.; Janowiak, F.; Hura, T.; Dziurka, M.; Dziurka, K. Impact of osmotic stress on physiological and biochemical characteristics in drought-susceptible and drought-resistant wheat genotypes. Acta Physiol. Planta. 2013, 35, 451–461. [Google Scholar] [CrossRef]
  44. Esfandiari, E.; Shakiba, M.R.; Mahboob, S.A.; Alyari, H.; Toorchi, M. Water stress, antioxidant enzyme activity and lipid peroxidation in wheat seedling. J. Food Agric. Environ. 2007, 5, 149–153. [Google Scholar]
  45. Selote, D.S.; Bharti, S.; Khanna-Chopra, R. Drought acclimation reduces O2− accumulation and lipid peroxidation in wheat seedlings. Biochem. Biophys. Res. Commun. 2004, 314, 724–729. [Google Scholar] [CrossRef] [PubMed]
  46. Subrahmanyam, D.; Subash, N.; Haris, A.; Sikka, A. Influence of water stress on leaf photosynthetic characteristics in wheat cultivars differing in their susceptibility to drought. Photosynthetica 2006, 44, 125–129. [Google Scholar] [CrossRef]
  47. Pour-Aboughadareh, A.; Ahmadi, J.; Mehrabi, A.A.; Etminan, A.; Moghaddam, M.; Siddique, K.H. Physiological responses to drought stress in wild relatives of wheat: Implications for wheat improvement. Acta Physiol. Planta 2017, 39, 106–114. [Google Scholar] [CrossRef]
  48. Ramani, H.; Mandavia, M.; Dave, R.; Bambharolia, R.; Silungwe, H.; Garaniya, N. Biochemical and physiological constituents and their correlation in wheat (Triticum aestivum L.) genotypes under high temperature at different development stages. Int. J. Plant Physiol. Biochem. 2017, 9, 1–8. [Google Scholar]
  49. Keyvan, S. The effects of drought stress on yield, relative water content, proline, soluble carbohydrates and chlorophyll of bread wheat cultivars. J. Anim. Plant Sci. 2010, 8, 1051–1060. [Google Scholar]
  50. Van Heerden, P.; De Villiers, O. Evaluation of the relative water content and the reduction of 2, 3, 5-triphenyltetrazoliumchloride as indicators of drought tolerance in spring wheat cultivars. S. Afr. J. Plant Soil 1996, 13, 131–135. [Google Scholar] [CrossRef]
  51. Ritchie, S.W.; Nguyen, H.T.; Holaday, A.S. Leaf water content and gas-exchange parameters of two wheat genotypes differing in drought resistance. Crop Sci. 1990, 30, 105–111. [Google Scholar] [CrossRef]
  52. Ahmadizadeh, M. Physiological and agro-morphological response to drought stress. MiddleEast J. Sci. Res. 2013, 13, 998–1009. [Google Scholar]
  53. Hussain, M.; Askandar, H.S.; Hassan, Z.A. Selecting high yielding wheat hybrids from a restricted factorial mating design. Sarhad J. Agric. 2013, 29, 173–179. [Google Scholar]
  54. Kalaji, H.M.; Jajoo, A.; Oukarroum, A.; Brestic, M.; Zivcak, M.; Samborska, I.A.; Cetner, M.D.; Łukasik, I.; Goltsev, V.; Ladle, R.J. Chlorophyll a fluorescence as a tool to monitor physiological status of plants under abiotic stress conditions. Acta Physiol. Planta 2016, 38, 102. [Google Scholar] [CrossRef]
  55. Bala, P.; Sikder, S. Evaluation of Heat Tolerance of Wheat Genotypes Through Membrane Thermostability Test. MAYFEB J. Agric. Sci. 2017, 2, 1–6. [Google Scholar]
  56. Zhang, M.; Lv, D.; Ge, P.; Bian, Y.; Chen, G.; Zhu, G.; Li, X.; Yan, Y. Phosphoproteome analysis reveals new drought response and defense mechanisms of seedling leaves in bread wheat (Triticum aestivum L.). J. Proteomics 2014, 109, 290–308. [Google Scholar] [CrossRef]
  57. Epée Missé, P.T. Wheat Seedling Physiological Adaptation to Overcome Water Stress. SSRN 2018, 2–11. [Google Scholar] [CrossRef]
  58. Farshadfar, E.; Amiri, R. Genetic analysis of physiological indicators of drought tolerance in bread wheat using diallel technique. Genetika 2015, 47, 107–118. [Google Scholar] [CrossRef]
  59. Saeidi, M.; Zabihi-e-Mahmoodabad, R. Evaluation of drought stress on relative water content and chlorophyll content of sesame (Sesamum indicum L.) genotypes at early flowering stage. Res. J. Environ. Sci. 2009, 3, 345–350. [Google Scholar]
  60. Khalilzadeh, R.; Seyed Sharifi, R.; Jalilian, J. Antioxidant status and physiological responses of wheat (Triticum aestivum L.) to cycocel application and bio fertilizers under water limitation condition. J. Plant Interact. 2016, 11, 130–137. [Google Scholar] [CrossRef]
  61. Schlemmer, M.R.; Francis, D.D.; Shanahan, J.; Schepers, J.S. Remotely measuring chlorophyll content in corn leaves with differing nitrogen levels and relative water content. Agron. J. 2005, 97, 106–112. [Google Scholar] [CrossRef]
  62. Livingston, D.P.; Hincha, D.K.; Heyer, A.G. Fructan and its relationship to abiotic stress tolerance in plants. Cell. Mol. Life Sci. 2009, 66, 2007–2023. [Google Scholar] [CrossRef] [PubMed] [Green Version]
  63. Lichtenthaler, H.K.; Wellburn, A.R. Determinations of total carotenoids and chlorophylls a and b of leaf extracts in different solvents. Biochem. Soc. Trans. 1983, 11, 591–592. [Google Scholar] [CrossRef]
  64. Liu, B.; An, G.; Gao, X. Morpho-physiological responses of Alhagi sparsifolia Shap.(leguminosae) seedlings to progressive drought stress. Pak. J. Bot. 2016, 48, 429–438. [Google Scholar]
  65. Ghafoor, G.; Hassan, G.; Ahmad, I.; Khan, S.N.; Suliman, S. Correlation analysis for different parameters of F2 bread wheat population. Pure Appl. Biol. 2013, 2, 28–31. [Google Scholar] [CrossRef]
  66. Ali, Y.; Atta, B.M.; Akhter, J.; Monneveux, P.; Lateef, Z. Genetic variability, association and diversity studies in wheat (Triticum aestivum L.) germplasm. Pak. J. Bot. 2008, 40, 2087–2097. [Google Scholar]
  67. Khan, M.; Shabbir, G.; Akram, Z.; Shah, M.; Ansar, M.; Cheema, N. Character association studies of seedling traits in different wheat genotypes under moisture stress conditions. SABRAO J. Breed. Genet. 2011, 45, 458–467. [Google Scholar]
  68. Saidi, A.; Ookawa, T.; Hirasawa, T. Responses of root growth to moderate soil water deficit in wheat seedlings. Plant Prod. Sci. 2010, 13, 261–268. [Google Scholar] [CrossRef]
  69. Soleimani, Z.; Ramshini, H.; Mortazavian, S.M.M.; Fazelnajafabadi, M.; Foughi, B. Screening for drought tolerance in Iranian wheat genotypes (Triticum aestivumL.) using physiological traits evaluated under drought stress and normal condition. Aust. J. Crop Sci. 2014, 8, 200–208. [Google Scholar]
  70. Naroui Rad, M.R.; Kadir, M.A.; Yusop, M.R. Genetic behaviour for plant capacity to produce chlorophyll in wheat (Triticum aestivum) under drought stress. Aust. J. Crop Sci. 2012, 6, 415. [Google Scholar]
  71. Oraki, H.; Aghaalikhana, M. Effect of water deficit stress on proline contents, soluble sugars, chlorophyll and grain yield of sunflower (Helianthus annuus L.) hybrids. Afr. J. Biotechnol. 2012, 11, 164–168. [Google Scholar]
  72. Kaiser, H.F. The application of electronic computers to factor analysis. Educ. Psychol. Meas. 1960, 20, 141–151. [Google Scholar] [CrossRef]
  73. El-Deeb, A.; Mohamed, N. Factor and cluster analysis for some quantitative characters in sesame (Sesamum indicum L.). In Proceedings of the Annual Conference ISSR, Cairo University, Cairo, Egypt, 4–6 December 1999; Volume 34. [Google Scholar]
  74. Jaynes, D.; Kaspar, T.; Colvin, T.; James, D. Cluster analysis of spatiotemporal corn yield patterns in an Iowa field. Agron. J. 2003, 95, 574–586. [Google Scholar] [CrossRef]
  75. Sisodia, B.; Rai, V. An application of principal component analysis for pre-harvest forecast model for wheat crop based on biometrical characters. Int. Res. J. Agric. Econ. Stat. 2017, 8, 83–87. [Google Scholar]
  76. Ali, M.; Zulkiffal, M.; Anwar, J.; Hussain, M.; Farooq, J.; Khan, S. Morpho-physiological diversity in advanced lines of bread wheat under drought conditions at post-anthesis stage. J. Anim. Plant Sci. 2015, 25, 431–441. [Google Scholar]
  77. Wang, J.; Li, S.; Li, K. Effects of water limited deficit stress during different growth stages on leaf protective enzymes of winter wheat. Acta Bot. Boreali Occident. Sin. 2001, 21, 47–52. [Google Scholar]
  78. Khodadadi, M.; Fotokian, M.H.; Miransari, M. Genetic diversity of wheat (Triticum aestivum L.) genotypes based on cluster and principal component analyses for breeding strategies. Aust. J. Crop Sci. 2011, 5, 17–24. [Google Scholar]
  79. Saima, G.; Khan, S.; Munawar, S.; Muhammad, A.; Muhammad, S. Genetic evaluation of spring wheat (Triticum aestivum) germplasm for yield and seedling vigor traits. J. Agric. Soc. Sci. 2012, 8, 123–128. [Google Scholar]
  80. Sajjad, M.; Khan, S.; Khan, A.S. Exploitation of germplasm for grain yield improvement in spring wheat (Triticum aestivum). Int. J. Agric. Biol. 2011, 13, 695–700. [Google Scholar]
  81. Bowne, J.B.; Erwin, T.A.; Juttner, J.; Schnurbusch, T.; Langridge, P.; Bacic, A.; Roessner, U. Drought responses of leaf tissues from wheat cultivars of differing drought tolerance at the metabolite level. Mol. Plant 2012, 5, 418–429. [Google Scholar] [CrossRef]
Figure 1. (a) Principal component (PC) loading plot (projection of variables on the factor plan 1 × 2) of seedling traits under normal conditions. (b) Principal component loading plot (projection of variables on the factor plan 1 × 2) of seedling traits under drought conditions.
Sustainability 11 02584 g001aSustainability 11 02584 g001b
Figure 2. (a)Two-dimensional score plot of 105 wheat genotypes on PC1 and PC2 under normal conditions. (b). Two-dimensional score plot of 105 wheat genotypes on PC1 and PC2 under drought conditions.
Sustainability 11 02584 g002
Table 1. Analysis of variance (ANOVA) mean squares of 105 genotypes at the seedling stage under normal and drought conditions.
Genotype(G)Conditions(C)G×CErrorTotal
SoV/df1041104420629
RL (cm)61.15**1749.07 **6.86 **3.13
SL (cm)39.51 **3792.76 **8.55 **2.1
R/S0.12351 **0.29618 **0.01561 **0.00841
FWT (g)0.0185 **18.6482 **0.0010 *0.0008
DWT (g)0.01035 **2.07891 **0.00253 **0.00057
RWC97.9 **14377.6 **1.9 ns5.6
CMT85.2 **17463.7 **0.4 ns3.4
CTD (mg/g Fw)0.00669 **0.77175**0.00010 ns0.00062
Chl.a(mg/g Fw)0.02483 **0.01939 **0.00074 ns0.00151
Chl.b(mg/g Fw)0.00701 **0.764420.00007 **0.0005
** Highly significant (0.01); * significant (0.05); ns non-significant. RL=root length; SL = shoot length; R/S= root/shoot; FWT = fresh weight; DWT = dry weight; RWC = relative water content; CMT = cell membrane thermo-stability; CTD = carotenoid; Chl.a = chlorophyll a; Chl.b = chlorophyll b; mg/g Fw = milligram per gram of fresh weight.
Table 2. Mean summary statistics of 10 seedling traits of 105 spring wheat genotypes under normal and drought conditions.
TraitsConditionsMinimumMaximumMeanSD
RL (cm)Normal7.2223.0011.664.005
Drought5.3117.658.322.542
SL(cm)Normal13.1629.1722.692.965
Drought11.0025.1917.792.755
R/SNormal0.270.940.510.170
Drought0.290.920.470.132
FWT (g)Normal0.751.110.940.048
Drought0.480.910.590.065
DWT(g)Normal0.180.490.260.059
Drought0.100.270.150.028
RWC (%)Normal61.0082.3371.224.099
Drought51.4572.7861.674.099
CMT (%)Normal55.0074.0064.133.789
Drought44.4763.4753.603.789
CTD (mg/g Fw)Normal0.320.490.400.034
Drought0.240.410.330.034
Chl.a (mg/g Fw)Normal1.361.651.480.066
Drought1.341.611.470.065
Chl.b (mg/g Fw)Normal0.460.640.540.034
Drought0.390.570.470.034
Table 3. Performance of bread genotypes under drought stress.
Traits Best-Performing Genotypes: Names and Mean Values (Drought-Tolerant)Worst-Performing Genotypes: Names and Mean Values (Drought-Susceptible)
SL (cm)9508 (25.19) followed by Sunstar (23.86)BARS-2009 (11) followed by MOOMAL-2002 (12)
RL (cm)CHAKWAL-86 (17.65) followed by 10117 (15.65) and DPW-621-50 (14)MOOMAL-2002 (4.98) followed by BARS-2009 (5.31) and MILLAT-2011(5.33)
R/SCHAKWAL-86 (0.92) followed by 10117 (0.90) and BWL-812 (0.71)9508(0.29) followed by UFAQ-2002(0.30) and G40 (0.31)
FWT (g)9797 (0.91) followed by 9493(0.83) and 9930 (0.78)MOOMAL-2002 (0.48) followed by UFAQ-2002(0.48) and BARS-2009 (0.49)
DWT (g)9493(0.27) followed by9797 (0.21) and 10115(0.20)BARS-2009 (0.10) followed by UFAQ-2002(0.11) and MILLAT-2011(0.11)
RWC (%)9618 (72.78) followed by 10111 (70.45) and 10117 (69.78)BARS-2009 (51.45) followed by UFAQ-2002(54.12) and MOOMAL-2002 (54.43)
CMT (%)9493(63.47) followed by G11 (62.47) and CHAKWAL-86 (59.47)9508(44.47) followed by MILLAT-2011(49.14) and MILLAT-2011(49.14)
CTD
(mg/g Fw)
9618 (0.41) followed by BWL-812 (0.40) and 9930 (0.39)MILLAT-2011(0.24) followed by MOOMAL-2002 (0.25) and UFAQ-2002(0.27)
Chl.a
(mg/g Fw)
CHAKWAL-86 (1.61) followed by 10115(1.60) and 9493(1.59)BARS-2009 (1.34) followed by MILLAT-2011(1.37) and UFAQ-2002(1.38)
Chl.b
(mg/g Fw)
CHAKWAL-86 (0.57) followed by BWL-812 (0.55) and 9618 (0.54)MOOMAL-2002 (0.39) followed by BARS-2009 (0.40) and 9508(0.42)
Table 4. Correlation matrix among wheat seedling traits under both environments.
Traits RLSLRSFWTDWTRWCCMTCTDChl a
SLN0.04 ns
D−0.19 ns
RSN−0.01 ns−0.17 ns
D0.93 **−0.20 *
FWTN0.19 *−0.14 ns0.15m ns
D0.48 **−0.18 ns0.41 **
DWTN0.33 **−0.16 ns0.03 ns0.88 **
D0.62 **−0.05 ns0.53 **0.52 **
RWCN0.30 **−0.19 ns−0.01 ns0.86 **0.92 **
D−0.33 **0.39 **−0.30 *−0.70 **−0.33 **
CMTN0.26 **−0.17 ns−0.02 ns0.86 **0.87 **0.92 **
D0.49 **−0.18 ns0.48 **0.47 **0.68 **0.50 **
CTDN−0.48 **0.16 ns0.32 **0.00 ns−0.15 ns−0.24 ns−0.22 *
D0.47 **−0.04 ns0.41 **0.34 **0.71 **−0.18 ns0.55 **
Chl.aN0.14 ns0.02 ns−0.07 ns0.49 **0.65 **0.63 **0.68 **−0.20 *
D0.29 **0.007 ns0.27 **0.28 **0.69 **−0.14 ns0.62 **0.58 **
Chl.bN0.07 ns0.03 ns0.002 ns0.49 **0.63 **0.55 **0.58 **−0.03 ns0.82 **
D0.08 ns−0.24 *0.135 ns0.16 ns0.43 **−0.28 **0.38 **0.38 **0.48 *
** Highly significant (0.01); * significant (0.05); ns non-significant
Table 5. Eigenvalues, variability, and cumulative of wheat seedling traits under both environments.
EnvironmentsPC1PC2PC3PC4PC5PC6PC7PC8PC9PC10
EigenvalueNormal4.651.491.320.860.490.440.340.20.170.05
Drought4.811.551.240.910.740.370.160.090.080.04
Variability (%) Normal46.514.913.28.64.94.43.421.70.5
Drought48.115.512.49.17.43.71.60.90.80.4
Cumulative (%)Normal46.561.474.683.388.192.595.997.899.5100
Drought48.163.675.985.192.496.297.898.799.6100
PC = principal components PC1 to PC10 of studied wheat seedling traits.
Table 6. Principal component analysis (loading factor) of seedling traits under normal and drought conditions.
VariablesEnvironmentsPC1PC2PC3
Root lengthNormal0.349−0.188−0.480
Drought0.155−0.4860.247
Shoot lengthNormal−0.1180.432−0.410
Drought−0.066−0.055−0.668
Root/shootNormal0.334−0.211−0.440
Drought0.0020.4910.434
Fresh weightNormal0.316−0.3290.060
Drought0.3970.2000.138
Dry weightNormal0.4060.212−0.062
Drought0.4350.0500.071
Relative water contentNormal−0.2720.463−0.323
Drought0.432−0.0060.101
Cell membrane thermo-stabilityNormal0.3810.0670.102
Drought0.4300.0110.020
CarotenoidNormal0.3390.318−0.050
Drought−0.1150.678−0.164
Chlorophyll aNormal0.3170.4500.138
Drought0.3590.000−0.333
Chlorophyll bNormal0.2310.2400.514
Drought0.3340.135−0.363

