Tracing Air Pollutant Emissions in China: Structural Decomposition and GVC Accounting


1
School of Public Administration, Southwestern University of Finance and Economics, Chengdu 611130, China
2
Sichuan Institute for Free Trade Zone Research, Southwestern University of Finance and Economics, Chengdu 611130, China
3
School of International Business, Southwestern University of Finance and Economics, Chengdu 611130, China
*
Author to whom correspondence should be addressed.
Sustainability 2019, 11(9), 2551; https://doi.org/10.3390/su11092551
Submission received: 13 March 2019
/
Revised: 18 April 2019
/
Accepted: 26 April 2019
/
Published: 2 May 2019
(This article belongs to the Special Issue A New Look at Economic Approaches to Environmental, Natural Resources and Energy Economics)
Abstract
:The depth and breadth of China’s participation in global value chains have an important impact on the emissions of air pollutants from the production side, consumption side, and trade implications in China’s industries. Based on the global value chain accounting framework, this paper examines the path of China’s major air pollutant emissions in production and consumption during 1995–2009 and structurally decomposes the factors affecting air pollutant emissions. The results show that, firstly, both the air pollutant emissions on the production side and the air pollution emissions on the consumption side have increased significantly, and the production-side emissions have been higher than the consumption-side emissions. Secondly, the export of intermediate products shows a trend of “high pollution”, and this trend was more obvious after China’s accession to the world trade organization (WTO). Thirdly, the expansion of economic growth was the most important factor in the rapid emission of air pollutants in China and the reduction of pollution efficiency in Chinese industries depends on the increase in service inputs.
1. Introduction
According to the national bureau of statistics, China’s gross domestic product (GDP) grew by 6.7% year-on-year in 2016 and it reached 74,412.7 billion yuan, ranking second in the world. Since the reform and opening up, China’s economy has been in rapid development and the people’s living standard has improved greatly. China’s achievements in economic development have not only benefited from domestic economic reform and institutional innovation but has also been inseparable from actively taking part in the global value chain. Some researchers found that the participation index of China’s global value chain rose from 29% to 40.6% during 1995–2009 [1]. In a report released in 2015, the world trade organization (WTO) showed that China’s trade in intermediate goods accounted for 3% of global trade in 1996, up from 15% in 2012. As the largest factory in the world, China has been highly involved in the global value chain division of labor. At the same time, however, China’s air pollution problem is getting worse. According to the data from the 2016 China Climate Bulletin, there were eight large-scale moderate or heavy haze events in 2016, among which the most serious one extended to 17 provinces, covering an area of 1.42 million square kilometers. That is to say, the haze covered more than one seventh of the country. How to ensure steady and rapid economic development and avoid heavy environmental costs while enjoying the benefits brought by participating in the global value chain is a common problem faced by developing countries including China. So how much of China’s air pollution comes from participating in global value chains? Do different industries or products behave differently? How to reduce air pollution emissions while maintaining economic growth? Based on the above problems and related literature, this paper attempts to systematically analyze the emission path of China’s air pollutants in the global value chain from both national and industrial perspectives. We used the analysis framework of the global value chain and explored factors that influence efficiency of air pollutant emissions through structure decomposition. We also provide policy suggestions on how to reduce air pollution.
As shown in Figure 1, we can see that China’s total GDP (as shown by the black line) rose from 60,794 × 100 million yuan to 340,903 × 100 million yuan during the period 1995–2009 and the growth of China’s total GDP rose year by year. Figure 1 also tells us that total air pollutant emissions (as shown by the gray line) by China has increased from 107,478 billion cubic meters to 436,063.85 billion cubic meters. From Figure 1, we can see that China’s air pollution emissions have increased significantly with the growth of GDP. The results are similar with the opinion that suggests air pollution is related to a country’s economic growth [2,3,4]. Based on this opinion, some researchers advanced an idea that air pollution is also related to a country’s international trade which promotes economic growth [5,6,7,8,9,10,11].
Because China integrated into the world trade system during 1995–2009, so its international trade has increased rapidly. China’s economy has not only increased in size, but it has gone through significant industry structural change and technological progress [12,13,14,15]. These changes have different implications for china’s air pollution and there are few studies that systematically approach how economic growth and trade are associated with air pollution. Thus, we used the production-side accounting framework [16,17,18] to analyze the separate effects of economic size, industry structural change, and emission-reduction technical progress on China’s total air pollution. We also used the consumption-side accounting framework [19,20,21] to trace China’s air pollution.
Except for the introduction, the remaining structure of this paper is organized as follows: the second part is the literature review. The third part is the concept of the global value chain accounting framework and the SDA structure decomposition. This part also contains the main data source of this paper. The fourth part is the analysis of accounting results and structural decomposition. The last part are the main conclusions and suggestions.
2. Literature Review
Studies on global value chains and environmental pollution by domestic and foreign scholars are mainly divided into the following three aspects: firstly, scholars discussed the relationship between economic growth and environmental pollution. Some scholars proposed the hypothesis that economic growth and environmental pollution have a relationship that is an “inverted u-shaped” curve [2,22]. Other scholars later called this curve relationship the environmental Kuznets curve (EKC) and verified it by theory or practice [23,24]. The core idea of “EKC hypothesis” is that economic growth will lead to pollution, but this causal relationship will turn at a certain stage, that is, when the economy grows to a certain extent, economic growth will lead to improvements in environmental pollution. Usually the emergence of this “turning point” stems from three mechanisms, namely, the scale effect, the structural effect, and the technical effect. The scale effect means that as the economy grows and economic activities expand, the demand for resources will further intensify, resulting in more pollution emissions, so the scale effect will delay the emergence of the “turning points”. The structural effect means that when a country enters the bottleneck of economic development, it often needs to change its economic structure and upgrade its industrial structure. To develop a clean service-oriented economy and an innovation-driven industry, it needs to reduce pollution emissions. The technical effect means that less resources are used in production processes and that the production processes are simplified more with technological innovation and progress, which further reduces pollution emissions and improves environmental quality. Overall, both the structural effect and technical effect are positively related to environmental quality.
Secondly, researchers discussed the effects of pollution reduction and the spatial transfer of polluting industry from the perspective of environmental regulation. With the development of the economy, the cost of producing highly polluting products in developed countries is increasing. In order to maintain competitive advantage, these polluting industries often choose countries with low environmental regulation and standards for production (low environmental regulation standards usually mean low production costs and a cost advantage in producing products locally) and developing countries are the best choice usually. Therefore, these developing countries have become a refuge for polluting industries in developed countries [25,26]. However, some scholars found that the “pollution paradise hypothesis” does not exist completely [27]. In general, the mechanism of environmental regulation on pollution reduction needs to be further developed. However, scholars generally believe that environmental regulation can promote the relocation of polluting industries and it can reduce the emission intensity of pollution by improving production technology [28,29].
Thirdly, researchers discussed the relationship between international trade, foreign direct investment (FDI), and environmental pollution. The “pollution paradise hypothesis” believes that the disappearance of trade barriers leads to the transfer of polluting industries and trade liberalization will accelerate the transfer of polluting industries in developed countries to developing countries such as China and India, so the local environment will be worse. In fact, for China, the technology spillover and other welfare effects brought by trade liberalization are actually beneficial to pollution reduction [18]. In addition, FDI directly affects China’s environmental quality through the transfer of polluting industries [30].
With the progress of internet technology and the improvement of transportation facilitation, an increasing number of countries are beginning to participate in international economic activities. Multinational companies organize the production of goods on a global scale, and the global economy has achieved common collaboration through global value chains. Similarly, the environmental problems faced by a country are not only caused by domestic production and consumption, but also more likely due to participation in all links of the global value chain, where foreign demand stimulates domestic production and emissions of pollutants. Scholars have begun to notice that the analysis of international trade and FDI does not grasp the entire chain and micro-mechanism of economic globalization. It is difficult to truly reflect the impact of increasingly integrated global economic activities on the environment, so they began to analyze the environmental problems of countries from the perspective of the global value chain [31,32]. Based on the acquisition of measurement indicators and environmental data, current research mainly focuses on the relationship between the global value chain and carbon dioxide emissions. For example, some researchers used the multi-regional input–output model to measure production-side and consumption-side implied carbon emissions [33], so they can determine which industry is to blame for the discharge of pollutants, thus providing a basis for a country to identify industries that need to reduce emissions.
Based on the above literature, we can find that the literature on the influencing factors of environmental problems has become increasingly mature. However, there is very little research on combining value chain accounting with air pollutant emission accounting systematically, and the related studies mainly focus on carbon dioxide emissions rather than other air pollutants (the air pollutants studied in this paper include methane, nitrous oxide, nitrogen oxides, sulfur oxides, carbon monoxide, non-methane volatile organic compounds, and ammonia. These pollutants constitute the main components of weather pollution such as haze). Compared with the existing literature, the possible contributions of this paper are as follows: this paper systematically decomposes the emission path of air pollutants in China based on the global value chain accounting framework, and tracks the source of air pollution emissions at three levels of national industrial products. This article also examines the influencing factors of the changes in emission intensity of air pollutants in China by using structural decomposition analysis (SDA).
3. Research Methods and Data Sources
Some articles introduce national changes in industrial air pollution through three paths [11]. The first is a change in the scale of output. The second is a change in the composition of products with little air pollution to products with substantial air pollution. The third is a change in the production technique. Therefore, we decomposed the emissions of air pollutants from the production side, consumption side, and trade implications in China’s industries.
3.1. Structural Decomposition of Emission Changes in China’s Production Side of Air Pollutants
3.1.1. Based on Emission Intensity of Air Pollutants
Although the Kuznets curve hypothesis believes that economic growth has an “inverted U-shaped” curve for environmental pollution emissions, it also acknowledges that the driving force for environmental improvement does not derive from economic growth itself, but from some growth spillovers, such as technological progress and industrial strength. Therefore, the elimination of the economic scale factor to decompose the emission intensity would be clearer for us to find out which factor has an impact on pollution reduction. For a given year, the total amount of air pollution discharged by a country is as follows:
where VA represents the added value of industry i and P/VA means the pollution per unit of industry i.
Rewrite Equation (1):
where is the ratio of the added value of industry i to the total GDP. The added value of each industry adds up to GDP, that means .
From Equation (1), we can write the increase in pollution as follow:
where represents the mean of added value, and is the mean of pollution per unit.
Therefore, we can get Equation (4) by combining Equation (2) and Equation (3):
where Part (1) means the industrial structure effect of emission intensity, and Part (2) is the technological progress effect of emission intensity. If the former is negative, it means that China’s industry was transformed from a heavily polluting industry to a sector with low output pollution under the factors that exclude economic scale changes. If the latter is negative, it indicates that the industry’s production technology improved, so that each unit of output is less pollution.
3.1.2. Based on the Total Amount of Emissions
Some papers advance an opinion that the size of a country’s economy, the level of production technology, and the difference in industrial structure will affect the emission of air pollutants in the production process [11]. For any industry i in China, the pollution per unit of output is expressed as follows (according to World Input-Output Database (WIOD) 2013, the total number of industries are 35):
where P represents the amount of air pollutant emissions, X represents the total output, and VA represents the added value.
Thus, the total amount of pollution emissions in any industry in China is expressed as:
From the perspective of industry i, the change in pollution emissions is determined by , , and .
From the perspective of China, the total amount of air pollution emissions in any year is expressed as:
Changes in total pollution emissions can be broken down (the derivation method here is similar to Section 3.1.1, so we did not write the derivation process to keep the length of the paper shorter):
In Equation (8), Part A indicates the impact of industries’ output on pollution emissions, which is the economic growth effect of air pollutant emissions. In addition, if it is positive, it means China’s expansionary economic growth will lead to increased pollution. Part B indicates the impact of the industries’ added value on the total amount of pollution emissions, which is the industrial structure effect of air pollutant emissions. If it is negative, it means that the added value per unit of output increases, and the air pollution emissions will decrease accordingly. Part C represents the impact of pollution emission amount added by industrial production unit on total emission, which is the technological advancement effect of the air pollutant discharge. If it is negative, it means that the pollution per unit output is less, and thus, the total amount of pollution emission decreases.
3.2. Multi-Region Input–Output Accounting System
According to the global value chain accounting framework [19], this article built a world input–output model including G countries and N industries, where s, r = 1, 2, 3, …, G represents the country; i, j = 1, 2, 3, …, and N represents the industries. is the total output of the country s. is the national input–output coefficient matrix of the country s. is the final product produced by the country s and used to meet the final needs of the country s. is the intermediate input coefficient matrix produced by the country s and exported to the country r. is the final goods produced by the country s and exported to the country r. is the Leontief inverse matrix, indicating the complete consumption coefficient. represents the total export value of the country s. Based on a fully enclosed multi-region input–output method (MRIO), the accounting system was divided into the following three parts:
3.2.1. Based on the Front-Line Decomposition of Industries
In Equation (9), the first part is the domestic goods of country s (it may simply refer to the country s as s) to meet the domestic final demand (). The second part is the domestic intermediate goods of s, which are exported to country r for the production of intermediate goods or final products. The final goods use the intermediate goods of s that are used for domestic final consumption of s (). The third part is the domestic final products or services of s, which are exported to other partner countries to meet the final needs of trading partners (). The fourth part means the domestic intermediate goods of s, which are exported to country r and used to produce final goods to meet final needs of the importer (). The fifth part is the domestic intermediate goods of s that are exported to country r and used to produce final goods in country r. Moreover, the final goods of country r that are exported to third countries to meet the final needs of third countries finally (). The front-line decomposition of industries decompose the air pollutant emissions which is caused by production based on the difference in production purposes in the country s, so the front-line decomposition of industries can also be called production-side emission decomposition.
3.2.2. Based on the Rear-Line Decomposition of Industries
The first part of Equation (10) indicates the air pollutants emissions in local industries of country s, which is also called domestic emissions (). The second part indicates the air pollutant emissions in country r caused by the final demand of country s (). Equation (11) is the seven pollutants that measure the total global emissions caused by the final demand of one country. The rear-line decomposition of industries includes domestic and foreign emissions caused by one country’s final demand (domestic consumption), which can be defined as consumption-side emissions decomposition.
3.2.3. Based on Decomposition of Total Exports
Due to the further separation of the production process, the production of goods in a country often requires intermediate products or final products from foreign countries, and the distribution of value chains in the world has become increasingly complex. Emissions in production and consumption processes also have different source pathways and regions due to different value chains. The accounting system consisting of the above three accounting frameworks can be traced back to the value chain’s construction process, so people can see which value chain channel a country uses to trade goods to other countries (regions) and how much pollution it emits at the same time.
3.3. Database and Description
Based on the global value chain accounting framework, this paper used the World Input–Output Table compiled by WIOD for multi-region input-output analysis. The input and output data released by WIOD are divided into the 2013 edition (data coverage 1995–2011) and the 2016 edition (data coverage 2000–2014). Because the air pollution emission data matched in this paper are also the environmental account data released by WIOD in 2013 (this data only covers 1995–2009, the data included carbon dioxide and seven other air pollutants in a comprehensive, year-by-year series, covering various pollutant indicators for air quality monitoring), so the data of air pollution emission matched in this paper exactly matches the number of industries and countries for the 2013 version of the input–output data. In view of the consistency of the analysis, this paper selected the 2013 version of the input–output table, and the research period was 1995–2009, with a total of 41 countries (regions) and 35 industry categories. In 2009, the total GDP of 40 countries (regions) included in the World Input–Output Table compiled by WIOD accounted for 86.14% of global GDP, so it is a good reflection of current world production and trade patterns. The 40 countries (regions) include China’s major trading partners, and are more suitable for analyzing China’s participation in air pollutant emissions in the global value chain. To analyze the emission paths of different industries further, this paper divided 35 industries into eight categories based on the method of factor density classification, as shown in Table 1.
4. Measurement Result Analysis
4.1. Source and Path Analysis of Air Pollutant Emissions in China Based on Global Value Chain Accounting Framework
4.1.1. The Decomposition Results of Front-line Industries (Production-Side Emissions)
As shown in Table 2, China’s air pollutant emissions on the production side in 1995–2009 showed a rapid growth trend, increasing from 125.30 million tons of pollutant emissions to 214.02 million tons, an increase of 70.8%. Overall, emissions increased by 91.17 million tons during the period 2001–2009, accounting for about 102.8% of the total growth during the entire study period. This shows that although joining the WTO was conducive to China’s better confrontation with the global wave of globalization and integration into the global production system, China has become the hardest hit by air pollution. Overall, although the proportion of foreign final demand emissions did not change much overall, due to the rapid growth of the overall scale of production-side emissions, foreign final demand emissions also increased substantially, from 27.05 million tons in 2001 to 46.53 million tons in 2009. In 2006, foreign final demand emissions accounted for 36.49% of total emissions, that is, more than one-third of China’s air pollution emissions were in order to meet the final needs of foreign countries, showing a typical phenomenon of “foreign consumption, domestic pollution”. When China bears the corresponding environmental costs and emission responsibilities, other countries directly or indirectly obtain economic benefits from China’s high-energy consumption and high pollution, which is unfair to China. We can also find that air pollution emissions from intermediate product exports (EEX_F2 + EEX_F3) have consistently exceeded emissions from final product exports (EEX_F1) and the gap between China’s intermediate products and final product exports was small, but the gap gradually widened during 1995–2009. The results may relate to the phenomenon that China’s processing trade has fallen as a proportion of total trade, but the global share of import and export of intermediate products was still increasing year by year.
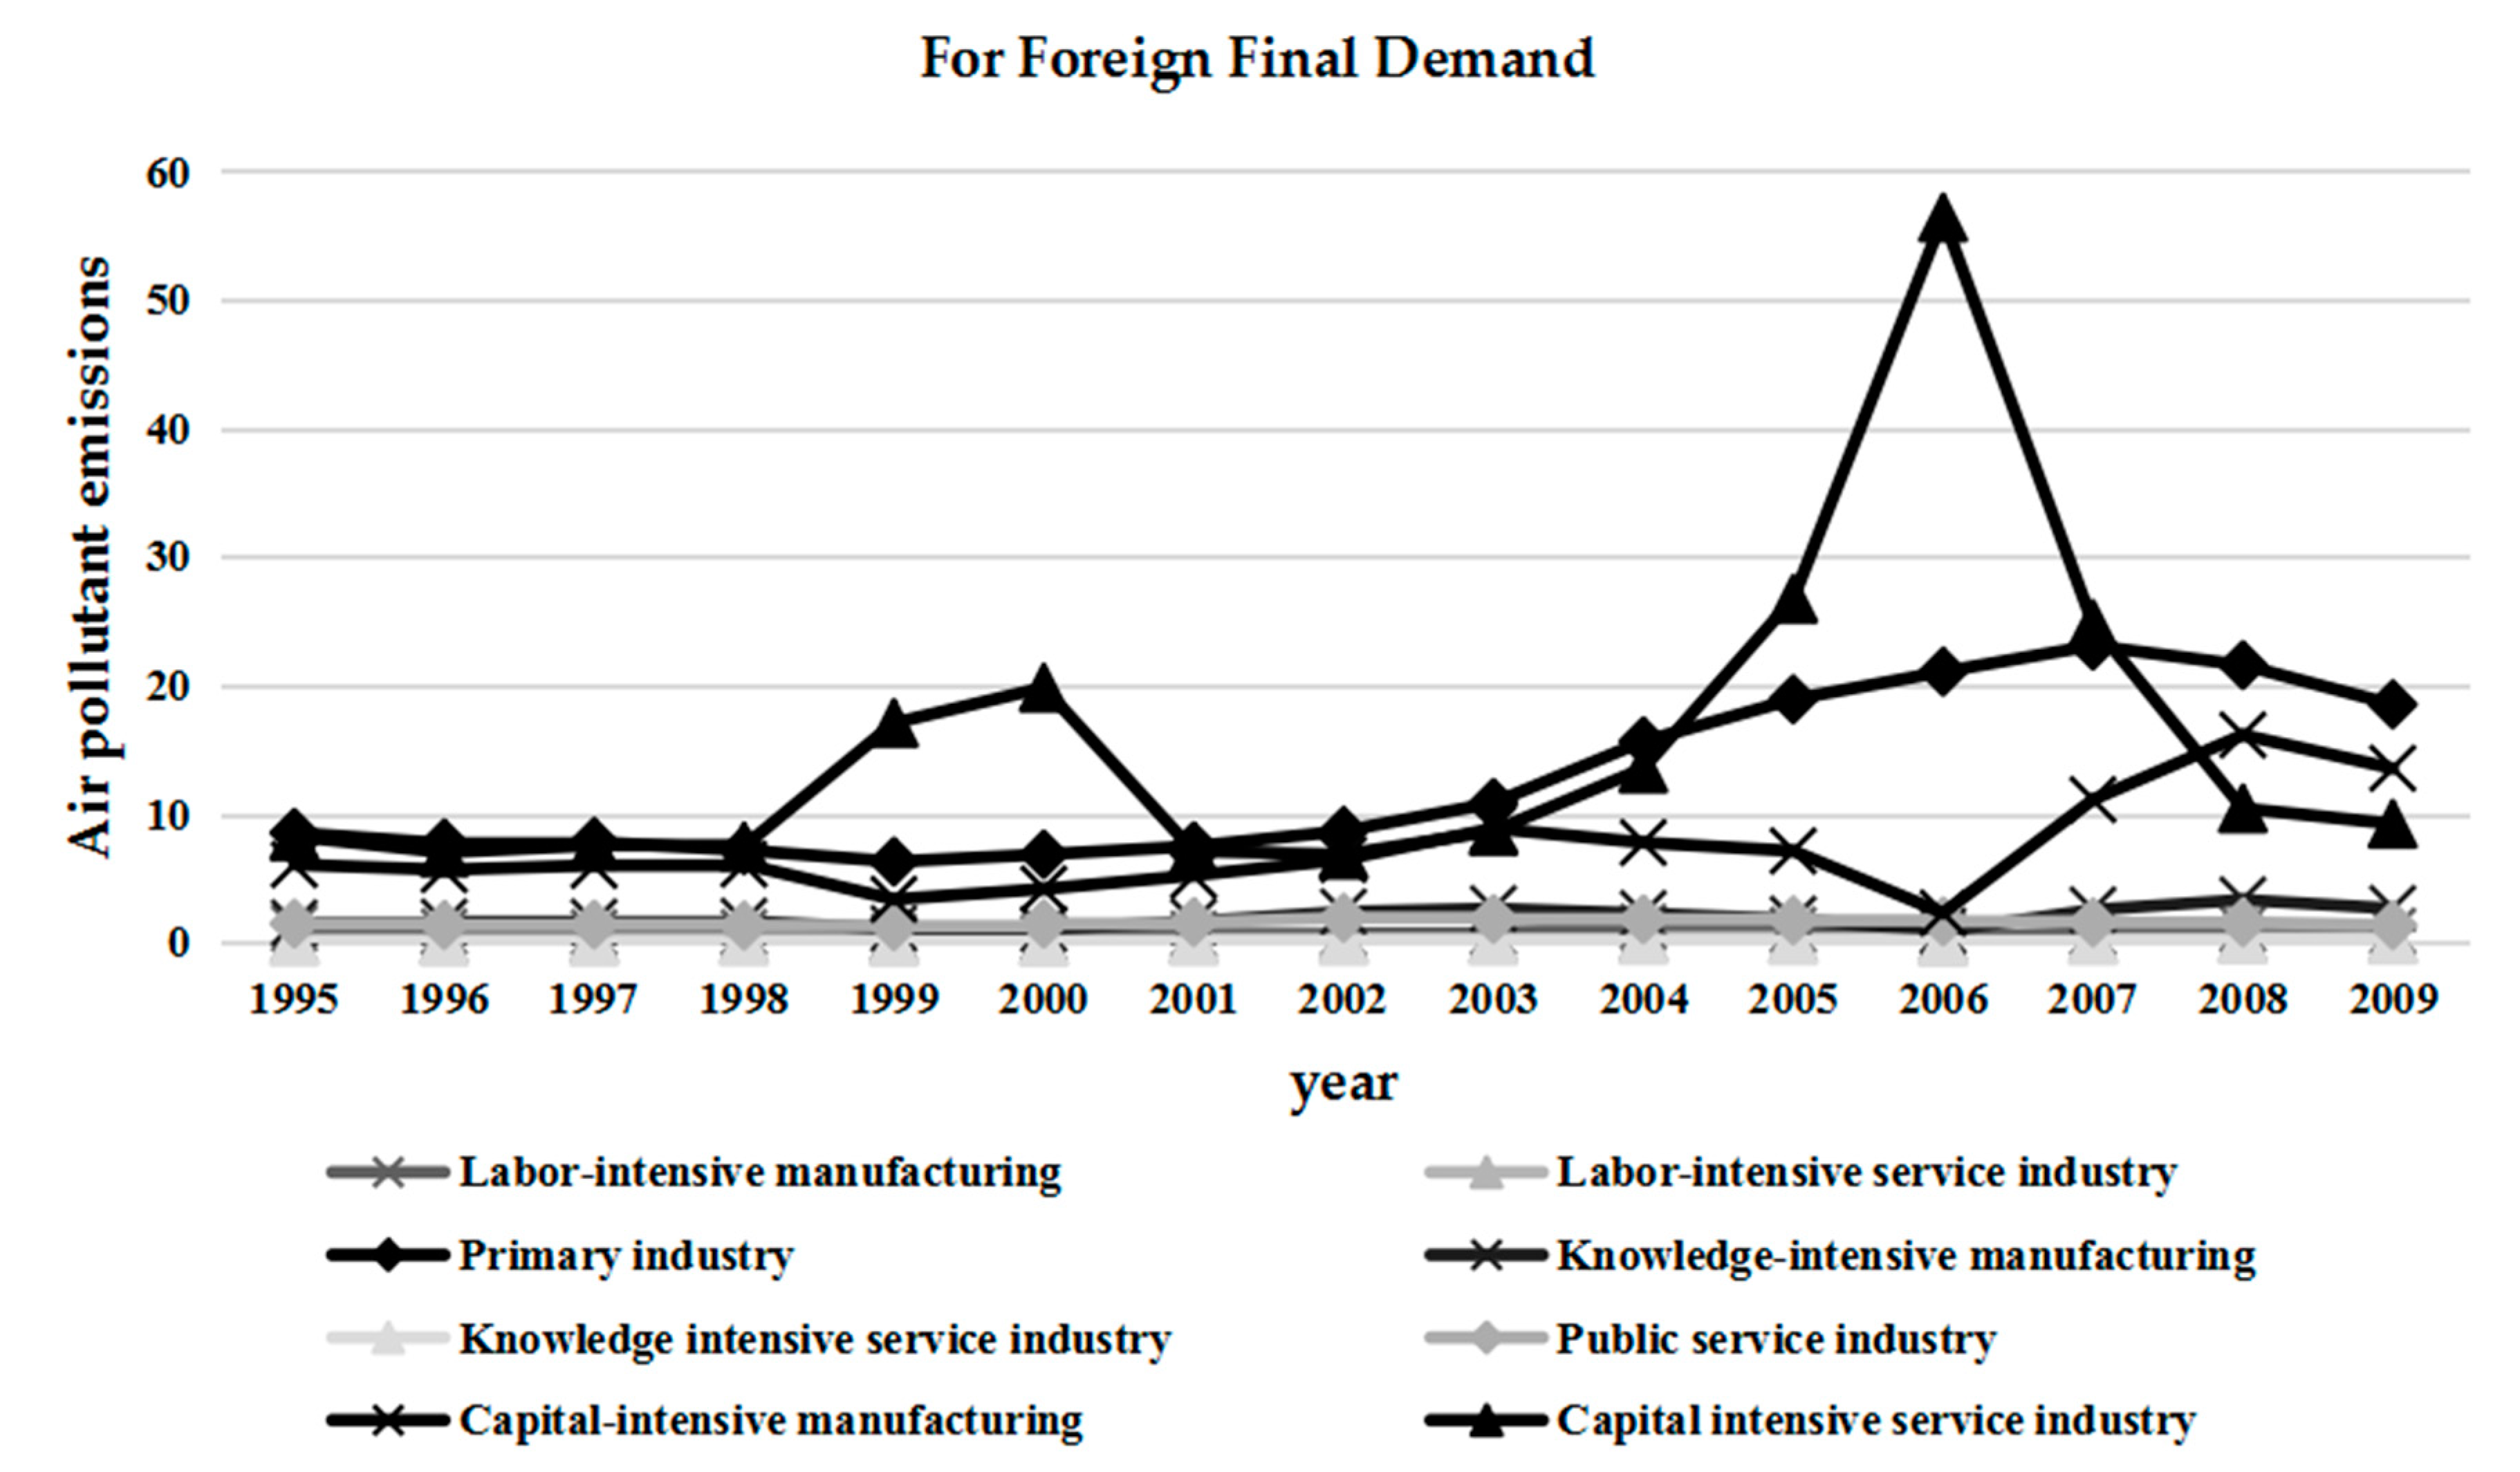
At the industrial level, primary industries, capital-intensive manufacturing, and capital-intensive service industries contribute more significantly to emissions than other industries whether for domestic final demand or foreign final demand from the production side of air pollutants (as shown in Figure 2 and Figure 3). The three black lines that represent theses industries are much higher than the lines of other industries. Among them, the primary industry’s emissions on the production side generally showed a relatively stable upward trend, and the emissions to meet domestic final demand gradually increased, while the emissions that met foreign final demand began to decline in 2007, possibly due to the financial crisis reducing import and export of the world and production activities have gradually reduced. From Figure 2 and Figure 3, we find that emissions from capital-intensive manufacturing and capital-intensive services are volatile and even have opposite growth trends and the two most obvious points lie in 2000 and 2006. Then we wanted to analyze the reasons that led to the opposite growth trends. Because of formal entry into the WTO in 2000, China’s trade barriers have further opened, capital in developed countries has flooded in, and capital-intensive industries have vigorously developed. The emission of air pollutants from capital-intensive service industries reduced, but the manufacturing industry was to undertake the capital inflow of foreign polluting industries and the negative effect of foreign direct investment was greater than the positive effect, which made the air pollutant emissions increase. Then, the technology spillovers brought by capital subsided, and the rapid growth of the economy led to a sharp rise in the emissions of air pollutants in capital-intensive service industries. After the survival of the fittest in the manufacturing industry after a round of foreign green technology barriers, the air contaminant emissions declined. The emission of air pollutants in capital-intensive service industries showed a clear “inverted U-shaped” curve whether in Figure 2 or Figure 3, which indicates that it is more sensitive to changes in the internal mechanism of economic growth. The reason may be that the service industry is easier to scale and technologically innovative than the manufacturing industry.
4.1.2. The Decomposition Results of Rear-Line Industries (Consumption-Side Emissions)
As shown in Table 3, China’s air pollutant emissions on the consumption side also increased from 115.48 million tons to 214.38 million tons during the study period, which was an increase of 85.6%. Among them, the vast majority (88.45–95.94%) came from the production of domestic final demand, that is, most of them were domestic emissions. The reason may be that China is rich in resources and the product types. Most of the domestic consumer market satisfied its own production. However, the domestic consumer market has increased demand for imported products due to the further improvement of material living standards, so the scale and proportion of foreign air pollution emissions caused by domestic final demand were constantly increasing. As we can see from Table 3, foreign emissions accounted for only 4.05% in 1995 and this proportion increased to 11.55% in 2009. Simultaneously, European Union (EU) and the United States mainly provided “emission services” for China’s final demand. These economies were China’s important sources for imports of raw materials and intermediates.
We can find that the production side of China was significantly higher than the air pollution emissions of the consumption side between 1995 and 2006 when we compare the calculation results of Table 2 and Table 3, and the gap between the two gradually narrowed after 2006. In 2001, the former was only 9.82 million tons higher than the latter. By 2006, the difference increased to 32.85 million tons, accounting for 16% of the former’s total emissions. After 2006, the gap between the two began to shrink until 2009 and the consumption-side emissions exceeded the production-side emissions for the first time. Although the consumption-side emissions were always lower than the production-side emissions, the two still have the same growth trend, and from the absolute scale, the current consumption-side emissions of China were still very large. As the domestic final demand of China grows, consumption-side emissions are likely to rise further.
From Figure 4, we can find that the emissions on the production side (the black line) are higher than the emissions on the consumption side (the gray line) during 1995–2006, and the gap between them reached its maximum in 2006. We can also find that the gap began to narrow after 2006. This result is consistent with the results of Table 2 and Table 3.
4.1.3. The Result of Total Export Decomposition
As shown in Table 4, the air pollutant emissions implied in China’s total exports increased rapidly during 1995–2009. It increased from 28.26 million tons to 54.17 million tons, an increase of 91.68%. As with production-side emissions, after China’s accession to the WTO, the pollution emissions from total exports grew particularly rapidly. Emissions increased by 65.11 million tons during the period 2001–2006, with a growth rate of 248%. Most of the air pollution caused by China’s total exports were domestic emissions (87.58–96.05%). Among the domestic emissions caused by the total exports, the air pollution emissions implicit in the intermediate products were always greater than the air pollution implicit in the final products. For domestic emissions decomposition, it can be found that the foreign final demand emissions (Part 1 + Part 2 + Part 3) in the total exports were far greater than the domestic final demand emissions (Part 4), and the proportion of foreign final demand emissions to domestic emissions dropped from 99.46% to 97.88%, with a very small decline.
In 1995, foreign exports accounted for only 4% of total emissions, and this proportion quickly increased to 12.42% in 2009. For further decomposition of foreign emissions, the emissions caused by intermediate products (Part 5 + Part 7) have been lower than the final product emissions (Part 6 + Part 8) since 1995. The following reasons may be that China is a big country in the processing trade. The scale and proportion of foreign emissions caused by China’s total exports are constantly improving.
From Table 4, we explored that China’s domestic emissions implicit in total exports account for a relatively large proportion. This was mainly because China’s industrial sector was relatively complete, and there were many domestic intermediate products directly or indirectly invested in the production process of export products. At the same time, the penalties for pollution emissions from Chinese companies were not strict, resulting in a considerable amount of air pollutant emissions from the production of intermediate products. From the decomposition of total export trade, China’s domestic emissions implicit in exports were mainly achieved through trade with the final products of partner countries, indicating that adjusting product mix and promoting industrial upgrading will help reduce domestic air pollutant emissions. Since 2006, the total amount of air pollution implied in exports has declined, and the proportion of Part 1 emissions has risen. However, the total amount of Part 1 pollution was declining at the same time, indicating that China has begun to try to increase its position in the global value chain. China also has begun to export low-pollution and high value-added products. The largest emissions from foreign countries implicit in China’s exports are the third country’s air pollution emissions implicit in the final product exports, indicating that pollution emissions from upstream countries will also have a significant impact on China’s pollution levels.
In Figure 5, we studied the air pollutant emissions through final goods and intermediate goods in the total exports of the manufacturing industry. At present, most sectors in China are the manufacturing industry and manufacturing is China’s most important industry, so we chose the manufacturing industry here. We can find that air pollutant emissions from trade in final products (the black rectangle) were more than air pollution emissions from trade in intermediate products (the gray rectangle) in the manufacturing industry during 1995–2009 from Figure 5. This result indicates that China’s manufacturing industry still locates close to the downstream in the global value chain. This phenomenon means that China’s manufacturing industry provides more final goods for other countries than intermediate goods. The reason is that China’s manufacturing industry mainly imports foreign intermediate products for reprocessing. The result suggests that the structural adjustment of China’s exports is particularly important in the control of air pollutant emissions.
4.2. Structural Decomposition Results of Emissions from the Production Side of Air Pollutants
4.2.1. The Decomposition Results
As shown in Table 5, during 1995–2009, Part A was positive, which indicates that the expansionary economic growth mode of China became the most important factor for the rapid growth of air pollutant emissions and it caused the total amount of air pollutants to increase by 439.83% during 1995–2009. Promoting economic transformation has an important impact on China’s reduction of air pollutant emissions. For most industries, the industrial structure effect of air pollutant emissions is negative. The added value of most industries’ unit output can reduce air pollutant emissions. However, in fact, the level of added value per unit of output between industries and the efficiency of pollution emission were very different, such as electricity, gas, and water supply. The added value of the total output of them in 2009 was 0.2837 US dollars, and the pollution of unit value-added pollution was 200 tons, which is a typical low value-added, high pollution industry. There were also some industries with high added value, but the pollution efficiency was very low, such as the real estate industry. The added value of real estate in 2009 was 0.8338 US dollars, while the unit value-added pollution emissions were 0.36 tons, which is a typical high value-added, low-pollution industry. Therefore, industrial upgrading should at least consider the added value of unit output and pollution efficiency. The decomposition results of technological progress effects in Table 5 show that the improvement of cleaning technology and the improvement of production processes can greatly reduce the emission of air pollutants, and the effect is far stronger than the adjustment of industrial structure. Using cleaner production techniques seems to be a good choice. The resistance to industrial restructuring is facing many difficulties in China because of the new normal of China’s economy, so industrial restructuring needs long-term efforts.
As can be seen from Table 6, during 1995–2009, the change in industrial structure increased the air pollution emissions per unit of GDP by 0.03% and the increase in pollution emission efficiency reduced the amount of air pollution per unit of GDP, but the impact of the two was not significant.
Figure 6 shows the reduction of air pollutant emissions per unit of GDP in China’s industries during 1995–2009. We find that there were four industries which experienced the greatest reduction in air pollution emissions between 1995 and 2009.The four industries are waterway transportation, farming industry, mining industry, and electricity, gas, and water supply as Figure 6 shows. These four industries have a close relationship with people’s daily life. Figure 6 shows that air pollutant emissions from primary industries and capital-intensive services reduced significantly after China’s participation in the global value chain. The reason may be that these industries acquired more advanced production technology from the world after China’s participation in the global value chain. The Chinese government and enterprises have also adjusted their production structure and paid more attention to environmental problems in production.
4.2.2. Panel Regression Based on the Technological Progress Effect
From Table 6, the most important factor to curb the increase in China’s air pollutant emissions was the decline in emissions efficiency of various domestic industries. However, the pollution efficiency of the service industry was generally low, and the effect of technological progress was more obvious. Similarly, the more capital used, the higher the proportion of high-tech labor, thus can it also reduce emissions efficiency and reduce air pollution? In order to answer these two questions, this paper constructed the following panel model to examine how the investment of capital, services, energy, and high-tech personnel affects the efficiency of air pollutant emissions in industries:
where represents the air pollution emissions caused by unit added value, represents the proportion of capital and labor, represents the proportion of service investment, represents the proportion of energy investment, and represents the proportion of high-tech labor force. In order to compare the effects of different energy inputs on the emission efficiency of industries, this paper divided energy input into Deircrn (coke, refined petroleum and nuclear fuel—non-renewable energy) and Deiregw (electricity, gas and water supply—renewable energy). The data covers 1995–2009, which was a good match with the air pollution data. The data on service input and energy input was derived from WIOD’s National Input–Output Table. The panel data consisted of three continuous time stages: 1995–1999, 2000–2004, and 2004–2009. Table 7 is a statistical summary of the dependent and independent variables.
At the same time, the correlation analysis on each variable to observe whether there is serious multi-collinearity between the variables was necessary before the regression analysis of the model. The analysis results are shown in Table 8.
We found that the correlation coefficients between the GDP of the trading partner countries and the import and export service trade was 0.830 and 0.727, respectively, as shown in Table 8. The correlation coefficient between other variables was below 0.7. The results mean that the correlation coefficients between the respective variables were not high, so the multicollinearity between the variables did not exit.
Considering the difference between the time variable and the industry variable in this paper, this paper used the time-fixed effect and the industry-fixed effect to make panel estimations. The estimated results are shown in Table 9.
We can draw conclusions from the estimation results that service input had a significant impact on the decline of emissions efficiency of air pollutants and that high-tech labor input will replace some service inputs, but the results were not significant. The results also show that both renewable and non-renewable energy inputs reduced the level of service input, indicating that energy as an intermediate input itself increased the efficiency of air pollutant emissions, which is related to the characteristics of energy use.
5. Conclusions
The main conclusions of this paper are:
Firstly, during 1995–2006, China’s air pollutant emissions increased dramatically, and production-side emissions were slightly higher than consumption-side emissions. After China’s accession to the WTO, the gap between the two widened. From 2007 to 2009, both production-side and consumption-side emissions showed a downward trend, and the gap between them began to narrow, and eventually, consumption-side emissions exceeded production-side emissions in 2009. The emission of air pollutants on the production side mainly came from the emissions to meet the final domestic demand, but in order to meet the final demand of foreign countries. The emissions showed a rapid growth after China’s entry into the WTO. In 2006, foreign final demand emissions accounted for 36.49% of China’s production-side emissions, that is, more than one-third of China’s air pollution emissions in production served final demand abroad. The vast majority (88.45–95.94%) of China’s consumption-side air pollutant emissions were domestic emissions. However, the scale and proportion of foreign air pollutant emissions caused by China’s final demand were constantly increasing due to the increase in demand for imported products. This article decomposed the emissions from the production side for foreign final demand and found that the export of intermediate products had a trend of “high pollution”. This trend was particularly evident after China’s accession to the WTO, indicating that the “high pollution” changes in the export of intermediate products was mainly affected through participation in the international division of labor. According to the domestic and foreign emissions on the consumption side, the results show that methane, carbon monoxide, and sulfide were the main pollutants and the growth rate of foreign emissions was far greater than domestic emissions. This means that, even if most of the intermediate products are from China, a small amount of imports from some intermediate products or final products from abroad will lead to more emissions from upstream countries. This paper analyzed the total trade exports and found that, like the production of air pollutants on the production side, after China’s accession to the WTO, the emissions of air pollutants from the total exports increased particularly rapidly. By decomposing the total exports, it can be seen that in the domestic emissions caused by the total exports, the air pollution emissions implicit in the intermediate products were always greater than the air pollution implicit in the final products. Unlike the production side decomposition, the emissions from the intermediate products in the total exports were always lower than the emissions caused by the final products. The study shows that as a major processing trade country, China’s air pollutant emissions in the downstream stage of the value chain are greater than that in the upstream and midstream stages of the value chain. These findings tell us that the foreign final demand is the main cause of air pollution emissions in domestic industries and the import and export of intermediate products is an important factor leading to a large amount of air pollution emissions. From the results we also suggest that industries in the upstream stage of the value chain should be invested more to develop better and China should export more upstream goods of the value chain to reduce the emission of air pollutants.
Secondly, the decomposition of factors affecting air pollutant emissions shows that the expansion of economic growth is the most important factor for China’s rapid air pollutant emissions, and China’s industrial structure has a tendency to shift to high pollution efficiency industries. Panel estimation results based on technological advancements show that the industry’s pollution efficiency reduction depends on the increase in services as an intermediate input and changes in the efficiency of air pollutant emissions in the transportation sector have a very important impact on the reduction of pollution efficiency in the entire country. This is because many countries especially developing countries do not have to build a complete set of value chains themselves but can only actively participate in global value chains by focusing on industries or production links that have comparative advantages with the deepening of economic globalization, the vertical specialization of trade, and the segmentation of production methods. The result was an increase in the volume of trade in intermediate products, which were repeatedly transported in different countries, resulting in emissions from the transport sector becoming an important part of the total emissions of air pollutants. The results show us that industrial restructuring and technology advancement can reduce the emission of air pollutant and service which as an intermediate input is a good solution to replace the import of intermediate products. Therefore, we believe that we should increase investment in the service industry and improve the level of the service industry to reduce emissions of air pollutants.
Finally, we also found that air pollutant emissions from industries that were closely related to people’s lives had greatly reduced, which is inseparable from China’s participation in the global value chain.
The above conclusions indicate that China should pay attention to coordinating the development of international trade, domestic energy conservation, and emission reduction because the air pollutant emissions caused by the final foreign demand have an important impact on China’s air quality. In the process of opening up to the outside world, the ultimate goal of China’s economic transformation is to enhance China’s position in the global value chain. Thus, we suggest that the Chinese government and enterprises should pay attention to the upstream and downstream cooperation of the value chain, and pay attention to the introduction and exchange of advanced foreign low-pollution technologies and environmental governance methods first. Then the government should vigorously develop the service industry and increase the proportion of intermediate investment in the service industry. The government should also improve the division of labor of the domestic manufacturing industry in the global value chain, and reduce the sources of air pollutant emissions. Finally, the government should optimize the investment demand structure and promote the construction of long-term and low-pollution projects with human capital accumulation and technological capabilities.
Author Contributions
Conceptualization, Y.C. and Y.L.; methodology, Y.L. and J.Y.; software, Y.C. and J.Y.; validation, Y.L.; formal analysis, J.Y. and Y.C.; investigation, Y.C.; resources, Y.C. and J.Y.; data curation, J.Y.; writing—original draft preparation, Y.C. and Y.L.; writing—review and editing, Y.C. and J.Y.; visualization, Y.L.; supervision, Y.L.; project administration, Y.L.; funding acquisition, Y.L.
Funding
The authors are thankful for the financial assistance received from the National Natural Science Foundation of China (71803159, 71832012), the National Social Science Foundation of China (18ZDA039), and the Sichuan Institute for Free Trade Zone Research, Southwestern University of Finance and Economics.
Acknowledgments
We would like to thank the editor and anonymous referees. All errors and omissions are our own.
Conflicts of Interest
The authors declare no conflict of interest.
References
- Koopman, R.; Wang, Z. Tracing Value-Added and Double Counting in Gross Exports. Soc. Sci. Electron. Publ. 2014, 104, 459–494. [Google Scholar] [CrossRef]
- Grossman, G.M.; Krueger, A.B. Economic Growth and the Environment. Q. J. Econ. 1995, 110, 353–378. [Google Scholar] [CrossRef]
- Kolk, A.; Mauser, A. The evolution of environmental management: From stage models to performance evaluation. Bus. Strategy Environ. 2002, 11, 14–31. [Google Scholar] [CrossRef]
- Lee, S.Y.; Rhee, S.K. The change in corporate environmental strategies: A longitudinal empirical study. Manag. Decis. 2007, 45, 196–216. [Google Scholar] [CrossRef]
- Antràs, P.; Chor, D. Organizing the Global Value Chain. Econometrica 2013, 81, 2127–2204. [Google Scholar]
- Chan, R.Y.K. Corporate environmentalism pursuit by foreign firms competing in China. J. World Bus. 2010, 2010, 80–92. [Google Scholar] [CrossRef]
- Guo, H.; Tang, J.; Wang, D.; Chen, F.; Lin, L. Effects of FDI on Environment Pollution Based on Carbon Dioxide Emissions in the Pearl River Delta Region. Nat. Environ. Pollut. Technol. 2015, 14, 931–936. [Google Scholar]
- He, X.; Yao, X. Foreign Direct Investments and the Environmental Kuznets Curve: New Evidence from Chinese Provinces. Emerg. Mark. Financ. Trade 2017, 53, 12–25. [Google Scholar] [CrossRef]
- Hoffmann, R.; Lee, C.; Ramasamy, B. FDI and pollution: A granger causality test using panel data. J. Int. Dev. 2005, 17, 311–317. [Google Scholar] [CrossRef]
- Kahrl, F.; Roland-Holst, D. Energy and exports in China. China Econ. Rev. 2008, 19, 649–658. [Google Scholar] [CrossRef]
- Shapiro, J.S.; Walker, R. Why is pollution from US manufacturing declining? The roles of environmental regulation, productivity, and trade. Am. Econ. Rev. 2018, 108, 3814–3854. [Google Scholar] [CrossRef]
- Acemoglu, D.; Aghion, P.; Bursztyn, L.; Hemous, D. The Environment and Directed Technical Change. Am. Econ. Rev. 2012, 102, 131–166. [Google Scholar] [CrossRef] [PubMed]
- Bair, J. Global commodity chains: Genealogy and review. In Frontiers of Commodity Chain Research; Bair, J., Ed.; Stanford University Press: Berlin, Germany, 2009. [Google Scholar]
- Peters, G.P.; Weber, C.L.; Guan, D.; Hubacek, K. China’s growing CO2 emissions a race between increasing consumption and efficiency gains. Environ. Sci. Technol. 2007, 41, 5939–5944. [Google Scholar] [CrossRef]
- Song, M.L.; Wang, S.H. Participation in global value chain and green technology progress: Evidence from big data of Chinese enterprises. Environ. Sci. Pollut. Res. 2017, 24, 1648–1661. [Google Scholar] [CrossRef] [PubMed]
- Simpson, D.; Power, D.; Samson, D. Greening the automotive supply chain: A relationship perspective. Int. J. Oper. Prod. Manag. 2007, 27, 28–48. [Google Scholar] [CrossRef]
- Srivastava, S.K. Green supply-chain management: A state-of-the-art literature review. Int. J. Manag. Rev. 2007, 9, 53–80. [Google Scholar] [CrossRef]
- Johnson, R.C.; Noguera, G. Accounting for intermediates: Production sharing and trade in value added. J. Int. Econ. 2012, 86, 224–236. [Google Scholar] [CrossRef]
- Meng, B.; Peters, G.; Wang, Z. Tracing CO2 Emissions in Global Value Chains. Soc. Sci. Electron. Publ. 2015, 73, 24–42. [Google Scholar]
- Peters, G.P. From production-based to consumption-based national emission inventories. Ecol. Econ. 2008, 65, 13–23. [Google Scholar] [CrossRef]
- Robbie, A.; Glen, P.; Lennox, P.J. Approximation and regional aggregation in multi-regional input–output analysis for national carbon footprint accounting. Econ. Syst. Res. 2009, 21, 311–335. [Google Scholar]
- Gereffi, G. The global economy: Organization, governance, and development. In The Handbook of Economic Sociology; Smelser, N.J., Swedberg, R., Eds.; Princeton University Press: Princeton, NJ, USA, 2005. [Google Scholar]
- Wang, S.X.; Fu, Y.B. Population growth and the environmental Kuznets curve. China Econ. Rev. 2015, 36, 146–165. [Google Scholar] [CrossRef]
- Zhao, D.T.; Li, T.T.; Wang, Y. Environmental Kuznets Curve in China: New evidence from dynamic panel analysis. Energy Policy 2016, 91, 138–147. [Google Scholar]
- Giuliani, E.; Pietrobelli, C.; Rabellotti, R. Upgrading in global value chains: Lessons from Latin American clusters. World Dev. 2005, 33, 549–573. [Google Scholar] [CrossRef]
- Lucas, M.T. Understanding Environmental Management Practices: Integrating Views from Strategic Management and Ecological Economics. Bus. Strategy Environ. 2010, 19, 543–556. [Google Scholar] [CrossRef]
- Rezza, A.A. FDI and pollution havens: Evidence from the Norwegian manufacturing sector. Ecol. Econ. 2013, 90, 140–149. [Google Scholar] [CrossRef]
- Marchi, V.D. Environmental innovation and R and D cooperation: Empirical evidence from Spanish manufacturing firms. Res. Policy 2012, 41, 614–623. [Google Scholar] [CrossRef]
- Seuring, S.; Müller, M. From a literature review to a conceptual framework for sustainable supply chain management. J. Clean. Prod. 2008, 16, 1699–1710. [Google Scholar] [CrossRef]
- Xu, S.; Jin, X. Notice of Retraction. The Health Impacts of Air Pollution and FDI in China: Regional Difference. In Proceedings of the International Conference on Bioinformatics and Biomedical Engineering, Beijing, China, 11–13 June 2009; Volume 6, pp. 14–17. [Google Scholar]
- Rizwana, Y.; Li, Y.N.; Hafeez, M. Tracing the trade-pollution nexus in global value chains: Evidence from air pollution indicators. Environ. Sci. Pollut. Res. Int. 2019, 26, 5221–5233. [Google Scholar]
- Marchi, V.D.; Maria, E.D.; Micelli, S. Environmental Strategies, Upgrading and Competitive Advantage in Global Value Chains. Bus. Strategy Environ. 2013, 22, 62–72. [Google Scholar] [CrossRef]
- Peters, G.P.; Hertwich, E.G. CO2 embodied in international trade with implications for global climate policy. Environ. Sci. Technol. 2008, 42, 1401–1407. [Google Scholar] [CrossRef] [PubMed]
Figure 1.
The change in China’s air pollutant emissions and total gross domestic product (GDP) from 1995 to 2009. The data in the figure comes from the National Bureau of Statistics. Each unit of GDP is 100 million yuan and each unit of air pollution emissions is billions of cubic meters.
Figure 1.
The change in China’s air pollutant emissions and total gross domestic product (GDP) from 1995 to 2009. The data in the figure comes from the National Bureau of Statistics. Each unit of GDP is 100 million yuan and each unit of air pollution emissions is billions of cubic meters.

Figure 2.
Air pollutant emissions by industries for domestic final demand from 1995 to 2009. Each unit of air pollution emissions is 106 tons.
Figure 2.
Air pollutant emissions by industries for domestic final demand from 1995 to 2009. Each unit of air pollution emissions is 106 tons.

Figure 3.
Air pollutant emissions by industries for foreign final demand from 1995 to 2009. Each unit of air pollution emissions is 106 tons.
Figure 3.
Air pollutant emissions by industries for foreign final demand from 1995 to 2009. Each unit of air pollution emissions is 106 tons.

Figure 4.
Differences in air pollution emissions between the production side and the consumption side in China over the years during 1995–2009. Each unit of air pollution emissions is 106 tons.
Figure 4.
Differences in air pollution emissions between the production side and the consumption side in China over the years during 1995–2009. Each unit of air pollution emissions is 106 tons.

Figure 5.
Air pollutant emissions through final goods and intermediate goods in the total exports of manufacturing industry during 1995–2009. Each unit of air pollution emissions is 106 tons.
Figure 5.
Air pollutant emissions through final goods and intermediate goods in the total exports of manufacturing industry during 1995–2009. Each unit of air pollution emissions is 106 tons.

Figure 6.
Reduction of air pollutant emissions per unit of GDP in China’s industries during 1995–2009.
Figure 6.
Reduction of air pollutant emissions per unit of GDP in China’s industries during 1995–2009.


Table 1.
Factor-intensive industry classification and comparison industry classification of World Input-Output Database (WIOT).
Table 1.
Factor-intensive industry classification and comparison industry classification of World Input-Output Database (WIOT).
| WIOTs Codes | Industry Definition | WIOTs Codes | Industry Definition |
|---|---|---|---|
| C1 | Farming industry a | C19 | Automobile and motorcycle manufacturing f |
| C2 | Mining industry a | C20 | Fuel retail (except automobile and motorcycle) f |
| C3 | Food and beverage manufacturing c | C21 | Retail (except automobile and motorcycle) f |
| C4 | Textile and garment manufacturing b | C22 | Accommodation and catering f |
| C5 | Leather b | C23 | Inland transportation g |
| C6 | Wood processing and wood products b | C24 | Waterway transportation g |
| C7 | Paper and paper products c | C25 | Aviation and other transportation g |
| C8 | Petroleum and nuclear fuel processing c | C26 | Travel agency business f |
| C9 | Chemical raw materials and products d | C27 | Postal and communication g |
| C10 | Rubber and plastic products c | C28 | Financial industry h |
| C11 | Scrap metal mineral products c | C29 | Real estate g |
| C12 | Metal products c | C30 | Leasing and business services h |
| C13 | Machinery manufacturing d | C31 | Public administration, national defense and social security e |
| C14 | Electrical and electronic machinery manufacturing d | C32 | Education e |
| C15 | Transportation equipment manufacturing d | C33 | Health and social services e |
| C16 | Waste and other manufacturing b | C34 | Other community services and personal services e |
| C17 | Electricity, gas, and water supply g | C35 | Privately hired family services f |
| C18 | Building industry f |
Note: Superscript “a, b, c, d, e, f, g, h” represent primary industry, labor-intensive manufacturing, capital-intensive manufacturing, knowledge-intensive manufacturing, public service industry, labor-intensive service, capital-intensive service, and knowledge-intensive service, respectively.
Table 2.
Total emissions and emission paths of China’s air pollutants from 1995 to 2009 based on production-side emissions decomposition (106 t).
Table 2.
Total emissions and emission paths of China’s air pollutants from 1995 to 2009 based on production-side emissions decomposition (106 t).
| Years | Production-Side Emissions Decomposition | Domestic Final Demand Emissions | Foreign Final Demand Emissions | ||||
|---|---|---|---|---|---|---|---|
| Total | Of Which: Foreign Final Demand Emissions | EH_F | REE_F | EEX_F1 | EEX_F2 | EEX_F3 | |
| 1995 | 125.30 | 27.05 (21.59%) | 98.10 | 0.15 | 12.60 | 12.40 | 2.04 |
| 1996 | 129.17 | 24.27 (18.79%) | 104.75 | 0.15 | 11.22 | 11.13 | 1.93 |
| 1997 | 127.98 | 25.29 (19.76%) | 102.51 | 0.18 | 11.24 | 12.07 | 1.98 |
| 1998 | 133.15 | 24.62 (18.49%) | 108.34 | 0.18 | 11.22 | 11.28 | 2.12 |
| 1999 | 152.54 | 29.56 (19.38%) | 122.74 | 0.24 | 12.73 | 14.04 | 2.79 |
| 2000 | 154.17 | 33.78 (21.91%) | 120.04 | 0.35 | 13.61 | 16.64 | 3.53 |
| 2001 | 122.85 | 23.87 (19.43%) | 98.69 | 0.29 | 10.29 | 11.11 | 2.47 |
| 2002 | 127.57 | 27.21 (21.33%) | 99.95 | 0.40 | 11.69 | 12.72 | 2.79 |
| 2003 | 139.08 | 33.88 (24.36%) | 104.61 | 0.59 | 14.74 | 15.62 | 3.52 |
| 2004 | 164.99 | 42.62 (25.83%) | 121.60 | 0.77 | 18.02 | 20.14 | 4.45 |
| 2005 | 187.25 | 57.56 (30.74%) | 128.70 | 0.99 | 23.85 | 27.86 | 5.85 |
| 2006 | 224.02 | 82.76 (36.94%) | 139.79 | 1.46 | 31.27 | 43.08 | 8.42 |
| 2007 | 202.74 | 64.12 (31.63%) | 137.48 | 1.14 | 27.61 | 30.05 | 6.46 |
| 2008 | 202.73 | 54.50 (26.88%) | 147.14 | 1.09 | 24.53 | 24.22 | 5.75 |
| 2009 | 214.02 | 46.53 (21.74%) | 166.49 | 1.00 | 22.44 | 19.66 | 4.44 |
Note: EH_F means emissions that do not go through international trade to meet the country’s final needs. REE_F means emissions that meet international final demand through international trade. EEX_F1 indicates emissions through the final product trade to meet the final needs of trading partner countries. EEX_F2 indicates emissions through intermediate product trade to meet the final needs of trading partner countries. EEX_F3 indicates that emissions from intermediate products with trading partners is to meet the final needs of another country. The values in parentheses are the proportion (%) of emissions from external emissions of air pollutants on the production side.
Table 3.
Total air pollutant emissions and countries in China from 1995 to 2009 based on consumption-side emissions decomposition (106 t).
Table 3.
Total air pollutant emissions and countries in China from 1995 to 2009 based on consumption-side emissions decomposition (106 t).
| Years | Consumption-Side Emissions Decomposition | Countries (Regions) of Foreign Emissions | ||||||
|---|---|---|---|---|---|---|---|---|
| Total | Of Which: Foreign Emissions | BRIIT | ACK | US | EU-27 | Japan | Other Countries (Regions) | |
| 1995 | 115.48 | 4.68 (4.05%) | 0.76 | 0.72 | 0.43 | 0.23 | 0.06 | 2.48 |
| 1996 | 120.98 | 4.91 (4.06%) | 0.93 | 0.83 | 0.36 | 0.20 | 0.06 | 2.54 |
| 1997 | 118.98 | 5.10 (4.29%) | 1.18 | 0.99 | 0.38 | 0.22 | 0.08 | 2.25 |
| 1998 | 125.42 | 5.72 (4.56%) | 1.48 | 1.11 | 0.32 | 0.20 | 0.09 | 2.52 |
| 1999 | 141.95 | 6.32 (4.45%) | 1.41 | 1.06 | 0.33 | 0.27 | 0.09 | 3.16 |
| 2000 | 142.84 | 8.95 (6.27%) | 1.92 | 1.48 | 0.49 | 0.32 | 0.11 | 4.62 |
| 2001 | 118.41 | 9.23 (7.79%) | 2.11 | 1.72 | 0.45 | 0.33 | 0.13 | 4.49 |
| 2002 | 123.15 | 11.23 (9.12%) | 2.87 | 1.76 | 0.54 | 0.39 | 0.16 | 5.52 |
| 2003 | 133.54 | 13.80 (10.33%) | 3.37 | 2.14 | 0.64 | 0.44 | 0.18 | 7.02 |
| 2004 | 155.86 | 15.68 (10.06%) | 3.86 | 1.93 | 0.89 | 0.51 | 0.21 | 8.27 |
| 2005 | 170.16 | 16.89 (9.93%) | 3.99 | 1.94 | 0.90 | 0.51 | 0.21 | 9.33 |
| 2006 | 191.16 | 19.04 (9.96%) | 3.70 | 2.19 | 0.89 | 0.53 | 0.24 | 11.49 |
| 2007 | 191.73 | 25.81 (13.46%) | 3.93 | 2.68 | 1.03 | 0.57 | 0.27 | 17.34 |
| 2008 | 198.02 | 25.58 (12.92%) | 4.38 | 3.06 | 1.14 | 0.54 | 0.26 | 16.19 |
| 2009 | 214.38 | 24.77 (11.55%) | 4.79 | 3.13 | 1.24 | 0.52 | 0.27 | 14.81 |
Note: ACK includes Australia, Canada, and South Korea; BRIIT includes Brazil, Russia, India, Indonesia, and Taiwan. The values in parentheses are the proportion (%) of foreign air pollutant emissions to total emissions from the consumption side of China’s air pollutants.
Table 4.
Total air pollutant emissions and emission paths of China from 1995 to 2009 based on the total export trade decomposition (106 t).
Table 4.
Total air pollutant emissions and emission paths of China from 1995 to 2009 based on the total export trade decomposition (106 t).
| Years | Decomposition of Total Export Trade | Domestic Emissions | Foreign Emissions | |||||||
|---|---|---|---|---|---|---|---|---|---|---|
| Total | Of Which: Foreign Emissions | Part 1 | Part 2 | Part 3 | Part 4 | Part 5 | Part 6 | Part 7 | Part 8 | |
| 1995 | 28.26 | 1.12 (3.95%) | 12.60 | 10.63 | 3.77 | 0.15 | 0.07 | 0.07 | 0.63 | 0.34 |
| 1996 | 25.41 | 1.03 (4.06%) | 11.22 | 9.41 | 3.60 | 0.15 | 0.06 | 0.06 | 0.58 | 0.33 |
| 1997 | 26.55 | 1.13 (4.27%) | 11.24 | 10.21 | 3.80 | 0.18 | 0.06 | 0.07 | 0.62 | 0.39 |
| 1998 | 25.99 | 1.23 (4.75%) | 11.22 | 9.54 | 3.81 | 0.18 | 0.06 | 0.06 | 0.69 | 0.42 |
| 1999 | 31.08 | 1.35 (4.35%) | 12.73 | 11.49 | 5.27 | 0.24 | 0.06 | 0.06 | 0.77 | 0.46 |
| 2000 | 36.17 | 2.13 (5.90%) | 13.61 | 13.87 | 6.21 | 0.35 | 0.11 | 0.13 | 1.16 | 0.73 |
| 2001 | 26.24 | 2.14 (8.17%) | 10.29 | 9.21 | 4.30 | 0.29 | 0.12 | 0.12 | 1.19 | 0.71 |
| 2002 | 30.42 | 2.88 (9.47%) | 11.69 | 10.58 | 4.87 | 0.40 | 0.17 | 0.18 | 1.59 | 0.94 |
| 2003 | 38.46 | 4.07 (10.59%) | 14.74 | 12.90 | 6.16 | 0.59 | 0.25 | 0.27 | 2.25 | 1.30 |
| 2004 | 48.51 | 5.23 (10.78%) | 18.02 | 16.41 | 8.07 | 0.77 | 0.33 | 0.35 | 2.74 | 1.80 |
| 2005 | 64.58 | 6.18 (9.58%) | 23.85 | 22.29 | 11.25 | 0.99 | 0.44 | 0.43 | 3.27 | 2.03 |
| 2006 | 91.36 | 7.37 (8.06%) | 31.27 | 33.92 | 17.34 | 1.46 | 0.59 | 0.58 | 3.78 | 2.41 |
| 2007 | 74.95 | 9.87 (13.16%) | 27.61 | 23.98 | 12.35 | 1.14 | 0.93 | 0.86 | 4.93 | 3.15 |
| 2008 | 64.24 | 8.80 (13.70%) | 24.53 | 19.47 | 10.35 | 1.09 | 0.81 | 0.80 | 4.33 | 2.87 |
| 2009 | 54.17 | 6.73 (12.42%) | 22.44 | 16.21 | 7.79 | 1.00 | 0.57 | 0.50 | 3.48 | 2.18 |
Note: Part 1 indicates domestic air pollution emissions implicit in the final product export, meeting the final consumption of foreign trading partners. Part 2 indicates domestic air pollution emissions implicit in the export of intermediate products to meet the final consumption of foreign trading partners. Part 3 indicates domestic air pollution emissions implied in the export of intermediate products to meet the final consumption of another country. Part 4 indicates domestic air pollution emissions implicit in the export of intermediate products, which is ultimately consumed by the country. Part 5 represents air pollution emissions from trading partner countries implied in the final product export. Part 6 represents air pollution emissions from trading partner countries implied in the export of intermediate products. Part 7 indicates air pollution emissions from another country implied in the final product export. Part 8 indicates air pollution emissions from another country implied in the export of intermediate products. The values in parentheses is the proportion (%) of foreign air pollutant emissions to total emissions from the consumption side of China’s air pollutants.
Table 5.
Structural decomposition results of changes in total air pollutant emissions in China from 1995 to 2009.
Table 5.
Structural decomposition results of changes in total air pollutant emissions in China from 1995 to 2009.
| Industries | Changes in Total Emissions from 1995 to 2009 | Economic Growth Effect | Industrial Structure Effect | Technological Progress Effect | High-Order Terms | |
|---|---|---|---|---|---|---|
| Primary industry | Farming industry | 28.83 | 66.50 | −2.83 | −35.34 | 0.50 |
| Mining industry | 17.65 | 70.73 | −3.55 | −51.07 | 1.54 | |
| Labor-intensive manufacturing | Textile and garment manufacturing | −0.2 | 3.91 | −0.61 | −3.8 | 0.3 |
| Leather | −0.02 | 0.26 | −0.02 | −0.27 | 0.01 | |
| Wood processing and wood products | 0.05 | 1.02 | −0.15 | −0.91 | 0.08 | |
| Waste and other manufacturing | −0.16 | 0.93 | 0.12 | −1.14 | −0.08 | |
| Capital-intensive manufacturing | Food and beverage manufacturing | −0.28 | 4.48 | −0.31 | −4.62 | 0.17 |
| Paper and paper products | −0.39 | 3.03 | −0.42 | −3.24 | 0.25 | |
| Petroleum and nuclear fuel processing | 10.89 | 45.98 | −8.62 | −29.84 | 3.37 | |
| Rubber and plastic products | −0.12 | 2.55 | −0.46 | −2.49 | 0.27 | |
| Scrap metal mineral products | 7.92 | 15.91 | −2.15 | −6.2 | 0.36 | |
| metal products | 10.12 | 32.56 | −3.57 | −20.26 | 1.39 | |
| Knowledge-intensive manufacturing | Chemical raw materials and products | 1.72 | 18.53 | −3.55 | −15.16 | 1.9 |
| Machinery manufacturing | −0.12 | 3.75 | −0.74 | −3.58 | 0.45 | |
| Electrical and electronic machinery manufacturing | 0.17 | 2.66 | −0.65 | −2.27 | 0.42 | |
| Transportation equipment manufacturing | 0.14 | 2.38 | −0.43 | −2.08 | 0.26 | |
| Labor-intensive service | Building industry | 2.36 | 6.09 | −0.86 | −0.15 | 0.29 |
| Automobile and motorcycle manufacturing | 0 | 0 | 0 | 0 | 0 | |
| Fuel retail (except automobile and motorcycle) | −0.18 | 1.44 | 0.22 | −1.7 | −0.13 | |
| Retail (except automobiles and motorcycles) | 0.02 | 0.48 | 0.07 | −0.49 | −0.04 | |
| Accommodation and catering | 0.44 | 0.94 | −0.06 | −0.46 | 0.02 | |
| Travel agency business | 0.52 | 0.64 | −0.1 | −0.02 | 0 | |
| Privately hired family services | 0 | 0 | 0 | 0 | 0 | |
| Capital-intensive service | Electricity, gas, and water supply | 10.01 | 106.04 | −28.22 | −84.63 | 16.81 |
| Inland transportation | 0.8 | 12.27 | −0.98 | −10.93 | 0.45 | |
| Waterway transportation | −7.05 | 93.54 | 5.74 | −101.12 | −5.21 | |
| Aviation and other transportation | 1.4 | 3.5 | −1.13 | −1.18 | 0.22 | |
| Postal and communication | 0.15 | 0.53 | −0.01 | −0.38 | 0.01 | |
| Real estate | −0.12 | 0.94 | 0.06 | −1.08 | −0.04 | |
| Knowledge-intensive service | Financial industry | 0 | 0.39 | 0.05 | −0.42 | −0.03 |
| Leasing and business services | 0.37 | 1.54 | −0.04 | −1.16 | 0.02 | |
| Public service industry | Public administration, national defense, and social security | 0.27 | 1.72 | 0.18 | −1.52 | −0.11 |
| Education | 0.03 | 2.46 | −0.1 | −2.4 | 0.07 | |
| Health and social services | 0.3 | 1 | −0.04 | −0.69 | 0.02 | |
| Other community services and personal services | 3.19 | 42.41 | −1.4 | −38.76 | 0.94 | |
| Total | 88.72 | 551.11 | −54.56 | −432.32 | 24.49 | |
| Air pollutant emission growth rate from 1995 to 2009 | 70.81% | 439.83% | −43.55% | −345.03% | 19.55% | |
Table 6.
Structural decomposition results of air pollution emissions per unit of GDP from 1995 to 2009.
Table 6.
Structural decomposition results of air pollution emissions per unit of GDP from 1995 to 2009.
| Influencing Factor | 1995–1999 | 2000–2004 | 2005–2009 | 1995–2009 |
|---|---|---|---|---|
| Industrial structure effect | 0.19% | 0.14% | −0.27% | 0.03% |
| Technological progress effect | −0.51% | −0.72% | −0.97% | −1.32% |
Table 7.
Summary statistics.
| Variable | Dapva | Dclr | Dsir | Deirt | Deircrn | Deiregw | Dhlr |
|---|---|---|---|---|---|---|---|
| mean | −0.0000635 | 0.2047304 | 0.009417 | 0.0032104 | −0.0004277 | 0.0047653 | 0.0224474 |
| max | 0.0029031 | 2.358705 | 0.1728874 | 0.3109083 | 0.1463435 | 0.334944 | 0.108581 |
| min | −0.0043004 | −0.6549308 | −0.1509542 | −0.0632812 | −0.0579968 | −0.0315999 | −0.0139035 |
| SD | 0.0005574 | 0.3712778 | 0.0529878 | 0.0430191 | 0.0270026 | 0.0355609 | 0.0237101 |
Note: Dapva represents the air pollution emissions caused by unit added value, Dclr represents the proportion of capital and labor, Dsir represents the proportion of service investment, Deirt represents the proportion of energy investment, and Dhlr represents the proportion of high-tech labor force. Deircrn represents coke, refined petroleum and nuclear fuel—non-renewable energy. Deiregw represents electricity, gas and water supply—renewable energy.
Table 8.
Panel correlation matrix.
| Dapva | Dclr | Dsir | Deirt | Deircrn | Deiregw | Dhlr | |
|---|---|---|---|---|---|---|---|
| Dapva | 1 | ||||||
| Dclr | −0.0957 | 1 | |||||
| 0.3462 | |||||||
| Dsir | 0.2952 | −0.0639 | 1 | ||||
| 0.0030 | 0.53 | ||||||
| Deirt | −0.1513 | −0.0203 | −0.5064 | 1 | |||
| 0.1348 | 0.8419 | 0 | |||||
| Deircrn | −0.1768 | 0.0133 | −0.4959 | 0.5215 | 1 | ||
| 0.0799 | 0.8962 | 0 | 0 | ||||
| Deiregw | −0.0447 | −0.0573 | −0.2497 | 0.8051 | −0.0415 | 1 | |
| 0.6604 | 0.5729 | 0.0127 | 0 | 0.6835 | |||
| Dhlr | 0.0156 | −0.107 | 0.3290 | −0.0811 | −0.0485 | −0.0914 | 1 |
| 0.8784 | 0.2917 | 0.0009 | 0.4251 | 0.6335 | 0.3682 |
Note: Dapva represents the air pollution emissions caused by unit added value, Dclr represents the proportion of capital and labor, Dsir represents the proportion of service investment, Deirt represents the proportion of energy investment, and Dhlr represents the proportion of high-tech labor force. Deircrn represents coke, refined petroleum and nuclear fuel—non-renewable energy. Deiregw represents electricity, gas and water supply—renewable energy.
Table 9.
Panel estimation.
| Model 1 | Model 2 | Model 3 | Model 4 | Model 5 | |
|---|---|---|---|---|---|
| Variables | Dapva | Dapva | Dapva | Dapva | Dapva |
| Dclr | −0.0001 | −0.0001 | −0.0001 | −0.0001 | −0.0001 |
| (0.0001) | (0.0002) | (0.0003) | (0.0003) | (0.0003) | |
| Dhlr | −0.0019 | −0.0022 | |||
| (0.0056) | (0.0057) | ||||
| Dsir | 0.0030 ** | 0.0031 ** | 0.0050 *** | 0.0051 *** | 0.0046 ** |
| (0.0012) | (0.0012) | (0.0018) | (0.0018) | (0.0019) | |
| Deircrn | −0.0014 | ||||
| (0.0039) | |||||
| Deiregw | 0.0015 | ||||
| (0.0026) | |||||
| Industry-fixed | No | Yes | Yes | Yes | Yes |
| Time-fixed | No | No | Yes | Yes | Yes |
| Observations | 99 | 99 | 99 | 99 | 99 |
| R-squared | 0.0931 | 0.0946 | 0.2392 | 0.2406 | 0.2487 |
Note: Standard errors in parentheses. *** means “p < 0.01”, ** means “p < 0.05”, * means “p < 0.1”. Dapva represents the air pollution emissions caused by unit added value, Dclr represents the proportion of capital and labor, Dsir represents the proportion of service investment, Deirt represents the proportion of energy investment, and Dhlr represents the proportion of high-tech labor force. Deircrn represents coke, refined petroleum and nuclear fuel—non-renewable energy. Deiregw represents electricity, gas and water supply—renewable energy.
© 2019 by the authors. Licensee MDPI, Basel, Switzerland. This article is an open access article distributed under the terms and conditions of the Creative Commons Attribution (CC BY) license (http://creativecommons.org/licenses/by/4.0/).
Share and Cite
MDPI and ACS Style
Chen, Y.; Li, Y.; Yan, J. Tracing Air Pollutant Emissions in China: Structural Decomposition and GVC Accounting. Sustainability 2019, 11, 2551. https://doi.org/10.3390/su11092551
AMA Style
Chen Y, Li Y, Yan J. Tracing Air Pollutant Emissions in China: Structural Decomposition and GVC Accounting. Sustainability. 2019; 11(9):2551. https://doi.org/10.3390/su11092551
Chicago/Turabian StyleChen, Yuyi, Yunong Li, and Jie Yan. 2019. "Tracing Air Pollutant Emissions in China: Structural Decomposition and GVC Accounting" Sustainability 11, no. 9: 2551. https://doi.org/10.3390/su11092551
Note that from the first issue of 2016, this journal uses article numbers instead of page numbers. See further details here.