Motorcycle Drivers’ Parking Lot Choice Behaviors in Developing Countries: Analysis to Identify Influence Factors


1
School of Transportation and Logistics, Faculty of Infrastructure Engineering, Dalian University of Technology, Liaoning 116024, China
2
Institute of Finance and Accounting, Faculty of Management and Economics, Dalian University of Technology, Liaoning 116024, China
*
Author to whom correspondence should be addressed.
Sustainability 2019, 11(9), 2463; https://doi.org/10.3390/su11092463
Submission received: 28 March 2019
/
Revised: 18 April 2019
/
Accepted: 23 April 2019
/
Published: 26 April 2019
(This article belongs to the Special Issue Sustainable Mobility and Transportation)
Abstract
:Drivers’ behaviors to look for a parking space are affected by numerous influence factors, and there are differences between motorcycle drivers and other drivers, such as car drivers and truck drivers. In many developing countries, motorcycles dominate urban transportation, and it is essential to assess the impact of motorcycle drivers’ parking choice behavior as a solution to reduce the effect on traffic flow. This study identified the influence factors of motorcycle drivers’ parking lot choice models in a developing country, Viet Nam. Data were collected in a motorcycle dependent city, Ho Chi Minh (HCM) City, typically. A stated preference (SP) survey was designed and collected 318 answers from motorcycle drivers. Various discrete choice models under the assumption of random utility maximizations (RUM), which included the mixed logit model, multinomial logit model, and nested logit model, were employed to evaluate the influence factors on motorcycle drivers’ parking choice behavior models. The results showed that the mixed logit model fit with the data. Parking fee, walking distance, the capacity of the parking lot, and queuing time have significant effects on parking lot choice modeling. However, navigation and street sign variables showed a lesser effect on the choices of motorcycle users. This study towards parking planning solution for motorcycles and the author expects that it would be helpful to further study on the parking lot in developing countries.
1. Introduction
In developing countries, private vehicles affect urban transportation systems significantly, including the rapid growth of motorcycles. In South-Eastern Asia countries such as Viet Nam, Indonesia, and Thailand, urban transportation is dominated by motorcycles (HCM City, 92.5% of motorcycles in 2015; Ha Noi, 90.07% of motorcycles in 2015 [1]; Jakarta, 73.88% of motorcycle in 2011 [2]; Bangkok, 59.87% of motorcycles registered in 2010 [3]). Management of parking lots in the urban area is a long-term issue when on- and off-street parking or even illegal parking has not been operated and controlled efficiently. Moreover, increasing private vehicles generate corresponding travels and parking spaces, hence parking lots need an appropriate distribution in the urban area. Cruising issues or travels to find a parking space also affected urban traffic, and it was considered as a reason that leads to traffic accidents, congestions, emissions [4], and increases of the social cost [5]. Besides, parking demand has a close correlation with trip generation. Parking lots are also a rescue of vehicles from the traffic flow.
Easy access to parking lots from the road can help to release vehicles from such traffic flows, and on the other hand, a reasonable plan of exit flow from the parking lot can reduce congestion and conflict before merging.
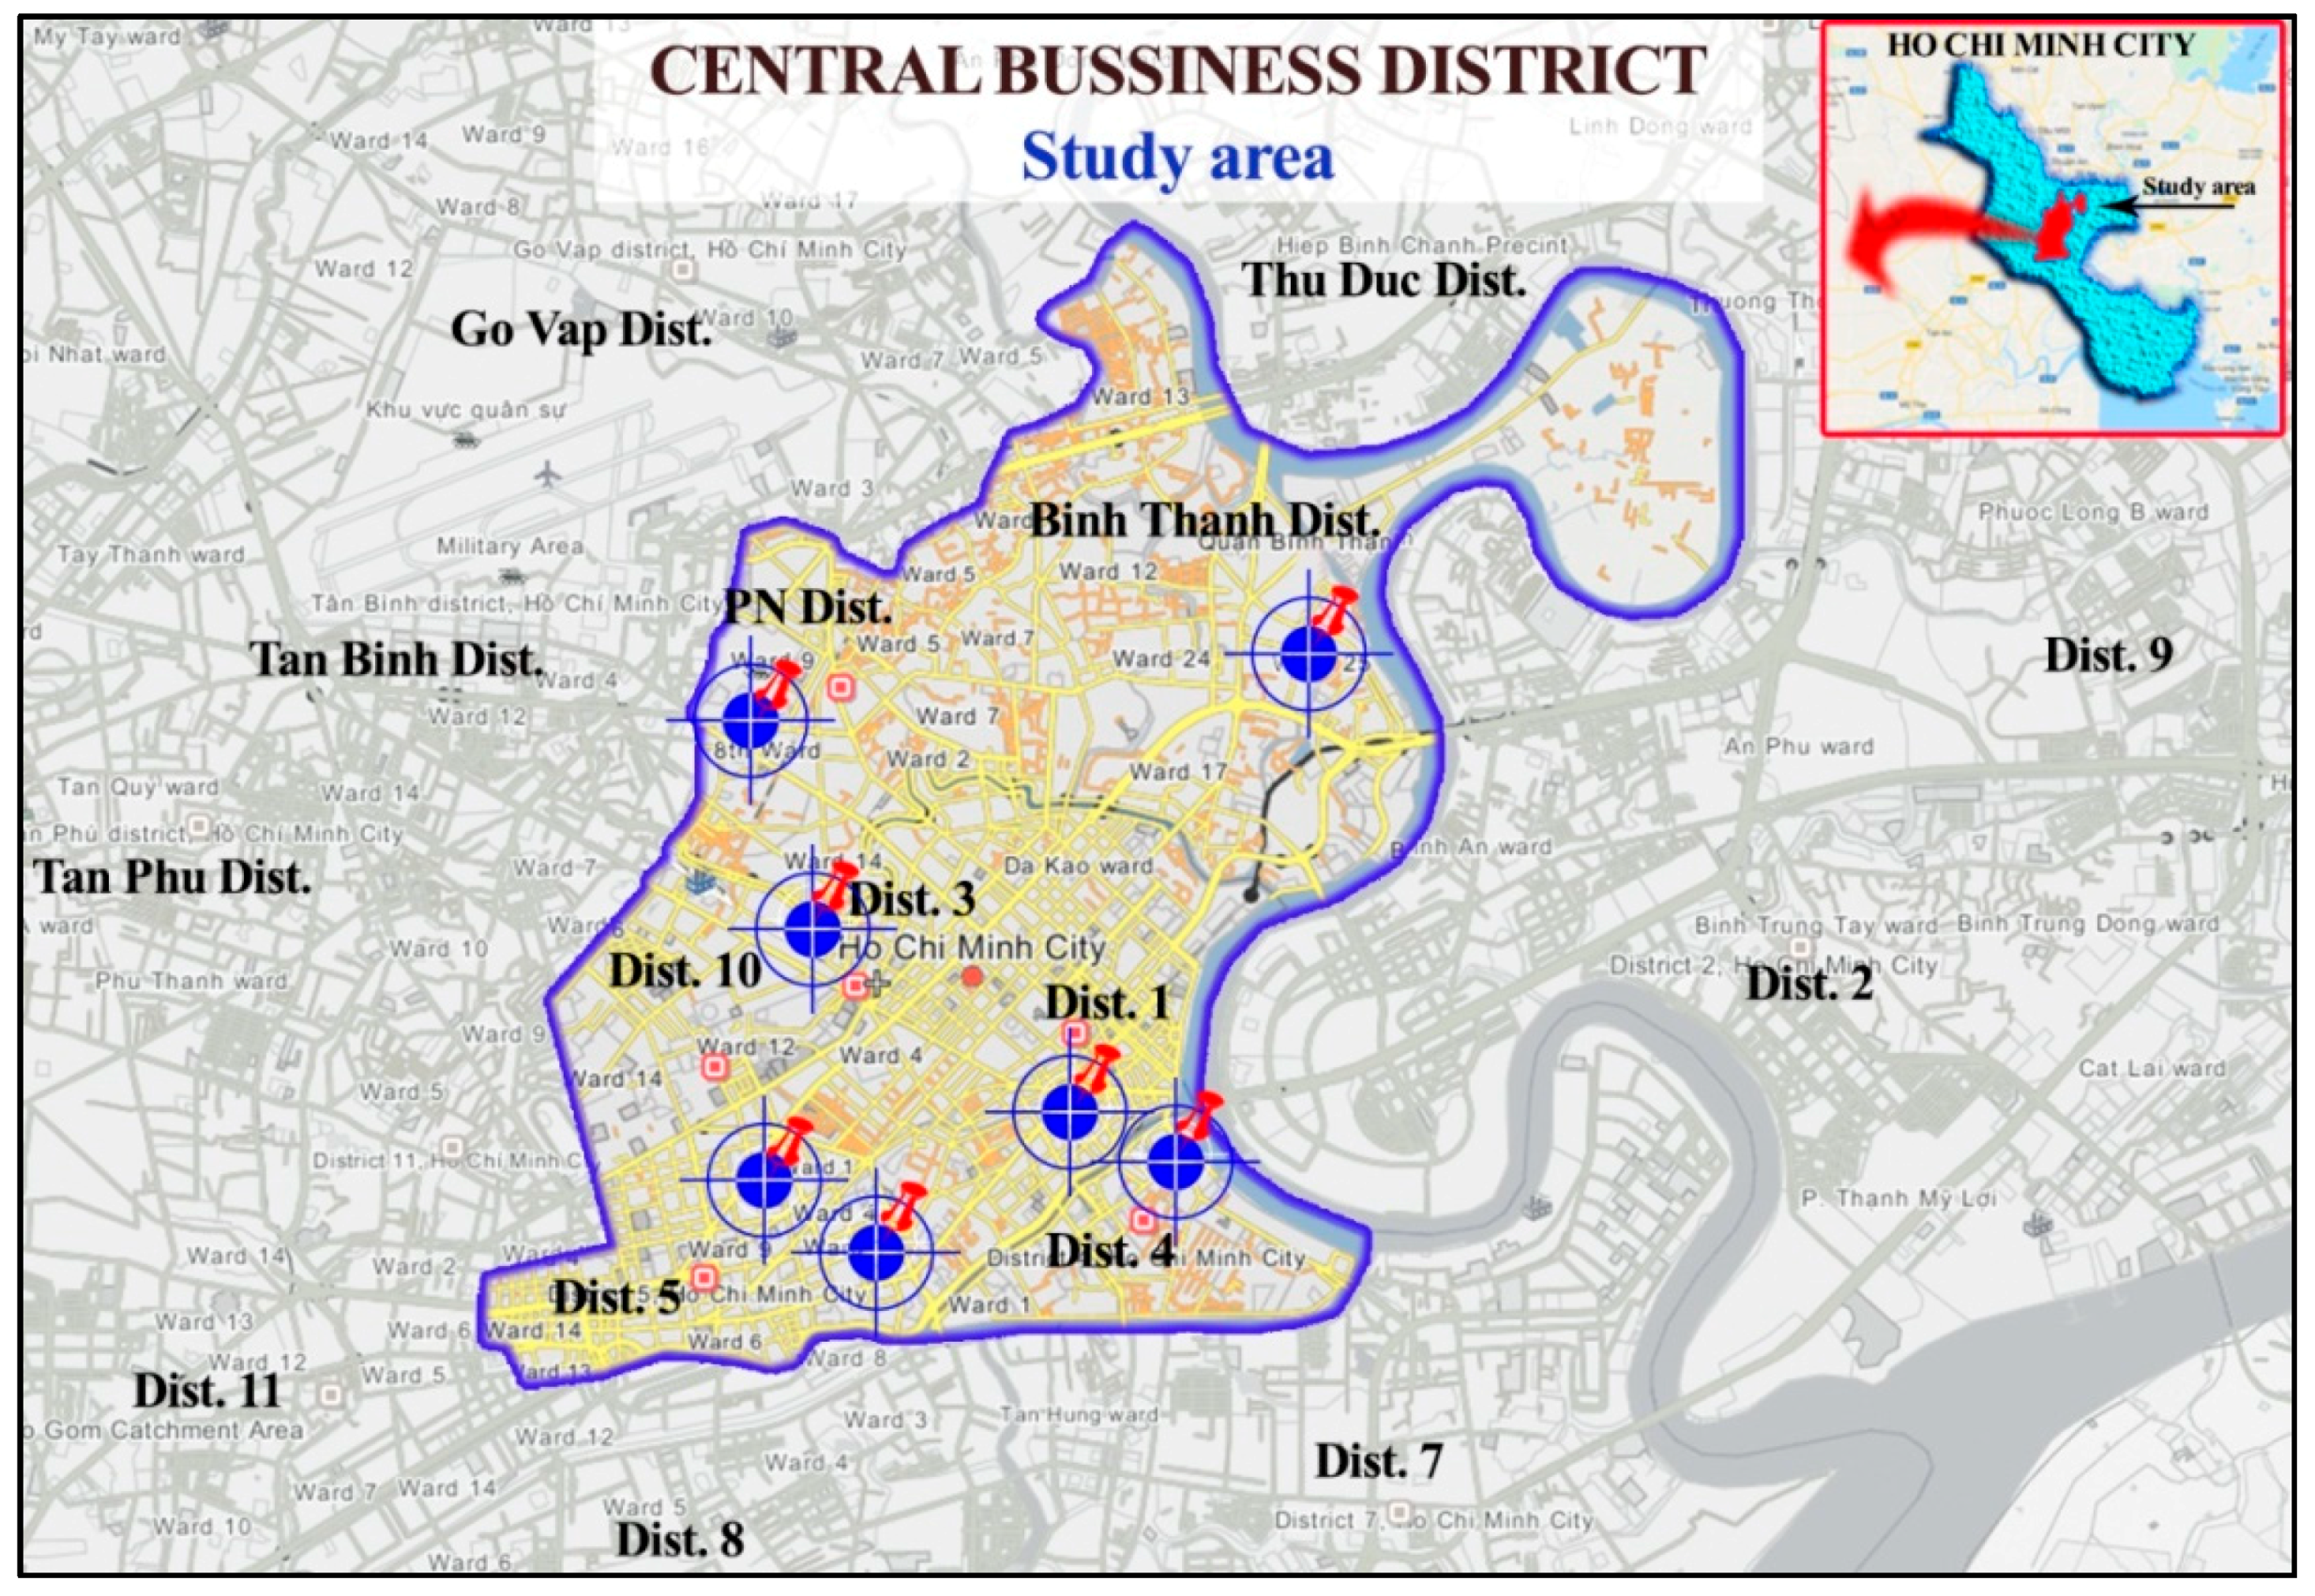
To consider a similar situation of motorcycle-dependent cities, the authors have conducted a survey in HCM City, a typical example for the cities subject motorcycles, 2-wheels vehicles. There are crowded streets in the central business district (CBD) with many buildings, shops, stores, or restaurants located along the streets. Insufficient parking space in this area has resulted in issues such as vehicles parked on sidewalks, which obstructed the movement of pedestrians; illegal parking, and temporary parking on roadways which affects safety and delays the movement of other vehicles, leading to congestions; or parking in front of houses, causing controversies. This study focused on CBD area with a focal core district (district 1) and six bordering districts: Phu Nhuan, Binh Thanh, district 3, district 4, district 5, and district 10, where there are located many schools and offices are congested regularly. Several parking lots with high capacities in these areas were selected to investigate and conduct the survey (see Figure 1).
This study aims to identify the influence factors that affect to parking lot choice of motorcycle drivers by discrete choice model analysis. Besides, it explored whether the preference for on-street parking lots compares with the off-street parking lots. The result expects to have efficiency in changing the current situation of traffic issues. It can be helpful for policy-makers to have reasonable pricing policies, proper distribution of parking lots, or efficient management in transport facilities.
2. Literature Review
Earlier researchers have studied the influence factors of drivers’ parking lot choices in many countries, and many different cities also. The limited parking space and high traffic density in urban areas lead to congestion, emission, and traffic accidents. The study of Reference [4], based on the review of numerous American and European’s cruising studies conducted from 1927–2001, showed that cars searching for free parking contributed to over 8% of total traffic. Road traffic congestion occupied 30% when drivers keep moving on the road to find a parking spot. Other studies also pointed out that cars looking for a parking space caused traffic issues, increased travel time [6,7,8,9], and the average increase of travel time because of search time for parking is 3.3 min for all times, and about 10 min in the evening [4].
Many previous studies have focused on identifying the influence factors for car drivers’ parking lot choice models. References [10,11,12,13,14] examined the efficient pricing policies’ design and Reference [15] studied the price effect on energy consumption and emissions. Other researchers [16,17,18,19] investigated the effect of walking time and walking distance to destination in parking behavior models. Others have examined several factors related to travel decisions, such as trip purpose, parking purpose [18,20,21,22] and parking duration [16]. Parking guidance and information systems also affect car drivers’ parking behaviors and using variable message signs (VMS) bring out a benefit for parking management [23,24]. A study of Reference [25] concentrated on the capacity of the curbside parking lot downtown. Reference [11] has studied the influence of parking fees on car drivers’ between on-street parking and garage parking, while Reference [26] studied on-street parking lots for delivery trucks in the urban area. It showed that truck drivers’ parking behaviors are different from other vehicle drivers: Truck deliveries do not cruise or keep moving to find for parking spaces, distinctly different from other commuter parking.
However, many developing countries are facing a rapid increase in private vehicles, motorcycles and cars principally. Asian countries are examples: Vietnam 15%, India 11%, Indonesia and Thailand 9% [27]. Increasing private vehicle concerns increases in travel demand, and parking space demand for both of these vehicles also raises accordingly. Others studies have focused on car drivers’ behaviors. However, motorcycle drivers’ behaviors are also essential to investigate in this case. The solutions aim to control 2-wheels vehicles is a long-term issue of traffic management, and it cannot be solved immediately. Instead, acceptance and changing gradually with the sustainable strategies of planning, policies are considered; these include parking planning and management and its distribution.
Thompson, 1998 [28] presents a model that represents the parking search behavior of motorists based on the definition of the searching process for parking spaces. This study also considered the impacts of Parking Guidance and Information (PGI) systems and the uncertain attributes of car parks: Queue sizes and departure rates. Arnott and Rowse, 1999 [29] developed a simple model of parking congestion concentrating on drivers who search for a vacant parking spot in metropolitan areas. Antolín, Ibeas, Alonso, and dell’ Olio, 2018 [30] also studied parking behavior models in small size and middle size cities, which presented four parking alternatives in the city: Free on-street parking, paid on-street parking, paid on underground parking, Park and Ride by using a multinomial logit model. P van der Waerden, Timmermans, and Borgers, 2002 [31] developed the parking simulation model where the mixed multinomial logit model was performed better compared to the traditional multinomial logit model.
This study is an extended scope regard to the literature reviews, three types of parking lots were selected to study: On-street parking, off-street parking, and temporary parking due to many drivers who have parked their motorcycles anywhere, even if it is illegal parking. These are popular parking types in HCM City, where on-street parking is facing problems in operation and management.
3. Methodology
3.1. Stated Preference Design and Data Collection.
The stated preference (SP) questionnaire was designed and followed the procedure of experimental design efficiency [32,33]. Four attributes were selected from the literature: Parking cost, walking distance, parking lot capacity, and Parking Guidance & Information (PGI) systems. This study considered and suggested two attributes: Queuing time and checking and payment system, which observed for the current situation and expected a significant impact on drivers’ parking choices. The parking cost considered in the daily working time, do not exceed 8 hours per time and not include overnight parking or long-term parking. The attributes and value levels of experiment design were shown in Table 1 and included mixed 2–3 levels design. The experiment design approached by using a type of factorial design, Taguchi design, which based on mixed levels and orthogonal designs, and appropriate with mixed 2–3 levels design [33,34]. A series of SP scenarios were adapted from the Taguchi array [35] of mixed 2–3 levels by using the Minitab software. The available design for mixed 2–3 levels is 2 factors-2 levels and 12 factors-3 levels which generated 36 runs/scenarios. These scenarios were distributed randomly when creating the questionnaire and divided into 9 subsets, each subset included 4 scenarios, under following realistic situations and can understood easily for the respondent. The respondents can choose a random subset in the online survey. Several dummy variables, such as driving experience, home location, or trip purposes were also considered.
For data collection, an online survey base on a Google form was conducted in HCM City and focused on seven parking lots specifically (Figure 1). The survey was spread on social networks sites such as Facebook under the support of students in HCM City University of Transport and directly interviewed at seven parking lots that were chosen (see Figure 1). The random respondents were chosen drivers come in/get out from those parking lots.
Cochran’s Formula [36] is used to estimate the sample size of data. The author assumed that there is maximum variability equal to 50%, taking 95% confidence interval with 5% error margin. With the population of HCM City is 8,224,000 (Statistic office in HCM City, 2017), so the sample size needs to access 385 random respondents. Assuming that 60% of people agree to answer and complete the survey, we needed to access a total of 642 peoples.
In the survey, the authors considered the habits of the drivers when they travel to a place they are not familiar with as well. The question: “What did you do to find a parking space when you were visiting a city you are not familiar with?” and the question: “Where do you often park your vehicle when you go to the city center?” was asked to the respondents. Searching time depends on the way to find the vacant parking space, which affects the traffic flow and leads to cruising time.
Finally, the survey successfully collected 530 respondents, and there were 318 responses from motorcycle drivers. Table 2 summarizes the socio-demographic and personal background information of the respondents.
The question: “Do you have a driver license?” was asked to the respondents. The result showed that four respondents (1.3%) do not have a driver license due to not enough 18 years old, and two of them rode electric bikes.
3.2. Parking Lot Choice Model Estimation
Various discrete choice models including multinomial logit, nested logit, and mixed logit model under the assumption of random utility maximization (RUM) used to estimate motorcycle drivers’ parking lot choice behaviors. Data analysis is able to evaluate the model fit to the data. Table 2 shows in detail the coefficients for the specification structure of the logit model.
The multinomial Logit Model (MNL) is widely used to analyze the choice behavior in travel such as drivers’ mode choices, route choices, etc. Reference [37] pointed out that the true utility of MNL to each alternative i for decision maker n, noted as Uin, is composed 2 components: The deterministic portion of the utility and the random error. Equation (1) is given below:
where:
Uni = Vni + εni
- -
- Uni is the true utility of the alternative i to the decision maker n
- -
- εni is the error or portion of the utility unknown.
The mathematical structure of the MNL, which gives the probability of individual n choosing alternative i is given by the standard multinomial logit formula:
where
Vin = αi0 + αiXn + βiWni
- -
- Xn = (xn1, ……, xnKo) is the set of individual-specific,
- -
- Wni = (wni1, ……, wniKa) is the set of alternative-specific
- -
- αi = (αi1, ……, αiKo) and βi = (βi1, ……, βiKa) are the coefficients correspond to individual Xn and alternative Wni
- -
- αi0 = (α10, ……, αJ0) is the alternative-specific constants.
3.2.1. The Nested Logit Model
The nested logit model was shown by References [37,38] is based on the idea that some alternatives may be joined in several groups. Where the utility of choice j in set Bs for individual n is:
Unj = Wnk + Ynj + εnj for i∈Bk
Wnk depends only on variables that describe nest k. These variables differ over nests but not over alternatives within each nest.
Ynj depends on variables that describe alternative j. These variables vary over alternatives within nest k.
The nested logit probability can be decomposed into 2 logit models:
Pj = Prob[nest containing j] × Prob[j, given nest containing j]
where:
where:
- -
- λk is a measure of the degree of independence in unobserved utility among the alternatives in nest k.
- -
- IV is inclusive value:
In this paper, 3 alternatives in the choice set can be divided into subsets (noted as nests), the nest of the model can be constructed as the Figure 2 below, called the degenerate nested logit model:
3.2.2. Mixed Logit Model
The mixed logit model [38] can be derived under a variety of different behavioral specifications, and each derivation provides a particular interpretation. The probability is the integrals of standard logit probability over a density of parameters and can be expressed in the form:
where: Lni(β) is the logit probability evaluated at parameters β:
where:
- -
- f(β) is a density function.
- -
- Vni(β) is the observed portion of the utility, which depends on the parameters β
Utility equations for 3 alternatives: Our model takes temporary parking as a reference level which makes its constants omitted in our results.
Von-str = α10 + α11 × Gender + α12 × Age + α13 × Education + α14 × Income + α15 × Driving + α16 × Dum1 + α17 × Dum2 + α18 × Dum3 + α19 × Dum4 + α110 × Dum5 + β1 × Cost + β2 × Walk Distance + β 3 × Queuing time + β 4 × Capacity + β5 × Direction + β6 × Checking system
Voff-str = α20 + α21 × Gender + α22 × Age + α23 × Education + α24 × Income + α25 × Driving + α26 × Dum1 + α27 × Dum2 + α28 × Dum3 + α29 × Dum4 + α210 × Dum5 + β1 × Cost + β2 × Walk Distance + β3 × Queuing time + β4 × Capacity + β5 × Direction + β6 × Checking system
Vtemp = β2 × Walk Distance + β3 × Queuing time
Results of the choice models were estimated by using the Biogeme software package [39].
4. Results and Discussion
Table 3 summarizes the socio-demographic and personal background information of the respondents. For motorcycle drivers, the survey accessed 142 female respondents (44.7%) and 176 male respondents (55.3%). Most of the respondents are from 18–34 years old (95.6%). For the question regarding the choice of the parking lot, 164 motorcycle respondents (51.7%) chose on-street parking; 120 respondents (37.7%) chose off-street parking and 34 people chose temporary parking (10.6%).
The answer to the question: “Where do you often park your vehicle when you go to the city center?” showed that 51% of the motorcycle users often park at work due to their employer subsidizing parking. This is the preference for parking since the walking distance is short when compared with paid parking lots. This event illustrates the impact of parking cost and walking distance. There are 17% of the respondents who often park at markets or shopping malls parking lots. Also, 17% park at the on-street parking lot while 9% park at the off-street parking lot in the residential area. Only 3% answered that they often park anywhere feel convenience, and 3% with other answers (Figure 3).
In this study, authors also considered the way that people look for a parking space. The question: “What did you do to find a parking space when you were visiting a city you are not familiar with?” was asked to the respondents. Finally, the answers are shown in Figure 4 with 38% of motorcycle users who have asked other people for parking lots search. Mobile phones and maps seem unsafe while driving and motorcycles can easily stop on the curb to ask nearby people. Also, 28% of respondents kept driving on the road to find a parking lot. This leads to an issue called cruising for parking, which affects the traffic flow, generating congestions, CO2 emissions, air pollution, and so on [4,6,9]. Authors also clarify the effect of the queuing time for parking, which contributes to local congestions; increases travel time and energy consumption. This issue even reveals that the checking and payment system of a parking lot is the main factor to release vehicle flow. Otherwise, 23% of the respondents looked for a parking spot by internet search, and 11% of respondents followed street signs to find a parking lot.
Various random utility maximizations included the MNL model [37,38], the degenerate nested logit model, and the mixed logit model [38], which were used to estimate the data. The model specifications are shown in Table 2 above.
The first estimation started with the RUM-MNL model [40]. The nested logit model structures as the degenerate nested logit model (Figure 2). To test the correlation among three parking types, the assumption of RUM is estimated with these parking types in two nests, a nest of off-street alone and another nest consisting of on-street parking and temporary parking. Authors decided to test the correlation of on-street parking and temporary parking in the same nest due to drivers’ confusion between the on-street parking and illegal parking or parking anywhere that feels convenient on the curb or sidewalk temporarily (where parking is not allowed). Many drivers also equated this illegal temporary parking with on-street legal parking deliberately. The mixed logit model with the assumption of RUM (RUM-ML) was estimated to test the heterogeneity in preferences on parking location choice.
The model estimating showed in Table 4. In the first try at the model estimation, all alternative specific variables and socio-demographic variables were included; however, the effects of some variables were not statistically significant. Hence, Table 4 below showed the final result of the model. It shows that all of the coefficients giving the expected signs, wherein parking fees, walking distance and queuing time have negative signs while parking type and capacity of the parking lot are positive. The negative signs of these factors represented drivers’ normal behavior, the choice probabilities decrease when the cost, time and distance increase. Otherwise, a larger parking lot is more attractive to the driver, which implies the positive sign of the parking lot’s size and capacity.
Authors proceeded to the degenerate nested logit model; however, it did not fit with the initial assumption that on-street parking and temporary parking located in the same nest. The coefficient of the inclusive value (IV) is very high (λk = 5.40). It implies that there is no correlation among the alternatives in each nest; so the on-street parking and temporary parking alternatives cannot be in the same nest. The authors also afforded with another structure of the nested logit model; however, it was not a better model. According to Reference [41], the nested logit model can estimate through an IV value (parameter λk), which is a measure of the degree of independence in unobserved utility among the alternatives in nest k. It means greater independence and less correlation with the higher value of λk. This case with λk = 5.40 indicated that no correlation among the unobserved components of utility for alternatives within a nest. Reference [41] mentioned that with a lower value of λk, there is less independence and greater correlation.
The coefficient of IV (λk) should be within the range (0–1) and close to 0, which implies that the correlation among the alternatives is greater [41]. Finally, the authors rejected the estimation of the nested logit model because this specification does not fit with our data.
The model estimation of the MNL model and the mixed logit model showed in Table 4, all the coefficients are significant and interpretation of drivers’ normal behavior: Coefficients of parking cost, walking distance and queuing time are negative which similar with previous researches [16,17,18,19,42,43,44].
The authors proposed the mixed logit model as a random parameter mixed logit model where there is a need to specify a distribution for the coefficients and estimate the parameters of that distribution. Therefore, the RUM-ML model was started with the assumption that all alternative specific variables (see Table 1) follow the normal distribution. The authors also attempted other models under the assumption of different distributions. However, the result of the model with the queuing time variable follows the normal distribution, which gave the best yield to the model fit. Hence, the results specified the coefficients and estimated parameters of the normal distribution. The queuing time variable was generated when the authors investigated in the study area. Queuing line of parkers at the entrance of many parking lots was revealed clearly during peak times. It affects the traffic flow of the nearby road. For example, motorcycle parkers wait for parking at the entrance gate of HCM City University of Transportation was crowded and even expanded to D3 Street. It obstructs the movement of other vehicles on the road. This issue is still remaining and happening currently.
This queuing time variable is a simple association to a normal distribution coefficient with the other different types of attributes, such as parking fee, walking distance, and parking lot’s capacity. The standard deviation of the random coefficient is highly significant (p < 0.001), indicating that these coefficients do indeed vary in the population. The positive value of the standard deviation of the queuing time in conjunction with the negative value of the attribute mean of the queuing time coefficients implies that an increase in queuing time leads to a decrease in utility (Table 5 and Table 6). This is clearly appropriate to our expectations and parkers’ normal behaviors. Hess, Yoder, and Johnston, 2006 [45] mentioned that high values of standard deviations along with the corresponding t-statistic imply that the decision uses the values with strong variations. For this queuing parameter, the value of the standard deviation coefficient is low (σ = 0.148). This implies that the variation is less important and the use of a normal distribution for the range coefficient of queuing time is a fit with our assumption (significant at a 99% confident interval, p < 0.01).
According to the log-likelihood, McFadden parameters, the mixed logit model performs better than the MNL model. Specifically, the value of log-likelihood = −995.44 (higher than −997.58) and = 0.288 (higher than 0.286). Thus, the mixed model is reasonable and explanatory with respect to the motorcycle users’ behavior.
Similarities in the estimation results are the positive signs on trip purpose coefficients, indicates that people favor choosing legal parking lots for work, school, visiting or shopping purposes, and more favor off-street parking that can see from the coefficients of these dummy variables (Table 4) are higher when compare with corresponding coefficients of on-street estimation model. It is different from the trips that do not take a long time such as buying foods/drinks, meeting friends or some other goals, and temporary parking is a favor. Driving experience variable coefficients are negative signs for all the model estimation. It implies that driving experience increase leads to a decrease in the utility of on-and off-street parking, and seems like experienced drivers can recognizable their favor parking place instead of paid-parking lots.
The RUM estimation is capable of verifying the result from the experiment design and picked maximum utilities of the alternatives to a comparison. The maximum utility of on-street parking found on the choice of an individual who is female, younger than 24 years old, with a visiting purpose with a free parking cost, 100 m of walking distance and preferred capacity of 300 veh/750 m2. The maximum utility of off-street parking obtained on the choice of an individual who is also female, older than 24 years old, for a visiting purpose with a free parking cost, 100 m of walking distance and preferred capacity of 1000 veh/2500 m2. Figure 4 illustrated the utility variance of on-street parking and off-street parking when queuing time increases. It can explain that the utility of on-street parking was higher than off-street parking, and motorcycle parkers preferred on-street parking with the experimental design to other alternatives.
There are two socio-demographic variables: Gender and age, which were significant effects on the on-street parking choices (p < 0.001, significant at 99.9%). The result from Table 4 implies that the utility of on-street parking decrease when the individuals were male (negative sign, male = 1, otherwise = 0), and a similar effect of age—the utility decreases when the individuals were older than 24 years old (negative sign, >24 years old = 1, otherwise = 0). However, they had lesser effects on the off-street parking choices.
Regarding the parking cost for motorcycle drivers, 47.95% of respondents look for a free parking space, including 23.98% chose free on-street parking, 13.36% chose free off-street parking, and 10.6% chose temporary parking. Also, 14% and 10% of the respondents chose off-street parking lots with a fee of 2000 VND and 4000 VND, respectively. On-street parking holds 18.36% and 9.75% of drivers who choose a fee of 3000 VND and 5000 VND, respectively. It is compatible with the assumption that the parking costs of on-street parking are more expensive than off-street parking due to its effect on traffic management and road occupation [11,46].
5. Conclusions
This study focused on identifying the influence factors affecting the parking lot choice behaviors of motorcycle drivers in HCM City particularly, and in developing countries in general. Using various random utility maximizations, RUM is used to estimate the motorcycle drivers’ parking choice behavior models. The results showed that the mixed logit model fits with the data of motorcycle users. The influence factors including parking cost, walking distance, queuing time, and the capacity of the parking lot presented significant effects on parking choice behavior. Queuing time or waiting time to park presented the initial expectation. The higher parking costs and lesser capacity of on-street parking were assumed; however, up to 51.7% of respondents preferred on-street parking, in which of 23.98% had chosen free parking. Therefore, on-street parking is essential to making appropriate management policies, including a pricing policy. A reasonable estimation for parking demand is helpful for urban planning and sustainable strategies. Specifically, influence factor recognition is useful for parking predictions. The signs of each impact factor implied reasonable improvements of parking cost, parking lot distribution and capacity, walking distance from the parking lot, queuing time, and related policies to produce the positive effect on the urban transportation system. Finally, illegal parking should be exhibited, and temporary parking should be restricted. It is necessary to have a guidance and information system to properly warn parkers.
Author Contributions
Conceptualization: H.H. and S.Z.; methodology: H.H. and S.Z.; data processing: H.H. and H.E.; formal analysis: H.H.; writing: H.H. and H.E.; review, and editing: S.Z., H.H., and H.E.
Funding
This research is supported by the National Natural Science Foundation of China (No. 51478085).
Conflicts of Interest
The authors declare no conflict of interest.
References
- Department of Transportation. Growth of Vehicle. Available online: https://vnexpress.net/infographics/phuong-tien-giao-thong-o-ha-noi-phat-trien-nhu-the-nao-3322639.html (accessed on 28 January 2019).
- Wismadi, A.; Soemardjito, J.; Sutomo, H. Transport Situation in Jakarta. In Study on Energy Efficiency Improvement in the Transport Sector through Transport Improvement and Smart Community Development in the Urban Area; Lambert Academic Publishing: Saarbrücken, Germany, 2013; pp. 29–58. Available online: http://www.eria.org/RPR_FY2012_No.29_Chapter_4.pdf (accessed on 28 January 2019).
- Tulyasuwan, N. Private Motorized Transport. Retriev. April 2013, 25, 16. [Google Scholar]
- Shoup, D.C. Cruising for parking. Transp. Policy 2006, 13, 479–486. [Google Scholar] [CrossRef]
- Liu, W.; Geroliminis, N. Modeling the morning commute for urban networks with cruising-for-parking: An MFD approach. Transp. Res. Part B Methodol. 2016, 93, 470–494. [Google Scholar] [CrossRef] [Green Version]
- Alemi, F.; Rodier, C.; Drake, C. Cruising and on-street parking pricing: A difference-in-difference analysis of measured parking search time and distance in San Francisco. Transp. Res. Part A Policy Pract. 2018, 111, 187–198. [Google Scholar] [CrossRef]
- Wong, D.W.S.; Batt, S.B.; Lee, C.C.; Wagschal, K.; Robertson, G.H.; Omer, I.; Kaplan, N.; Rodier, C.J.; Shaheen, S.A.; Ngoc, A.M.; et al. Modelling drivers’ car parking behaviour using data from a travel choice simulator. Transp. Res. Procedia 2017, 25, 198–206. [Google Scholar] [CrossRef]
- Cao, J.; Menendez, M. Quantification of potential cruising time savings through intelligent parking services. Transp. Res. Part A Policy Pract. 2018, 116, 151–165. [Google Scholar] [CrossRef]
- Arnott, R.; Williams, P. Cruising for parking around a circle. Transp. Res. Part B Methodol. 2017, 104, 357–375. [Google Scholar] [CrossRef]
- Simićević, J.; Milosavljević, N.; Maletić, G.; Kaplanović, S. Defining parking price based on users’ attitudes. Transp. Policy 2012, 23, 70–78. [Google Scholar] [CrossRef]
- Kobus, M.B.W.; Gutiérrez-i-Puigarnau, E.; Rietveld, P.; Van Ommeren, J.N. The on-street parking premium and car drivers’ choice between street and garage parking. Reg. Sci. Urban. Econ. 2013, 43, 395–403. [Google Scholar] [CrossRef]
- Arnott, R. On the optimal target curbside parking occupancy rate. Econ. Transp. 2014, 3, 133–144. [Google Scholar] [CrossRef] [Green Version]
- Fabusuyi, T.; Hampshire, R.C. Rethinking performance based parking pricing: A case study of SFpark. Transp. Res. Part A Policy Pract. 2018, 115, 90–101. [Google Scholar] [CrossRef]
- Yan, X.; Levine, J.; Marans, R. The effectiveness of parking policies to reduce parking demand pressure and car use. Transp. Policy 2018, 73, 41–50. [Google Scholar] [CrossRef]
- Čuljković, V. Influence of parking price on reducing energy consumption and co2emissions. Sustain. Cities Soc. 2018, 41, 706–710. [Google Scholar] [CrossRef]
- Golias, J.; Yannis, G.; Harvatis, M. Off-street parking choice sensitivity. Transp. Plan. Technol. 2002, 25, 333–348. [Google Scholar] [CrossRef]
- Benenson, I.; Martens, K.; Birfir, S. PARKAGENT: An agent-based model of parking in the city. Comput. Environ. Urban. Syst. 2008, 32, 431–439. [Google Scholar] [CrossRef]
- Verma, A.; Verma, M.; Rahul, T.M.; Khurana, S.; Rai, A. Acceptable trip distance for walking in mass religious gatherings—A case study of world’s largest human gathering Kumbh Mela in Ujjain, India. Sustain. Cities Soc. 2018, 41, 505–512. [Google Scholar] [CrossRef]
- Li, S.; Zhao, P.; Zhang, H.; Quan, J. Walking behavior in the old downtown Beijing: The impact of perceptions and attitudes and social variations. Transp. Policy 2019, 73, 1–11. [Google Scholar] [CrossRef]
- Moghaddam, Z.R.; Jeihani, M. The Effect of Travel Time Information, Reliability, and Level of Service on Driver Behavior Using a Driving Simulator. Procedia Comput. Sci. 2017, 109, 34–41. [Google Scholar] [CrossRef]
- Van der Waerden, P.; Timmermans, H.; da Silva, A.N.R. The influence of personal and trip characteristics on habitual parking behavior. Case Stud. Transp. Policy 2015, 3, 33–36. [Google Scholar] [CrossRef]
- Bonsall, P.; Palmer, I. Modelling drivers’ car parking behaviour using data from a travel choice simulator. Transp. Res. Part. C Emerg. Technol. 2004, 12, 321–347. [Google Scholar] [CrossRef] [Green Version]
- Teodorović, D.; Lučić, P. Intelligent parking systems. Eur. J. Oper. Res. 2006, 175, 1666–1681. [Google Scholar] [CrossRef]
- Chen, Z.; Spana, S.; Yin, Y.; Du, Y. An Advanced Parking Navigation System for Downtown Parking. Netw. Spat. Econ. 2019, 1–16. [Google Scholar] [CrossRef]
- Arnott, R.; Inci, E.; Rowse, J. Downtown curbside parking capacity. J. Urban. Econ. 2015, 86, 83–97. [Google Scholar] [CrossRef] [Green Version]
- Amer, A.; Chow, J.Y.J. A downtown on-street parking model with urban truck delivery behavior. Transp. Res. Part A Policy Pract. 2017, 102, 51–67. [Google Scholar] [CrossRef]
- My Thanh, T.T.; Friedrich, H. Legalizing the illegal parking, a solution for parking scarcity in developing countries. Transp. Res. Procedia 2017, 25, 4954–4969. [Google Scholar] [CrossRef]
- Thompson, R.G. A parking search model. Transpn Res. Part A Policy Pract. 1998, 32, 159–170. [Google Scholar] [CrossRef]
- Arnott, R.; Rowse, J. Modeling Parking. J. Urban. Econ. 1999, 45, 97–124. [Google Scholar] [CrossRef]
- Antolín, G.; Ibeas, Á.; Alonso, B.; dell’Olio, L. Modelling parking behaviour considering users heterogeneities. Transp. Policy 2018, 67, 23–30. [Google Scholar] [CrossRef]
- Van der Waerden, P.; Timmermans, H.; Borgers, A. PAMELA—Parking analysis model for predicting effects in local areas. Transp. Res. Rec. 2002, 1781, 10–18. [Google Scholar] [CrossRef]
- Rose, J.M.; Bliemer, M.C.J.; Hensher, D.A.; Collins, A.T. Designing efficient stated choice experiments in the presence of reference alternatives. Transp. Res. Part B Methodol. 2008, 42, 395–406. [Google Scholar] [CrossRef]
- Kuhfeld, W.F. Marketing Research Methods in Sas: Experimental Design, Choice, Conjoint, and Graphical Techniques. Available online: http://support.sas.com/techsup/technote/mr2010.pdf (accessed on 25 June 2018).
- Hensher, D.; Louviere, J.; Swait, J. Combining sources of preference data. J. Econom. 1998, 89, 197–221. [Google Scholar] [CrossRef]
- Cavazzuti, M. Optimization Methods: From Theory to Design Scientific and Technological Aspects in Mechanics; Springer Science and Business Media: Berlin, Germany, 2013; ISBN 9783642311871. [Google Scholar]
- Guwahat, S. Chapter 2 Determination of appropriate Sample Size. Bull. Gauhati Univ. Math. Assoc. Int. J. Appl. Math. Stat. Sci. 2013, 12, 28. [Google Scholar] [CrossRef]
- Koppelman, F.S.; Bhat, C. A Self Instructing Course in Mode Choice Modeling. Available online: http://www.ce.utexas.edu/prof/bhat/COURSES/LM_Draft_060131Final-060630.pdf (accessed on 26 March 2017).
- Train, K.E. Discrete Choice Methods with Simulation, 2nd ed.; Cambridge University Press: Cambridge, UK, 2009; pp. 76–96. [Google Scholar] [CrossRef]
- Bierlaire, M. The estimation of generalized extreme value models from choice-based samples. Transp. Res. Part B Methodol. 2008, 42, 381–394. [Google Scholar] [CrossRef] [Green Version]
- Barrios, J.A. Generalized sample selection bias correction under RUM. Econ. Lett. 2004, 85, 129–132. [Google Scholar] [CrossRef]
- Train, K.E. Discrete Choice Methods with Simulation; Cambridge University Press: Cambridge, UK, 2003; ISBN 978051175. [Google Scholar]
- Chaniotakis, E.; Pel, A.J. Drivers’ parking location choice under uncertain parking availability and search times: A stated preference experiment. Transp. Res. Part A Policy Pract. 2015, 82, 228–239. [Google Scholar] [CrossRef]
- Van Der Waerden, P.; Janssens, D.; Da Silva, A.N.R. The influence of parking facility characteristics on car drivers’ departure time decisions. Transp. Res. Procedia 2017, 25, 4062–4071. [Google Scholar] [CrossRef]
- Christiansen, P.; Engebretsen, Ø.; Fearnley, N.; Usterud Hanssen, J. Parking facilities and the built environment: Impacts on travel behaviour. Transp. Res. Part A Policy Pract. 2017, 95, 198–206. [Google Scholar] [CrossRef]
- Hess, S.; Train, K.E.; Polak, J.W. On the use of a Modified Latin Hypercube Sampling (MLHS) method in the estimation of a Mixed Logit Model for vehicle choice. Transp. Res. Part B Methodol. 2006, 40, 147–163. [Google Scholar] [CrossRef] [Green Version]
- Ibeas, A.; Dell’Olio, L.; Bordagaray, M.; de Ortúzar, J.D. Modelling parking choices considering user heterogeneity. Transp. Res. Part A Policy Pract. 2014, 70, 41–49. [Google Scholar] [CrossRef]
Figure 1.
Study area and parking lot location for the survey.

Figure 2.
The degenerate nested logit model structure.

Figure 3.
Drivers’ methods to find a parking space and their parking place.

Figure 4.
Utility variance of the alternatives with increasing queuing time.


Table 1.
Survey attributes and values of the experiment design.
| No | Attributes | Level | On-Street | Off-Street | Temporary Parking |
|---|---|---|---|---|---|
| 1 | Guidance and information system | 1 | Yes | Yes | |
| 2 | No | No | |||
| 2 | Parking cost (VND per time) (less than 8 h/time) | 1 | 0 | 0 | |
| 2 | 3000 | 2000 | |||
| 3 | 5000 | 4000 | |||
| 3 | Walking distant (m) | 1 | 100 | 100 | 50 |
| 2 | 300 | 400 | 200 | ||
| 3 | 500 | 700 | 400 | ||
| 4 | Queuing time to park | 1 | 0 | 2 | 0 |
| 2 | 5 | 6 | 4 | ||
| 3 | 10 | 10 | 8 | ||
| 5 | Capacity/area (veh/m2) | 1 | 100 veh/250 m2 | 100 veh/250 m2 | |
| 2 | 200 veh/500 m2 | 400 veh/1000 m2 | |||
| 3 | 300 veh/750 m2 | 1000 veh/2500 m2 | |||
| 6 | Checking and payment | 1 | Cash | Cash | |
| 2 | Swipe card | Swipe card | |||
| 3 | Automatic | Automatic |
Table 2.
Specification of the logit model for the choice of parking.
| Variable | Coefficient | Description |
|---|---|---|
| Constant | αi0 (i = 1,2,3) * | On-street (i = 1), Off-street (i = 2), Temporary parking (i = 3) |
| Gender | αi1 | Male = 1, Female = 0 |
| Age | αi2 | <24 = 0, otherwise = 1 |
| Education | αi3 | Bachelor or above = 1, otherwise = 0 |
| Income | αi4 | <6 million VND = 0, otherwise = 1 |
| Driving Experience | αi5 | >5 years = 1, otherwise = 0 |
| Home Location dum1: Study area | αi6 | CBD = 1, otherwise = 0 |
| Home Location dum2: Other areas | αi7 | Home Located in center area = 0, otherwise = 1 |
| Trip purpose dum3: Working/Schooling | αi8 | Trip purpose: working = 1, otherwise = 0 |
| Trip purpose dum4: Visiting | αi9 | Trip purpose: visiting = 1, otherwise = 0 |
| Trip purpose dum5: Shopping | αi10 | Trip purpose: shopping = 1, otherwise = 0 |
| Parking cost (VND) | β1 | Parking cost (VND) |
| Walking distant to the destination (m) | β2 | Walking distant to the destination (m) |
| Queuing time to park | β3 | Queuing time to park |
| Capacity/area (veh/m2) | β4 | Capacity/area (veh/m2) |
| Guidance and information system | β5 | Yes = 2, No = 1 |
| Checking and payment | β6 | Cash = 1, Swipe card = 2, Automatic = 3 |
* αij indicated the effect of factor j to the alternative i. αi0 constant of alternative i, i = {1, 2, 3} (1: On-street parking, 2: Off-street parking, 3: Temporary parking). Dumµ: Dummy variable µ, µ = {1, 2, 3, 4, 5}.
Table 3.
Socio-demographic characteristics of respondents.
| Motorcycle | ||
|---|---|---|
| Motorcycle Respondent/Total | 318/530 | |
| Gender | Male | 55.3% |
| Female | 44.7% | |
| Age | <18 years old | 1.3% |
| 18–24 years old | 41.5% | |
| 25–34 years old | 54.1% | |
| 35–54 years old | 2.5% | |
| >55 years old | 0.6% | |
| Education | Lower than bachelor | 18.2% |
| Bachelor | 73.6% | |
| Master or higher | 8.2% | |
| Monthly income | < 2 million VND | 12.6% |
| 2–6 million VND | 26.4% | |
| 6–10 million VND | 37.1% | |
| 10–15 million VND | 17.0% | |
| 15–30 million VND | 6.3% | |
| 30–50 million VND | 0.0% | |
| >50 million VND | 0.6% | |
Table 4.
Motorcycle users’ estimation parking choice models (t-value is parenthesis).
| Variables | Coef. | MNL Logit Model | Nested Logit Model | Mixed Logit Model | ||||||
|---|---|---|---|---|---|---|---|---|---|---|
| On-street | Off-street | Temporary | On-street | Off-street | Temporary | On-street | Off-street | Temporary | ||
| Coefficient | Coefficient | Coefficient | Coefficient | Coefficient | Coefficient | Coefficient | Coefficient | Coefficient | ||
| Rob. t-test | Rob. t-test | Rob. t-test | Rob. t-test | Rob. t-test | Rob. t-test | Rob. t-test | Rob. t-test | Rob. t-test | ||
| Constant | αi0 | 2.86 | 1.47 | - | 2.15 | 2.03 | - | 3.02 | 1.47 | - |
| (8.7 ***) | 4.4 *** | - | (6.15 ***) | (6.79 ***) | - | (8.24 ***) | (4.14 ***) | - | ||
| Gender | αi1 | −0.464 | - | - | −0.0686 | - | - | -0.507 | - | - |
| (−3.54 ***) | - | - | (−1.9 .) | - | - | (−3.57 ***) | - | - | ||
| Age | αi2 | −0.441 | - | - | - | - | - | −0.446 | - | - |
| (−3.17 ***) | - | - | - | - | - | (−3.03 ***) | - | - | ||
| Driving Experience | αi5 | −0.531 | −0.578 | - | −0.576 | −0.48 | - | −0.571 | −0.607 | - |
| (−2.14 *) | (−2.41 *) | - | (−2.79 **) | (−2.66 **) | - | (−2.19 **) | (−2.45 **) | - | ||
| Dum1: CBD | αi7 | −1.02 | −0.991 | - | −0.745 | −0.665 | - | −1.08 | −1.05 | - |
| (−4.57 ***) | −4.31 ***) | - | (−3.25 ***) | (−3.31 ***) | - | (−4.49 ***) | (−4.27 ***) | - | ||
| Dum3: Working/Schooling | αi8 | 1.23 | 1.33 | - | 0.842 | 0.76 | - | 1.35 | 1.49 | - |
| (4.32 ***) | 4.54 ***) | - | (3.05 ***) | (3.25 ***) | - | (4.32 ***) | (4.64 ***) | - | ||
| Dum4: Visiting | αi9 | 1.58 | 1.59 | - | 1.01 | 0.903 | - | 1.78 | 1.85 | - |
| (5.14 ***) | 4.83 ***) | - | (3.25 ***) | (3.36 ***) | - | (4.71 ***) | (4.56 ***) | - | ||
| Dum5: Shopping | αi10 | 1.26 | 1.28 | - | 0.87 | 0.772 | - | 1.24 | 1.33 | - |
| (4.22 ***) | 4.08 ***) | - | (2.72 **) | (2.81 ***) | - | (3.99 ***) | (4.02 ***) | - | ||
| Cost | β1 | −3.58 × 10⁻⁴ | −1.07 × 10⁻⁴ | −3.99 × 10⁻⁴ | ||||||
| (−11.29 ***) | (−4.88 ***) | (−8.95 ***) | ||||||||
| Walking | β2 | −1.21 × 10⁻³ | −2.48 × 10⁻⁴ | −1.43 × 10⁻³ | ||||||
| (−5.61 ***) | (−3.33 ***) | (−5.32 ***) | ||||||||
| Queuing | β3 | −6.13 × 10⁻² | −1.25 × 10⁻² | −7.07 × 10⁻² | ||||||
| (−4.54 ***) | (−2.67 **) | (−4.3 ***) | ||||||||
| Capacity | β4 | 2.07 × 10⁻³ | 3.89 × 10⁻⁴ | 2.31 × 10⁻³ | ||||||
| (11.76 ***) | (4.22 ***) | (9.64 ***) | ||||||||
| IV | λk | 5.4 | ||||||||
| (4.35 ***) | ||||||||||
| Queuing_S Std. dev. | σ | 0.148 | ||||||||
| (2.93 ***) | ||||||||||
| L0 | −1397.435 | −1397.435 | −1397.435 | |||||||
| LL | −997.586 | −969.493 | −995.444 | |||||||
| 0.286 | 0.306 | 0.288 | ||||||||
Significant codes: ‘***’ p < 0.001 ‘**’ p < 0.01 ‘*’ p < 0.05 ‘.’ p < 0.1.
Table 5.
Parameters of the random variable.
| Variable | Parameter | Value | Std. Error |
|---|---|---|---|
| Queuing time | Mean of normal distribution (coefficient) | −7.07 × 10⁻² | 0.0165 |
| Std. dev. of normal distribution (coefficient) | 0.148 | 0.0504 |
Table 6.
The model-fit of motorcycle drivers’ behavior.
| Variables | Coef. | Mixed Logit Model | ||
|---|---|---|---|---|
| On-street | Off-street | Temporary | ||
| Coefficient | Coefficient | Coefficient | ||
| Rob. t-test Value | Rob. t-test Value | Rob. t-test Value | ||
| Robust Std err | Robust Std err | Robust Std err | ||
| Constant | αi0 | 3.02 | 1.47 | - |
| (8.24 ***) | (4.14 ***) | - | ||
| [0.366] | [0.356] | |||
| Gender | αi1 | −0.507 | - | - |
| (−3.57 ***) | - | - | ||
| [0.142] | ||||
| Age | αi2 | −0.446 | - | - |
| (−3.03 ***) | - | - | ||
| [0.148] | ||||
| Driving Experience | αi5 | −0.571 | −0.607 | - |
| (−2.19 **) | (−2.45 **) | - | ||
| [0.261] | [0.248] | |||
| Dum1: CBD | αi7 | −1.08 | −1.05 | - |
| (−4.49 ***) | (−4.27 ***) | - | ||
| [0.241] | [0.245] | |||
| Dum3: Working/Schooling | αi8 | 1.35 | 1.49 | - |
| (4.32 ***) | (4.64 ***) | - | ||
| [0.312] | [0.321] | |||
| Dum4: Visiting | αi9 | 1.78 | 1.85 | - |
| (4.71 ***) | (4.56 ***) | - | ||
| [0.377] | [0.406] | |||
| Dum5: Shopping | αi10 | 1.24 | 1.33 | - |
| (3.99 ***) | (4.02 ***) | - | ||
| [0.311] | [0.331] | |||
| Cost | β1 | −3.99 × 10⁻⁴ | ||
| (−8.95 ***) | ||||
| [4.46E-005] | ||||
| Walking | β2 | −1.43 × 10⁻³ | ||
| (−5.32 ***) | ||||
| [0.000268] | ||||
| Queuing | β3 | −7.07 × 10⁻² | ||
| (−4.3 ***) | ||||
| [0.0165] | ||||
| Capacity | β4 | 2.31 × 10⁻³ | ||
| (9.64 ***) | ||||
| [0.000240] | ||||
| Queuing_S Std. dev. | σ | 0.148 | ||
| (2.93 ***) | ||||
| [0.0504] | ||||
| L0 | −1397.435 | |||
| LL | −995.444 | |||
| 0.288 | ||||
© 2019 by the authors. Licensee MDPI, Basel, Switzerland. This article is an open access article distributed under the terms and conditions of the Creative Commons Attribution (CC BY) license (http://creativecommons.org/licenses/by/4.0/).
Share and Cite
MDPI and ACS Style
Hoang, P.H.; Zhao, S.; Houn, S.E. Motorcycle Drivers’ Parking Lot Choice Behaviors in Developing Countries: Analysis to Identify Influence Factors. Sustainability 2019, 11, 2463. https://doi.org/10.3390/su11092463
AMA Style
Hoang PH, Zhao S, Houn SE. Motorcycle Drivers’ Parking Lot Choice Behaviors in Developing Countries: Analysis to Identify Influence Factors. Sustainability. 2019; 11(9):2463. https://doi.org/10.3390/su11092463
Chicago/Turabian StyleHoang, Phuc Hai, Shengchuan Zhao, and Siv Eng Houn. 2019. "Motorcycle Drivers’ Parking Lot Choice Behaviors in Developing Countries: Analysis to Identify Influence Factors" Sustainability 11, no. 9: 2463. https://doi.org/10.3390/su11092463
Note that from the first issue of 2016, this journal uses article numbers instead of page numbers. See further details here.