Impact of the Body Mass Index on Affective Development in Physical Education
by
 , ,
, ,
Pedro Gil-Madrona
1,* ,
,
Javier Cejudo
2 ,
,
Jesús Manuel Martínez-González
3 and
Guillermo F. López-Sánchez
4,*
1
Faculty of Education of Albacete, University of Castilla-La Mancha, 02001 Albacete, Spain
2
Faculty of Education of Ciudad Real, University of Castilla-La Mancha, 13071 Ciudad Real, Spain
3
Faculty of Statistics, Complutense University of Madrid, 28040 Madrid, Spain
4
Faculty of Sport Sciences, University of Murcia, 30720 Murcia, Spain
*
Authors to whom correspondence should be addressed.
Sustainability 2019, 11(9), 2459; https://doi.org/10.3390/su11092459
Submission received: 10 March 2019
/
Revised: 19 April 2019
/
Accepted: 22 April 2019
/
Published: 26 April 2019
(This article belongs to the Special Issue Education for Sustainability in Physical Education)
Abstract
:The purpose of this study is to show the results and the transcendental conclusions about various kinds of emotions—positive or pleasant and negative or unpleasant—and their intensity as far as they are felt by students of the fifth and sixth grade of Primary Education in the area of Physical Education, comparing the emotional states according to gender and their body-mass index (BMI). The implication is to provide a new, emotional approach, which up to now has been insufficiently dealt with in educational research. The sample was composed of 786 students of the fifth and sixth grade of Primary Education from five localities in the province of Albacete (Spain). In order to assess affectivity, the version of PANAS (Positive and Negative Affect Schedule; Watson, Clark and Tellegen, 1988) was used, validated in Spanish by Sandín (2003) for use with children and teenagers (PANASN). The results showed that the scores were higher in the positive emotions than in the negative ones. In addition, the results showed significant differences among boys and girls in the Physical Education class, especially in the variables which contribute the most to the factor of positive emotions. In relation to the analysis about the differences according to the students’ BMI, it is noteworthy that in the dimension of positive emotions, all the highest average scorings are found in the students without obesity/overweight problems. With respect to the dimension of negative emotions, all the highest average scorings were found in the students with obesity/overweight problems. The results showed significant differences according to BMI among students with obesity/overweight problems and students without obesity/overweight problems in positive emotions. There were no significant differences in negative emotions. Boys as much as girls without obesity/overweight problems show more positive emotions than boys and girls with obesity/overweight problems. Intervention programmes are required, and they should include enjoyment as an essential condition for practicing sport, encouraging the development of positive affects, and diminishing the negative affects in boys and girls.
1. Introduction
One of the goals of Physical Education (PE) in school is to promote an active and healthy lifestyle and encourage or create habits of adhesion to physical activity. The World Health Organization recommends that children and adolescents accumulate at least 60 min of moderate- to vigorous-intensity physical activity daily. In light of the Social Cognitive Theory, the environmental factors, such as the classroom context, the motivation, or the experience of the teacher, have a direct or indirect influence on the levels of physical activity during the PE lessons, as well as on the level of interest of the students and their enjoyment [1]. Many studies have noted the influence that this subject can have on promoting healthy lifestyles [2,3], something very important considering that overweight and obesity have been declared as a global epidemic [4] especially in developed countries [5], affecting not only the adult population but also children and teenagers [6,7,8]. We must act now, and be more active, before we lose this generation in the fight against obesity and against the debilitating illnesses that are derived from it [9]. One efficient way to act is promoting physical activity habits in PE, as there is a positive correlation between exercising habits in children and teenagers and an active life in adulthood [10,11,12].
Besides the physical benefits of physical activity in healthy childhood growth, there are also positive socio-emotional and affective benefits in childhood and youth which produce an adherence to the practice of physical activity, which leads to creating active lifestyles in both youth and adulthood [13]. Motivation, understood as the “intensity of behaviour, persistence, the choice of possibilities of action and endurance” [14], is a crucial factor which stands behind participation in physical and sport activities [15,16]. In the same way, enjoyment is a key factor to ensure an active participation in PE [17,18]. Currently, some social movements advocate that socio-emotional, affective education and the development of emotional intelligence are vital for social adaptation and the psychological and physical wellbeing of people [19,20,21], and school does not escape these tenets. An affective regulation can only be made within the context of a relationship with another human being and the child needs to learn how to regulate their emotions [20,22]. Moreover, these human relationships are a constant within PE lessons. Previous studies carried out in relation to PE emphasize the interrelationships between the physical and mental parts of human beings [23] and the influence of bodily expression in relation to emotional experience [24].
Enthusiasm, emotion and cognition have been connected to the perception of competence and the attitude towards participation in physical activity programmes [25]. It appears to be that negative experiences during physical activity make people feel incompetent in this area [26]. Espada and Calero [27] state that the PE subject has a direct relation with elements that make up emotional intelligence, since empathy, the control of emotions, self-motivation and social abilities are elements that exist within the practice of sports. Physical activity can promote prosocial conducts, and emotions play an important role in this promotion [28,29]. While cognition and endurance are factors which have been widely studied, the affective domain has not yet produced as many contributions. In this way, some authors highlight that PE is a subject where students have the opportunity to strongly exhibit a rich and varied emotional range [30].
The different domains of motor action may generate circumstances linked to the intense activation of positive emotions, but certain activities may produce very few negative emotions [31]. This is of great interest for the field of PE, since one of the reasons explaining the inactivity in the adult population is the negative evaluation that they have of school experiences. Students who participate in physical and sport activities at a school age, along with those who do physical exercise on a regular basis, show a more positive attitude towards PE [32]. Physical aspects, such as self-esteem, motivation and a correct emotional attitude promote the development and consolidation of conducts linked to physical activity and a healthy lifestyle. Certainly, each game of sports has an authentic laboratory of emotional reactions, which makes each student live a PE session in a different way [33,34]. Very few authors have studied emotions in the field of PE [35]. These studies include the perspectives centred on the socioeconomic environment of families, on performance and those that target natural factors in a more objective way, such as the prevention of risky behaviours [36], subjective well-being [37], personal and occupational well-being [38], sturdiness of family relations [39], adjustment of students to the school environment, social competence [40], mental health [41] and happiness [42], among other aspects.
It is necessary to study the pedagogical work of PE when it comes to the emotions it produces in students, taking into consideration the characteristics of the students that are learning, as well as identifying if the students are motivated [43]. PE is a favourable space for fostering emotional education, and sports offer many possibilities of action that have a great power to generate emotions [44]. Moreover, there is a positive relationship between the practice of physical activity in a child and positive emotional effects, such as an improvement in self-esteem, a reduction in anxiety and stress [45]. For this, we intend to reinforce the positive attributes of the child and diminish the negative ones, knowing first the emotions that are experienced by the children, taking into account their BMI (Body Mass Index). Although some previous studies analyzed emotions in PE [46], no studies have been found in previous research that connect emotions, PE and BMI. This would allow an explanation of the anxiety, frustration or insecurities that students perceive in certain moments and if it is related or not to their BMI, and this knowledge would facilitate teachers’ development of measures oriented towards an increased interest of students towards PE lessons [47]. This will allow the PE teacher to plan activities that will lead to an emotional education, trying to respond to the current needs which traditionally had not been attended to in different academic subjects [48]. These activities will allow to work and act on certain emotional scenarios of the student such as: not ignoring their feelings and emotions, maintaining constant enthusiasm during instruction, adjusting interaction to the task, states of unhappiness and sadness; situations of lack of interest, discouragement, boredom and, in general, lack of stimuli; situations of anguish, fear, stress; as well as insecurity or confusion [49,50].
Before initiating programmes to develop socioemotional competencies in our PE students, we must explore their emotions during the development of this subject, asking questions such as: What are the emotional states that students have and experience during the course of the PE lessons and what is the existing relationship with their BMI in PE? The abundance of failures in learning in different ages and school years, can be explained for the most part, by the emergence of negative attitudes, whose detection would be the first step towards counteracting their negative influence effectively [51]. Therefore, this study aims to identify and analyse the intensity and type of affects—positive or pleasant or negative and unpleasant—experienced by boys and girls during the PE class throughout the development and teaching of the subject. Also, it aims to analyse the relationships, similarities or differences that may exist between them in relation to their BMI.
2. Methods
2.1. Participants
For this study, the type of sampling that was used was non-probabilistic of an incidental or accessible type. The total sample was made up of 786 students in 5th and 6th grade elementary school from five localities. In terms of gender distribution, 406 (51.65%) were boys and 380 (48.35%) were girls. By age, 18.2% were 10 years old; 45.1% were 11 years old; 33.3% were 12 years old and only 3.2% reached the age of 13.
2.2. Evaluation Instruments
To evaluate affectivity, the version of PANAS (Positive and Negative Affect Schedule) [52] validated in Spanish by Sandín [53] for use with children and adolescents (PANASN) was used. It is made up of 20 items and has a bidimensional structure: positive affect (PA) (e.g., “I show interest in people or things”) and negative affect (NA) (e.g., “I feel afraid”), with 10 items in each subscale. The questionnaire is filled out by the child/adolescent taking into consideration the way in which they feel or behave on a daily basis. In this study, the following value was included “indicate how you usually feel when finishing a Physical Education lesson…”.
The scale is made up of three alternative responses, described as “Never” (1), “Sometimes” (2), and “Most of the time” (3). The data on reliability and validity indicate that the test possesses acceptable properties, both when it comes to reliability (internal consistency) as well as convergent and divergent validity [53].
Height and bodily weight measurements were also taken, to calculate the Body Mass Index (BMI).
2.3. Design and Procedure
First, contact was made with the directors of the educational centres, explaining the project and asking for their collaboration. An interview was made with those who chose to collaborate to present the project and give the informed consent forms for the parents of the participating students. After the retrieval of the consent forms from the parents the application of the evaluation instrument was carried out after finishing the Physical Education lesson, along with the measurements of height and weight of the students. The students were guaranteed complete anonymity and confidentiality of the data obtained in the present study. The students were clearly indicated that it refers to affects and emotions felt in the Physical Education class.
The anthropometric evaluation was carried out by two expert researchers with ISAK level I formation. During the measurement, the participants were barefoot. Their height measurements were taken with a portable measuring rod to scale (range of 0.1 cm) Seca 222 model (Seca, Germany), and weight was measured with a Tanita BF 522 scale (Tanita Corporation of America Inc., IL, USA). With the use of these measurements we calculated the BMI, for the age of the participant subjected to study, using the formula weight (kg)/height (m2).
2.4. Data Analysis
The first step was to analyse the reliability (internal consistency) of each one of the dimensions, AP and AN, through the calculation of the Cronbach alpha (α) and the McDonald Omega (Ω) coefficient. Moreover, a descriptive study was carried out on the responses given by the students. Subsequently, the correlations were analysed, through the coefficient of correlation by Pearson through the corresponding scores of the dimensions PA and NA. The differences were also studied through a variance analysis (ANOVA) in terms of the gender of the students in relation to the AP and AN. In the same way, the possible existing differences were studied in function of the BMI of the students through ANOVA. In this sense, the criteria by the WHO [54] was implemented. Hence, the first group was made up of those students that had a normal weight and was defined as the group of students without problems with obesity/overweight whereas the second group was made up of students with excess weight, overweight and obesity and was defined as the group with problems of obesity/overweight. Finally, the existing differences between both groups was analysed using ANOVA in function of the BMI of the students of both genders. In all cases, the size of the effect of these differences was calculated through Cohen’s statistical d.
3. Results
Means, standard deviations, Cronbach’s alpha coefficients, McDonald’s omega coefficients and the correlations for the PA and NA dimensions are presented in Table 1. The analysis of the mean scores show that the items scores obtained can be placed between the following values (2.63−1.38). As can be observed, the mean score is higher in the PA dimension than in the NA dimension.
The reliability coefficients (internal consistency) of Cronbach are acceptable, higher than 0.70. In the same way, the reliability coefficients of McDonald are adequate. On the other hand, the coefficient correlation between PA and NA was small and in the expected direction (r = 0.08; p = 0.05) which provides more empirical evidence to the bifactorial structure of the instrument and to the independence of the two dimensions (Table 1).
3.1. Differences in the Means in Function of the Gender of the Students
To explore the possible differences in the means of the BMI in terms of the gender of the students, two subgroups were created to be compared through variance analysis (ANOVA) (see Table 2): subsample of boys (N = 406) and subsample of girls (N = 380).
It is necessary to indicate that the scores of PA (M = 24.30 SD = 3.07) and NA (M = 17.01 SD = 3.17) of boys are in the same direction as those obtained by the author [53]. Likewise, in girls the results are similar to those found by the author [53]. In relation to PA (M = 24.30 SD = 3.07) and NA (M = 17.01 SD = 3.17).
In this sense, in terms of the AP dimension, the highest mean scores in connection to the girls were: (a) energy; (b) disposition; (c) inspiration; (d) decision; and (e) activity. While the highest mean scores in girls in relation to the boys were: (a) interest; (b) cheer; (c) enthusiasm; and (d) attention. On the other hand, in terms of the NA dimension, the highest mean scores for the boys in relation to the girls were: (a) guilt; and (b) anger. While the highest mean scores in the girls in relation the boys were: (a) tension; (b) displeasure; (c) fright; (d) irritation; (e) embarrassment; (f) nerves; (g) unrest; and (h) fear.
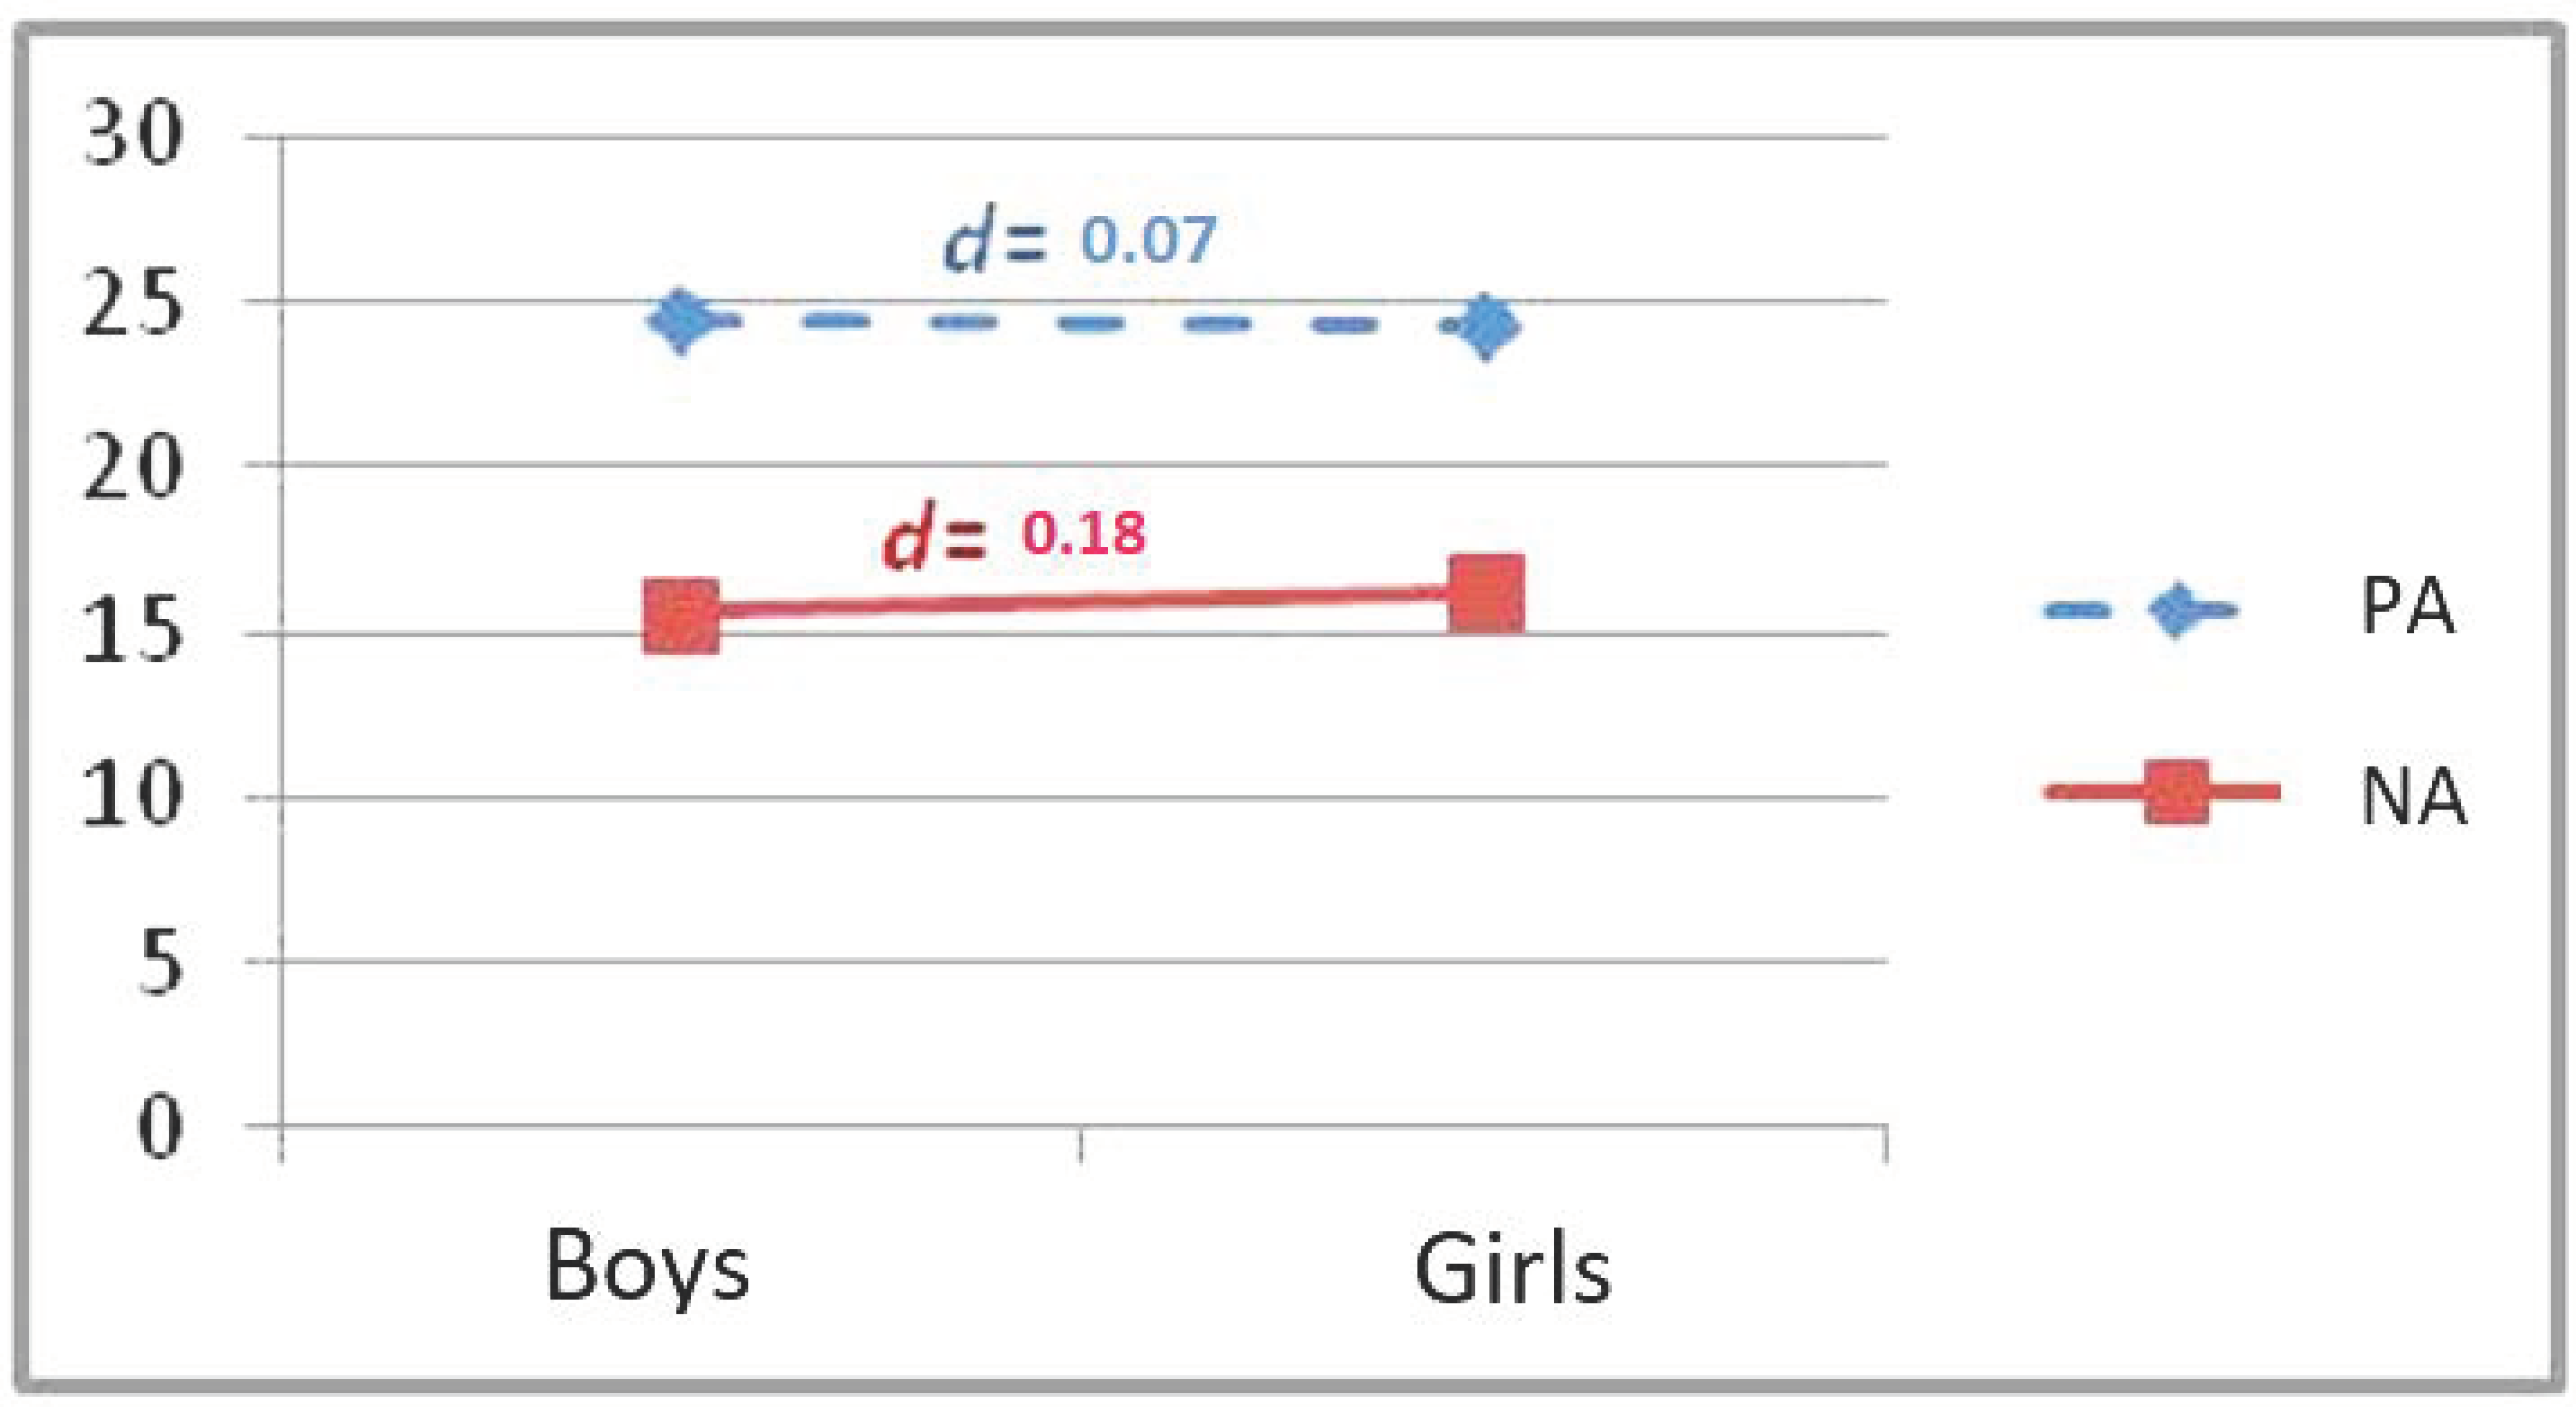
With respect to the PA variables there were significant differences in terms of gender in the variables, energy and activity, the boys having the highest scores. In order to value the extent of these differences, the size of the effect [55] was calculated observing a small portion of the effect, for both energy (d = 0.18) and activity (d = 0.22).
When it comes to the NA variable there were significant differences in terms of gender in the variables: (a) global score of NA; (b) tension; (c) fright; (d) embarrassment; and lastly (e) unrest. The girls held higher scores in this. A small size of the effect is observed in all the NA variables: global score of NA (d = 0.18), tension (d = 0.25), fright (d = 0.18), embarrassment (d = 0.22) and unrest (d = 0.18). See Figure 1 for a graphical representation of the results. (Figure 1).
3.2. Difference of Means in Terms of the BMI of the Students
In order to explore the possible mean differences in terms of the BMI of the students, two subgroups were created for its comparison through variance analysis (ANOVA) (see Table 3): subsample of students without problems of obesity/overweight (N = 233) and subsample of students with problems of obesity/overweight (N = 106). (Table 3).
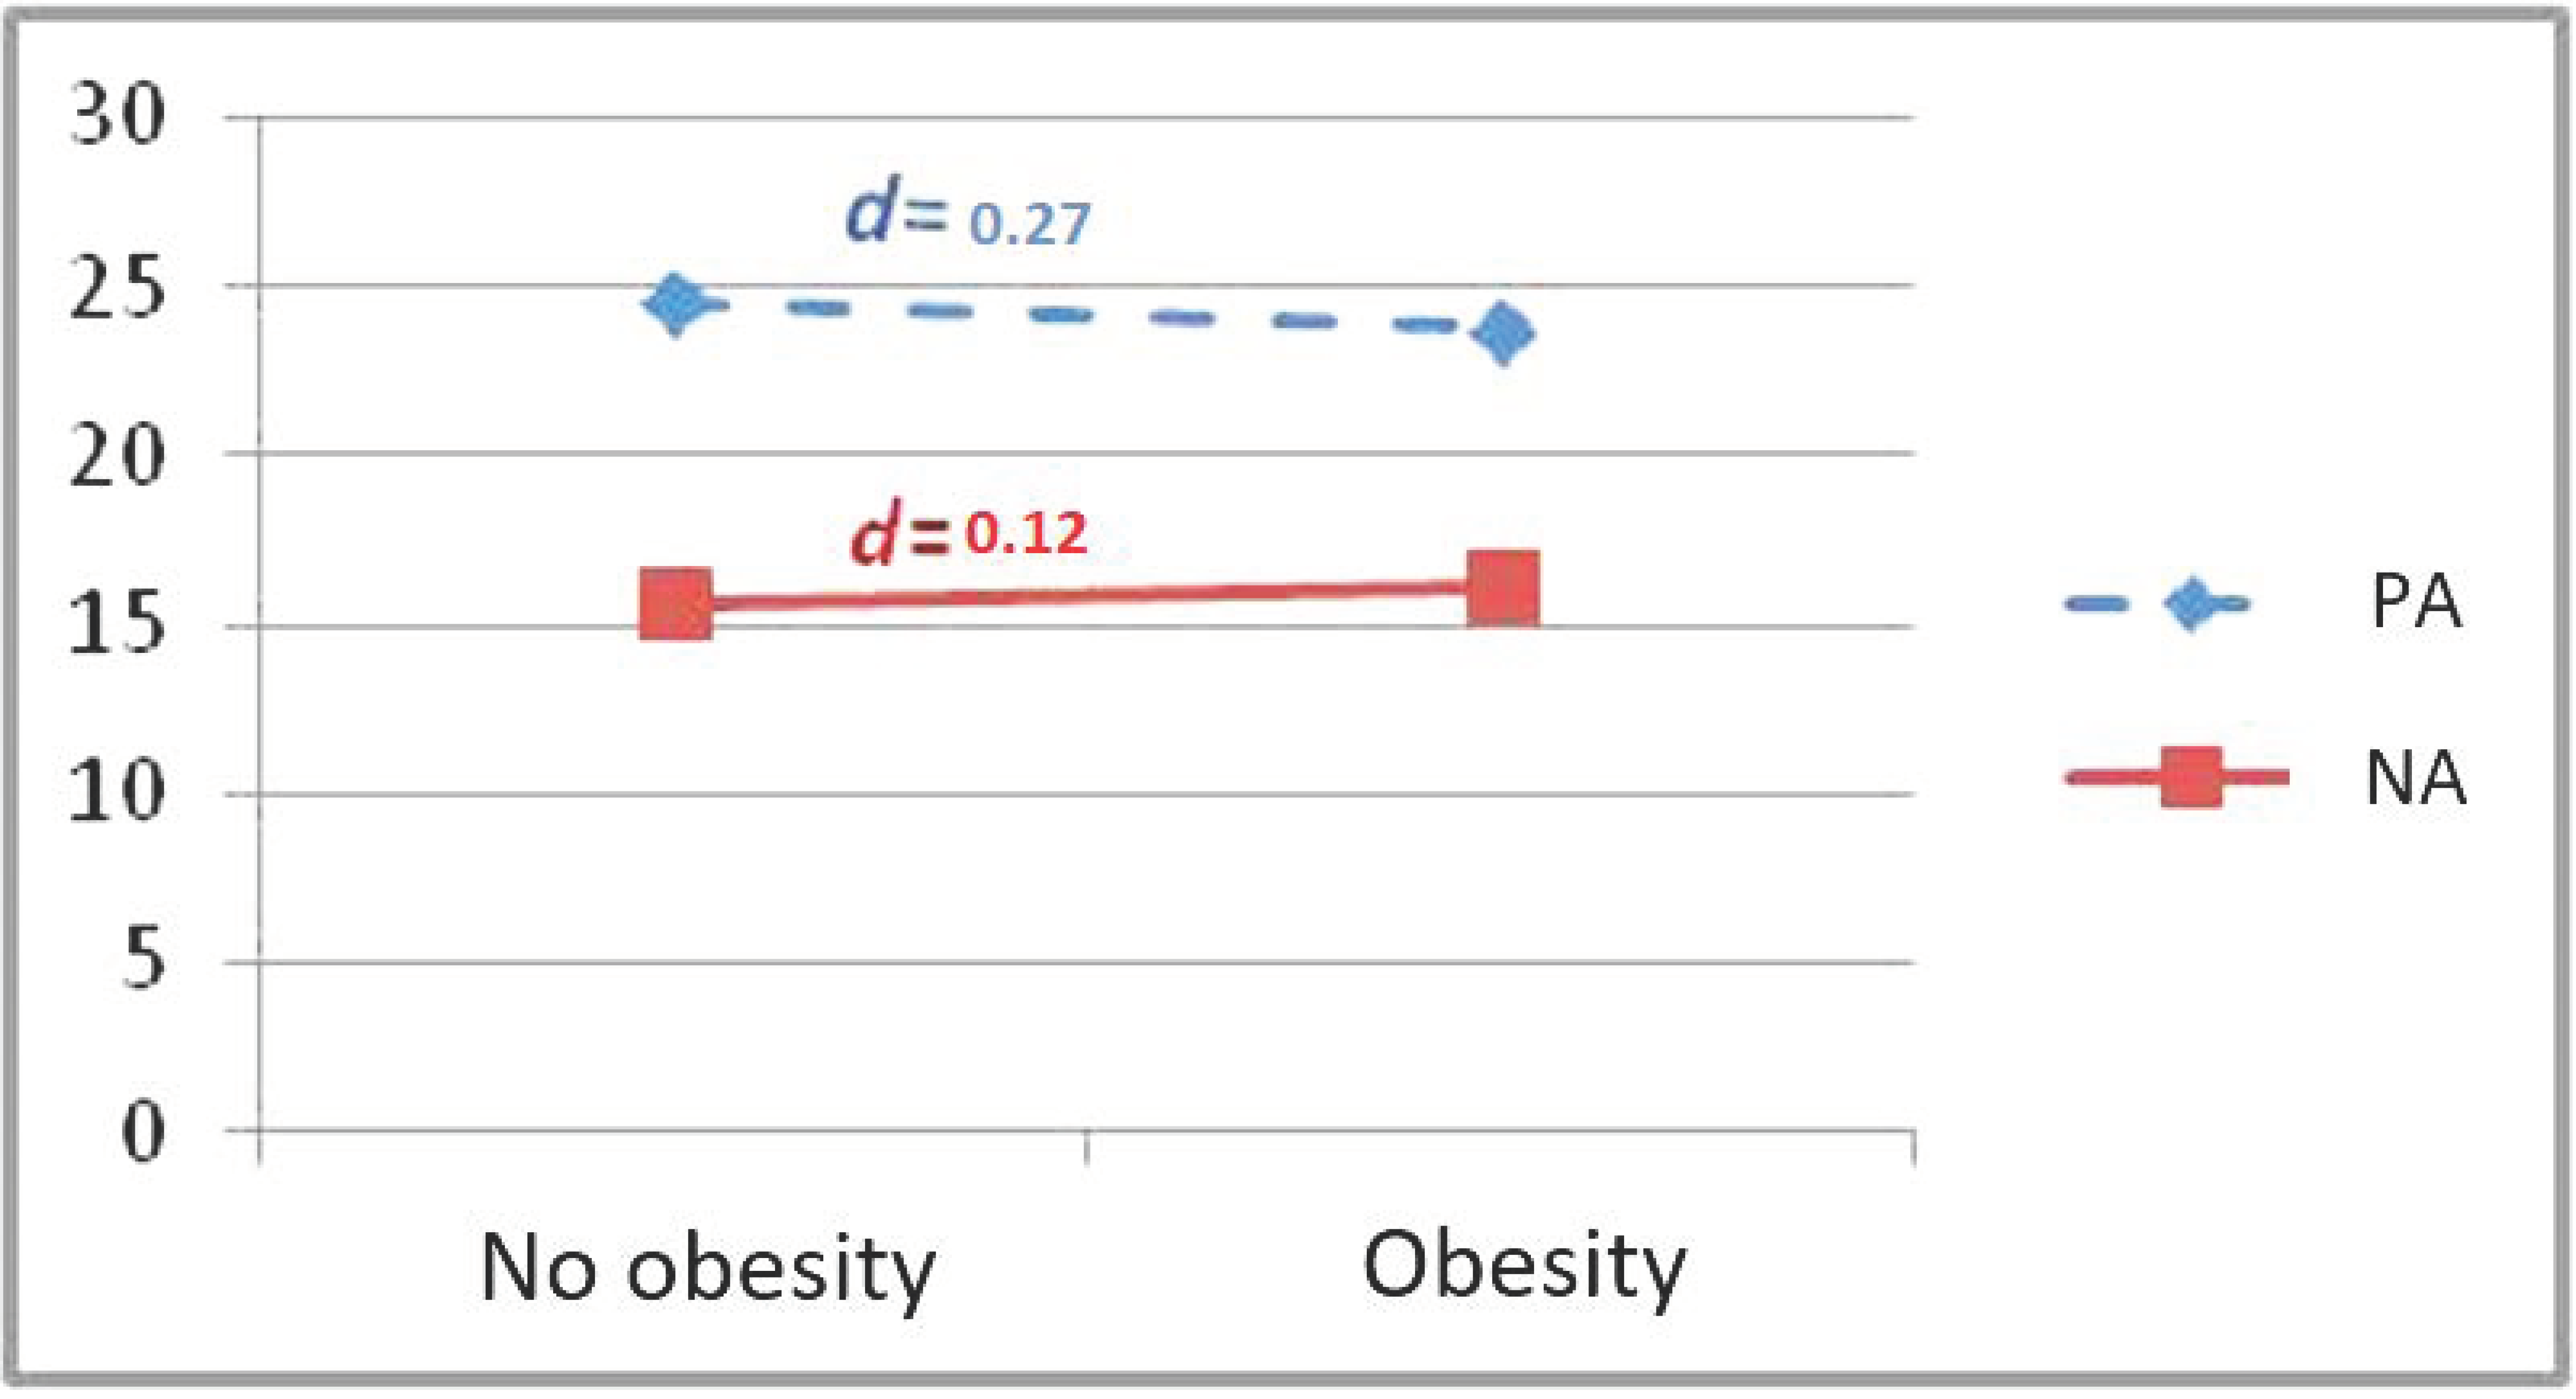
In this sense, in terms of the PA dimension all the highest mean scores are found in the students without problems of obesity/overweight. On the other hand, in terms of the NA dimension all the highest mean scores are found in the students with problems of obesity/overweight.
With regard to the PA variables, significant differences were found in terms of the BMI in the variables: global score of PA, energy and activity in favour of the students without obesity/overweight problems. To evaluate the magnitude of these differences, the size of the effect was calculated observing a small size of the effect, in both the global score of PA (d = 0.27) and the activity (d = 0.20) and a moderate size of the effect for energy (d = 0.45).
3.3. Differences in the Means in Terms of the BMI of the Subgroup “Boys”
To explore the possible differences in the means in terms of the BMI of the boys’ subgroup, two subgroups were created to be compared through variance analysis (ANOVA): subsample of boys without obesity/overweight problems (N = 118) and subsample of boys with obesity/overweight problems (N = 73). In terms of the PA dimension all the highest mean scores were found in the boys without obesity/overweight problems, with the exception of enthusiasm and inspiration. On the other hand, in terms of the NA dimension all the highest mean scores were found in the boys with obesity/overweight problems.
With regard to the PA variables there were significant differences in terms of the BMI in these variables, energy (F = −3,283; p = 0.001), disposition (F = −2,963; p = 0.003), and activity (F = −2,913; p = 0.004). In this sense, the scores of the boys without problems of overweight/obesity are greater than the scores of the boys with problems of obesity/overweight. In order to evaluate the magnitude of these differences the size of the effect was calculated observing a moderate size of the effect: energy (d = 0.46), disposition (d = 0.47) and activity (d = 0.42).
In terms of the NA variable, significant differences were found in function to the BMI in boys in the variables: (a) global score of NA (F = −2,058; p = 0.041); and (b) guilt (F = −2,254; p = 0.024). Finding a higher score in the boys with obesity/overweight problems. A moderate size of the effect is observed in all the variables of NA: global score of NA (d = 0.33) and guilt (d = 0.34).
3.4. Differences in the Means in Terms of the BMI of the Subgroup “Girls”
To explore the possible differences in the means of the BMI of the girls’ subgroup, two subgroups were created to compare through variance analysis (ANOVA): subgroup of girls without obesity/overweight problems (N = 115) and subgroup of girls with obesity/overweight problems (N = 33).
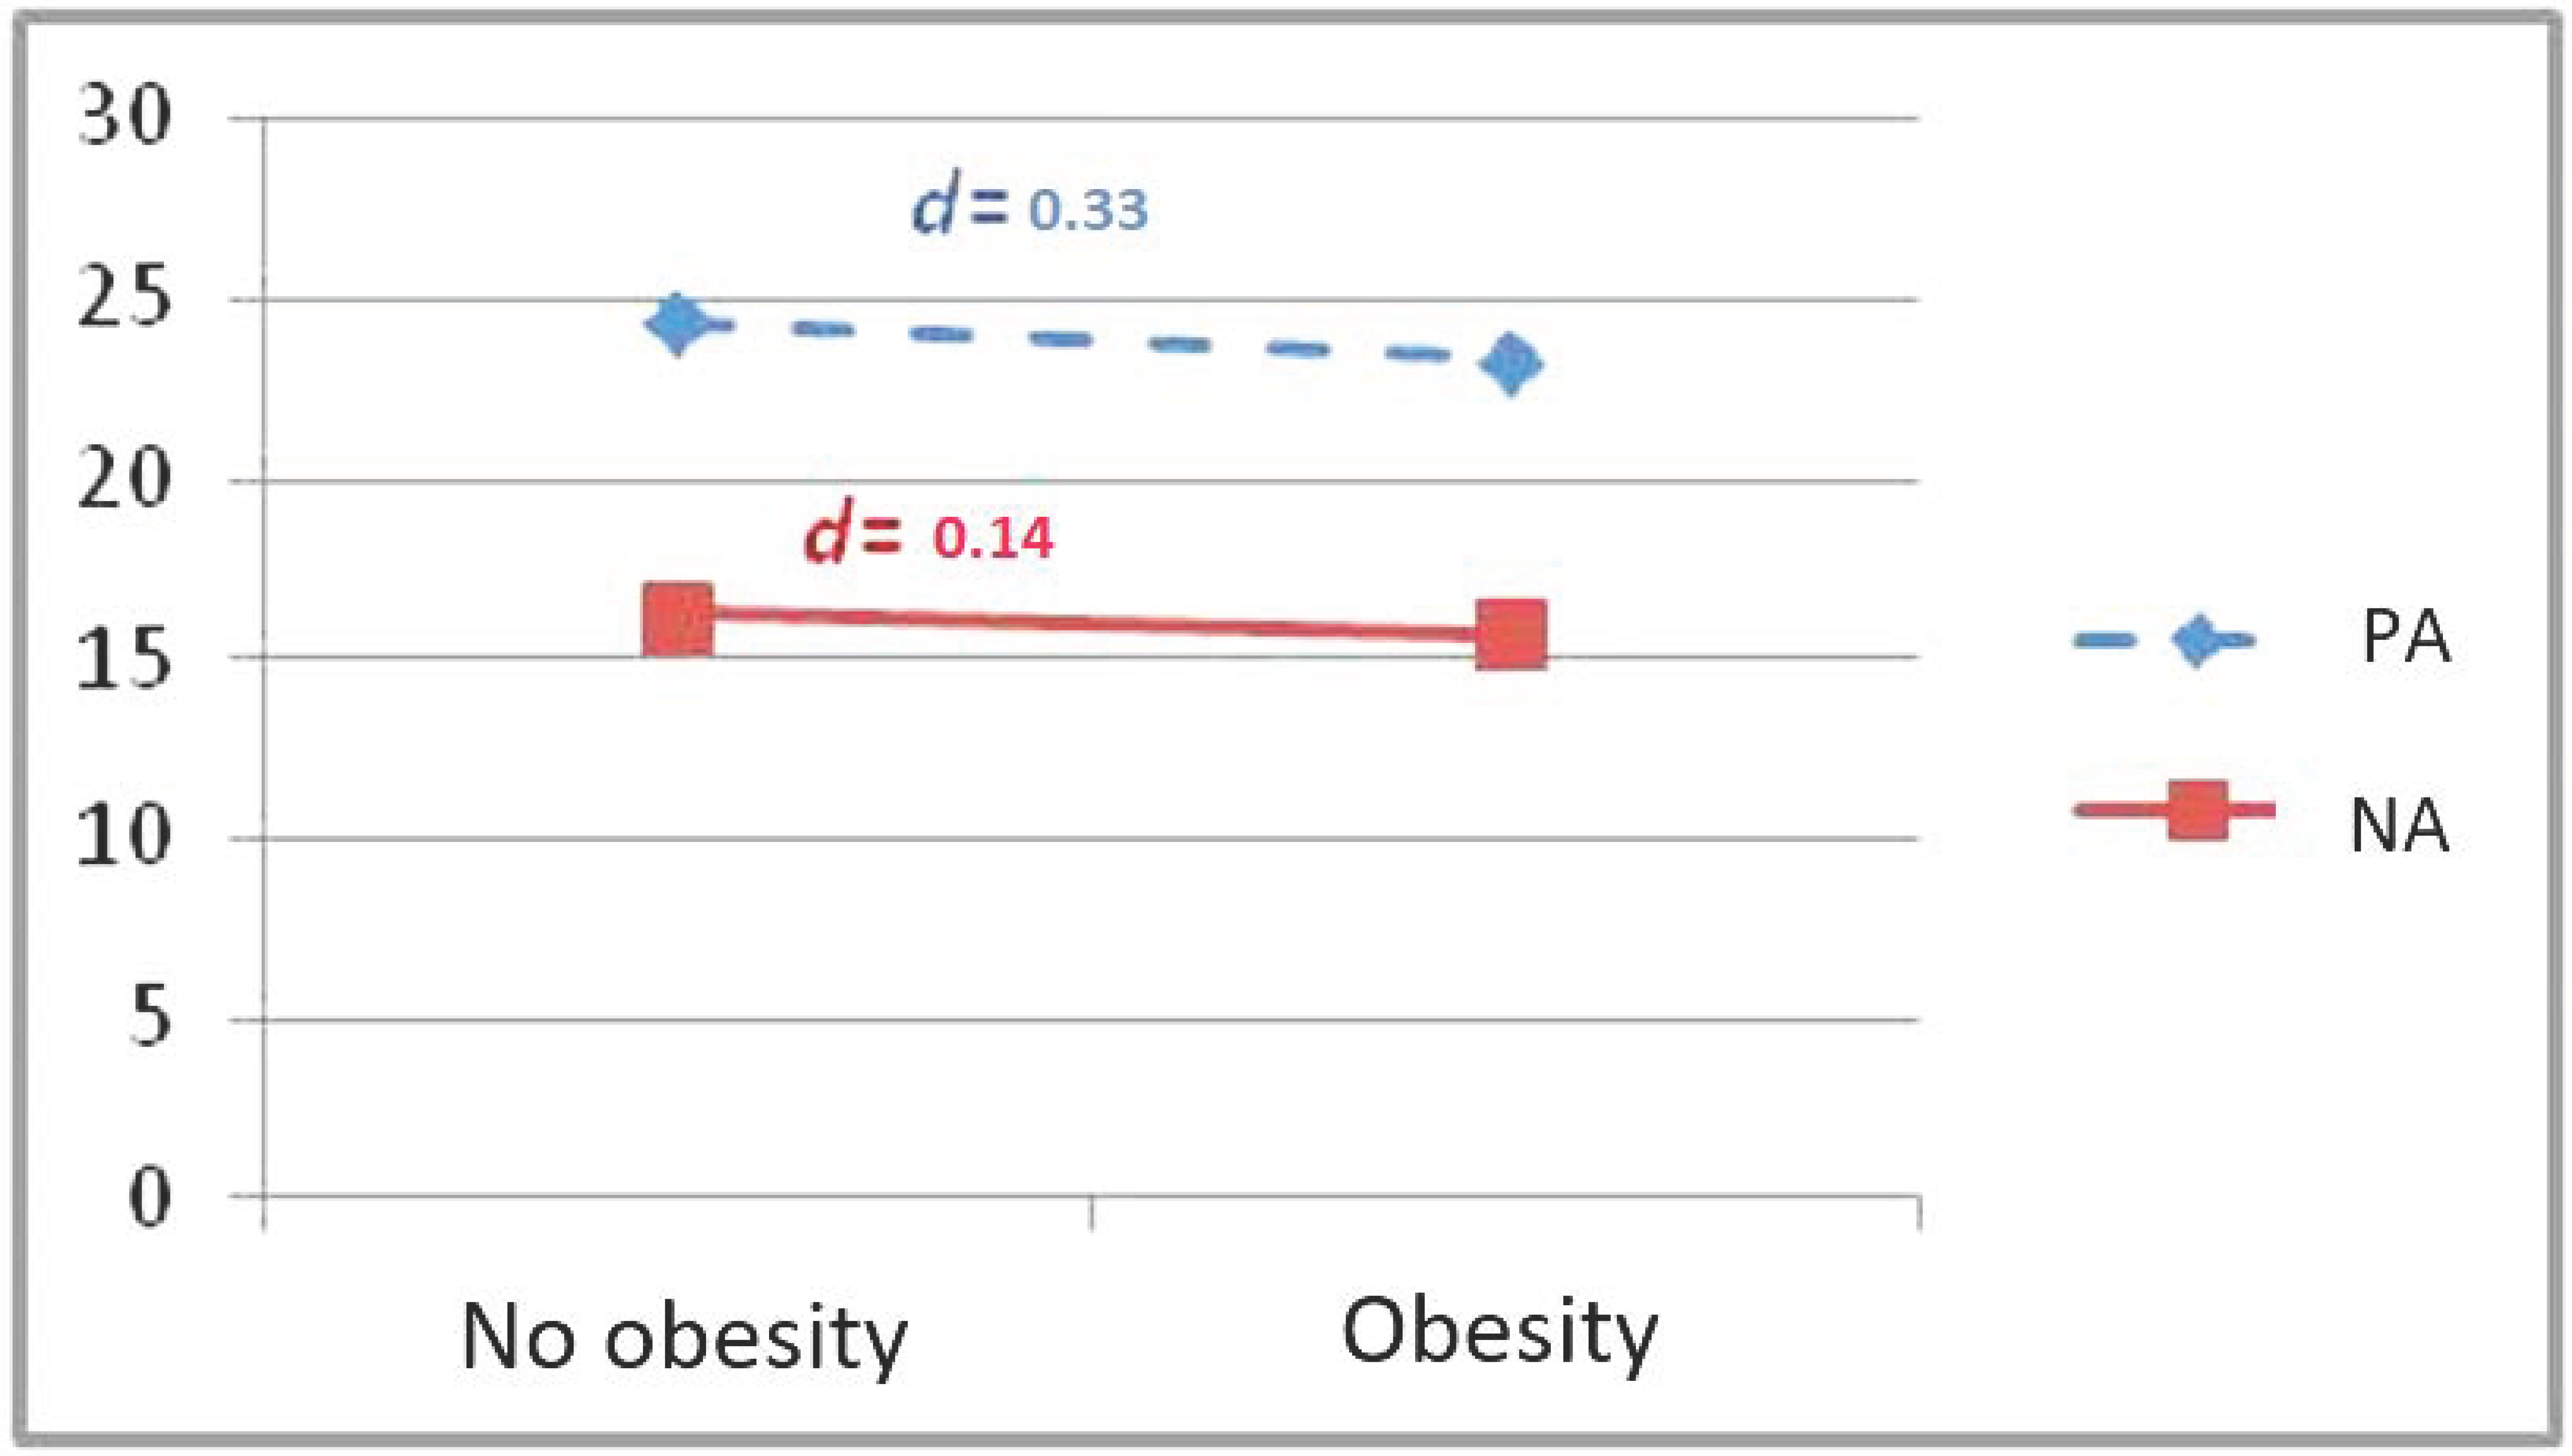
In this sense, in terms of the PA dimension all the highest mean scores were found in the girls without obesity/overweight problems, with the exception of enthusiasm and disposition. In the same way, in terms of the NA dimension all the highest mean scores were found in the girls without obesity/overweight problems, with the exception of displeasure and irritation.
With regard to the PA variables there were significant differences in terms of the BMI in girls in the variables, cheer (F = −2,157; p = 0.031), and energy (F = −3,078; p = 0.002). In this sense, the scores of the girls without obesity/overweight problems were higher than the scores of the girls with obesity/overweight problems. In order to evaluate the magnitude of these differences the size of the effect was calculated observing a moderate effect size: cheer (d = 0.45) and energy (d = 0.65).
Concerning the NA variable there were no significant differences in terms of the BMI of girls in any of the variables subjected to study (Figure 3).
4. Discussion
In the first place, the results verify that the scores are higher in PA than in NA. This pattern can be observed in previous findings with adult samples [56] and children and teenager samples [53,57]. Although the results show a slightly higher score in PA and a lower score in NA than those obtained by Sandín [53]. In this sense, the Physical Education classroom may offer the students, in the school environment, the opportunity to show very varied emotions with a pattern that is characterised by diminishing NA and increasing PA [30]. On the other hand, the correlations between the PA and NA dimensions were very low and the expected direction (r = −0.08; p = 0.05) corroborates that the PA and NA have a tendency to slightly correlate among themselves in a negative way, confirming the bidimensionality of PANAN.
Secondly, the results show significant differences between boys and girls in PA in the variables energy and activity. In this sense, the boys showed more PA than the girls in the Physical Education lesson, especially in the variables that contribute the most to the PA factor and make up the true indicators of PA: energy and activity [53,56]. In the same way, the results show significant differences between boys and girls in NA in the variables: global score of NA, tension, fright, embarrassment and unrest. Therefore, girls show more NA than boys in the Physical Education classroom. Our results replicate the connection between self-reporting measures of negative emotionality and female gender [58,59]. Thus, these results may offer information to teachers for the design and development of intervention programmes in the Physical Education classroom which are adequate in terms of the emotional characteristics of the students with the goal of diminishing negative emotions and increasing positive ones taking into consideration that enjoyment is an indispensable condition for playing sports in the future [15,16], and, moreover, as has been highlighted previously the positive affects of physical activity may consolidate conducts linked to a healthy lifestyle [32].
In third place, in connection to the analysis on the differences in function to the BMI of the students, it is noteworthy that in the PA dimension all the highest mean scores are found in the students without problems of obesity/overweight. In the same way, in terms of the NA dimension all the highest mean scores are found in the students with obesity/overweight problems. In this sense, the results reveal significant different in terms of the BMI among students with problems of obesity/overweight and students without problems of obesity/overweight in PA in the variables: global score of PA, energy and activity. On the other hand, there are no significant differences in NA. A possible explanation for these results may be related to the impact obesity has on the negative emotional states, such as, high levels of anxiety, depression, lack of satisfaction in body image and low self-concept [60,61]. In fact, Moreno-Esteban and Andía-Melero [62] point out that the relationship between excess body weight and psychoemotional discomfort conditions the level of satisfaction in life, since the social pressure to be thin affects more and more significantly people with obesity.
Lastly, it is notable that in both the boys and girls without obesity/overweight problems showed more positive emotions than the boys and girls with obesity/overweight problems, which goes along the lines of the previous global results. Nonetheless, in terms of negative emotions, there is a different pattern between boys and girls. Boys with obesity/overweight problems have significantly higher scores in NA than boys without obesity/overweight problems, and thus, the level of discomfort is greater in the Physical Education classes, whereas this response pattern is not found in the girls. These results can probably be explained with the influence of gender stereotypes in the Physical Education classroom. In this sense, boys, in comparison to girls, give more importance to certain competitive activities carried out in the Physical Education classroom and moreover, perceive that their success in these activities influences their social and educational status [63]. From these perspectives, it is feasible to think that the Physical Education classroom may be an adequate setting to encourage non-sexist attitudes and which will foster coeducation.
Despite these being useful in the teaching of Physical Education, findings should be interpreted in light of several limitations. The first one refers to the non-random character of the sample, which limits its representativeness and, thus, we must be cautious when it comes to generalizing the results. The second one refers to the sample belonging exclusively to an autonomous community, thus we do not know if a different sociocultural framework may modify the results. To rectify these limitations, the research team has in mind the carrying out of an extension of this study with a sample in which practicing consultants will participate from various autonomous communities. In terms of future research, the exploration of other variables may be suggested, such as motivation or obtained academic performance.
5. Conclusions
In conclusion, these results provide information to teachers for the design and development of intervention programmes that meet the diversity of characteristics of the students. These didactic programmes and different educational actions of school centres should include enjoyment as an essential condition for practicing sport and should encourage the development of positive affects and diminish the negative affects in boys and girls, paying special attention to the influence of BMI. Ultimately, this study contributes in a real way to the main goal of Physical Education in its contribution towards the integral development of the personality of the students and to carry out an emotional physical education, as has been proposed by Miralles, Filella & Lavega [64].
Author Contributions
P.G.-M., J.C., J.M.M.-G. and G.F.L.-S. conceived and designed the study, analysed the data and wrote the paper.
Funding
This research received no external funding.
Conflicts of Interest
The authors declare no conflict of interest.
References
- Van Acker, R.; Carreiro da Costa, F.; De Bourdeaudhuij, I.; Cardon, G.; Haerens, L. Sex equity and physical activity levels in coeducational Physical Education: Exploring the potential of modified game forms. Phys. Educ. Sport Pedag. 2010, 15, 159–173. [Google Scholar] [CrossRef]
- Bailey, R. Physical Education and sports in schools: A review of benefits and outcomes. J. Sch. Health 2006, 76, 397–401. [Google Scholar] [CrossRef] [PubMed]
- Zach, S.; Zeev, A.; Dunsky, A.; Goldbourt, U.; Shimony, T.; Goldsmith, R.; Netz, R. Perceived body size versus healthy body size and physical activity among adolescents—Results of a national survey. Eur. J. Sport Sci. 2013, 13, 723–731. [Google Scholar] [CrossRef] [PubMed]
- Malik, V.S.; Willett, W.C.; Hu, F.B. Global obesity: Trends, risk factors and policy implications. Nat. Rev. Endocrinol. 2013, 9, 13–27. [Google Scholar] [CrossRef] [PubMed]
- Ogden, C.L.; Carroll, M.D.; Kit, B.K.; Flegal, K.M. Prevalence of obesity and trends in body mass index among US children and adolescents, 1999–2010. JAMA 2012, 307, 483–490. [Google Scholar] [CrossRef] [PubMed]
- ALADINO: A national study of prevalence of overweight and obesity in Spanish children. Available online: http://www.aesan.msc.es/AESAN/docs/docs/notas_prensa/ALADINO_presentacion.pdf (accessed on 20 December 2018).
- Sánchez, J.J.; Jiménez, J.J.; Fernández, F.; Sánchez, M.J. Prevalencia de obesidad infantil y juvenil en Spain en 2012. Rev. Esp. Cardiol. 2013, 66, 371–376. [Google Scholar] [CrossRef]
- Cárdenas-Cárdenas, L.M.; Burguete-García, A.I.; Estrada-Velasco, B.I.; López-Islas, C.; Peralta-Romero, J.; Cruz, M.; Galván-Portillo, M. Leisure-time physical activity and cardiometabolic risk among children and adolescents. J. Pediatr. 2015, 9, 136–142. [Google Scholar] [CrossRef] [PubMed]
- Perry, A. Presentación. In Desarrollo Curricular de la Educación Física en la Educación Infantil; Gil Madrona, P., Ed.; Pirámide: Madrid, Spain, 2013. [Google Scholar]
- Hausenblas, H.A.; Fallon, E.A. Exercise and body image: A meta-analysis. Psychol. Health 2006, 21, 33–47. [Google Scholar] [CrossRef]
- Biro, F.M.; Wien, M. Childhood obesity and adult morbidities. Am. J. Clin. Nutr. 2010, 91, 1499S–1505S. [Google Scholar] [CrossRef] [PubMed]
- Morano, M.; Colella, D.; Capranica, L. Body image, perceived and actual physical abilities in normal-weight and overweight boys involved in individual and team sports. J. Sports Sci. 2011, 29, 355–362. [Google Scholar] [CrossRef] [PubMed]
- Donnelly, J.E.; Blair, S.N.; Jakicic, J.M.; Manor, M.M.; Rankin, J.W.; Smith, B.K. Appropriate physical activity intervention strategies for weight loss and prevention of weight regain for adults. Med. Sci. Sports Exerc. 2009, 41, 459–471. [Google Scholar] [CrossRef] [PubMed]
- Roberts, G. Motivation in sport and exercise: Conceptual constraints and convergence. In Motivation in Sport and Exercise; Roberts, G., Ed.; Human Kinetics: Champaign, IL, USA, 1992; pp. 3–29. [Google Scholar]
- González-Cutre, D.; Sicilia, A.; Moreno, J.A. Modelo cognitivo-social de la motivación de logro en educación física. Psicothema 2008, 20, 642–651. [Google Scholar]
- Yli-Piipari, S.; Watt, A.; Jaakkola, T.; Liukkonen, J.; Nurmi, J.E. Relationships between physical education students’ motivational profiles, enjoyment, state anxiety, and selfreported physical activity. J. Sports Sci. Med. 2009, 8, 327–336. [Google Scholar] [PubMed]
- Cox, A.E.; Smith, A.L.; Williams, L. Change in physical education motivation and physical activity behavior during middle school. J. Adolesc. Health 2008, 43, 506–513. [Google Scholar] [CrossRef] [PubMed]
- Cox, A.E.; Ullrich-French, S. The motivational relevance of peer and teacher relationship profiles in physical education. J. Sport Exerc. Psychol. 2010, 11, 337–344. [Google Scholar] [CrossRef]
- Bausela-Herreras, E. PISA 2012: Ansiedad y Bajo Rendimiento en Competencia Matemática. Rev. Iberoam. Diagn. Eval. Avalia. Psicol. 2018, 46, 161–173. [Google Scholar] [CrossRef]
- Bisquerra, R.; Pérez-González, J.C.; García, E. Inteligencia Emocional en Educación; Síntesis: Madrid, Spain, 2015. [Google Scholar]
- Durlak, J.A.; Weissberg, R.P.; Dymnicki, A.B.; Taylor, R.D.; Schellinger, K.B. The impact of enhancing students’ social and emotional learning: A meta-analysis of school-based universal interventions. Child Dev. 2011, 82, 405–432. [Google Scholar] [CrossRef]
- Manríquez-Betanzos, J.A.; Montero-López, A. Validación de la Escala de Emociones hacia el Cuidado del Agua. Rev. Iberoam. Diagn. Eval. Avalia. Psicol. 2018, 46, 147–159. [Google Scholar] [CrossRef]
- Ruiz, G.; Lorenzo, L.; García, A. El trabajo con la inteligencia emocional en las clases de Educación Física: Valoración de una experiencia piloto en Educación primaria. J. Sport Health Res. 2013, 5, 203–210. [Google Scholar]
- Motos, T. Cerebro emocional, educación emocional y expresión corporal. In Proceedings of the I Congreso Internacional de Expresión Corporal y Educación, Universidad Europea de Madrid, Spain, 2003; Amarú Ediciones: Salamanca, Spain, 2003. [Google Scholar]
- Hashim, H.; Grove, J.R.; Whipp, P. Validating the youth sport enjoyment construct in high school physical education. Res. Q. Exerc. Sport 2008, 79, 183–195. [Google Scholar] [CrossRef]
- Gutiérrez, M. Actividad física, estilos de vida y calidad de vida. Rev. Educ. 2000, 77, 5–14. [Google Scholar]
- Espada, M.; Calero, J.C. La inteligencia emocional en el área de Educación Física. La peonza. Rev. Educ. Fís. 2012, 7, 65–69. [Google Scholar]
- Lavega, P.; Filella, G.; Lagardera, F.; Mateu, M.; Ochoa, J. Juegos motores y emociones. Cult. Educ. 2013, 25, 347–360. [Google Scholar] [CrossRef]
- Lavega, P.; March, J.; Filella, G. Juegos deportivos y emociones. Propiedades psicométricas de la escala GES para ser aplicada en la Educación Física y el Deporte. Rev. Investíg. Educ. 2013, 31, 151–166. [Google Scholar]
- Durán, C.; Lavega, P.; Salas, C.; Tamarit, M.; Invernó, J. Educación física emocional en adolescentes. Identificación de variables predictivas de la vivencia emocional. Cult. Cien. Deporte 2015, 10, 5–18. [Google Scholar]
- Zamorano-García, M.; Gil-Madrona, P.; Prieto-Ayuso, A.; Zamorano-García, D. Generated emotions by various types of games in Physical Education. Rev. Int. Med. Cien. Activ. Fís. Deporte 2018, 18, 1–26. [Google Scholar]
- Pieron, M.; García Montes, M.E.; Ruiz, F. Algunos correlatos de la actividad físico-deportiva en una perspectiva de salud. Tándem 2007, 24, 9–24. [Google Scholar]
- Parlebas, P. Juegos, Deporte y Sociedad. Léxico de Praxiología Motriz; Paidotribo: Barcelona, Spain, 2001. [Google Scholar]
- Lagardera, F.; Lavega, P. Introducción a la Praxiología Motriz; Paidotribo: Barcelona, Spain, 2003. [Google Scholar]
- Mujica, F.N.; Orellana, N.C.; Concha, R.F. Emociones en la clase de Educación Física: Revisión narrativa (2010–2016). Ágora Educ. Fís. Deporte 2017, 19, 119–134. [Google Scholar] [CrossRef]
- Brackett, M.A.; Mayer, J.D. Convergent, discriminant, and incremental validity of competing measures of emotional intelligence. Pers. Soc. Psychol. Rev. 2003, 29, 1147–1158. [Google Scholar] [CrossRef]
- Bar-On, R. The Bar-On model of emotional-social intelligence (ESI). Psicothema 2006, 18, 13–25. [Google Scholar]
- Pena, M.; Extremera, N.; Rey, L. El papel de la inteligencia emocional en la resolución de problemas sociales en estudiantes adolescentes. Rev. Esp. Orient. Psicopedag. 2011, 22, 69–79. [Google Scholar]
- Chan, D.W. Emotional intelligence and components of burnout among Chinese secondary school teachers in Hong Kong. Teach. Teach. Educ. 2006, 22, 1042–1054. [Google Scholar] [CrossRef]
- Brasseur, S.; Georgoire, J. L’inteligence émotionelle-Trait chez les adolescents á haut potential: Spédifities et liens avec réussite scolaire et les competences socials. Enfance 2011, 62, 59–76. [Google Scholar]
- Bhullar, N.; Schutte, N.S.; Malouff, J.M. Associations of individualistic collectivistic orientations with emotional intelligence, mental health, and satisfaction with life: A tale of two countries. J. Individ. Differ. 2012, 10, 165–175. [Google Scholar]
- Bar-On, R. Emotional intelligence: An integral part of positive psychology. S. Afr. J. Psychol. 2010, 40, 54–62. [Google Scholar] [CrossRef]
- McCaughtry, N. The emotional dimensions of a teacher’s pedagogical content knowledge: Influences on content, curriculum, and pedagogy. J. Teach. Phys. Educ. 2004, 23, 30–47. [Google Scholar] [CrossRef]
- Bisquerra, R. Educación Física, competencias básicas y educación emocional. EmásF 2011, 11, 4–6. [Google Scholar]
- Strong, W.B.; Malina, R.M.; Blimkie, C.J.; Daniels, S.R.; Dishman, R.K.; Gutin, B.; Hergenroeder, A.C.; Must, A.; Nixon, P.A.; Pivarnik, J.M.; et al. Evidence based physical activity for school-age youth. J. Pediatr. 2005, 146, 732–737. [Google Scholar] [CrossRef]
- Gil-Madrona, P.; Martínez-López, M. Emociones percibidas, por alumnos y maestros, en Educación Física en 6 curso de primaria. Educ. XX1 2016, 19, 179–204. [Google Scholar] [CrossRef]
- Scrabis-Fletcher, K.; Silverman, S. Perception of Competence in Middle School Physical Education: Instrument Development and Validation. Res. Q. Exerc. Sport 2010, 81, 53–61. [Google Scholar] [CrossRef]
- Bisquerra, R. Educación Emocional. Programa para Educación Primaria (6–12 años); Wolters Kluwer: Barcelona, Spain, 2003. [Google Scholar]
- González, C.; Lleixa, A. Didáctica de la Educación Física; Grao: Barcelona, Spain, 2010. [Google Scholar]
- Pellicer, I. Educación Física Emocional. De la Teoría a la Práctica; Inde: Barcelona, Spain, 2011. [Google Scholar]
- Marchesi, A.; Hernández, C. El Fracaso Escolar. Perspectiva Internacional; Alianza: Madrid, Spain, 2003. [Google Scholar]
- Watson, D.; Clark, L.A.; Tellegen, A. Development and validation of brief measures of positive and negative affect: The PANAS scales. J. Pers. Soc. Psychol. 1998, 54, 1063–1070. [Google Scholar] [CrossRef]
- Sandín, B. Escalas PANAS de afecto positivo y negativo para niños y adolescentes (PANASN). Rev. Psicopatol. Psicol. Clín. 2003, 8, 173–182. [Google Scholar]
- WHO (World Health Organization). Global Recommendations on Physical Activity for Health; WHO: Geneva, Switzerland, 2010. [Google Scholar]
- Cohen, J. The earth is round (p < 0.05). Am. Psychol. 1994, 49, 997–1003. [Google Scholar]
- Sandín, B.; Chorot, R.; Lostao, L.; Joiner, T.E.; Santed, M.A.; Valiente, R.M. Escalas PANAS de afecto positivo y negativo: Validación factorial y convergencia transcultural. Psicothema 1999, 2, 37–51. [Google Scholar]
- Barrón-Sánchez, M.C.; Molero, D. Estudio sobre inteligencia emocional y afectos en escolares de educación primaria. Rev. Electr. Investig. Docen. 2014, 8, 7–18. [Google Scholar]
- Etxebarría, I.; Aritzeta, A.; Barberá, E.; Chóliz, M.; Jiménez, M.P.; Martínez-Sánchez, F.; Mateos, P.; Páez, D. Emoción y Motivación. Contribuciones Actuals; AME: San Sebastián, Spain, 2008. [Google Scholar]
- Gil-Madrona, P.; Cachón-Zagalaz, J.; Díaz-Suarez, A.; Valdivia-Moral, P.; Zagalaz-Sánchez, M.L. Las niñas también quieren jugar: La participación conjunta de niños y niñas en actividades físicas no organizadas en el contexto escolar. Movimento 2014, 20, 103–124. [Google Scholar] [CrossRef]
- Ross, C.E. Overweight and depression. J. Health Soc. Behav. 1994, 35, 63–79. [Google Scholar] [CrossRef]
- Friedman, M.A.; Brownell, K.D. Psychological correlates of obesity: Moving to the next research generation. Psychol. Bull. 1995, 117, 3–20. [Google Scholar] [CrossRef]
- Moreno-Esteban, B.; Andía-Melero, V.M. Tratamiento de la obesidad. Rev. Siete Días Méd. 2009, 778, 34–38. [Google Scholar]
- Vera, J.A.; Moreno, R.; Moreno, J.A. Relación entre la cesión de responsabilidad y la percepción de igualdad en la enseñanza de la educación física escolar. Cult. Cien. Deporte 2009, 6, 25–31. [Google Scholar]
- Miralles, R.; Filella, G.; Lavega, P. Educación física emocional a través del juego en educación primaria. Ayudando a los maestros a tomar decisiones. Retos 2017, 31, 88–93. [Google Scholar]
Figure 1.
Graphical representation of the differences in positive and negative affect in function of gender.
Figure 1.
Graphical representation of the differences in positive and negative affect in function of gender.

Figure 2.
Graphical representation of the differences in positive and negative affect in function of BMI.
Figure 2.
Graphical representation of the differences in positive and negative affect in function of BMI.

Figure 3.
Graphical representation of the differences in positive and negative affect in function of BMI in girls.
Figure 3.
Graphical representation of the differences in positive and negative affect in function of BMI in girls.


Table 1.
Matrix of correlations and descriptive statistics of the variables of positive and negative affect.
Table 1.
Matrix of correlations and descriptive statistics of the variables of positive and negative affect.
| Mean | SD | α | Ω | 1 | 2 | |
|---|---|---|---|---|---|---|
| Positive Affect | 24.43 | 3.15 | 0.70 | 0.78 | - | |
| Negative Affect | 15.96 | 3.79 | 0.79 | 0.81 | −0.080 | - |
Table 2.
Mean, standard deviation (SD), ANOVA, and size of effect of the difference in means (d) in function to the gender of the students.
Table 2.
Mean, standard deviation (SD), ANOVA, and size of effect of the difference in means (d) in function to the gender of the students.
| Boys | Girls | ||||||
|---|---|---|---|---|---|---|---|
| Variables | Mean | SD | Mean | SD | F | Sig | d |
| Positive Affect | 24.54 | 3.11 | 24.32 | 3.18 | −0.765 | 0.301 | 0.07 |
| Interest | 2.42 | 0.55 | 2.45 | 0.56 | −0.656 | 0.456 | 0.05 |
| Cheer | 2.43 | 0.63 | 2.48 | 0.61 | −0.879 | 0.234 | 0.08 |
| Energy | 2.68 | 0.55 | 2.58 | 0.60 | −1.923 | 0.002 | 0.18 |
| Enthusiasm | 2.29 | 0.62 | 2.37 | 0.65 | −1.009 | 0.072 | 0.13 |
| Pride | 2.53 | 0.57 | 2.53 | 0.60 | −0.010 | 0.998 | 0.00 |
| Disposition | 2.39 | 0.66 | 2.35 | 0.65 | −0.089 | 0.354 | 0.06 |
| Inspiration | 2.27 | 0.65 | 2.21 | 0.66 | −1.231 | 0.189 | 0.09 |
| Decision | 2.43 | 0.62 | 2.38 | 0.64 | −1.032 | 0.294 | 0.08 |
| Attention | 2.41 | 0.57 | 2.44 | 0.59 | −0.867 | 0.392 | 0.05 |
| Activity | 2.67 | 0.57 | 2.54 | 0.61 | −2.453 | 0.003 | 0.22 |
| Negative Affect | 15.63 | 3.55 | 16.32 | 4.01 | −1.923 | 0.020 | 0.18 |
| Tension | 1.51 | 0.59 | 1.66 | 0.64 | −3.100 | 0.008 | 0.25 |
| Displeasure | 1.52 | 0.60 | 1.57 | 0.63 | −1.031 | 0.276 | 0.08 |
| Guilt | 1.57 | 0.58 | 1.52 | 0.60 | −1.009 | 0.199 | 0.08 |
| Fright | 1.33 | 0.56 | 1.44 | 0.63 | −2.543 | 0.025 | 0.18 |
| Anger | 1.62 | 0.63 | 1.56 | 0.62 | −1.231 | .188 | 0.09 |
| Irritation | 1.52 | 0.62 | 1.57 | 0.66 | −0.765 | 0.654 | 0.09 |
| Embarrassment | 1.60 | 0.65 | 1.75 | 0.72 | −1.987. | 0.013 | 0.22 |
| Nerves | 1.81 | 0.69 | 1.89 | 0.73 | −1.237 | 0.231 | 0.11 |
| Unrest | 1.73 | 0.73 | 1.86 | 0.69 | −2.599 | 0.012 | 0.18 |
| Fear | 1.41 | 0.62 | 1.49 | 0.66 | −1.999 | 0.089 | 0.12 |
Table 3.
Mean, standard deviation (SD), ANOVA, and size of effect of the differences in means (d) in function to the BMI of students.
Table 3.
Mean, standard deviation (SD), ANOVA, and size of effect of the differences in means (d) in function to the BMI of students.
| Without Obesity | With Obesity | ||||||
|---|---|---|---|---|---|---|---|
| Variables | Mean | SD | Mean | SD | F | Sig | d |
| Positive Affect | 24.58 | 2.95 | 23.77 | 3.07 | −1.543 | 0.031 | 0.27 |
| Interest | 2.41 | 0.58 | 2.39 | 0.53 | −0.701 | 0.672 | 0.04 |
| Cheer | 2.46 | 0.61 | 2.36 | 0.65 | −1.667 | 0.172 | 0.16 |
| Energy | 2.73 | 0.48 | 2.49 | 0.59 | −2.998 | 0.003 | 0.45 |
| Enthusiasm | 2.27 | 0.61 | 2.26 | 0.61 | −0.558 | 0.643 | 0.02 |
| Pride | 2.54 | 0.56 | 2.42 | 0.62 | −1.543 | 0.099 | 0.20 |
| Disposition | 2.39 | 0.63 | 2.27 | 0.68 | −1.453 | 0.178 | 0.18 |
| Inspiration | 2.22 | 0.65 | 2.19 | 0.62 | −0.542 | 0.887 | 0.04 |
| Decision | 2.45 | 0.61 | 2.43 | 0.57 | −0.332 | 0.771 | 0.03 |
| Attention | 2.44 | 0.57 | 2.36 | 0.57 | −1.321 | 0.332 | 0.14 |
| Activity | 2.67 | 0.56 | 2.55 | 0.62 | −1.678 | 0.048 | 0.20 |
| Negative Affect | 15.67 | 3.89 | 16.14 | 4.01 | −1.021 | 0.387 | 0.12 |
| Tension | 1.57 | 0.62 | 1.58 | 0.65 | −0.051 | 0.974 | 0.02 |
| Displeasure | 1.49 | 0.57 | 1.65 | 0.68 | −1.889 | 0.059 | 0.26 |
| Guilt | 1.51 | 0.60 | 1.58 | 0.58 | −1.439 | 0.352 | 0.12 |
| Fright | 1.36 | 0.58 | 1.38 | 0.64 | −0.037 | 0.997 | 0.03 |
| Anger | 1.48 | 0.59 | 1.60 | 0.61 | −1.876 | 0.087 | 0.20 |
| Irritation | 1.56 | 0.63 | 1.58 | 0.65 | −0.345 | 0.892 | 0.03 |
| Embarrassment | 1.68 | 0.68 | 1.70 | 0.73 | −0.201 | 0.924 | 0.03 |
| Nerves | 1.85 | 0.72 | 1.87 | 0.73 | −0.153 | 0.887 | 0.03 |
| Unrest | 1.75 | 0.70 | 1.77 | 0.71 | −0.298 | 0.799 | 0.03 |
| Fear | 1.41 | 0.61 | 1.43 | 0.63 | −0.301 | 0.852 | 0.03 |
Note: d = size of the effect of Cohen.
© 2019 by the authors. Licensee MDPI, Basel, Switzerland. This article is an open access article distributed under the terms and conditions of the Creative Commons Attribution (CC BY) license (http://creativecommons.org/licenses/by/4.0/).
Share and Cite
MDPI and ACS Style
Gil-Madrona, P.; Cejudo, J.; Martínez-González, J.M.; López-Sánchez, G.F. Impact of the Body Mass Index on Affective Development in Physical Education. Sustainability 2019, 11, 2459. https://doi.org/10.3390/su11092459
AMA Style
Gil-Madrona P, Cejudo J, Martínez-González JM, López-Sánchez GF. Impact of the Body Mass Index on Affective Development in Physical Education. Sustainability. 2019; 11(9):2459. https://doi.org/10.3390/su11092459
Chicago/Turabian StyleGil-Madrona, Pedro, Javier Cejudo, Jesús Manuel Martínez-González, and Guillermo F. López-Sánchez. 2019. "Impact of the Body Mass Index on Affective Development in Physical Education" Sustainability 11, no. 9: 2459. https://doi.org/10.3390/su11092459
Note that from the first issue of 2016, this journal uses article numbers instead of page numbers. See further details here.