Spatial Assessment of Urban Climate Change Vulnerability during Different Urbanization Phases

1
Department of Environmental Science and Engineering, Fudan University, Shanghai 200433, China
2
Big Data Institute for Carbon Emission and Environmental Pollution, Fudan University, Shanghai 200433, China
3
Shanghai Institute of Eco-Chongming (SIEC), Shanghai 200062, China
4
School of Geography and Tourism, Anhui Normal University, Wuhu 241000, China
*
Authors to whom correspondence should be addressed.
Sustainability 2019, 11(8), 2406; https://doi.org/10.3390/su11082406
Submission received: 7 March 2019
/
Revised: 11 April 2019
/
Accepted: 12 April 2019
/
Published: 23 April 2019
(This article belongs to the Section Sustainability in Geographic Science)
Abstract
:In urban areas, concentrated populations and societal changes intensify the influence of climate change. However, few studies have focused on vulnerability to climate-related risks on the scale of a single urban area. Against this backdrop, we reconstructed a spatial vulnerability framework based on the drivers-pressures-state-impact-response (DPSIR) model to reflect the complex interactions between urbanization and climate change and to integrate the natural and socio-economic factors of urban areas into this framework. Furthermore, to explore the relationship between rapid urbanization and climate change, we studied data from two years that represented different stages of urbanization. The results showed that the index framework was able to reconcile these two concepts to reflect the complex interactions between urbanization and climate change. The assessment results indicate that the overall degree of climate change vulnerability exhibits a generally increasing and dispersing trend after rapid urbanization. The increasing trend is influenced by an increase in low-vulnerability areas, and the dispersing trend is influenced by anthropogenic activities caused by rapid urbanization. The changes are reflected in the following observations: 1. The suburbs are affected by their own natural environmental characteristics and rapid urbanization; the vulnerability level has risen in most areas but has declined in certain inland areas. 2. High-vulnerability regions show minor changes during this stage due to the lasting impact of climate change. Finally, the main environmental problems faced by high-vulnerability areas are discussed based on existing research.
1. Introduction
The impacts of climate variability, which manifest as floods, storms, heat waves, and other extreme events, create enormous developmental challenges for human society. Especially in urban areas, the effects of climate change are becoming increasingly complex because of the interactions between human activities and environmental conditions. Most cities around the world are affected by climate change, and these impacts will worsen in the coming decades [1,2]. In response, cities need a bottom-up adaptation system for spatial planning, regulations, and policies to reduce the impacts of climate change, which requires a comprehensive understanding of the existing impacts of climate change.
To achieve this understanding, the most basic and critical task is to define the impacts of climate change. Most existing research focuses on natural events, such as extreme heat events [3,4,5], floods [6,7], and storm surges [8,9]. Beyond estimating the probability of physical damage, in urban areas, it is important to consider the social context in which impact occurs, because people do not necessarily share the same perceptions of impact [10]. Therefore, many studies suggest that impact should be assessed with social, economic, political, psychological, and environmental variables to integrate physical and social attributes [11], especially for studies in urban areas. In addition, a growing body of research indicates that the influence of climate change is a dynamic systemic process, in which there exists a complex correlation between climate change and the urbanization process in urban areas [11,12,13]. Some studies have proposed that urbanization contributes to the impacts of climate change. For example, related studies have reported that the urbanization process in the transformation of an agricultural society to a modern urban society would shape the sensitivity, response capacity, and actual response actions of urban areas. Many perspectives in these studies emphasize urbanization as a driver of climate change exposure [14]. Therefore, a more comprehensive evaluation system is needed that considers not only the effects of climate change on the natural conditions but also the complex correlation between climate change and urbanization.
Many studies have attempted to develop theoretical frameworks for impact evaluation. In recent years, evaluation of disaster vulnerability has become an important theoretical tool for disaster management [15,16,17,18]. The IPCC report provided a clear definition of climate change vulnerability, which included the three perspectives (exposure, sensitivity, and adaptability of the environmental system) [19]. The report describes the impacts of climate change scientifically, and it has made vulnerability framework a focus of research for global climate change. Currently, the existing research on climate change vulnerability reflects two main research directions: (1) on the temporal scale, in which the study area is considered as a whole, the trends of the vulnerability are examined on long-term time scales, and holistic suggestions for specific study areas have been proposed [20,21]; (2) on the spatial scale, in which various spatial factors are combined, the differences between vulnerability evaluation results within the study region are evaluated, and different suggestions for different regions have been proposed [22,23,24]. Many vulnerability assessment studies have been conducted on large scales [25], such as Europe [26] and North America [25]. Considering that large-scale research can only provide an understanding of overall impact, it is difficult to transform these research results into local policies and measures within a single city because each city has a different socio-economic and natural background [15,27]. In addition, the results of most previous studies are based on the measurement of indicator systems [28], which cannot explain the influence process of climate change. Especially in urban areas, it is difficult to reflect the interactions between human activities and environmental change only from the three perspectives considered in the IPCC’s concept of climate change vulnerability. Thus, it would be helpful to add process analysis models to the vulnerability framework.
In addition to the concept of vulnerability, models that can describe disaster impacts and reflect the influencing factors include the following: the pressure-state-response (PSR) model proposed by the OECD [29], the driving force-state-response (DSR) model proposed by the United Nations [30], and risk hazard models [31]. On the basis of these models, the OECD also proposed the drivers-pressures-state-impact-response (DPSIR) model, which was adopted by the European Environment Agency. Based on pressure and state indicators, this model extends the description of the environmental system to five indicators, as shown in Figure 1: “drivers”, “pressures”, “state”, “impact”, and “response”. Among these indicators, “drivers” refers to the underlying causes of environmental change; “pressures” refers the factors that act on the environmental system after the effects of the “drivers”; “state” is the state of the natural environment under such pressures; “impact” is the effect of the natural system state on the ecosystem environment and social economy; and “response” describes the related measures taken by humans to prevent, mitigate, or eliminate a negative impact [32]. The model can cover factors of economy, society, population, and environment in a regional system, providing a perspective on the interactions between humans and environmental systems in the process of impact analysis [32]. The DPSIR model has been applied to research on biodiversity conservation [33], sustainable development [34], environmental pollution [35], and water resources protection [36].
Although few studies have applied the DPSIR model in the climate change field, the evaluation content of the model can reflect the impacts of climate change on natural systems and socio-economic factors within urban areas, which is consistent with the goal of climate change impact assessment. More importantly, the theoretical framework of this model can reveal the relationship between climate change and urbanization within urban areas based on the analysis of the interactions between people and the environment. Existing research on this issue has shown that this model has an advantage in revealing underlying causes [28,37]. One benefit of this analytical framework is that it can help us understand the dynamic structure of a complex system and connect conceptual exploration beyond social and natural phenomena [38].
Based on these problems with the current research, the main research contents of this study can be divided into the following two aspects:
- (1)
- Developing a theoretical framework of climate change vulnerability at the city scale.The first objective is to develop an assessment framework for urban areas based on common terminology originating from the climate change vulnerability concept and the DPSIR model.The proposed framework should reflect the interaction between human activities and natural conditions within urban areas. Links between the conception of vulnerability and the DPSIR model should not be merely theoretical but should be included in the specific index chosen based on a summary of vulnerability indexes at the city scale [22,39].
- (2)
- Exploring the characteristics of urban climate change vulnerability at different stages of urbanization.
To break through the limitations of analysis at the city scale, we attempt to use remote sensing and GIS methods to quantify several spatial indexes, identify vulnerable areas, and explore factors leading to the vulnerable states in different years. Information about spatial variations should make city managers aware of the trends in climate change and human activities in different stages of urbanization and allow them to propose adaptations to address the impacts of climate change in the future.
2. Study Area
Shanghai is a typical metropolitan area with 24.20 million people distributed over 6340.50 square kilometers of land (Figure 2a), which is located in the estuary of the Yangtze river on the eastern coast of China. In recent decades, due to the rapid development of China’s economy, Shanghai has become one of the fastest-growing cities in the world [40].
Shanghai is located in the subtropical monsoon region at the edge of the largest continent (Eurasia) and faces the largest ocean (the Pacific). Strong monsoon characteristics make the climatic conditions in this region extremely unstable. As a result, the region’s natural environmental conditions are particularly sensitive, making the effects of climate change on this region more pronounced. Several studies have shown that the effects of climate change in this region are already significant, as reflected by the increased frequency of extreme weather events and rising sea level [41]. The most intuitive indication is the increase in the annual average temperature. Data from the Shanghai Statistical Yearbook indicate that every ten year’s mean temperature change has been 0.50 °C/a over the past 60 years, and the trend coefficient is 0.68 (p < 0.0001), indicating that there has been a significant warming trend in the Shanghai area over the past 60 years (Figure 2b). In addition, the change in the average temperature in recent decades can be divided into two stages: from 1990 to 2010, the annual mean temperature changed by up to 1.03 °C/10 a, which is twice the rate of change over the past 60 years; however, subsequently, and especially after 2007, the annual average temperature has shown a decreasing trend.
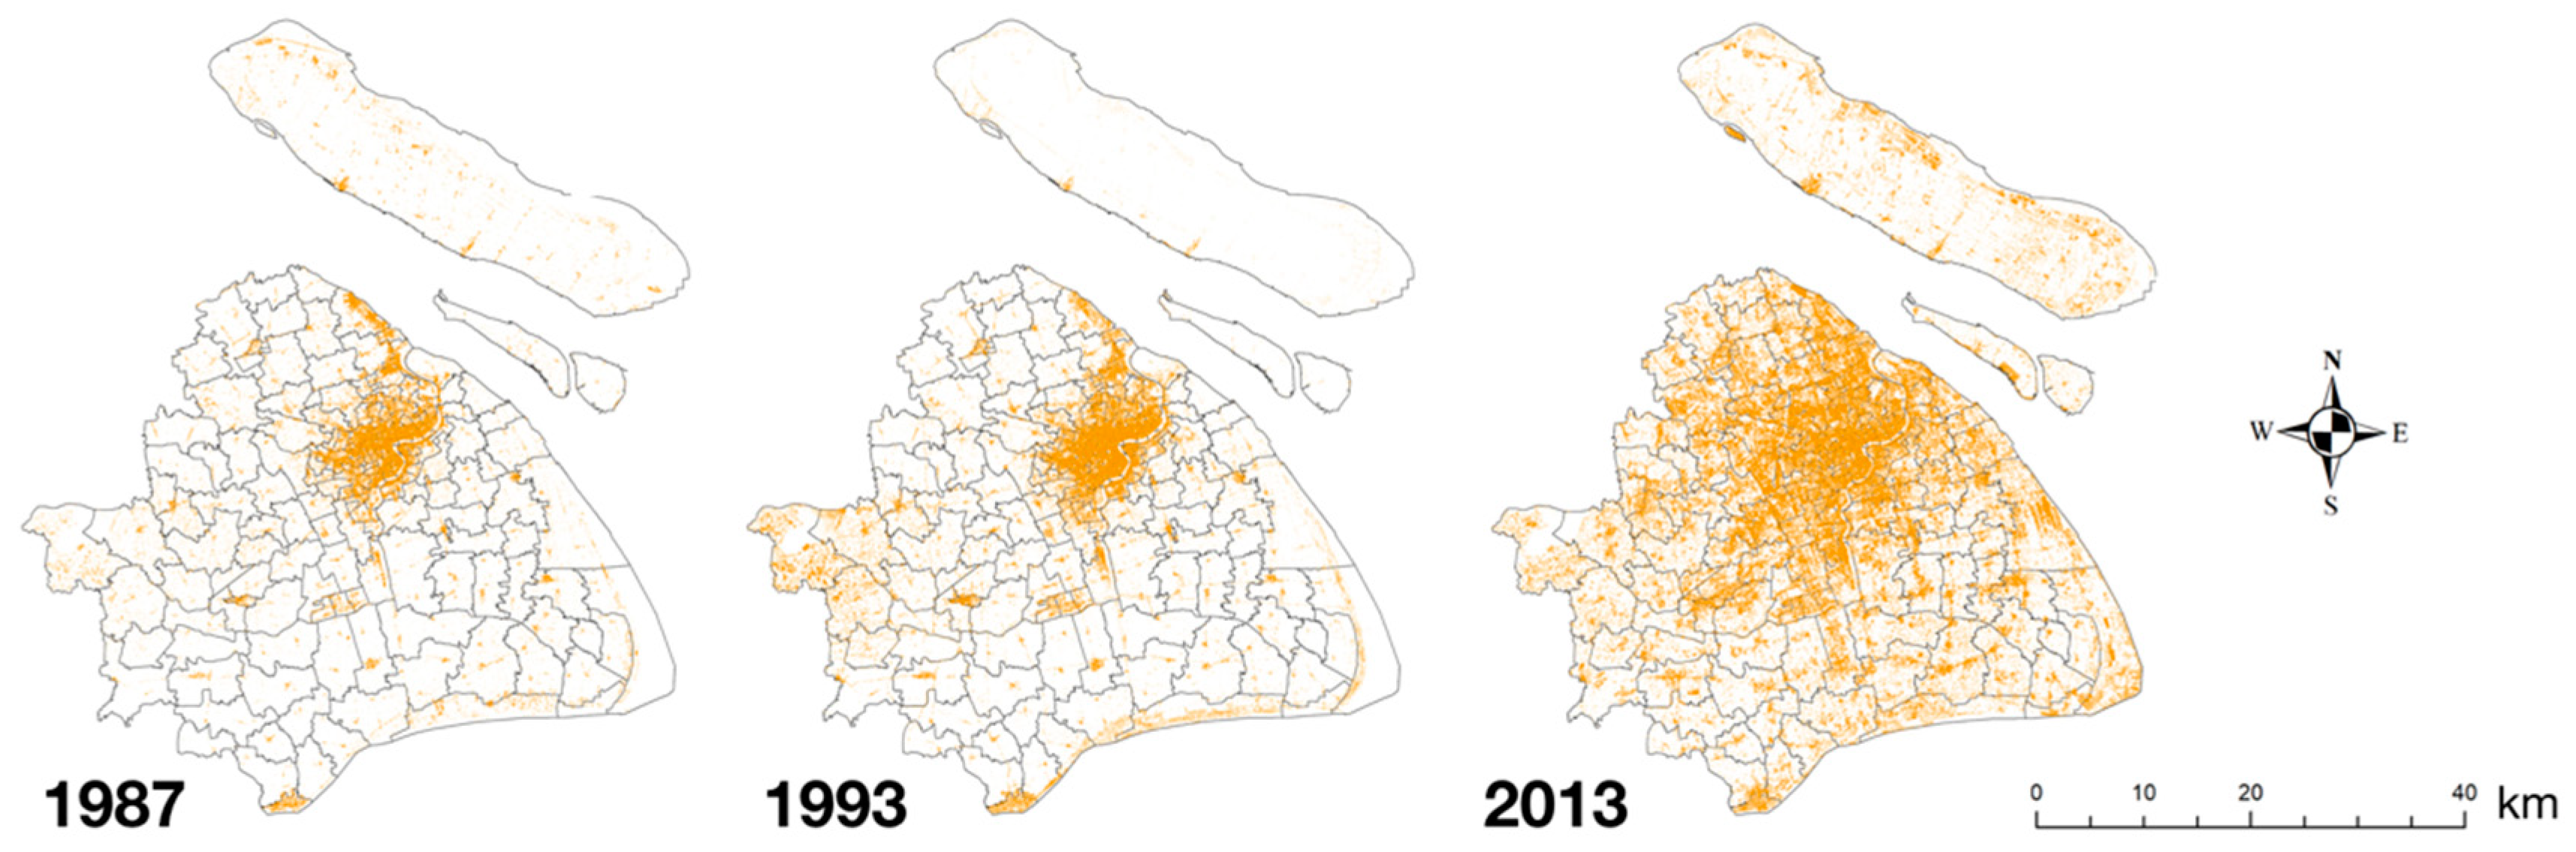
In addition to natural conditions, the artificial environment within the city is also undergoing dramatic changes. This city has a long urbanization history, but most of the population growth and economic expansion have occurred since the 1990 Pudong Development. From 2000 to 2010, Shanghai’s population increased by 75.35%. To illustrate the influence of an increasing population on the urban environment, Landsat images were used to depict the distribution of artificial surfaces in the study area in different years. As shown in Figure 3, the area occupied by artificial surfaces increased significantly from 1987 to 2013. In 2010, Shanghai hosted the World Expo, and urban construction subsequently entered a new historical stage, during which the percentage of the urbanized population approached 89%. Subsequently, the rapid growth trend slowed sharply. Therefore, the percentage of the urbanized population in recent decades can also be divided into two stages. Dramatic changes to the artificial environment have been accompanied by the development of social and economic conditions, as the average per capita disposable income of urban residents has increased from 1175 USD to 4741 USD. Education has also progressed, as the average number of college students per 10,000 people increased from 141 to 224 (from 2000 and 2010; Shanghai Statistics Bureau, http://www.stats-sh.gov.cn).
This study focused on Shanghai mainly because of the following three aspects: (1) As a typical estuarine city, the natural conditions of Shanghai are highly sensitive, which makes the impacts of climate change particularly acute in this area. (2) Considering that the natural and socio-economic conditions in this area are undergoing dramatic changes simultaneously, the results of a study in this area will reflect the complex interactions between natural conditions and human activities in an urban area. (3) In recent years, the annual average temperature and the proportion of the urban population have shown different characteristics at different stages. A comparative study of different years can reflect the periodic characteristics of climate change vulnerability against the background of rapid urbanization. It can also provide ideas for adapting to the next stage of urbanization and the response to the impacts of climate change.
Over the past two decades, the average temperature and the proportion of the urban population in Shanghai has shown different characteristics in different time periods. Variations in the average temperature changed by the year 2009 (before 2009, the values increased with fluctuations, whereas after 2009, the values decreased with fluctuations). Variations in the proportion of the urban population changed by the year 2007 (before 2007, the values had a distinct upward trend, and the rate of increase slowed significantly after 2007). Therefore, considering the different characteristics of the two datasets in different time periods and the availability of the data for each year, we selected 2006 and 2013 to represent different stages of urbanization to explore the impact of climate change in different stages of urbanization.
3. Materials and Methods
3.1. Research Framework
We used a definition of climate change vulnerability that incorporated three interacting concepts: exposure, sensitivity, and adaptive capacity [42,43]. Exposure describes the degree to which a system is exposed to major climate-related events [44]. Sensitivity refers to the degree of adverse or beneficial effects to the urban system related to climate change [45]. Adaptive capacity is determined by “a set of local resources and conditions that limit or support the capability of the system to adapt to climate changes” [19]. The second concept used in this study was the DPSIR model, which is widely used by many international organizations [46,47] to refine environmental indicators and to represent the change process in a system. This concept can be simply defined as follows: drivers exert pressures on systems. As a consequence, the resulting impacts evoke responses that can bring changes to the drivers, pressures, state, and impact [48].
We proposed to integrate an evaluation based on the reconstruction of the concept of climate change vulnerability with the DPSIR model to provide detailed insight for urban areas. This approach not only demonstrated the framework’s utility for vulnerability evaluation; the integration also provided a useful tool with which to organize interacting information related to both human activities and environmental changes. We proposed the integration framework by identifying concept implication to develop links between vulnerability components (exposure, sensitivity, and adaptive capacity) and the components of the DPSIR model (drivers, pressures, state, impact and response). The relationship between the two frameworks was not consistent; a concept in one framework may have corresponded to multiple concepts in another framework [49]. The resulting integrated framework is shown in Figure 4.
Drivers and pressures (from the DPSIR concept) are considered to correspond to the vulnerability concept of exposure. The drivers reflect latent changes. We divided this concept into socio-economic and climate change drivers that could exert pressures on the urban system. These elements are similar to the concept of exposure, which describes the degree to which a system is exposed to forces of change. According to related research [43,50], socio-economic pressures caused by socio-economic drivers are pronounced in urban systems because human influences dominate. In contrast, climate change drivers directly cause changes in the environmental state of the urban environment.
The state concept of DPSIR refers to the current conditions in the urban system. According to the relevant research [49] and considering the characteristics of the city system, the state represents the exposure degrees of an urban area as well as the prevailing sensitivity of the system. In urban areas, for instance, the exposure of the system would be reflected by the quantifiable state under all forms of pressure [43]. In contrast, sensitivity is the capacity of the urban system to adjust to pressures or drivers without adverse changes in the absence of adaptation action.
The impact concept of DPSIR is similar to the concept of sensitivity in the framework of vulnerability, but it is also somewhat different. In the DPSIR framework, impact is caused by the state changes, and the degree of impact is determined by the degree of the state changes. The core concept of sensitivity is to describe the degree of state change under the exposed condition. Therefore, these two concepts are consistent in terms of system content. However, when considering the cause-and-effect relationship between the two conceptual models, the contents of the two concepts diverge. In DPSIR, a response is considered to be a result of an impact; the two are causal relations. In the framework of vulnerability, there is no causative link between sensitivity and adaptive capacity. In an urban system, for example, these concepts can exist simultaneously. In this study, to adapt to the concept of vulnerability, the response and impact were considered to be independent.
The response and adaptive capacity are consistent with what they refer to: they are related to the urban system’s reaction to an impact or current state. As noted above, response is the result of an impact in the DPSIR framework. In contrast, the adaptive capacity’s status in vulnerability framework is more independent; it represents not only the response but also the adaptability within the urban system.
In addition to conceptual construction, we considered the influences of climate change and urbanization in the research framework. At the beginning of the framework, we divided the drivers into socio-economic and climate change drivers. According to the terminology of the DPSIR, the framework content differentiates exposure and sensitivity into two major types (socio-economic and environmental), corresponding to the influencing processes of urbanization and climate change on the urban system.
Despite these conceptual differences when connecting these two frameworks, complexities of the urban system would be more intuitive, and interactions between natural conditions and human activities could be visualized through the framework of this study.
3.2. Indicators for the Evaluation Framework
Indicators for this framework were based on relevant climate change research performed on an urban scale [39,51,52]. Because different years and different regions were involved in this study, several additional indicators that were capable of quantification and spatialization were selected in this study. The selected indicators for the different vulnerability aspects are shown in Figure 4, and their descriptions are summarized in Appendix A Table A1.
To choose evaluation indicators, two aspects were considered in this study: (1) The indicators had to be suitable to develop an evaluation framework of urban climate change vulnerability from related vulnerability research. (2) Based on the framework of DPSIR, we examined these indicators further, with respect to each influence and response processes, to ensure that every process in the DPSIR model had a quantitative evaluation indicator. This allowed the DPSIR model to reflect the interaction process between climate change and urbanization in study area, as shown in Figure 4. To better describe the process of choosing indicators and the interaction between the vulnerability and DPSIR frameworks, the process is described below, starting with “drivers”.
There were two aspects of indicators for vulnerability drivers based on society and the natural environment. For the society aspect, as a major factor for the man-made urban environment, population density was used as an indicator for the socio-economic drivers. In contrast, the natural drivers were divided into external and internal environments in urban areas. For climate change vulnerability, sea level rise was used as an external natural driver, and land surface temperature (LST) was used as an internal natural driver.
As a result of the socio-economic drivers, there were different pressure features in the overall and local urban areas. For the overall aspects, we chose to focus on the overall characteristics of land use because pressures that were caused by different land-use types would affect the urban ecological environment with different intensities. Therefore, the different land-use types in the study area were defined as sources of the climate change exposure pressure level for the urban ecological environment. In local urban areas, regions with high industrial output were areas where human activities caused significant environmental pressure. The industrial output proportion was estimated in order to evaluate the society pressure potential.
Subsequently, in socio-economic and environmental states, the different effects of pressures and drivers would result in different state features. For the socio-economic state, the elderly population ratio was used as an indicator of the urban society state. An area with a large elderly population was considered to be a sensitive area if, based on the climate change conditions, the elderly population would be easily affected by extreme weather events, such as heat waves or extremely low temperatures. In addition, proportion of agricultural output was used as an indicator of urban economic state. Areas with high agriculture proportions were areas in which the economic structure was sensitive to climate change. The environmental state for urban areas was also divided into two aspects for the different features according to external and internal natural drivers. Water body distribution was used as a proxy state indicator for the sea level rise driver. A region close to a water body was considered to be sensitive to the impact of sea level rise [39]. Vegetation coverage was estimated to evaluate the overall urban ecological environment based on the stronger promotion effect of the surrounding environment from higher amounts of vegetation coverage. For the purpose of impact indicators, as a result of state changes, two representative impacts were selected based on the regional problem in the study area. As the economic center for the surrounding region, high unemployment rates would have a profound effect on the social stability in areas of Shanghai in the context of climate change. Therefore, we selected unemployment rate as a socio-economic indicator of sensitive impact. There is a high daily water demand because the region has a high population concentration, but water pollution is still a serious problem in Shanghai [53]. Therefore, we selected water quality as an environmental impact indicator for climate change sensitivity in Shanghai.
There were two types of community responses: government and personal. For the government level, we selected the support for infrastructure, science, and technology from the government, which determined the adaptability of the urban region to climate change. For the personal level, economic capacity determined the resources a person could obtain from society, which determined the adaptability of a person to climate changes. Many studies have demonstrated that there is a significant correlation between the impact level of extreme events and a person’s income [54].
It should be noted that indicators for different DPSIR aspects would not theoretically target the logical relationship of the DPSIR model because the limited data sources could not meet all required five aspects of the DPSIR model. However, in the specific setting of this framework, indicators from the corresponding DPSIR aspect were considered. Above all, indicators for different vulnerability components should target the logical relationship of the vulnerability.
3.3. Methods of Indicator Integration
In this study, integration methods for all of the indicator contexts had several challenges. First, many types of indicators from nature and society were determinants of climate change vulnerability. Therefore, the integration methods required in this study were used as the unit of analysis to calculate all types of indicators based on the complex evaluation framework presented in the previous section. Furthermore, for the comparison of the two years, this study devised a single integration system for research on different years.
Many scholars have provided index-based approaches for vulnerability assessment [15,39,43,55]. Accordingly, we divided integration methods into two steps. (1) We defined a 500-meter grid system as the basic unit of the vulnerability evaluation system (Figure 2a), and the indicators selected from the evaluation framework presented in Section 3.2 were resampled and modified into the same grid system using ArcGIS. To develop standardized sub-indices, the normalization method was adopted to standardize all of the indicators into ranges of 0–1 for comparison calculations in every grid, according to the related research [56,57]. In addition, the values for each standardized indicator were divided into five levels according to the natural discontinuous point method (the values for these levels were 1, 2, 3, 4, and 5) to further enable a comparative study of the two years, which could not be easily compared if the variables were too different. (2) Thereafter, the climate change vulnerability index was calculated using the vulnerability additive approach, which has been widely used to calculate climate change vulnerability indexes [15,43,57]. In this step, we first weighted all of the indicator values from the aspects of exposure, sensitivity, and adaptive capacity using Equation (1). The weighted mean referred to the number of variables in the sub-indicators of exposure, sensitivity, and adaptive capacity and the components of vulnerability based on related research in urban areas [39]. Nevertheless, compared to one year’s study, the weighted mean, which ranged from 0 to 1, referred to the number of variables in the two years for further comparison. Second, the values of the vulnerability components were calculated with Equation (2). Based on the same method used in the previous step, the climate change vulnerability index was calculated using Equations (3) and (4), and we obtained the vulnerability patterns for the two years in Shanghai:
where refers to the value of indicator n in 2006 in the components of exposure, sensitive, or adaptive capacity, and Wn refers to the weighted value of the indicator n:
where a is equal to 2006 or 2013 and v is equal to 1, 2, or 3 (representing the components of exposure, sensitive, or adaptive capacity, respectively). When a is equal to 2006 and v is equal to 1, n represents the number of indicators in the exposure; for example, refers to the value of exposure in 2006:
where a is also equal to 2006 or 2013; for example, refers to the value of the vulnerability in 2006.
4. Results
4.1. Potential Changes of Exposure, Sensitivity, and Adaptability
In general, to easily identify the differences between study results of different years, we divided the exposure, sensitivity, and adaptability results into five levels using the same threshold levels (“very high”, “high”, “moderate”, “low”, “very low”), as shown in Figure 5.
The exposure level in the results of the two years was compared. Urbanization had a positive effect on the exposure level because it increased the artificial surface, urban heat island, and population in regions surrounding the city center, such as Fengxian, Songjiang, and Northern Pudong. In contrast, the exposure level did not increase significantly from 2006 to 2013 in the city center (Figure 5a). In the downtown area, the population capacity was close to saturation, and changes in the high exposure values of the urban center were relatively small. In certain areas of the city center, such as Yangpu and Xuhui, the degree of exposure even declined. However, these decreases did not mean that these areas had low exposure to climate change; rather, these areas had relatively low levels compared to those in the past.
The sensitivity value, in contrast, declined slightly. The spatial variation of higher sensitivity values was similar in 2006 and 2013 (Figure 5b) because the process of urbanization in the most sensitive areas did not change much under the impact of climate change; these regions were near lakes and river systems and in areas with high ratios of agricultural economy. In addition, the sensitivity of Chongming Island was higher than that in other regions mainly because there is a high proportion of the ageing population and an extensive agricultural economy.
Climate change adaptability in the results of the two years was compared (Figure 5c). The main changes occurred in the inland suburbs. The processes of urbanization and industrialization had positive effects on the increases in the adaptability levels in suburban areas, such as Qingpu and Jiading, because the levels of employment, income, and economic input from the government increased. No areas in the city center had significant changes. In general, the values of the adaptive capacity were more dispersed.
4.2. Spatial Patterns of Climate Change Vulnerability
- (1)
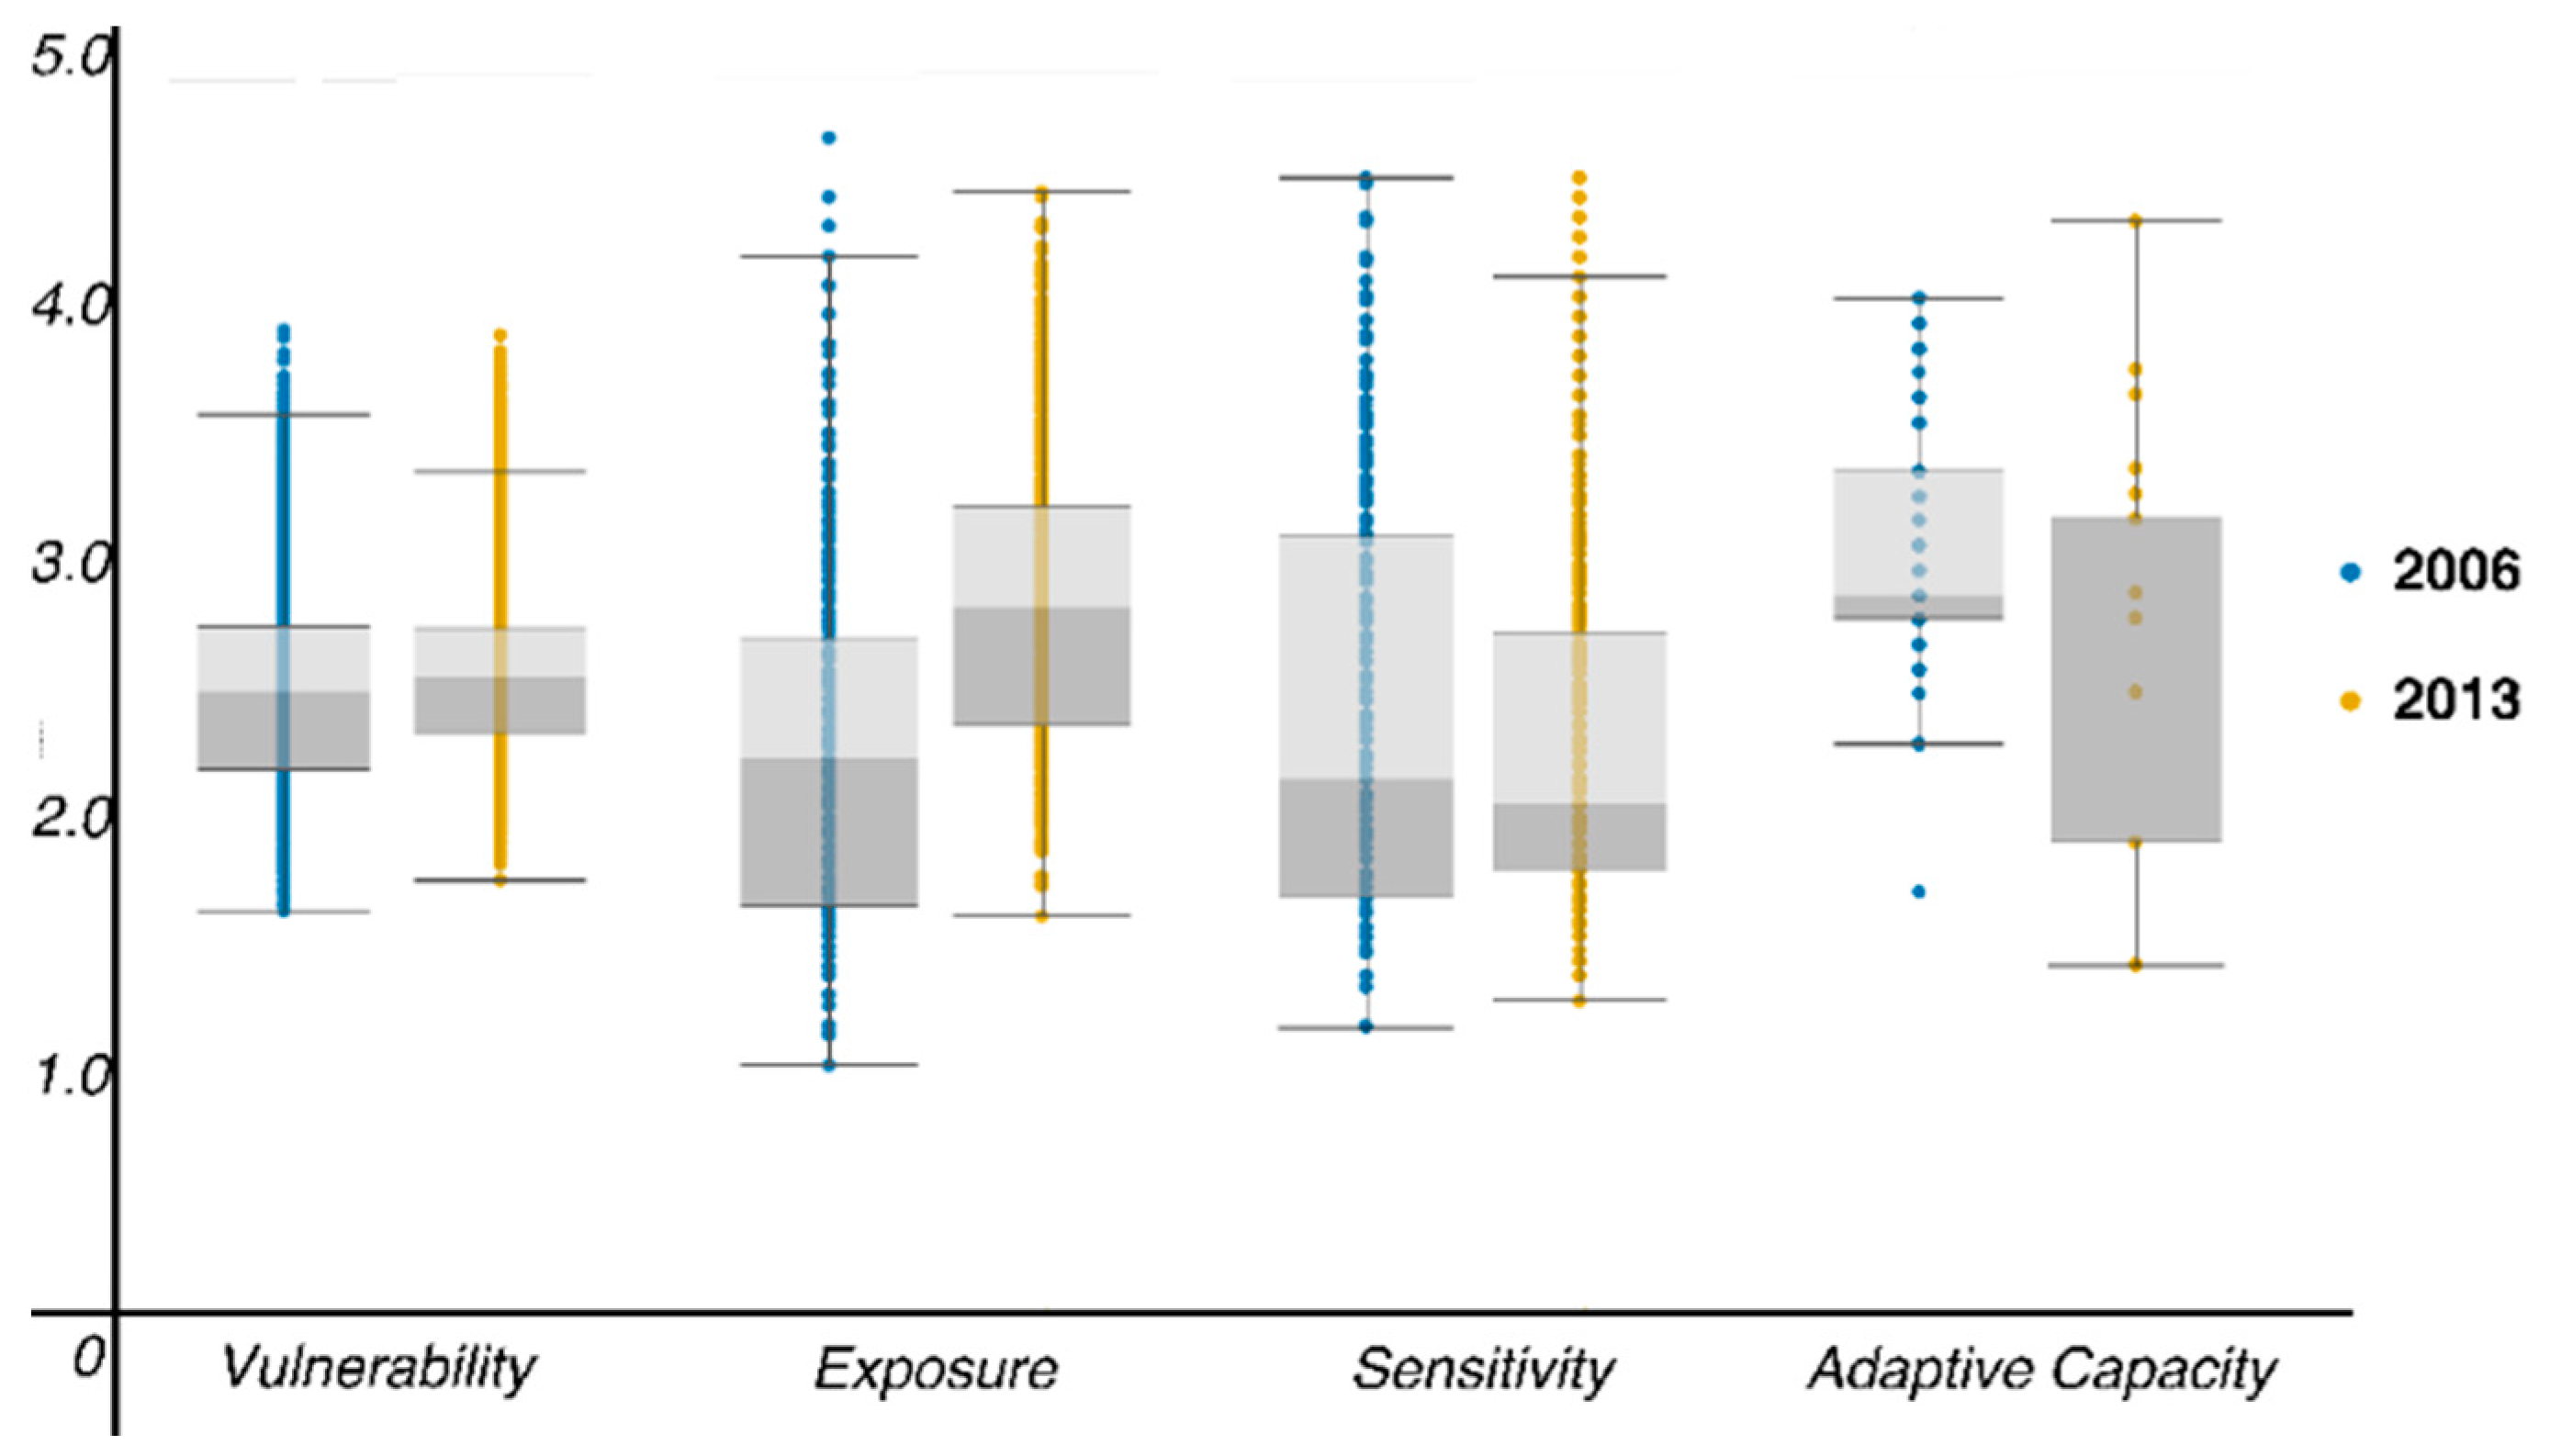
- The aspect of numerical value had apparent differences in the vulnerability values of the two years. On the one hand, the vulnerability value in 2013 was significantly higher than that in 2006. Figure 6b shows that the most vulnerable areas increased from 2006 to 2013; the “very high” and “high” classes increased, respectively, from 22.16% and 8.01% in 2006 to 29.53% and 11.38% in 2013. On the other hand, the classes “very low” and “low” decreased to 9.57% and 17.40%, respectively, in 2013. In general, the values of all vulnerability results tended to be scattered from 2006 to 2013.Based on the results from the box plots (Figure 7), increases in the most vulnerable areas occurred because exposures increased as a result of the concentration of human activity in the suburbs. As discussed above, exposures in suburbs such as Jiading, Baoshan, Minhang and Pudong have increased significantly since the process of urbanization began.
- (2)
- For the aspects of spatial pattern, in general, the spatial differences between the vulnerability results from the two years were inconspicuous, particularly in the areas with higher vulnerability values, which were mainly distributed in the city center on both sides of the Huangpu River and other areas where the natural environment was vulnerable, such as the eastern part of Chongming Island and the area surrounding Dianshan Lake. The similar high vulnerability values for both years were due to the impacts of climate change, which resulted in minor changes in the spatial variations of the higher exposure and sensitivity values.
We also showed spatial changes in the values from 2006 to 2013 to understand the changes in detail. Figure 8 shows spatial results after calculation of the changes (D-values between the 2013 and 2006 vulnerability evaluation results) for each grid. Unlike the overall vulnerability distribution (decrease from the city center to the surrounding area), two trends were shown in the conversion strength results: (1) a decreasing trend from coastal to inland areas and (2) a decreasing trend from south to north, which is shown in Figure 8. The suburbs were the main areas of change, which could be divided into two categories: (1) significant increase in lower vulnerability values in most of the southeast suburbs and (2) decrease in the vulnerability levels of some inland areas, such as Qingpu.
5. Discussion
The impacts of climate change are gradually increasing, especially in urban areas with complex interactions between social and natural conditions, which shape the different spatial characteristics of the vulnerability in different time periods. Many studies have focused on a single year, and the evaluation framework of the vulnerability could not reflect the social and natural interactions in urban areas. Therefore, there is a lack of research that reflects climate change processes, especially in urban areas.
Due to these shortcomings, this study first attempts to integrate an evaluation, by reconstructing the concept of climate change vulnerability based on the DPSIR model, to provide a detailed structure for analyzing social and natural interactions in urban areas. Second, we use GIS, RS, and other technical means to integrate social, economic, and natural data on an urban scale. Furthermore, we attempt to reflect climate change vulnerability in the process of urbanization by comparing two years that are representative of distinct stages of urbanization.
5.1. Transformation Characteristics of Two Years’ Results
The evaluation results mainly show two inconsistent features of the numerical distribution of vulnerability values for the two years: (1) The overall climate change vulnerability level has increased significantly. The analysis results show that the increasing vulnerability values in the suburbs are the main reason for this increase. (2) Certain areas have experienced little change, including areas along the coast or along the river such as the Dianshan Lake area and the eastern part of Chongming Island, which have high levels in both years. This general feature is consistent with previous research results in Shanghai (Wang et al. 2018).
In addition, the components of vulnerability also have different transformation characteristics, which can help to elucidate the vulnerability change process during different urbanization phases. Among these characteristics, overall, the higher exposure and sensitivity values are similar in 2006 and 2013, indicating that there is no structural change in the final outcome of the vulnerability assessment in 2006 and 2013. Additionally, the changes in the spatial patterns of the urban center’s exposure, sensitivity, and adaptability were relatively small, whereas these values changed significantly in the suburbs; the transformation of the suburbs can be further divided. The exposure and sensitivity values within the inner suburbs increased significantly from 2006 to 2013, while adaptability strengthened in the outer suburbs.
5.2. Reasons for the Different Transformation Characteristics
As the evaluation framework in this study was developed based on the concept of vulnerability and the DPSIR model, we explored the factors contributing to the transformation according to these two frameworks.
From the framework of vulnerability, overall, the significantly increasing value of exposure is the main reason for the final increase in the vulnerability level from 2006 to 2013. Specifically, due to various socio-economic backgrounds, different regions exhibit different transformation trends. First, in the area along the river or coast, climate change impacts generally lead to a consistent trend in the background of sea level rise and increasing temperatures, so the spatial variations in the higher exposure and sensitivity values are similar in 2006 and 2013. Ultimately, the high-value area shows less change in the evaluation results of the two years. In contrast, the values of the three vulnerability components changed greatly in the suburbs, especially in the eastern coastal suburbs where the exposure and sensitivity levels increased considerably. In the western inland suburbs, adaptability increased during the urbanization process. These differential development trends are the main reason for the different changes in the vulnerability levels, as shown in Figure 8. Moreover, the framework and the components of vulnerability can help us to understand the cause of spatial changes in vulnerability assessment results during different urbanization phases; however, this framework cannot present the complete process of climate change influence on the urban system because of the complex interaction between urbanization and climate change.
To understand the changing process and the reasons behind the value distribution, we need to analyze the evaluation results from the DPSIR model. In this part, we discuss the DPSIR framework according to the “drivers” component. As shown in Figure 4, there are two types of “drivers”: (1) with respect to the “drivers” of climate change, the urban temperature and sea level increased under the climate change process. As a result, certain coastal and riverside areas have a higher climate change exposure level than other regions. Subsequently, the climate change drivers would also impact water body and vegetation conditions within the urban area, especially in the eastern coastal area where the influence of climate change is significantly stronger than that in the western inland suburbs. (2) With respect to the “drivers” of urbanization, in contrast, the values of vulnerability components changed everywhere under the impact of urbanization. The resident population in Shanghai has risen markedly because the ageing population has grown within the urban area. Additionally, obvious changes in the land-use types have occurred, especially in suburban areas. Consequently, in the suburbs the rising industrialization level has decreased the proportion of the agricultural economy and the unemployment rate. Under these processes, the levels of exposure and sensitivity have increased in the city center and inner suburbs, while the adaptability level in the outer suburbs, especially the western suburbs, has improved as a result of urbanization from 2006 to 2013. These differences led to different development characteristics between the eastern and western suburbs.
5.3. Distribution of Areas of High Vulnerability to Climate Change and the Main Associated Problems
Although the spatial distribution of vulnerability in the suburbs has undergone dramatic changes, the high-grade values have not changed significantly, indicating that urbanization during this period did not optimize these high-vulnerability regions effectively under the impact of climate change. It is important to determine the areas of these high-value regions and explore the reasons for the formation of the high vulnerability levels.
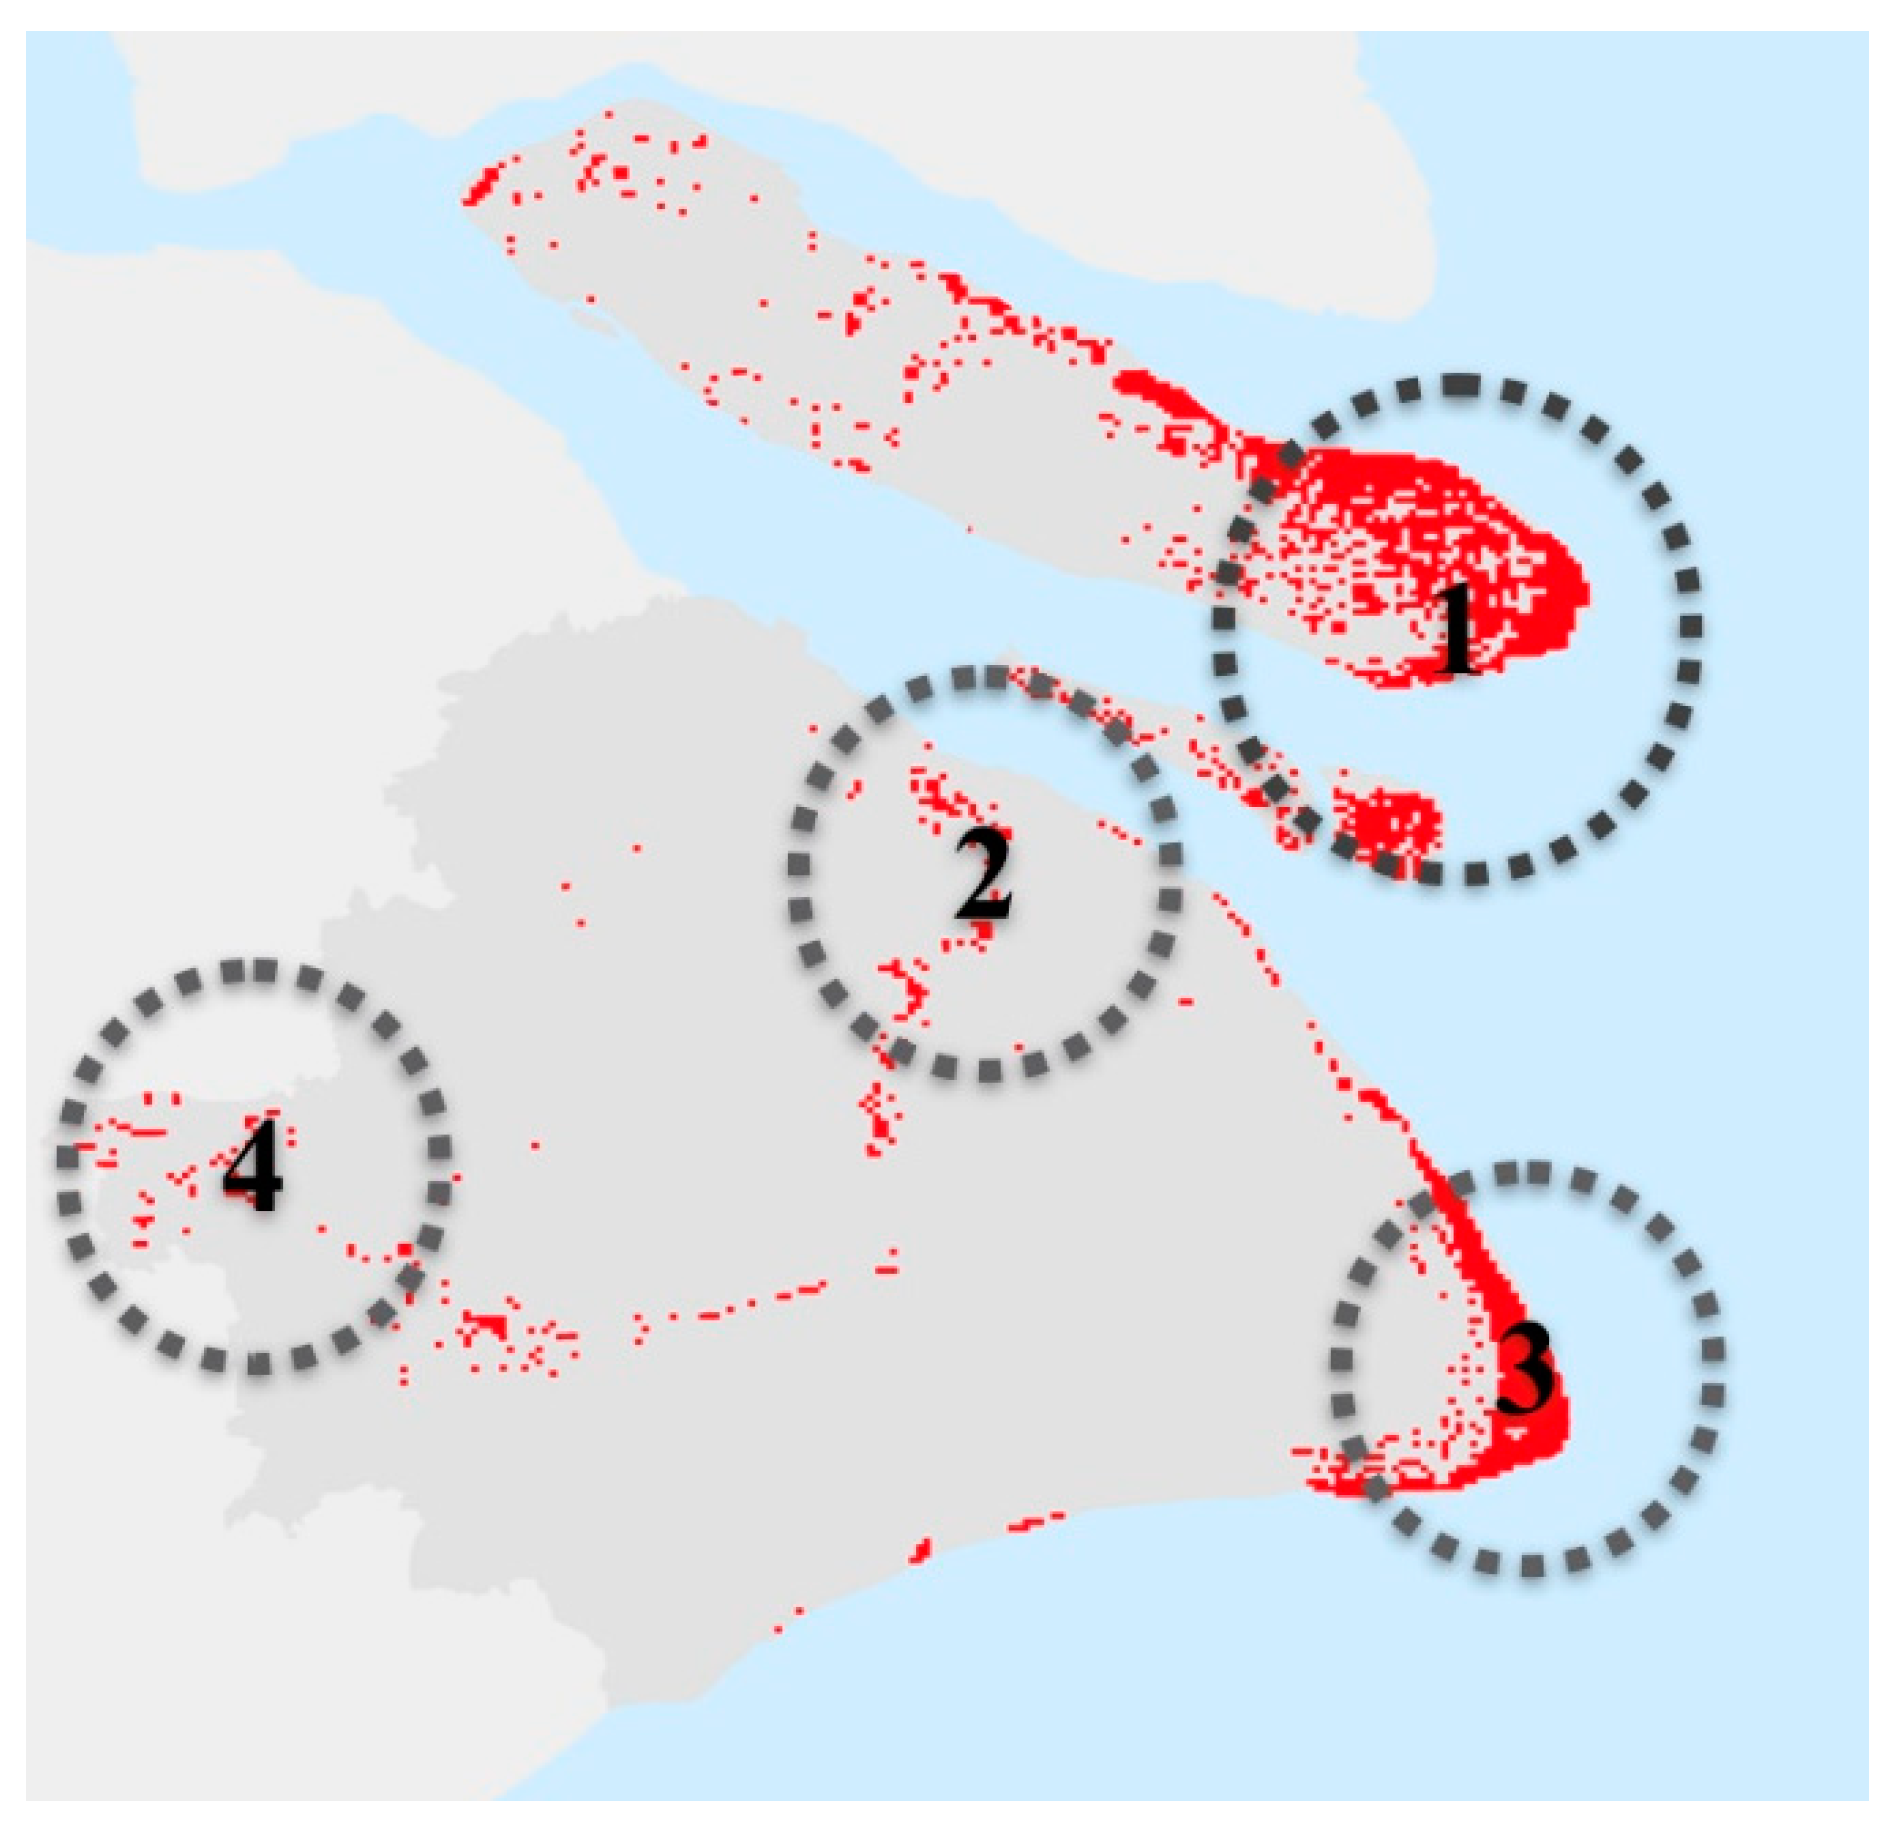
Using the field calculation tool in ArcGIS, we selected the areas where the vulnerability values were greater than 3 in both years. As shown in Figure 9, these areas were mainly distributed in four regions: (1) the eastern part of Chongming Island, (2) the city center on the both sides of the Huangpu River, (3) the southeast corner of the coast, and (4) the area surrounding Dianshan Lake.
The problems in these regions are apparent, and the type of problems they face are different based on the local research.
- (1)
- The eastern part of Chongming Island: Because of the high sensitivity and low adaptability, the overall vulnerability level in this area is relatively high. This result is consistent with the results of related ecological studies [58,59]. Due to sea level rise, the coastal zone has eroded and the tidal flat wetlands have been decreasing, which has had an impact on the local wetland’s vegetation structure and temporal and spatial distributions.
- (2)
- The city center on both sides of the Huangpu River: Climate change and sea level rise will increase the intensity of storm surges, causing the Huangpu River to fill with saltwater and influence the urban areas [60].
- (3)
- The southeast corner of the coast: Consistent with the results of related research [61], the increases in the seawater temperature and the dissolved CO2 concentration in seawater will lead to acidification of marine water, changing the composition of the water. In recent years, typhoons have occurred, and the rising water level will result in increases in the frequency and intensity of storm tides, which will significantly affect the ecological safety of this region.
- (4)
- The area surrounding Dianshan Lake: Eutrophication is the main problem facing Dianshan Lake. In the future, increasing temperatures may increase the growth of algae in rivers and lakes, expand the area of eutrophic water, and significantly affect the water quality and the surrounding water environment. This problem was also identified in a related study [62].
5.4. Limitations
In the selection of research years, the study mainly considered two years to represent the middle and late stages of urbanization in Shanghai. By studying a year at the beginning of urbanization, we could explore the process of climate change throughout the process of urbanization. However, due to limited data availability, evaluations of earlier years in Shanghai were not completed, which can be further considered in other areas. In general, this study uses a relatively direct method to calculate vulnerability to climate change, but it does not consider the impact of climate change in future scenarios after urbanization continues to advance.
To focus the scope of the results of this study and to apply this method to other urban regional studies, only data that could be freely obtained at the urban scale were selected for this study. Therefore, the data sources could be supplemented for studies of other regions based on the actual conditions.
The integrated urban environment is a complex and interacting system, but this evaluation does not reflect the interactions among numerous factors. In addition, the classification methods for each index in this study focus on reflecting the contrast between the two years, which may not be appropriate for studies that focus on a single year.
6. Conclusions
The vulnerability framework from the IPCC can provide accurate descriptions of climate change problems, whereas the vulnerability concept does not reflect the complex interactions between nature and society in urban areas, and it cannot reflect the complete process of the influence of climate change on urban systems. Additionally, the DPSIR framework offers a model that provides a useful tool with which to organize interacting information related to both human activities and environmental changes under the process of climate change. Connecting these two frameworks makes the complexity of the urban system more intuitive, and the interactions between natural conditions and human activities can be visualized.
Vulnerability evaluation results showed that the impact of climate change is a gradual process that is associated with dramatic changes in human activities. The “drivers” of climate change and urbanization cause the influence process to have different spatial characteristics. Finally, the overall vulnerability index increased significantly, and the spatial distributions in different regions showed distinctive characteristics, which can be summarized as follows: (1) the regions with high vulnerability values underwent no significant changes due to the impacts of climate change. (2) The suburbs are the main areas of significant change due to the impact of urbanization, and this impact process would be diverse in different suburbs because of the various natural and social backgrounds among suburbs.
Through the discussion of three spatial variations (exposure, sensitivity, and adaptability), it can be concluded that exposure rise is the main reason for vulnerability changes in this period. The specific reasons for regional changes are different: in most southeastern suburban areas, the intensity of human activities has significantly increased. The degree of exposure and sensitivity has been enhanced so that the overall vulnerability level has been significantly increased. In Qingpu and other parts of the inland region, values of exposure and sensitivity increased little for the stability of the natural ecosystem. Meanwhile, urbanization promoted economic development and increased the adaptability of these regions; thus, the trend of the overall vulnerability level has decreased. With the development of future urbanization, the vulnerability level is bound to rise. The existing urban planning, however, lacks attention to the environmental problems in suburbs. With the further population increase in these areas, strategies for coping with climate change will become important. These findings should not lead to the conclusion that an inevitably negative correlation exists between urbanization and climate change vulnerability across various sensitivity and capacity factors, which is different from the results of other studies [63,64]. In this case, a wide array of capacity-enhancing effects from urbanization can be found, particularly in suburban areas. Similar conclusions were reached in other studies, which have noted that on aggregate, urban areas are leading the development process and, thus, shaping the adaptive capacity of many urban areas [39]. However, in cases where rapid urbanization is not matched by economic growth, the challenges from climate change can be tremendous [64], such as in the inner suburbs in this study.
In this study, we enriched the concept of urban climate change vulnerability by incorporating the DPSIR framework to accurately reflect the background of rapid urbanization and climate change. More importantly, the DPSIR model offers a more comprehensive perspective to analyze the impacts of climate change. This model can also help reflect the interaction of climate change and urbanization processes when we conduct studies in different years, a capability that is lacking in the framework of vulnerability assessments.
In future research, we plan to study an additional year that represents the early stage of urbanization to fully understand the spatial evolution of climate change vulnerability during the urbanization process. In addition, we will analyze aspects of Shanghai’s specific socio-economic data, such as industrial pollutant emission data, to elucidate the interaction between climate change and social and economic activities. This issue is closely related to human health and has been examined in related studies (Fang et al. 2013, Sohail et al. 2018). Future research will verify spatial results according to the incidence of deaths due to related diseases in order to optimize the existing index selection and evaluation methods and clarify the spatial distributions of the different vulnerability levels.
Author Contributions
W.M. and Y.W. conceived and designed the experiments; C.H. performed the experiments; C.H. and L.Z. analyzed the data; Y.W. contributed materials; C.H. and W.M. wrote the paper.
Funding
This work was jointly funded by the National Key R&D Program of China (2016YFC0502706), Humanities and Social Sciences projects of the Ministry of Education of China (12YJCZH208) and National Natural Science Foundation of China (41201544).
Conflicts of Interest
The authors declare no conflict of interest.
Appendix A

Table A1.
Data sources and processing methods for each index.
| Component | Indicators | Source | Calculation Method |
|---|---|---|---|
| Exposure | Sea level rise | Shutter Radar Topographic Mission | Using a digital elevation model (DEM) with a 30-meter resolution to identify coastal and low-lying areas; the values below sea level represent the exposure level to sea level rise. |
| Land surafce temperature (LST) | Landsat TM/ETM | Through the retrieval algorithm of LST, the band information of Landsat images is converted to LST. The higher the LST is, the higher the exposure. | |
| Proportion of industrial output | National economy and social development bulletins from every district | The values are assigned to the spatial extent of each district with the ArcGIS spatial analyst tool. The higher the industrial development is, the higher the exposure. | |
| Population increase | Shanghai statistical yearbook | The calculation method is the same as for “Development of Industry”. The higher the population per unit area is, the higher the degree of vulnerability. | |
| Urban land-use type | Landsat TM/ETM | The spatial distributions of different land-use types are obtained through ENVI’s spatial algorithm tools. Each land type is provided with a different vulnerability rank: forest and shrub grass land—1, farmland—2, lakes and rivers—3, bare land—4, and artificial surfaces—5. | |
| Water body distribution | Landsat TM/ETM | Using ArcGIS’s multi-loop buffer tool, the study area is divided into different distances from bodies of water. The closer a site is to a body of water, the higher the vulnerability level. | |
| Sensitivity | Water quality | Water resource quality-zoning ma | The water quality distribution map is vectored through ArcGIS; the worse the water quality is, the higher the vulnerability level of the body of water. |
| Vegetation coverage | Standard deviation of normalized difference vegetation index (NDVI) | Data from March, June, September, and December of 2006 and 2013 are averaged for each year, and the spatial results are standardized into five levels. The lower the NDVI is, the higher the vulnerability level. | |
| Unemployment rate | National economy and social development bulletins from every district | The unemployment rate is divided into five categories by the natural discontinuity method. The higher the rate is, the higher the vulnerability level. | |
| Elderly population ratio | Shanghai Statistical Yearbook | The proportion of the elderly population is calculated for each district. After standardization, the data of each district are put into the grid. The higher the ratio is, the higher the vulnerability level. | |
| Proportion of agricultural output | National economy and social development bulletins from every district | The higher the proportion is, the higher the vulnerability level. | |
| Adaptive Capacity | Average financial incomes | Shanghai Statistical Yearbook | The proportions of the average financial incomes are divided into five categories by the natural discontinuity method. The lower the proportion is, the higher the vulnerability level. |
| Support for science and technology | National economy and social development bulletins from every district | The comportment is divided into five categories by the natural discontinuity method. The lower the total is, the higher the vulnerability level. |
References
- Kirshen, P.; Ruth, M.; Anderson, W. Interdependencies of urban climate change impacts and adaptation strategies: A case study of Metropolitan Boston USA. Clim. Chang. 2008, 86, 105–122. [Google Scholar] [CrossRef]
- Wilby, R.L.; Perry, G.L.W. Climate change, biodiversity and the urban environment: A critical review based on London, UK. Prog. Phys. Geogr. 2006, 30, 73–98. [Google Scholar] [CrossRef]
- Zeng, W.; Lao, X.; Rutherford, S.; Xu, Y.; Xu, X.; Lin, H.; Liu, T.; Luo, Y.; Xiao, J.; Hu, M.; et al. The effect of heat waves on mortality and effect modifiers in four communities of Guangdong Province, China. Sci. Total Environ. 2014, 482–483, 214–221. [Google Scholar] [CrossRef] [PubMed]
- Chen, K.; Bi, J.; Chen, J.; Chen, X.; Huang, L.; Zhou, L. Influence of heat wave definitions to the added effect of heat waves on daily mortality in Nanjing, China. Sci. Total Environ. 2015, 506–507, 18–25. [Google Scholar] [CrossRef] [PubMed]
- Sun, X.; Sun, Q.; Zhou, X.; Li, X.; Yang, M.; Yu, A.; Geng, F. Heat wave impact on mortality in Pudong New Area, China in 2013. Sci. Total Environ. 2014, 493, 789–794. [Google Scholar] [CrossRef]
- Pandey, A.C.; Singh, S.K.; Nathawat, M.S. Waterlogging and flood hazards vulnerability and risk assessment in Indo Gangetic plain. Nat. Hazards 2010, 55, 273–289. [Google Scholar] [CrossRef]
- Fenner, N.; Freeman, C. Drought-induced carbon loss in peatlands. Nat. Geosci. 2011, 4, 895–900. [Google Scholar] [CrossRef]
- Hallegatte, S.; Ranger, N.; Mestre, O.; Dumas, P.; Corfee-Morlot, J.; Herweijer, C.; Wood, R.M. Assessing climate change impacts, sea level rise and storm surge risk in port cities: A case study on Copenhagen. Clim. Chang. 2011, 104, 113–137. [Google Scholar] [CrossRef]
- Hubbert, G.D.; Mclnnes, K.L. A Storm Surge Inundation Model for Coastal Planning and Impact Studies. J. Coast. Res. 1999, 15, 168–185. [Google Scholar]
- Islam, M.S.; Swapan, M.S.H.; Haque, S.M. Disaster risk index: How far should it take account of local attributes? Int. J. Disast. Risk Reduct. 2013, 3, 76–87. [Google Scholar] [CrossRef]
- Hallegatte, S.; Corfee-Morlot, J. Understanding climate change impacts, vulnerability and adaptation at city scale: An introduction. Clim. Chang. 2011, 104, 1–12. [Google Scholar] [CrossRef]
- Romero-Lankao, P.; Qin, H.; Dickinson, K. Urban vulnerability to temperature-related hazards: A meta-analysis and meta-knowledge approach. Glob. Environ. Chang. 2012, 22, 670–683. [Google Scholar] [CrossRef]
- Rees, W.E. Can Third-World cities survive globalization? Cities in a globalizing world: Global report on human settlements 2001. Build. Res. Inf. 2002, 30, 212–214. [Google Scholar] [CrossRef]
- Lankao, P.R.; Qin, H. Conceptualizing urban vulnerability to global climate and environmental change. Curr. Opin. Environ. Sustain. 2011, 3, 142–149. [Google Scholar] [CrossRef]
- Fussel, H.M.; Klein, R.J.T. Climate change vulnerability assessments: An evolution of conceptual thinking. Clim. Chang. 2006, 75, 301–329. [Google Scholar] [CrossRef]
- Abid, M.; Schilling, J.; Scheffran, J.; Zulfiqar, F. Climate change vulnerability, adaptation and risk perceptions at farm level in Punjab, Pakistan. Sci. Total Environ. 2016, 547, 447–460. [Google Scholar] [CrossRef]
- McCormick, S. Assessing climate change vulnerability in urban America: Stakeholder-driven approaches. Clim. Chang. 2016, 138, 397–410. [Google Scholar] [CrossRef]
- Bouroncle, C.; Imbach, P.; Rodriguez-Sanchez, B.; Medellin, C.; Martinez-Valle, A.; Laderach, P. Mapping climate change adaptive capacity and vulnerability of smallholder agricultural livelihoods in Central America: Ranking and descriptive approaches to support adaptation strategies. Clim. Chang. 2017, 141, 123–137. [Google Scholar] [CrossRef]
- IPCC. IPCC, 2014: Climate Change 2014: Synthesis Report; Cambridge University: Cambridge, UK, 2014. [Google Scholar]
- El-Zein, A.; Tonmoy, F.N. Assessment of vulnerability to climate change using a multi-criteria outranking approach with application to heat stress in Sydney. Ecol. Indic. 2015, 48, 207–217. [Google Scholar] [CrossRef]
- Fallmann, J.; Wagner, S.; Emeis, S. High resolution climate projections to assess the future vulnerability of European urban areas to climatological extreme events. Theor. Appl. Climatol. 2017, 127, 667–683. [Google Scholar] [CrossRef]
- Aubrecht, C.; Ozceylan, D.; Steinnocher, K.; Freire, S. Multi-level geospatial modeling of human exposure patterns and vulnerability indicators. Nat. Hazards 2013, 68, 147–163. [Google Scholar] [CrossRef]
- Tapia, C.; Abajo, B.; Feliu, E.; Mendizabal, M.; Martinez, J.A.; Fernandez, J.G.; Laburu, T.; Lejarazu, A. Profiling urban vulnerabilities to climate change: An indicator-based vulnerability assessment for European cities. Ecol. Indic. 2017, 78, 142–155. [Google Scholar] [CrossRef]
- Wan, J.Z.; Wang, C.J.; Qu, H.; Liu, R.; Zhang, Z.X. Vulnerability of forest vegetation to anthropogenic climate change in China. Sci. Total Environ. 2018, 621, 1633–1641. [Google Scholar] [CrossRef]
- Lioubimtseva, E. A multi-scale assessment of human vulnerability to climate change in the Aral Sea basin. Environ. Earth Sci. 2015, 73, 719–729. [Google Scholar] [CrossRef]
- Kim, Y.; Chung, E.S. Assessing climate change vulnerability with group multi-criteria; decision making approaches. Clim. Chang. 2013, 121, 301–315. [Google Scholar] [CrossRef]
- Schroth, G.; Laderach, P.; Martinez-Valle, A.I.; Bunn, C.; Jassogne, L. Vulnerability to climate change of cocoa in West Africa: Patterns, opportunities and limits to adaptation. Sci. Total Environ. 2016, 556, 231–241. [Google Scholar] [CrossRef] [Green Version]
- Hu, Q.S.; He, X.R. An Integrated Approach to Evaluate Urban Adaptive Capacity to Climate Change. Sustainability 2018, 10, 1272. [Google Scholar] [CrossRef]
- Phillis, Y.A.; Grigoroudis, E.; Kouikoglou, V.S. Sustainability ranking and improvement of countries. Ecol. Econ. 2011, 70, 542–553. [Google Scholar] [CrossRef]
- Alam, G.M. Livelihood Cycle and Vulnerability of Rural Households to Climate Change and Hazards in Bangladesh. Environ. Manag. 2017, 59, 777–791. [Google Scholar] [CrossRef] [PubMed]
- Turner, B.L.; Kasperson, R.E.; Matson, P.A.; McCarthy, J.J.; Corell, R.W.; Christensen, L.; Eckley, N.; Kasperson, J.X.; Luers, A.; Martello, M.L.; et al. A framework for vulnerability analysis in sustainability science. Proc. Natl. Acad. Sci. USA 2003, 100, 8074–8079. [Google Scholar] [CrossRef] [PubMed] [Green Version]
- Knights, A.M.; Koss, R.S.; Robinson, L.A. Identifying common pressure pathways from a complex network of human activities to support ecosystem-based management. Ecol. Appl. 2013, 23, 755–765. [Google Scholar] [CrossRef] [PubMed]
- Mills, J.H.; Waite, T.A. Economic prosperity, biodiversity conservation, and the environmental Kuznets curve. Ecol. Econ. 2009, 68, 2087–2095. [Google Scholar] [CrossRef]
- Carr, E.R.; Wingard, P.M.; Yorty, S.C.; Thompson, M.C.; Jensen, N.K.; Development, J.R.; Ecology, W. Applying DPSIR to sustainable development. Int. J. Sustain. Dev. World Ecol. 2007, 14, 543–555. [Google Scholar] [CrossRef] [Green Version]
- Scheren, P.A.G.M.; Kroeze, C.; Janssen, F.J.; Hordijk, L.; Ptasinski, K.J. Integrated water pollution assessment of the Ebrié Lagoon, Ivory Coast, West Africa. J. Mar. Syst. 2004, 44, 1–17. [Google Scholar] [CrossRef]
- Pires, A.; Morato, J.; Peixoto, H.; Botero, V.; Zuluaga, L.; Figueroa, A.J. Sustainability Assessment of indicators for integrated water resources management. Sci. Total Environ. 2016, 578, 139–147. [Google Scholar] [CrossRef]
- Gregory, A.J.; Atkins, J.P.; Burdon, D.; Elliott, M. A problem structuring method for ecosystem-based management: The DPSIR modelling process. Eur. J. Oper. Res. 2013, 227, 558–569. [Google Scholar] [CrossRef]
- Bai, X.M.; Surveyer, A.; Elmqvist, T.; Gatzweiler, F.W.; Guneralp, B.; Parnell, S.; Prieur-Richard, A.H.; Shrivastava, P.; Siri, J.G.; Stafford-Smith, M.; et al. Defining and advancing a systems approach for sustainable cities. Curr. Opin. Environ. Sustain. 2016, 23, 69–78. [Google Scholar] [CrossRef]
- Garschagen, M.; Romero-Lankao, P. Exploring the relationships between urbanization trends and climate change vulnerability. Clim. Chang. 2015, 133, 37–52. [Google Scholar] [CrossRef]
- He, J.Q.; Wang, S.J.; Liu, Y.Y.; Ma, H.T.; Liu, Q.Q. Examining the relationship between urbanization and the eco-environment using a coupling analysis: Case study of Shanghai, China. Ecol. Indic. 2017, 77, 185–193. [Google Scholar] [CrossRef]
- Quan, R.S. Risk assessment of flood disaster in Shanghai based on spatial-temporal characteristics analysis from 251 to 2000. Environ. Earth Sci. 2014, 72, 4627–4638. [Google Scholar] [CrossRef]
- Challinor, A.; Wheeler, T.; Garforth, C.; Craufurd, P.; Kassam, A.J. Assessing the vulnerability of food crop systems in Africa to climate change. Clim. Chang. 2007, 83, 381–399. [Google Scholar] [CrossRef] [Green Version]
- Adger, W.N. Vulnerability. Glob. Environ. Chang. 2006, 16, 268–281. [Google Scholar] [CrossRef]
- Thorne, J.H.; Choe, H.; Stine, P.A.; Chambers, J.C.; Holguin, A.; Kerr, A.C.; Schwartz, M.W. Climate change vulnerability assessment of forests in the Southwest USA. Clim. Chang. 2018, 148, 387–402. [Google Scholar] [CrossRef]
- Gentle, P.; Thwaites, R.; Race, D.; Alexander, K.; Maraseni, T. Household and community responses to impacts of climate change in the rural hills of Nepal. Clim. Chang. 2018, 147, 267–282. [Google Scholar] [CrossRef]
- Maxim, L.; Spangenberg, J.H.; O’Connor, M. An analysis of risks for biodiversity under the DPSIR framework. Ecol. Econ. 2009, 69, 12–23. [Google Scholar] [CrossRef]
- Borja, Á.; Galparsoro, I.; Solaun, O.; Muxika, I.; Tello, E.M.; Uriarte, A.; Valencia, V.; Science, S. The European Water Framework Directive and the DPSIR, a methodological approach to assess the risk of failing to achieve good ecological status. Estuar. Coast. Shelf Sci. 2006, 66, 84–96. [Google Scholar] [CrossRef]
- Atkins, J.P.; Burdon, D.; Elliott, M.; Gregory, A.J. Management of the marine environment: Integrating ecosystem services and societal benefits with the DPSIR framework in a systems approach. Mar. Pollut. Bull. 2011, 62, 215–226. [Google Scholar] [CrossRef] [PubMed]
- Bär, R.; Rouholahnejad, E.; Rahman, K.; Abbaspour, K.C.; Lehmann, A. Policy. Climate change and agricultural water resources: A vulnerability assessment of the Black Sea catchment. Environ. Sci. Policy 2015, 46, 57–69. [Google Scholar] [CrossRef]
- Miller, F.; Osbahr, H.; Boyd, E.; Thomalla, F.; Bharwani, S.; Ziervogel, G.; Walker, B.; Birkmann, J.; van der Leeuw, S.; Rockstrom, J.; et al. Resilience and Vulnerability: Complementary or Conflicting Concepts? Ecol. Soc. 2010, 15, 1–25. [Google Scholar] [CrossRef]
- Kumar, P.; Geneletti, D.; Nagendra, H. Spatial assessment of climate change vulnerability at city scale: A study in Bangalore, India. Land Use Policy 2016, 58, 514–532. [Google Scholar] [CrossRef]
- Harrison, P.A.; Dunford, R.; Savin, C.; Rounsevell, M.D.A.; Holman, I.P.; Kebede, A.S.; Stuch, B. Cross-sectoral impacts of climate change and socio-economic change for multiple, European land- and water-based sectors. Clim. Chang. 2015, 128, 279–292. [Google Scholar] [CrossRef]
- Liu, X.; Wu, Z.; Xu, H.; Zhu, H.; Wang, X.; Liu, Z. Assessment of pollution status of Dalianhu water sources in Shanghai, China and its pollution biological characteristics. Environ. Earth Sci. 2014, 71, 4543–4552. [Google Scholar] [CrossRef]
- Aubrecht, C.; International, Ã. Identification of heat risk patterns in the U.S. National Capital Region by integrating heat stress and related vulnerability. Environ. Int. 2013, 56, 65–77. [Google Scholar] [CrossRef] [PubMed]
- Mann, M.E.; Bradley, R.S.; Hughes, M.K. Northern hemisphere temperatures during the past millennium: Inferences, uncertainties, and limitations. Geophys. Res. Lett. 1999, 26, 759–762. [Google Scholar] [CrossRef] [Green Version]
- Mainali, J.; Pricope, N.G. High-resolution spatial assessment of population vulnerability to climate change in Nepal. Appl. Geogr. 2017, 82, 66–82. [Google Scholar] [CrossRef]
- Pandey, R.; Bardsley, D.K. Social-ecological vulnerability to climate change in the Nepali Himalaya. Appl. Geogr. 2015, 64, 74–86. [Google Scholar] [CrossRef]
- Huang, B.R.; Ouyang, Z.Y.; Zheng, H.; Zhang, H.Z.; Wang, X.K. Construction of an eco-island: A case study of Chongming Island, China. Ocean Coast. Manag. 2008, 51, 575–588. [Google Scholar] [CrossRef] [Green Version]
- Ma, X.; de Jong, M.; den Hartog, H. Assessing the implementation of the Chongming Eco Island policy: What a broad planning evaluation framework tells more than technocratic indicator systems. J. Clean. Prod. 2018, 172, 872–886. [Google Scholar] [CrossRef]
- Sun, Z.Y.; Zhang, C.J.; Yan, H.; Han, C.L.; Chen, L.; Meng, X.Z.; Zhou, Q. Spatiotemporal distribution and potential sources of perfluoroalkyl acids in Huangpu River, Shanghai, China. Chemosphere 2017, 174, 127–135. [Google Scholar] [CrossRef] [PubMed]
- Cheng, H.Q.; Chen, J.Y.; Chen, Z.J.; Ruan, R.L.; Xu, G.Q.; Zeng, G.; Zhu, J.R.; Dai, Z.J.; Chen, X.Y.; Gu, S.H.; et al. Mapping Sea Level Rise Behavior in an Estuarine Delta System: A Case Study along the Shanghai Coast. Engineering 2018, 4, 156–163. [Google Scholar] [CrossRef]
- Cheng, X.; Li, X.P. Long-Term Changes in Nutrients and Phytoplankton Response in Lake Dianshan, a Shallow Temperate Lake in China. J. Freshw. Ecol. 2010, 25, 549–554. [Google Scholar] [CrossRef] [Green Version]
- Birkmann, J.; Garschagen, M.; Kraas, F.; Nguyen, Q. Adaptive urban governance: New challenges for the second generation of urban adaptation strategies to climate change. Sustain. Sci. 2010, 5, 185–206. [Google Scholar] [CrossRef]
- Sudmeier-Rieux, K.; Paleo, U.F.; Garschagen, M.; Estrella, M.; Renaud, F.G.; Jaboyedoff, M. Opportunities, incentives and challenges to risk sensitive land use planning: Lessons from Nepal, Spain and Vietnam. Int. J. Disast. Risk Reduct. 2015, 14, 205–224. [Google Scholar] [CrossRef]
Figure 1.
The drivers-pressures-state-impact-response (DPSIR) model [32]. The grey arrows represent the potential paths of influence by response.
Figure 1.
The drivers-pressures-state-impact-response (DPSIR) model [32]. The grey arrows represent the potential paths of influence by response.
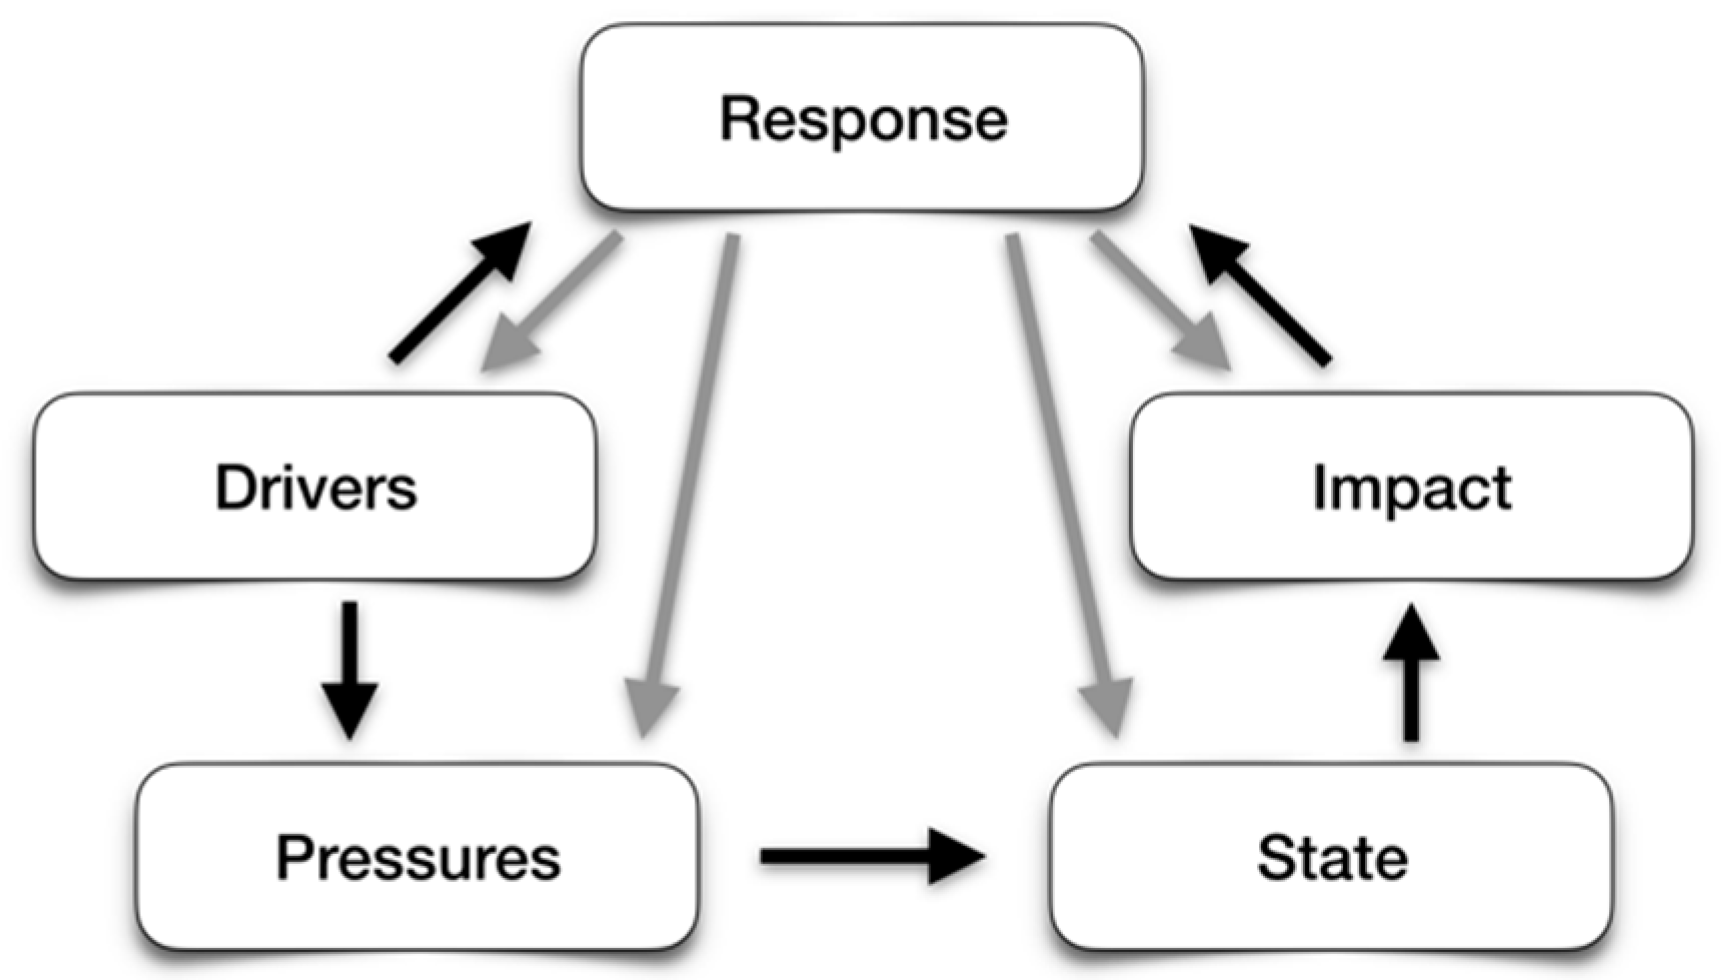
Figure 2.
Schematic of Shanghai, China. (a) The spatial distribution of the districts of Shanghai. (b) Distribution of the annual mean temperature anomalies in Shanghai from 1960 to 2015.
Figure 2.
Schematic of Shanghai, China. (a) The spatial distribution of the districts of Shanghai. (b) Distribution of the annual mean temperature anomalies in Shanghai from 1960 to 2015.
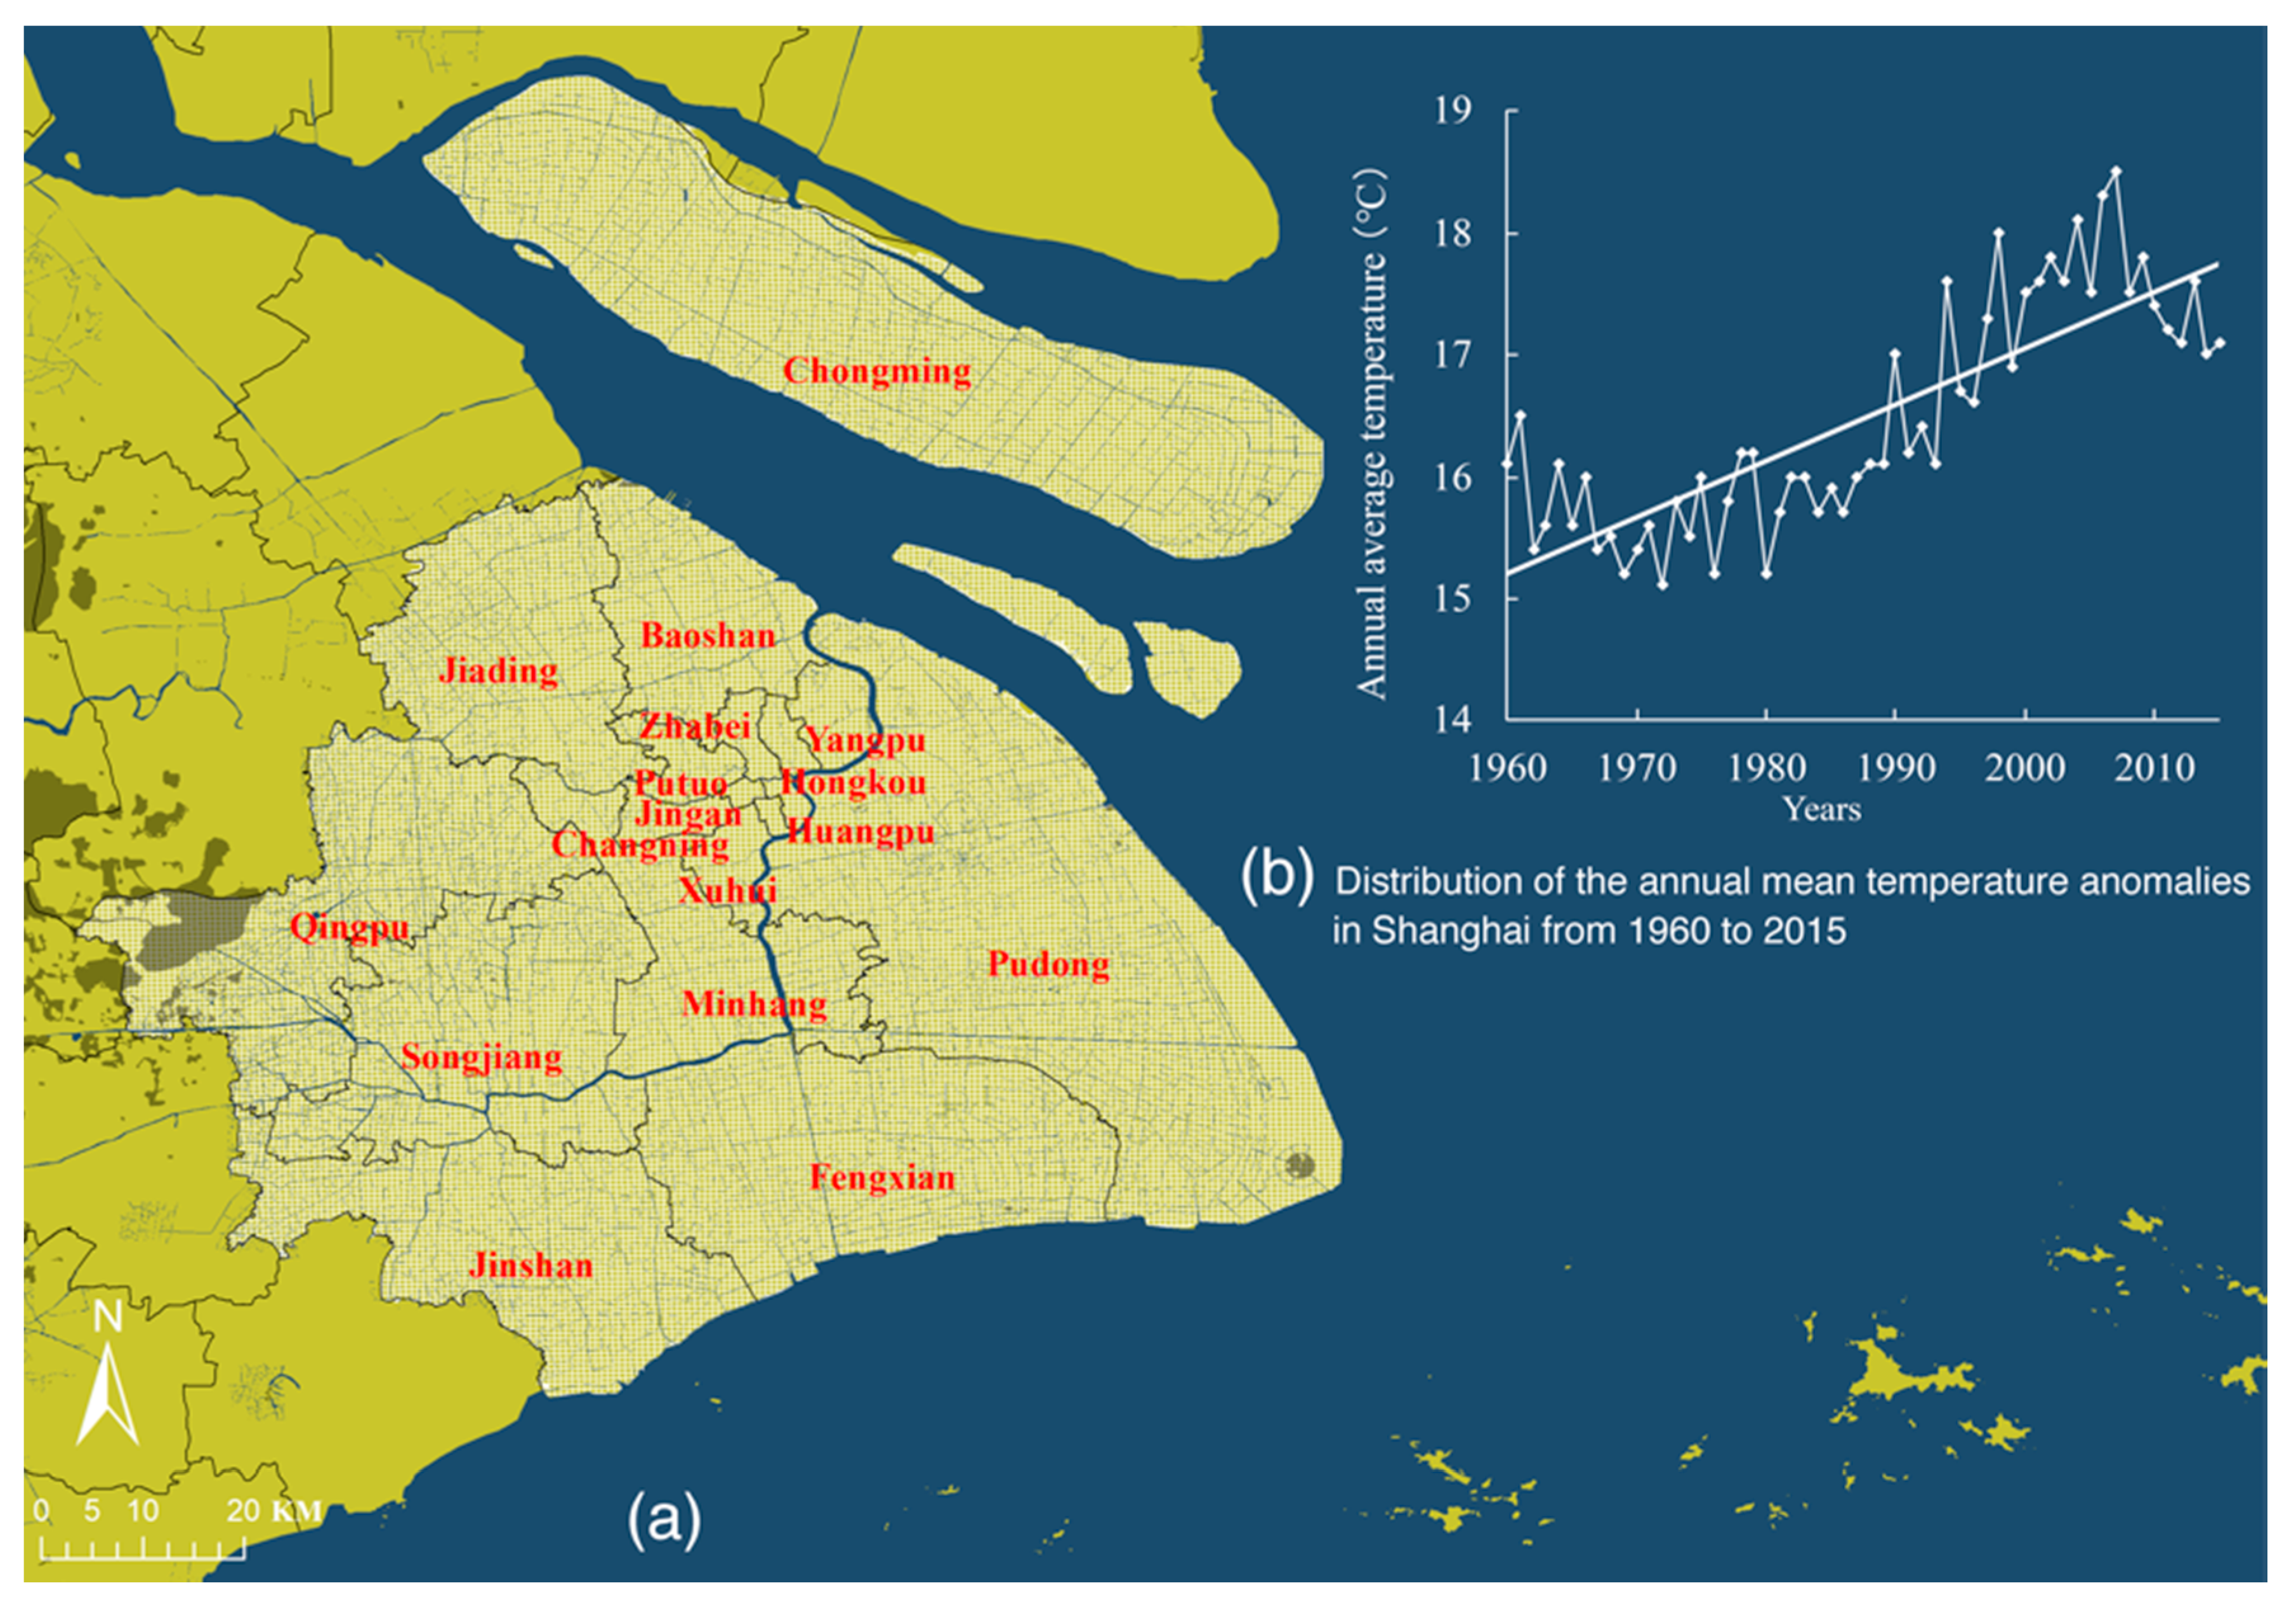
Figure 3.
The artificial surface distribution in the study area in 1987, 1993, and 2013. These results were calculated according to a supervised classification method based on each year’s Landsat MMS, TM, and eight dates, which were obtained from http://www.gscloud.cn/.
Figure 3.
The artificial surface distribution in the study area in 1987, 1993, and 2013. These results were calculated according to a supervised classification method based on each year’s Landsat MMS, TM, and eight dates, which were obtained from http://www.gscloud.cn/.

Figure 4.
Reconstruction of the concepts of climate change vulnerability based on the DPSIR model to provide a detailed structure for urban areas.
Figure 4.
Reconstruction of the concepts of climate change vulnerability based on the DPSIR model to provide a detailed structure for urban areas.
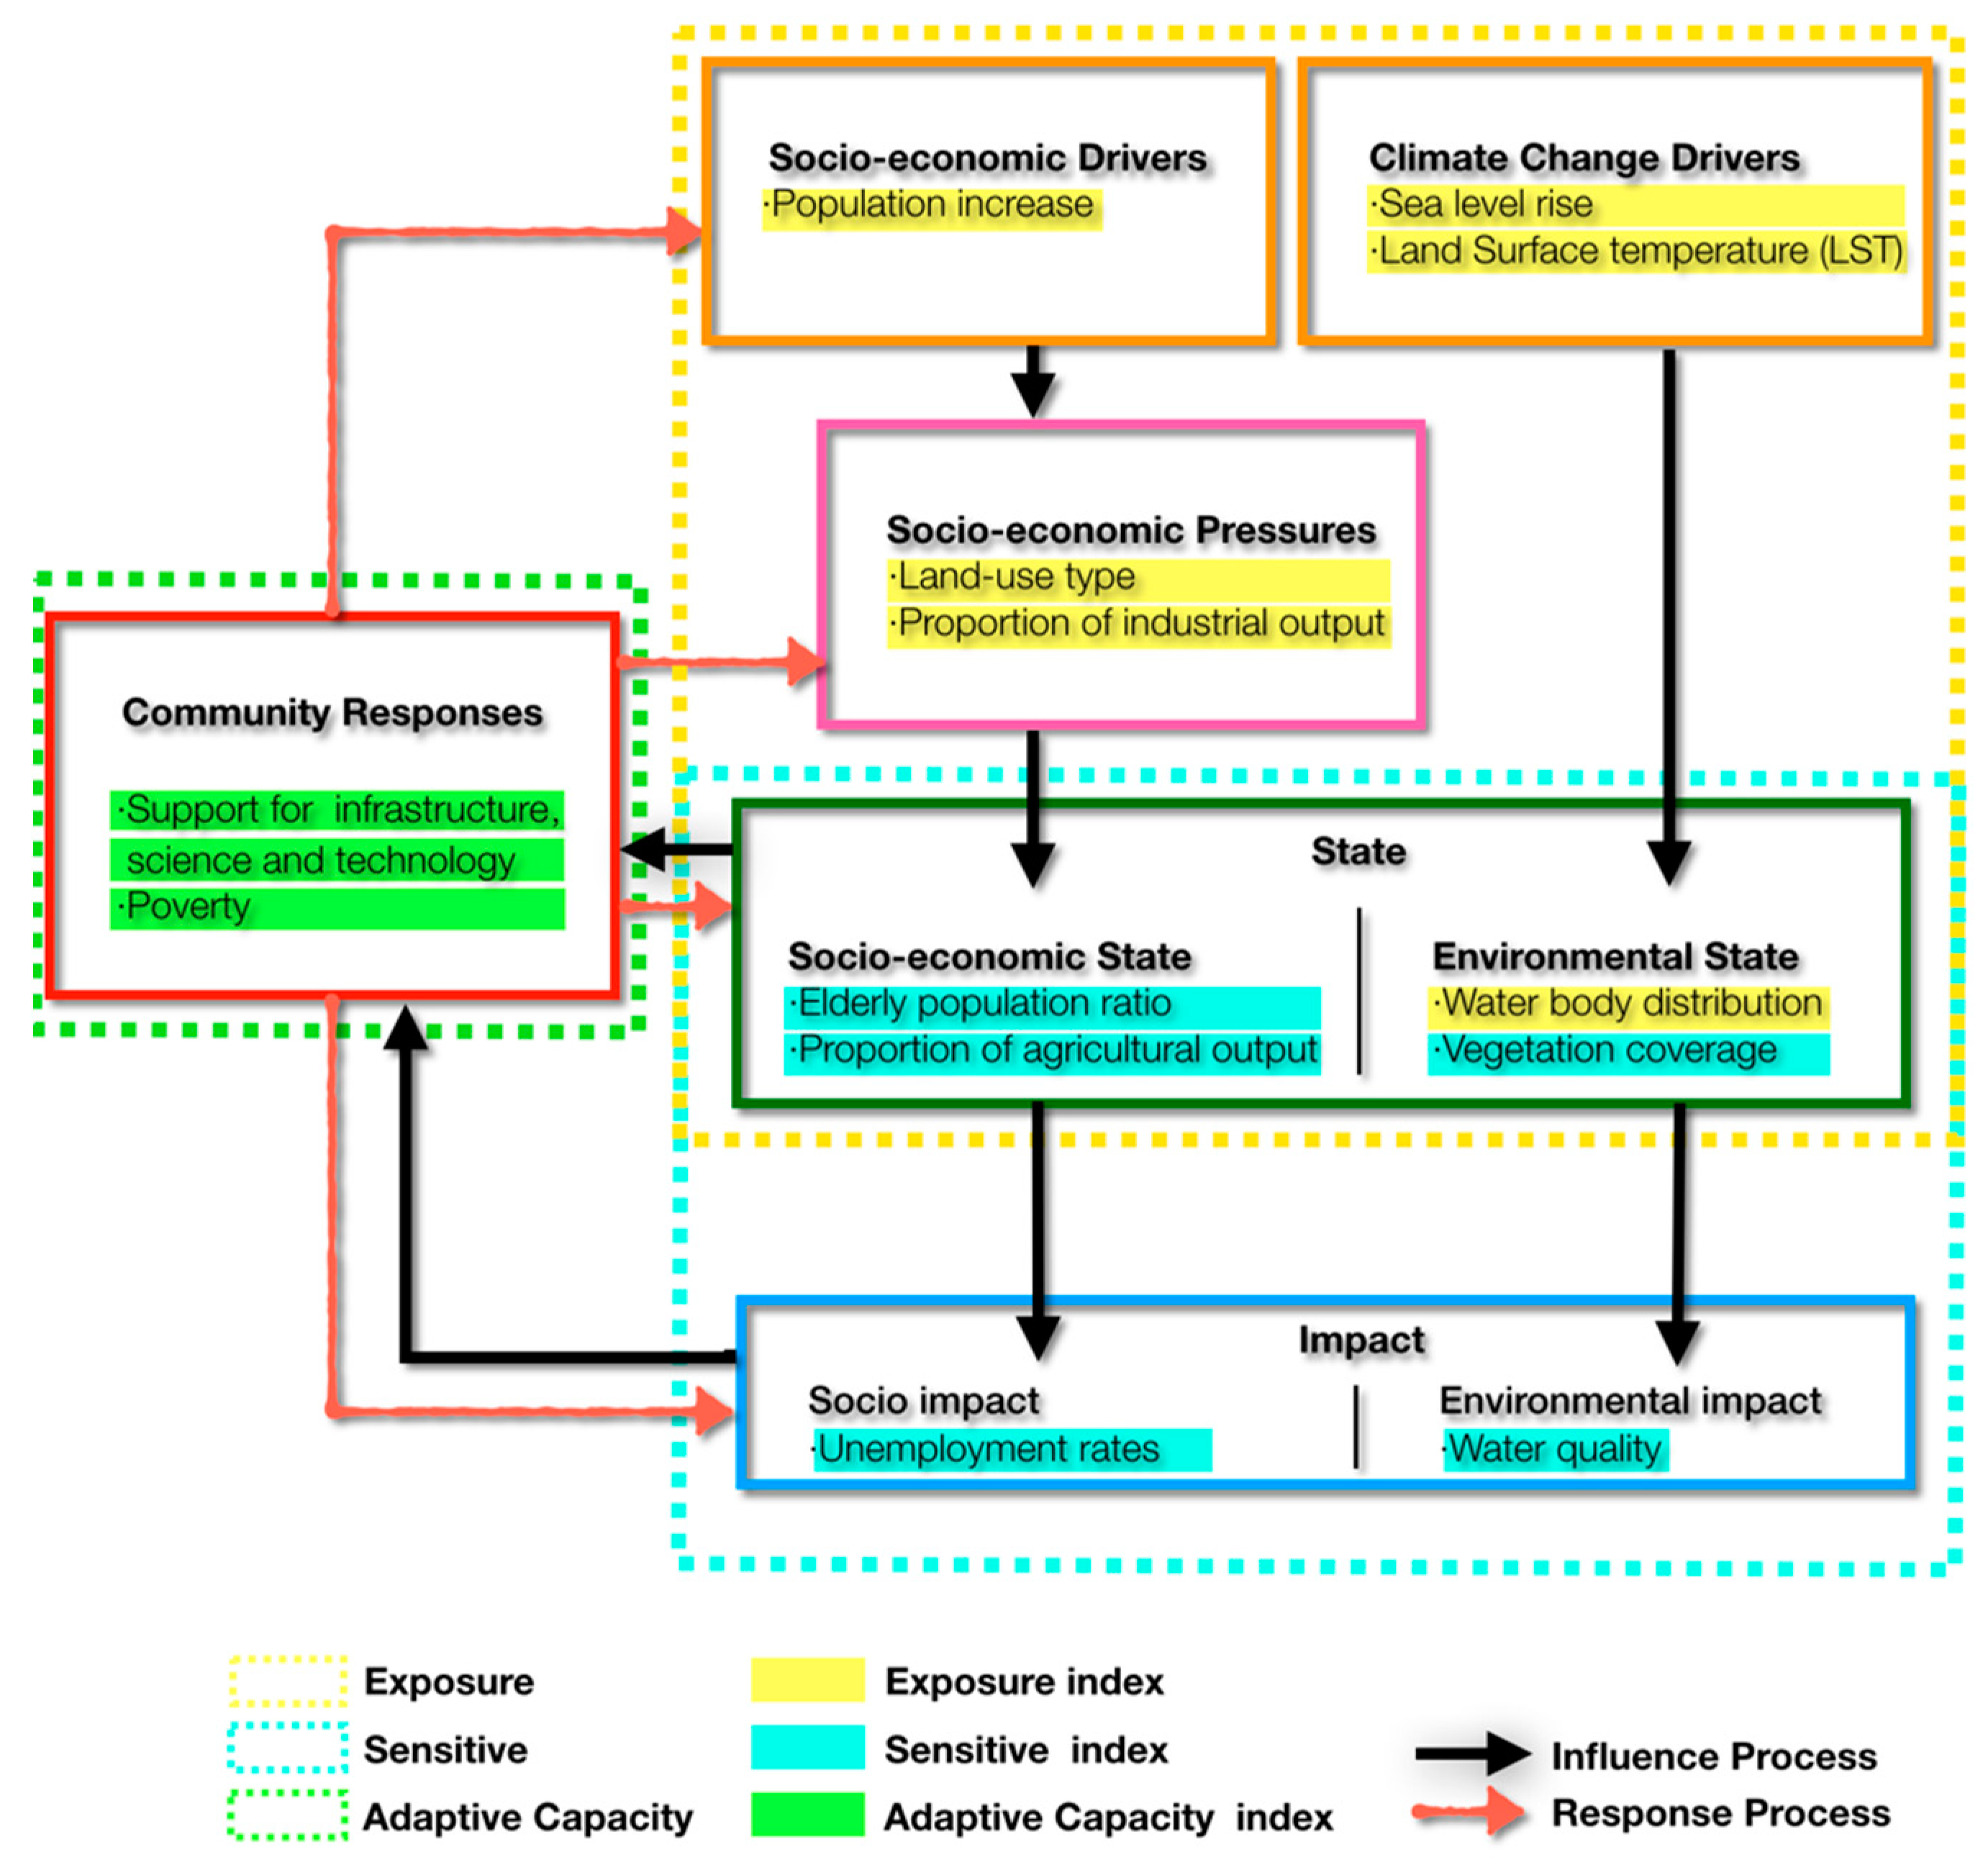
Figure 5.
Patterns of the vulnerability component results. The upper row represents the 2013 results, and the lower row represents the 2006 results. (a) Pattern of exposure; (b) pattern of sensitivity; and (c) pattern of adaptive capacity.
Figure 5.
Patterns of the vulnerability component results. The upper row represents the 2013 results, and the lower row represents the 2006 results. (a) Pattern of exposure; (b) pattern of sensitivity; and (c) pattern of adaptive capacity.
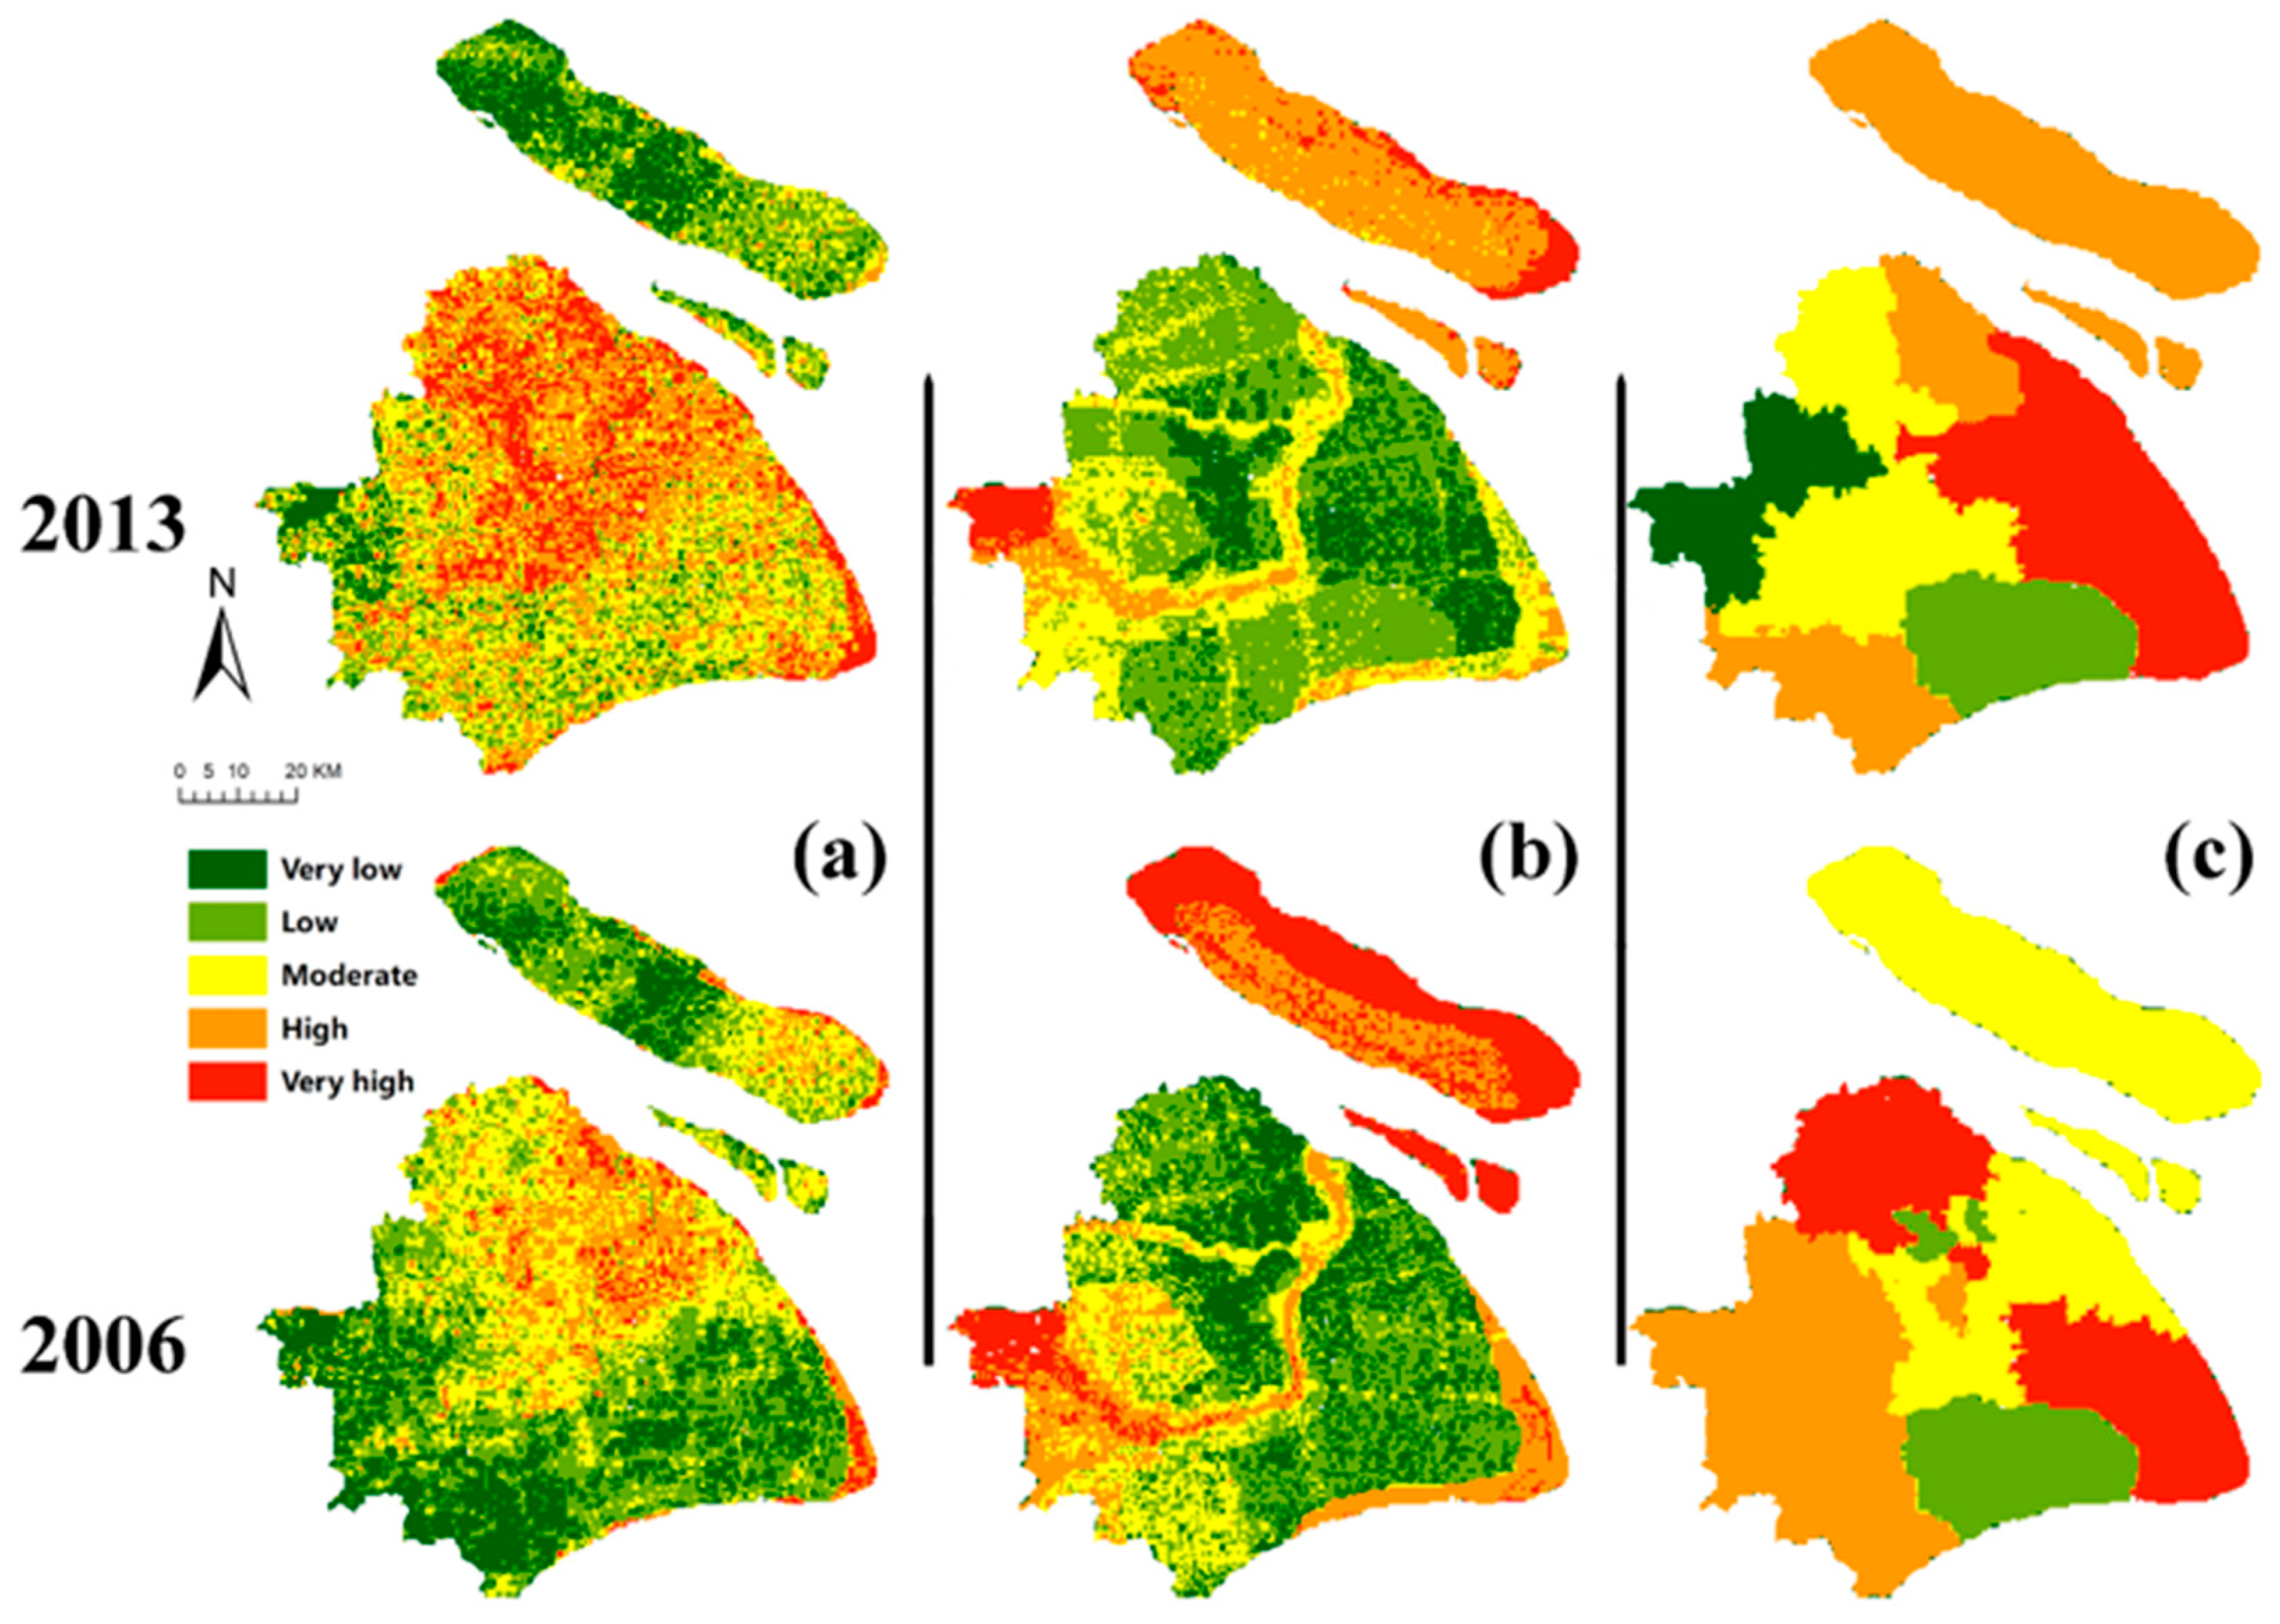
Figure 6.
Results of the climate change vulnerability assessment. (a) Vulnerability results for two years using the same five threshold levels; (b) proportions of areas in each level of vulnerability.
Figure 6.
Results of the climate change vulnerability assessment. (a) Vulnerability results for two years using the same five threshold levels; (b) proportions of areas in each level of vulnerability.
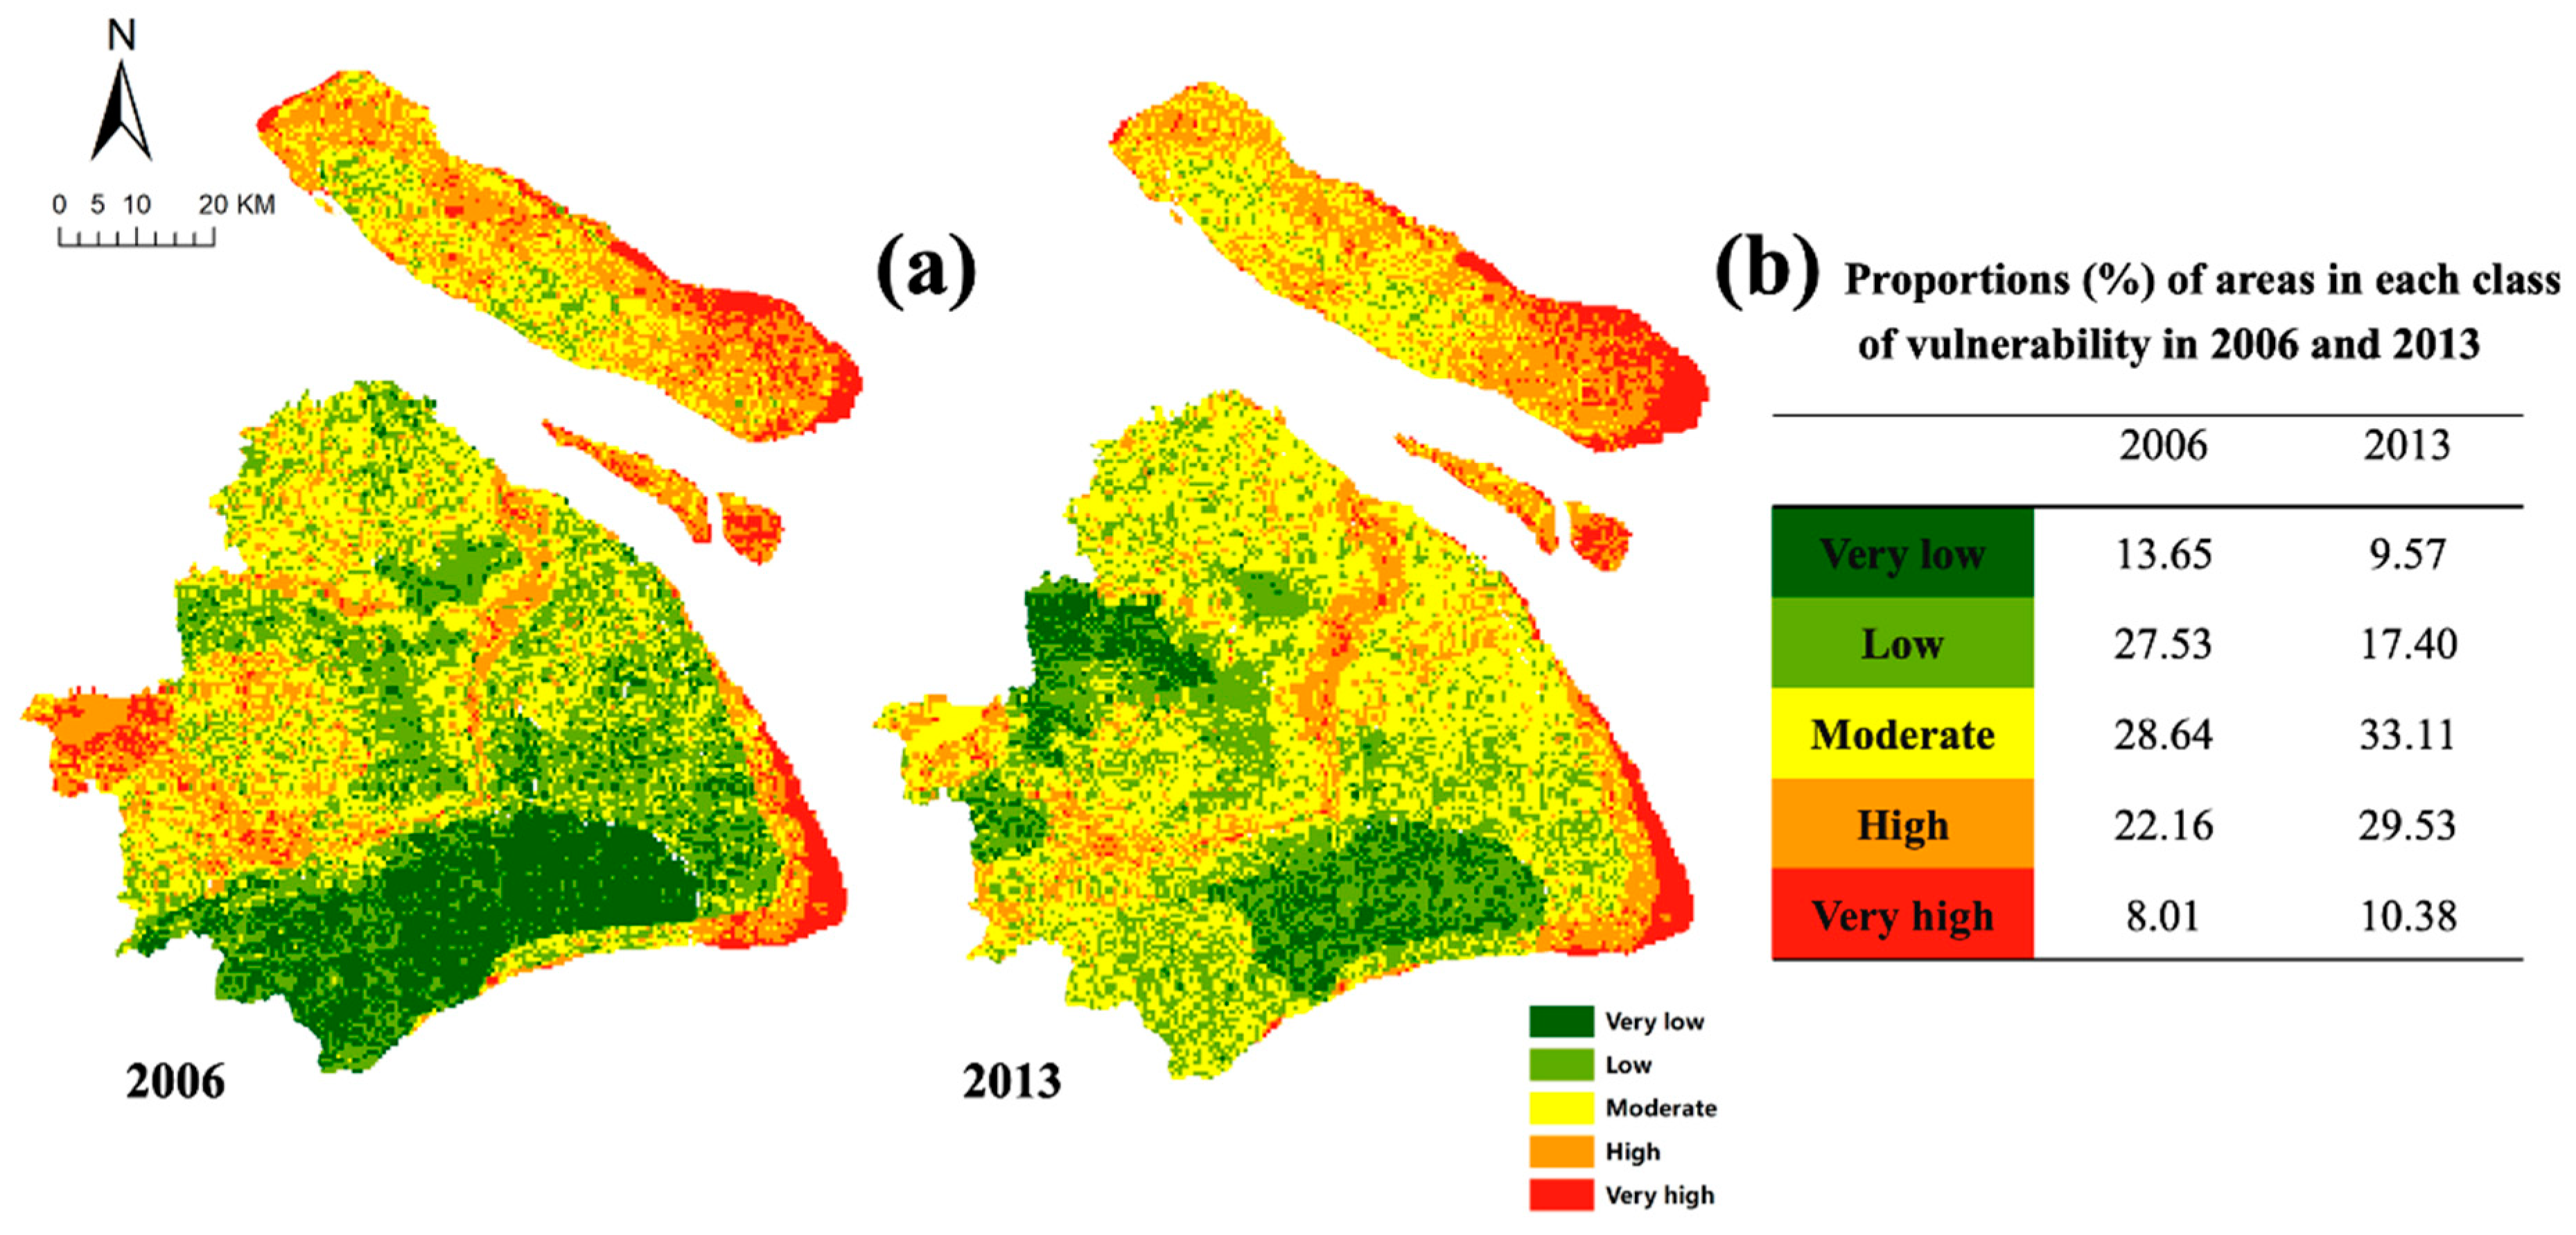
Figure 7.
Box plots of different vulnerability components in 2006 and 2013.

Figure 8.
Spatial distributions of the changes in the vulnerability levels between 2013 and 2006.

Figure 9.
Areas with vulnerability assessment values greater than three in both 2006 and 2013.
© 2019 by the authors. Licensee MDPI, Basel, Switzerland. This article is an open access article distributed under the terms and conditions of the Creative Commons Attribution (CC BY) license (http://creativecommons.org/licenses/by/4.0/).
Share and Cite
MDPI and ACS Style
He, C.; Zhou, L.; Ma, W.; Wang, Y. Spatial Assessment of Urban Climate Change Vulnerability during Different Urbanization Phases. Sustainability 2019, 11, 2406. https://doi.org/10.3390/su11082406
AMA Style
He C, Zhou L, Ma W, Wang Y. Spatial Assessment of Urban Climate Change Vulnerability during Different Urbanization Phases. Sustainability. 2019; 11(8):2406. https://doi.org/10.3390/su11082406
Chicago/Turabian StyleHe, Cheng, Liguo Zhou, Weichun Ma, and Yuan Wang. 2019. "Spatial Assessment of Urban Climate Change Vulnerability during Different Urbanization Phases" Sustainability 11, no. 8: 2406. https://doi.org/10.3390/su11082406
Note that from the first issue of 2016, this journal uses article numbers instead of page numbers. See further details here.