Article

A Strain-Softening Constitutive Model of Heterogeneous Rock Mass Considering Statistical Damage and Its Application in Numerical Modeling of Deep Roadways

1
Key Laboratory of Shale Gas and Geoengineering, Institute of Geology and Geophysics, Chinese Academy of Sciences, Beijing 100029, China
2
Institutions of Earth Science, Chinese Academy of Sciences, Beijing 100029, China
3
University of Chinese Academy of Sciences, Beijing 100049, China
*
Author to whom correspondence should be addressed.
Sustainability 2019, 11(8), 2399; https://doi.org/10.3390/su11082399
Submission received: 6 March 2019 / Revised: 13 April 2019 / Accepted: 18 April 2019 / Published: 23 April 2019
(This article belongs to the Section Sustainable Engineering and Science)

Abstract

:
During the construction of underground caverns, the stability of deep underground cavern excavation, which affects the safety and sustainable development of such projects, is a hot issue. First, based on the mechanical properties of surrounding rock in deep tunnels, the strain-softening behavior, damage, and heterogeneity of rock masses are analyzed. Then, a strain-softening model of heterogeneous jointed rock mass that considers statistical damage (SSD) is developed and implemented through FLAC3D simulation software. Finally, the SSD is applied to a deep roadway in the Jinchuan mining area, and a comparative analysis of the computation results of the Mohr–Coulomb (MC) model and the strain-softening (SS) model are carried out. The numerical results are compared with the field-monitoring results, which show that the SSD model simulated the behavior of the surrounding rocks well. The results show that the deformations of the roof and floor are larger, which may serve as a reference for the support pattern of deep roadways.

1. Introduction

Rock mass is a kind of complex geological body composed of structural planes and rock blocks. It is encountered constantly in water conservation and hydropower projects, tunnel engineering, and mining engineering. With the construction of a series of large-scale projects around the world, many countries have carried out experimental research on the rock mechanics, thermodynamics, seepage, and long-term stability of rock mass in deep underground engineering. In the process of underground engineering construction, a deep understanding of the physical and mechanical properties of the rock mass is required, especially as the buried depth increases. Because of the high ground stress, temperature and osmotic pressure in the deep rock mass, the rock burst risk will be further increased, the time effect of rock mass deformation will be further revealed, and the effect of stress redistribution caused by excavation on the stability of deep underground engineering is more prominent [1,2,3].
Researchers from various countries have carried out systematic research work on deep underground projects, such as the South-to-North Water Transfer Project and the Jinping II Hydropower Station in China [4,5], in situ tests at Yucca Mountain in the United States [6] and in the Aspö Hard Rock Laboratory (HRL) in Sweden, and the DECOVALEX project, which is jointly carried out by European countries [7,8]. These large projects promote the development of rock mass mechanics. Current research methods mainly involve laboratory tests, on-site monitoring, numerical simulations, and theoretical analysis. As the main research method, laboratory tests have many disadvantages, such as difficult sample preparation, poor controllability of loading conditions, and poor visualization in the test process. So, it is difficult to obtain realistic results with this method.
As a supplement to the physical tests, numerical tests can overcome most of the difficulties mentioned above. J.C. Simo found that the softening law must be re-interpreted in a distributional sense for continuum solutions, and it provides a precise physical interpretation of the softening modulus and a new class of anisotropic rate-independent damage models for brittle materials [9]. M. Nikolic proposed a model which is suitable for assessing the failure of heterogeneous rock with cracks or defects based on the discontinuity approach, and he presented two models (I and II) to represent the intact part and the microcracks, respectively [10,11]. C. W. Boon put forward a systematic approach to provide useful insight for tunnel support in jointed rock masses based on the distinct element method (DEM) and analyzed the effects of support structures with different parameters [12]. O.K. Mahabadi presented a new numerical code based on the combined finite-discrete element method (FDEM), named Y-Geo, and illustrated two of its geomechanical applications [13]. Wei Wu put forward a discontinuous deformation analysis (DDA)-key block theory that can alleviate some shortcomings of the key block theory and illustrated an example [14]. Leandro L. improved the classic lattice spring model by considering the Synthetic Rock Mass technique and the Barton–Bandis joint constitutive model to analyze the stability of rock tunnels under low in situ stress conditions [15]. Fei Zheng developed a Newmark-based predictor corrector solution (NPC) approach in order to improve the performance of the DDA solution module in modeling discontinuous problems [16]. Moreover, in comparison with the elastoplastic model, the stain-softening model can describe the post-peak mechanical behavior of rocks well. In order to describe the strain-softening characteristics more accurately, researchers have investigated them using theoretical analyses and laboratory tests, such as the strain-softening model considering the quantitative relationship between the plastic-softening parameters and the confining pressure of Cui, and the strain-softening model considering the variation in the dilation angle of Alejano [17,18]. However, few models have considered the following three conditions simultaneously: (1) the reduction in the elastic constant caused by rock failure; (2) rock failure caused by damage accumulation; and (3) the heterogeneity of rocks and their application in practical engineering.
FLAC3D is a type of finite-difference software that cannot simulate micro-cracks, so the strain-softening constitutive is used to investigate this mechanical behavior of rock mass. However, strain-softening constituted according to the FLAC3D only takes the reduction of strength parameters, such as c and φ, into account but not the deformation parameters, such as the elastic modulus and Poisson′s ratio. Therefore, the research in this paper aims at a secondary development of FLAC3D on the basis of strain-softening. In the improved constitutive model, statistical damage (SSD) is considered and the heterogeneity of engineering rock mass is also taken into account. Then, a numerical simulation calculation is carried out on a test roadway in the Jinchuan nickel mining area in China, and the obtained results are compared with the field-monitoring results. Finally, the rationality of the proposed constitutive model is discussed, and the case study provides a reference for the simulation calculation of other similar projects.

2. Development of the Statistical Damage (SSD) Model

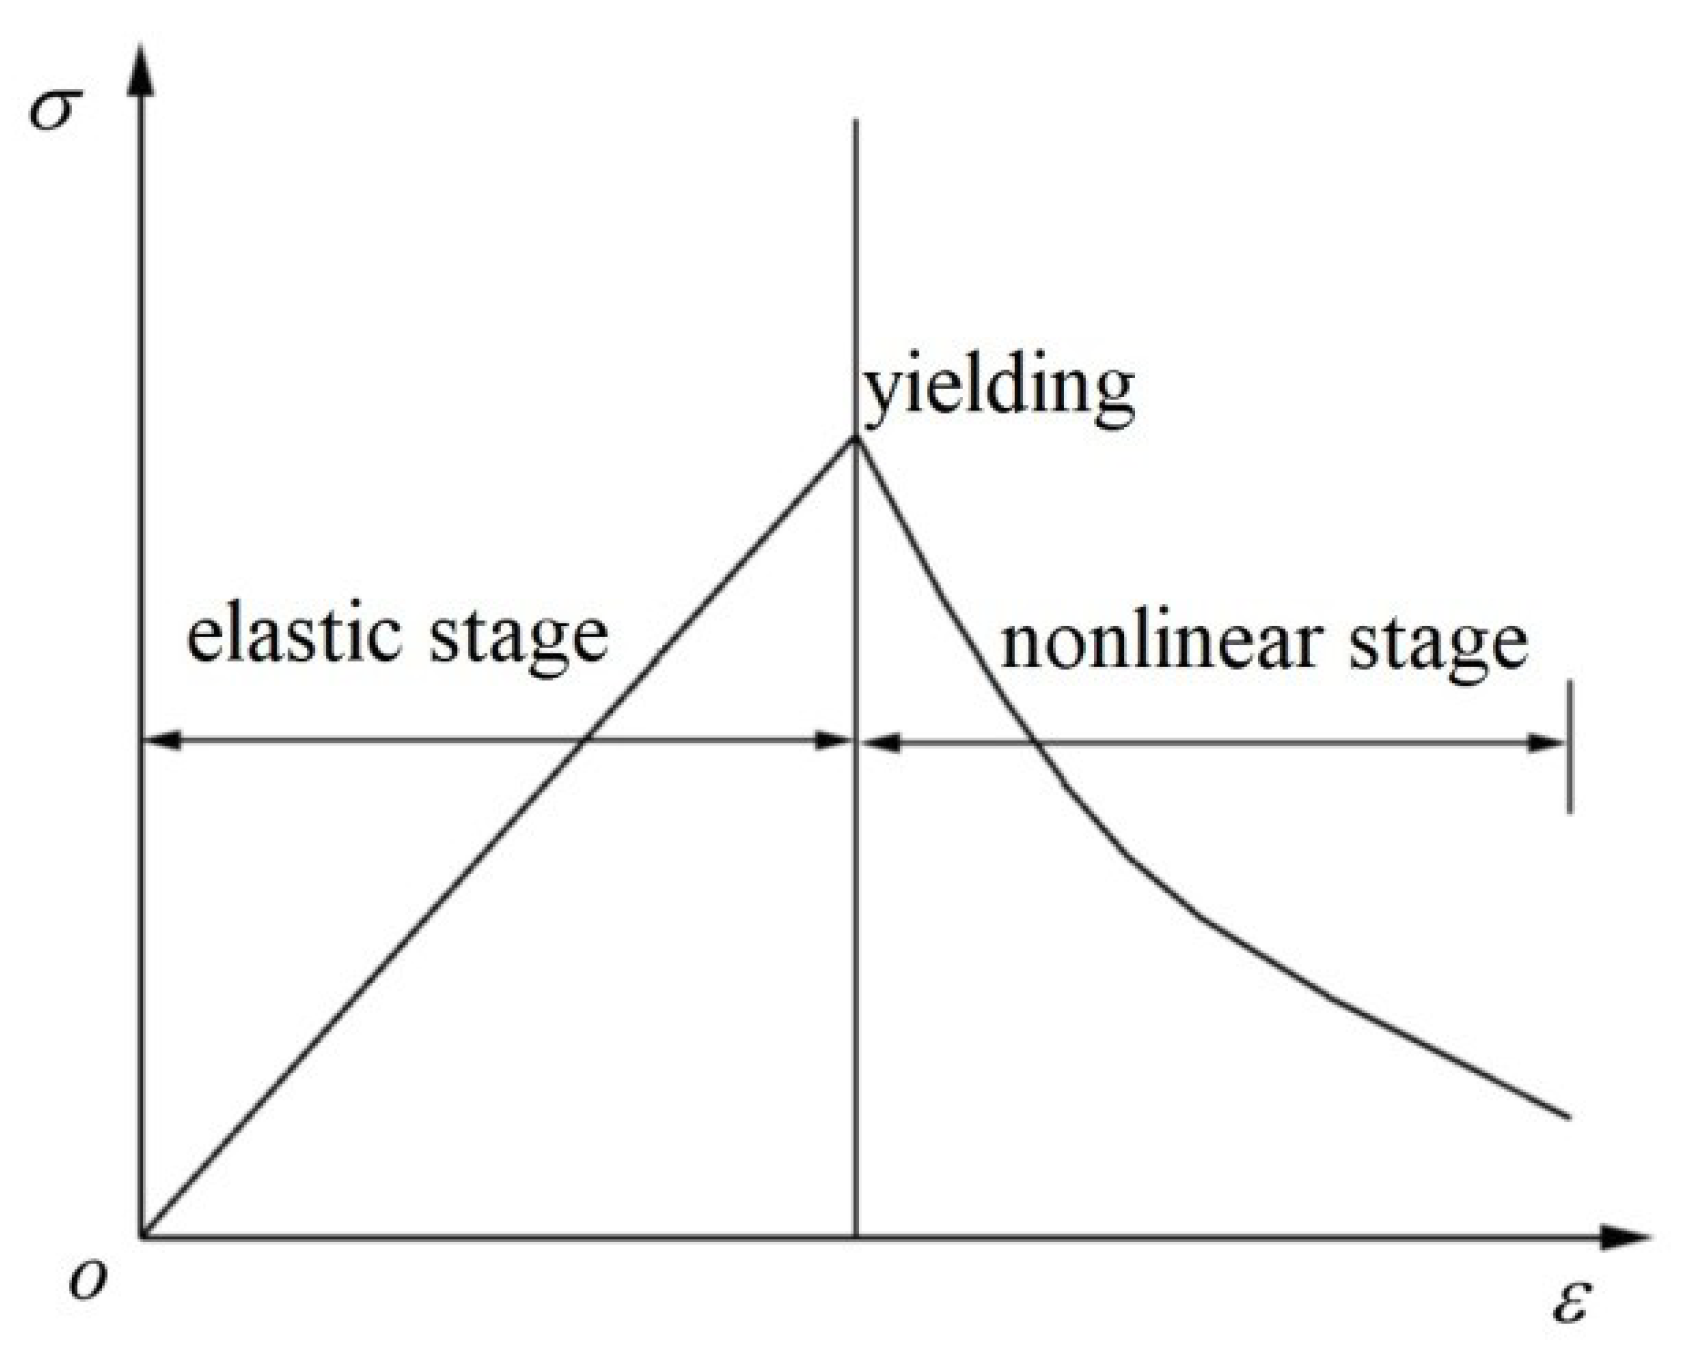
2.1. Strain-Softening Behavior of Rocks

The research shows that the strength parameters of surrounding rock will be obviously reduced in the nonlinear stage during the excavation process of deep-buried projects due to the connections among the macro-cracks in the so-called strain-softening rock [19,20]. When the stress of the rock reaches peak strength, the deterioration will become more apparent as it continues to increase. The material parameters in the commonly-used Mohr–Coulomb (MC) model are preset to be constant, which cannot reflect the softening effect of the surrounding rock caused by the variation in the surrounding rock parameters. Thus, many scholars are aiming to establish a constitutive relationship that can reflect the nonlinear mechanical response of rock based on a numerical simulation and the strain-softening theory [21,22].
The strain-softening (SS) model considers the cohesion, friction angle, and dilatancy angle of the material, which change with the plastic strain, and we can define the relationship through a piecewise linear function. In addition, the yield criterion, potential function, plastic flow rule and stress correction in the SS model are exactly the same as in the MC model. It can be seen from Figure 1 that the strain of the element is only elastic strain (εe) in the elastic phase, that is,
ε = ε e
The strain of the element consists of elastic strain (εe) and plastic strain (εp) after the element yields, that is,
ε = ε e + ε p
The yield function of the element is,
{ f s = σ 1 σ 3 N φ + 2 c N φ f t = σ 3 σ t
where f s = 0 is the shear failure; f t = 0 is the tensile failure; σ 1 , σ 3 are the maximum and minimum principal stresses; σ t is the tensile strength; C is the cohesion; φ is the internal friction angle; and N φ = ( 1 + sin φ ) / ( 1 sin φ ) .
In the numerical calculation process, after the unit yields, the new shear strength parameters of the unit are calculated according to the plastic strain at each iteration step. The parameters are updated by the non-linear equation between the shear strength parameter and the plastic strain and then used in the next iteration step. Through this cycle, the strain-softening behavior of the rocks can be reflected.

2.2. Statistical Damage Constitutive Model

For deep-buried tunnels, due to the high ground stress, the stress redistribution of surrounding rock caused by excavation leads to damage in the surrounding rock of the tunnel, and when the damage accumulates to a certain degree, the surrounding rock fails. A variety of micro-defects are distributed inside the rock in its natural state, and following engineering disturbances, micro-defects will occur and develop under load. Characterizing the micro-defects affecting the physical and mechanical properties of rock and then applying them to the calculation or evaluation of rock mechanical properties has always been a research hotspot of the rock mechanics field. The statistical damage model provides a feasible way to address this problem [23].
This method replaces the measurement of micro-defects by the assessment of the degree of damage. It assumes that these defects obey a distribution function and then establishes a statistical damage model of rock. The establishment of the rock statistical damage model is usually divided into two steps. The first step is to select a strength criterion of rock such as Mohr–Coulomb, Drucker–Prager, or the strain-softening measure used in this paper. The second step involves fitting an analytical probability distribution to characterize the stress level of rock elements. Several empirical distributions can be used, such as the function distribution and the normal distribution, with the Weibull distribution being the most popular method [24,25,26].
Regarding shear failure, this paper refers to Yang’ assumption that the cohesion of rock micro-units obeys the three-parameter Weibull distribution, and the rock statistical damage model is expressed as [27]:
D = 1 exp [ ( c c 0 λ ) m ]
c = σ ˜ 3 N φ 2 σ ˜ 1 2 N φ
where c is the cohesion of rock micro-units; c0 is the initial cohesion; λ is the scale parameter whose value is in the same order of magnitude as c; m is the shape parameter; σ ˜ 1 = σ 1 / ( 1 D ) ; and σ ˜ 3 = σ 3 / ( 1 D ) .
In the calculation of the ith incremental step, the maximum principal stress σ1 and the minimum principal stress σ3 are substituted into the damage factor Di−1 of the previous step, and ci is calculated by Equation (5) in the current step. The initial state of the rock is not damaged, so the D0 is 0 in the first incremental step. If cic0, there is no damage in the model, so Di is 0; If ci > c0, Di is calculated by Equation (4). In the calculation of step i plus the first incremental step, ci+1 can be calculated by substituting the damage factor Di into Equation (5), and then ci+1 is substituted into Equation (4) to calculate Di+1, which is applied in the next incremental step. In every incremental step, the damage factor can be determined based on this loop computation.
Regarding the tensile failure, referring to the damage accumulation theory, it is considered that damage to the micro-units is gradually accumulated with the tensile failure. When the rock undergoes tensile yielding, the bearing capacity is not completely lost immediately. D0 is defined as the initial damage, and then the calculation of the cumulative damage D is performed on the micro-units [28].
Under tension and shearing, there will be different degrees of damage inside the rock mass. According to the strain equivalence principle, the elastic parameters decrease at the stage of damage, following [29,30]:
E = ( 1 D ) E 0
where E0 is the initial elastic modulus of a micro-body.

2.3. Heterogeneity in Rocks

Rock is a kind of natural heterogeneous material. In general, when we study the mechanical properties and failure process of rocks, rocks are regarded as particles that should be analyzed within the framework of continuum mechanics. However, rocks are large enough to contain micro-cracks and their spatial distributions of physical and mechanical properties are discontinuous.
Heterogeneity has a great effect on the mechanical and deformational properties of rocks. Weibull described the heterogeneity of materials with probability and statistical methods. In this paper, the Weibull statistical distribution, which is widely used, is adopted to describe the heterogeneity of rock through the following equation [31]:
ϕ ( x ) = m k · ( x k ) m 1 · exp [ ( x k ) m ]
where x is the attribute parameter of the element. This paper takes the elastic modulus as a representative to study the heterogeneity of rock. k is a scale parameter that reflects the average value of the elastic modulus. m is a shape parameter that reflects the homogeneity of the elastic modulus.
The heterogeneous assignment of the elastic modulus based on the Fish function can be accomplished by the following three steps: (1) Generate a (0, 1) uniformly distributed random number sequence F through the urand function in FLAC3D; (2) calculate the value of the elastic modulus by the formula x = λ ( ln ( F ) ) 1 / m ; (3) Assign values to individual units by command order.

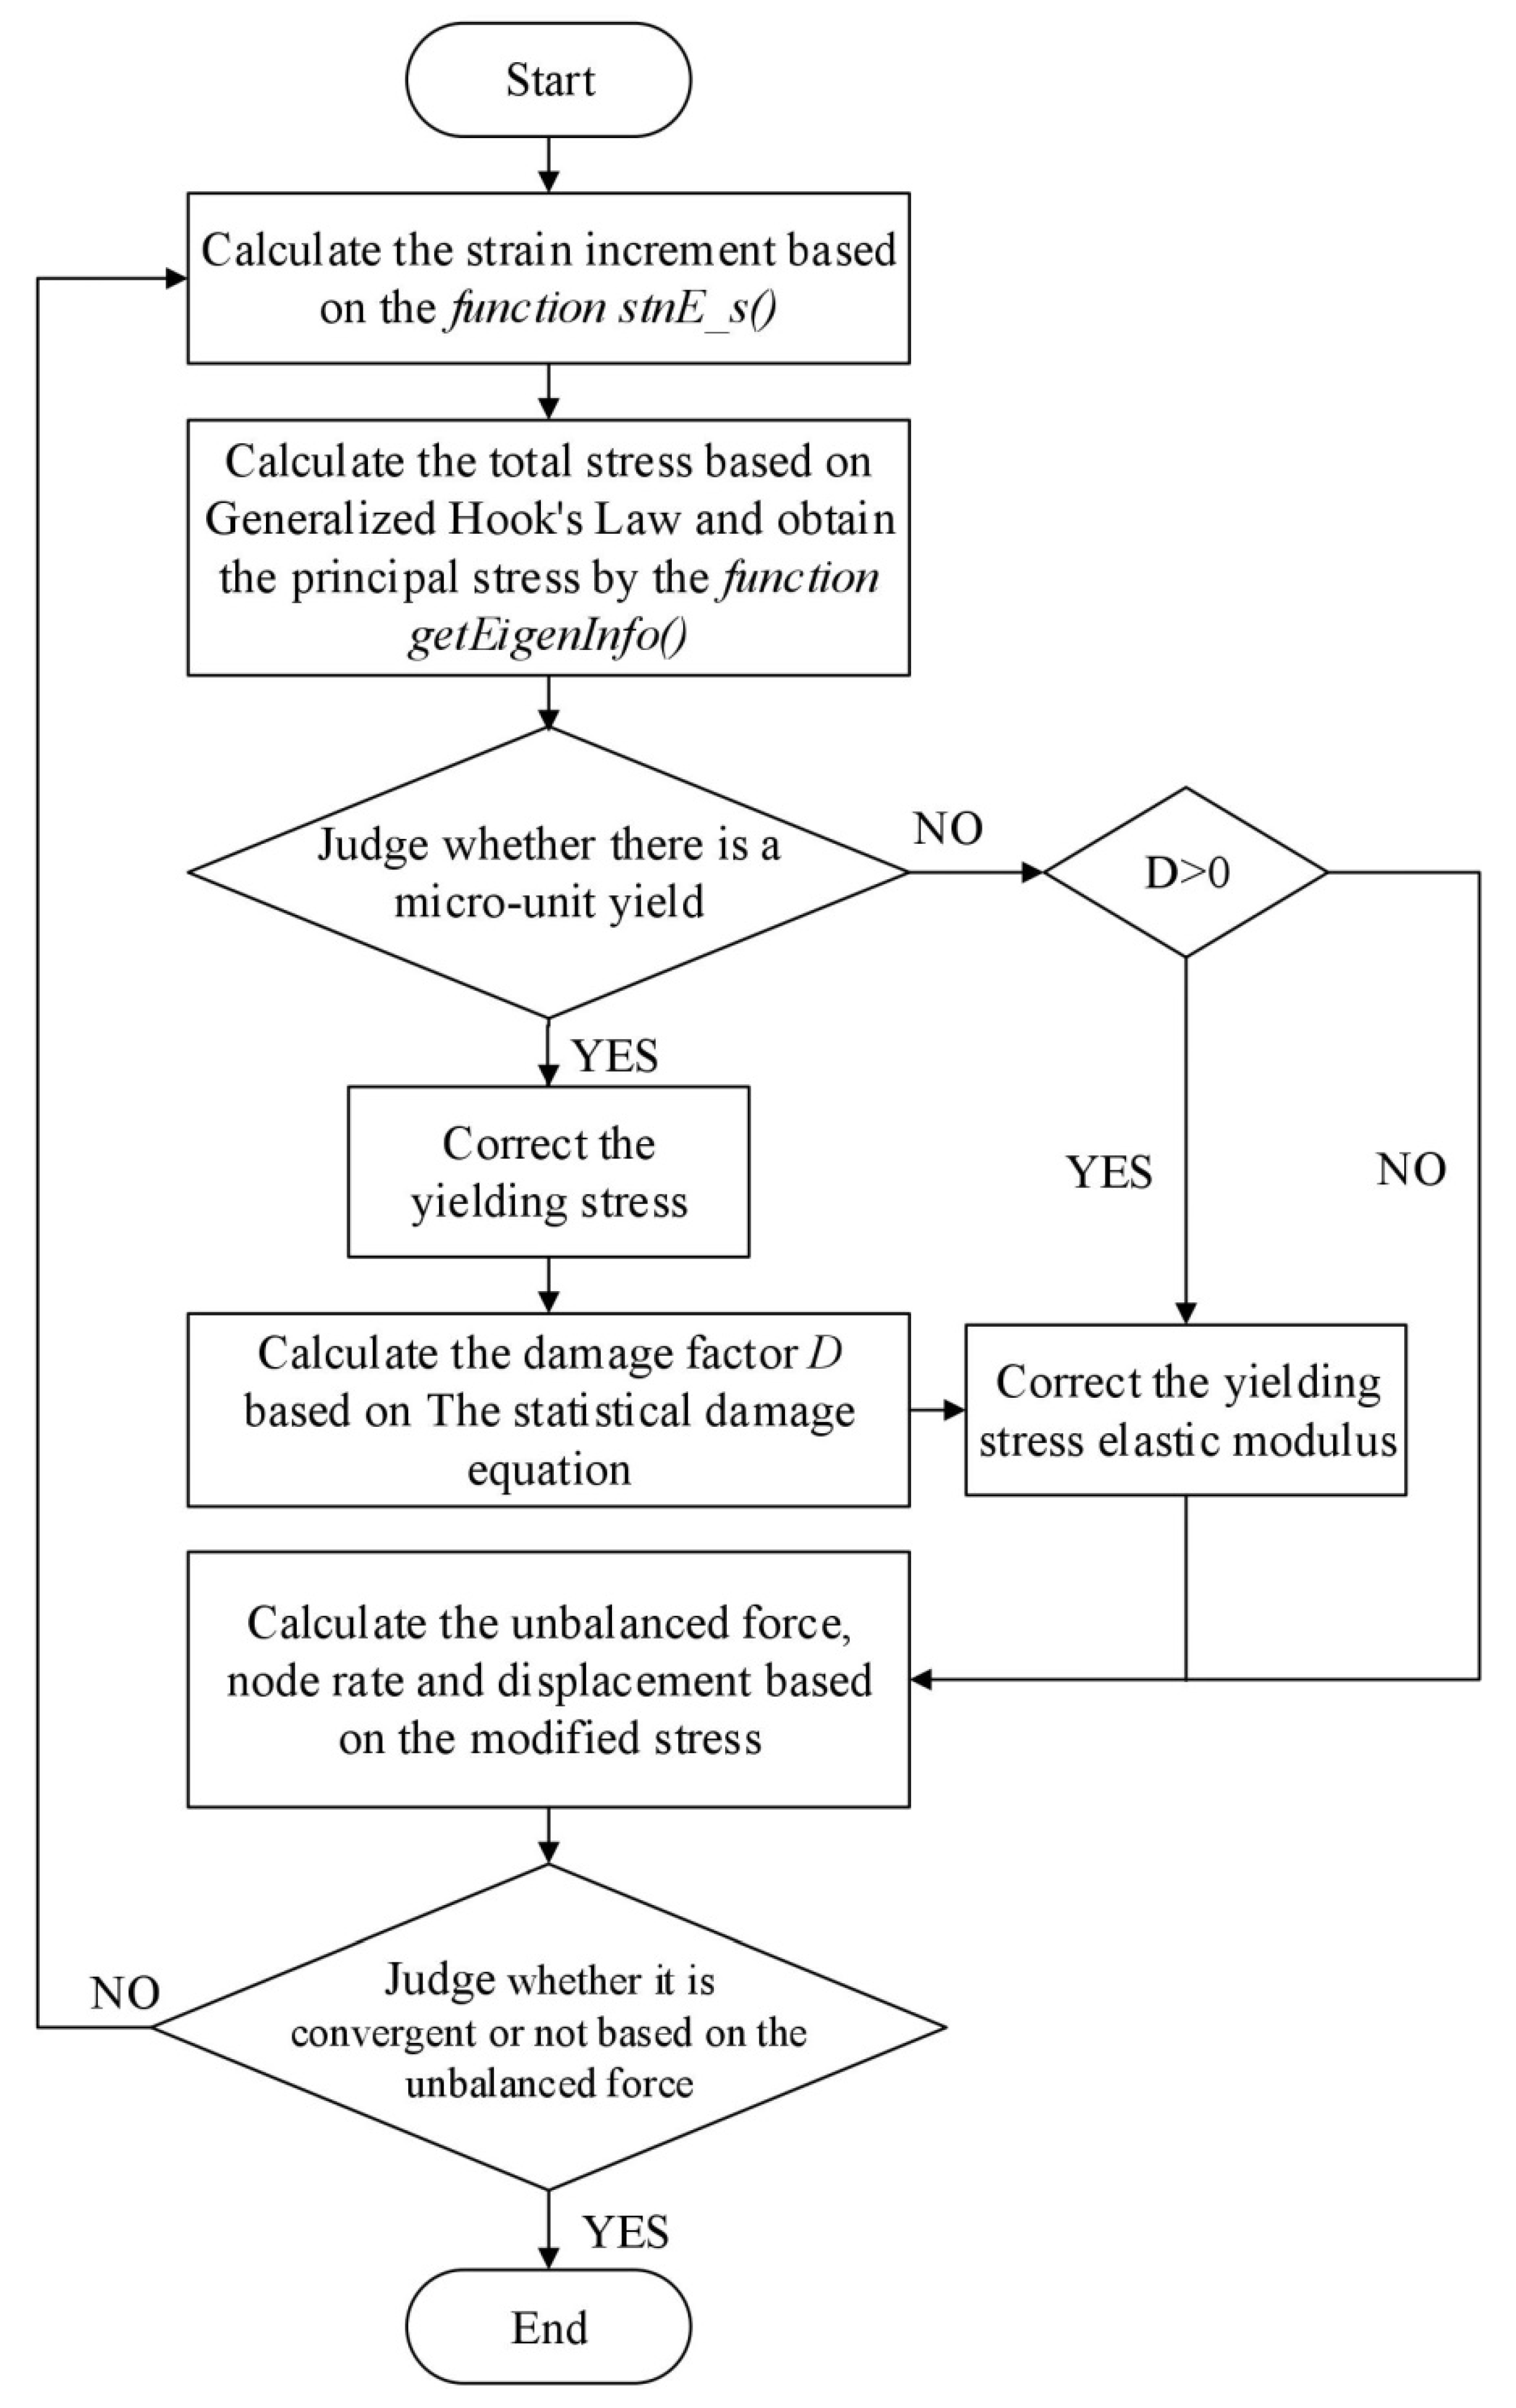
2.4. Implementation of the SSD Model in FLAC3D

In recent years, with the development of computer technology, more and more researchers have adopted numerical methods in their studies because of the convenience, repeatability, and economy. The numerical methods include the finite element method, the discrete element method, and the finite difference method. RFPA (Discontinuous Deformation Analysis), R-T2D (Rock and Tool Interaction), and FLAC3D are commonly used in geotechnical engineering, and FLAC3D is used in this paper because it provides users with a flexible interface and has advantages in simulating rock failure processes and large deformations [32,33].
FLAC3D uses the object-oriented language C++ for programming, and it provides users with a number of model examples, including header files (.h) and source files (.cpp). If there is no one appropriate model for the research problem, users can customize the constitutive model and compile it into a dynamic link library file (.dll) for software calls. Furthermore, the customized constitutive model and the software-owned model have the same execution efficiency. The main function of the constitutive model is to provide a strain increment and obtain a new stress value. It also has some auxiliary functions including the model name, material properties, and interactions between the model and code [34].
Based on the above analysis, a strain-softening constitutive model of heterogeneous jointed rock mass that considers statistical damage was developed, and the process of numerical implementation using software is shown in Figure 2.

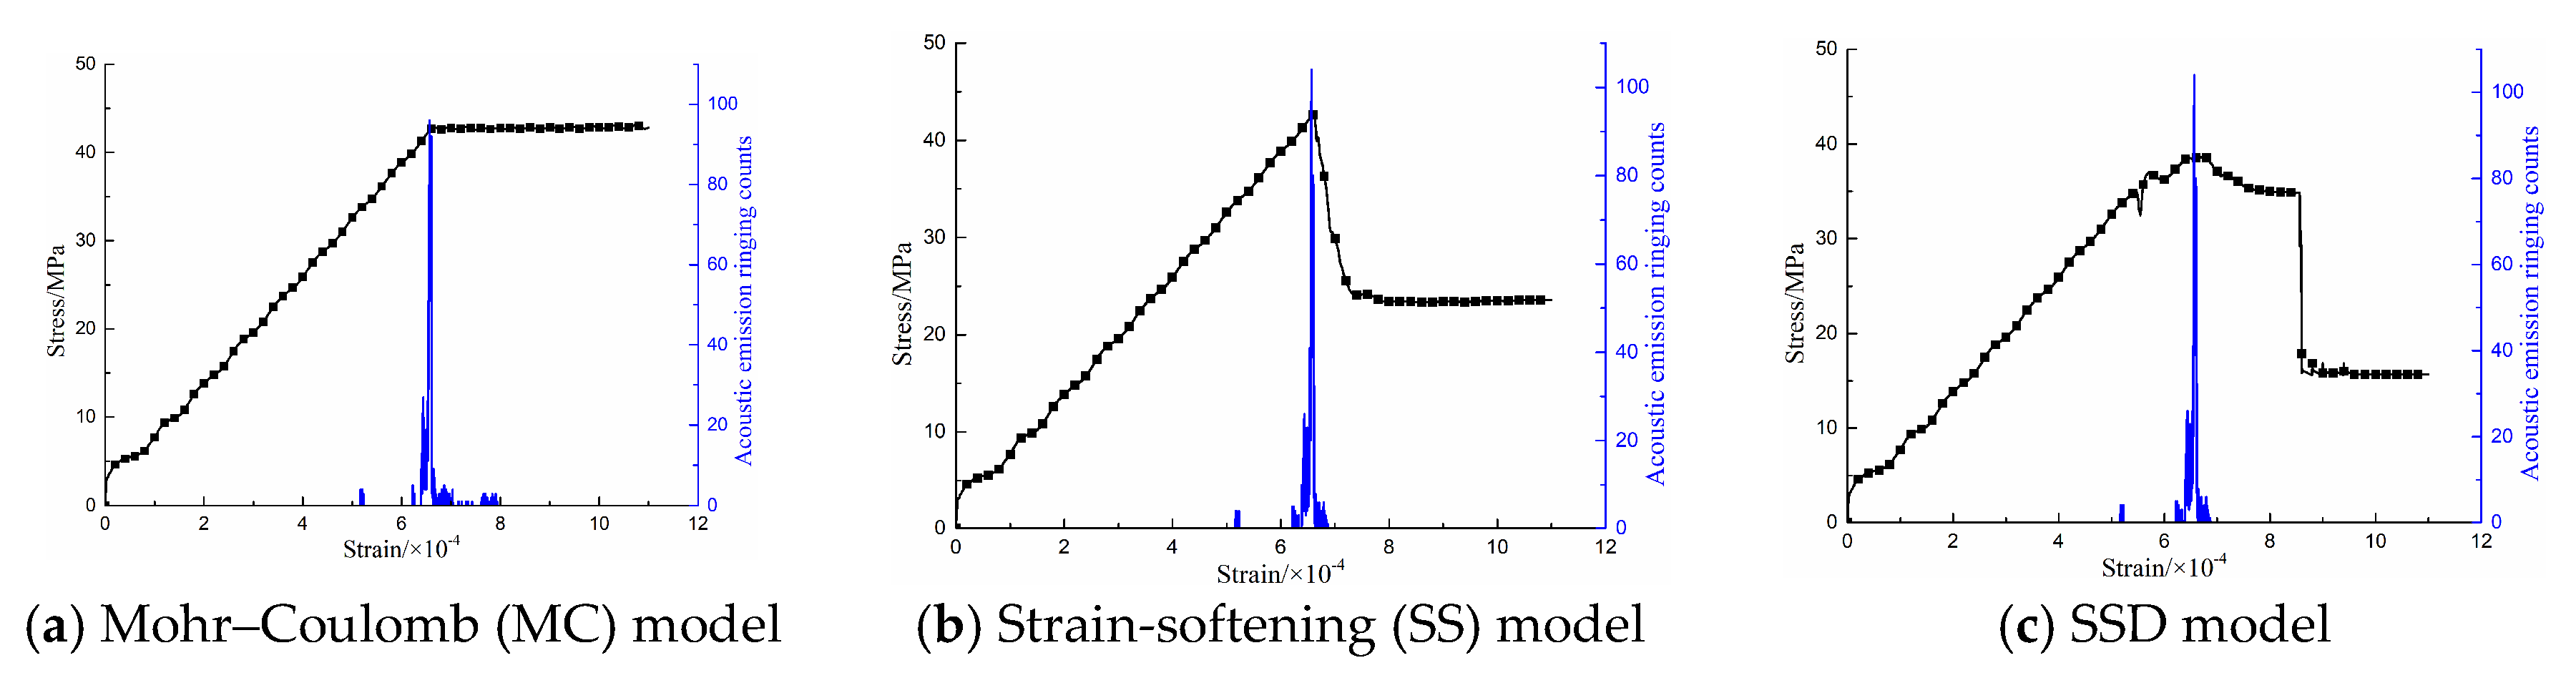
2.5. Uniaxial Compression Test Based on SSD Model

In order to prove the reasonability of the model, a uniaxial compression test was carried out based on the MC, SS, and SSD models. The numerical model, as shown in Figure 3, was established according to the actual standard size of rock specimens which is Φ 5 × 10 cm, and the parameters are set based on the values for marble shown in Table 1. The mesh has an inevitable impact on the results of the calculations—the finer the mesh is, the closer the result is to the actual value—but the trend of the calculation results is consistent. The meshes are divided based on the calculation efficiency and the accuracy of the result in this paper. The stain–stress–acoustic emission ringing counts curves are shown in Figure 4.
Figure 4a shows an ideal elastoplastic curve under the MC model—the stress increases as the strain increases until the yield strength is reached. Under the SS model shown in Figure 4b, the stress can be divided into three stages: monotonic increasing before the critical strain, decline, and basic stability. The yield stresses under the MC model and the SS model are almost the same—about 45 MPa. It can be seen from Figure 4c that the SSD model proposed in this paper can reflect the full process of failure for rock, especially the strain-softening property. The stress–strain curve is basically the same as the previous two in the elastic stage, except that the yield stress is slightly smaller. However, after the rock yield, a cliff fall appears because the statistical damage is considered. The damage on the weak part of the rock accumulates and the mechanical parameters are continuously reduced until rock failure, which explains why although the intact rock is very strong, the rock mass is destroyed along the weak structural plane during practical engineering.

3. Engineering Application

To validate the rationality of the SSD model proposed above, a comparative numerical calculation was carried out to analyze the deformation of surrounding rock at a test roadway in the Jinchuan II mining area based on the MC model, SS model, and SSD model, respectively.

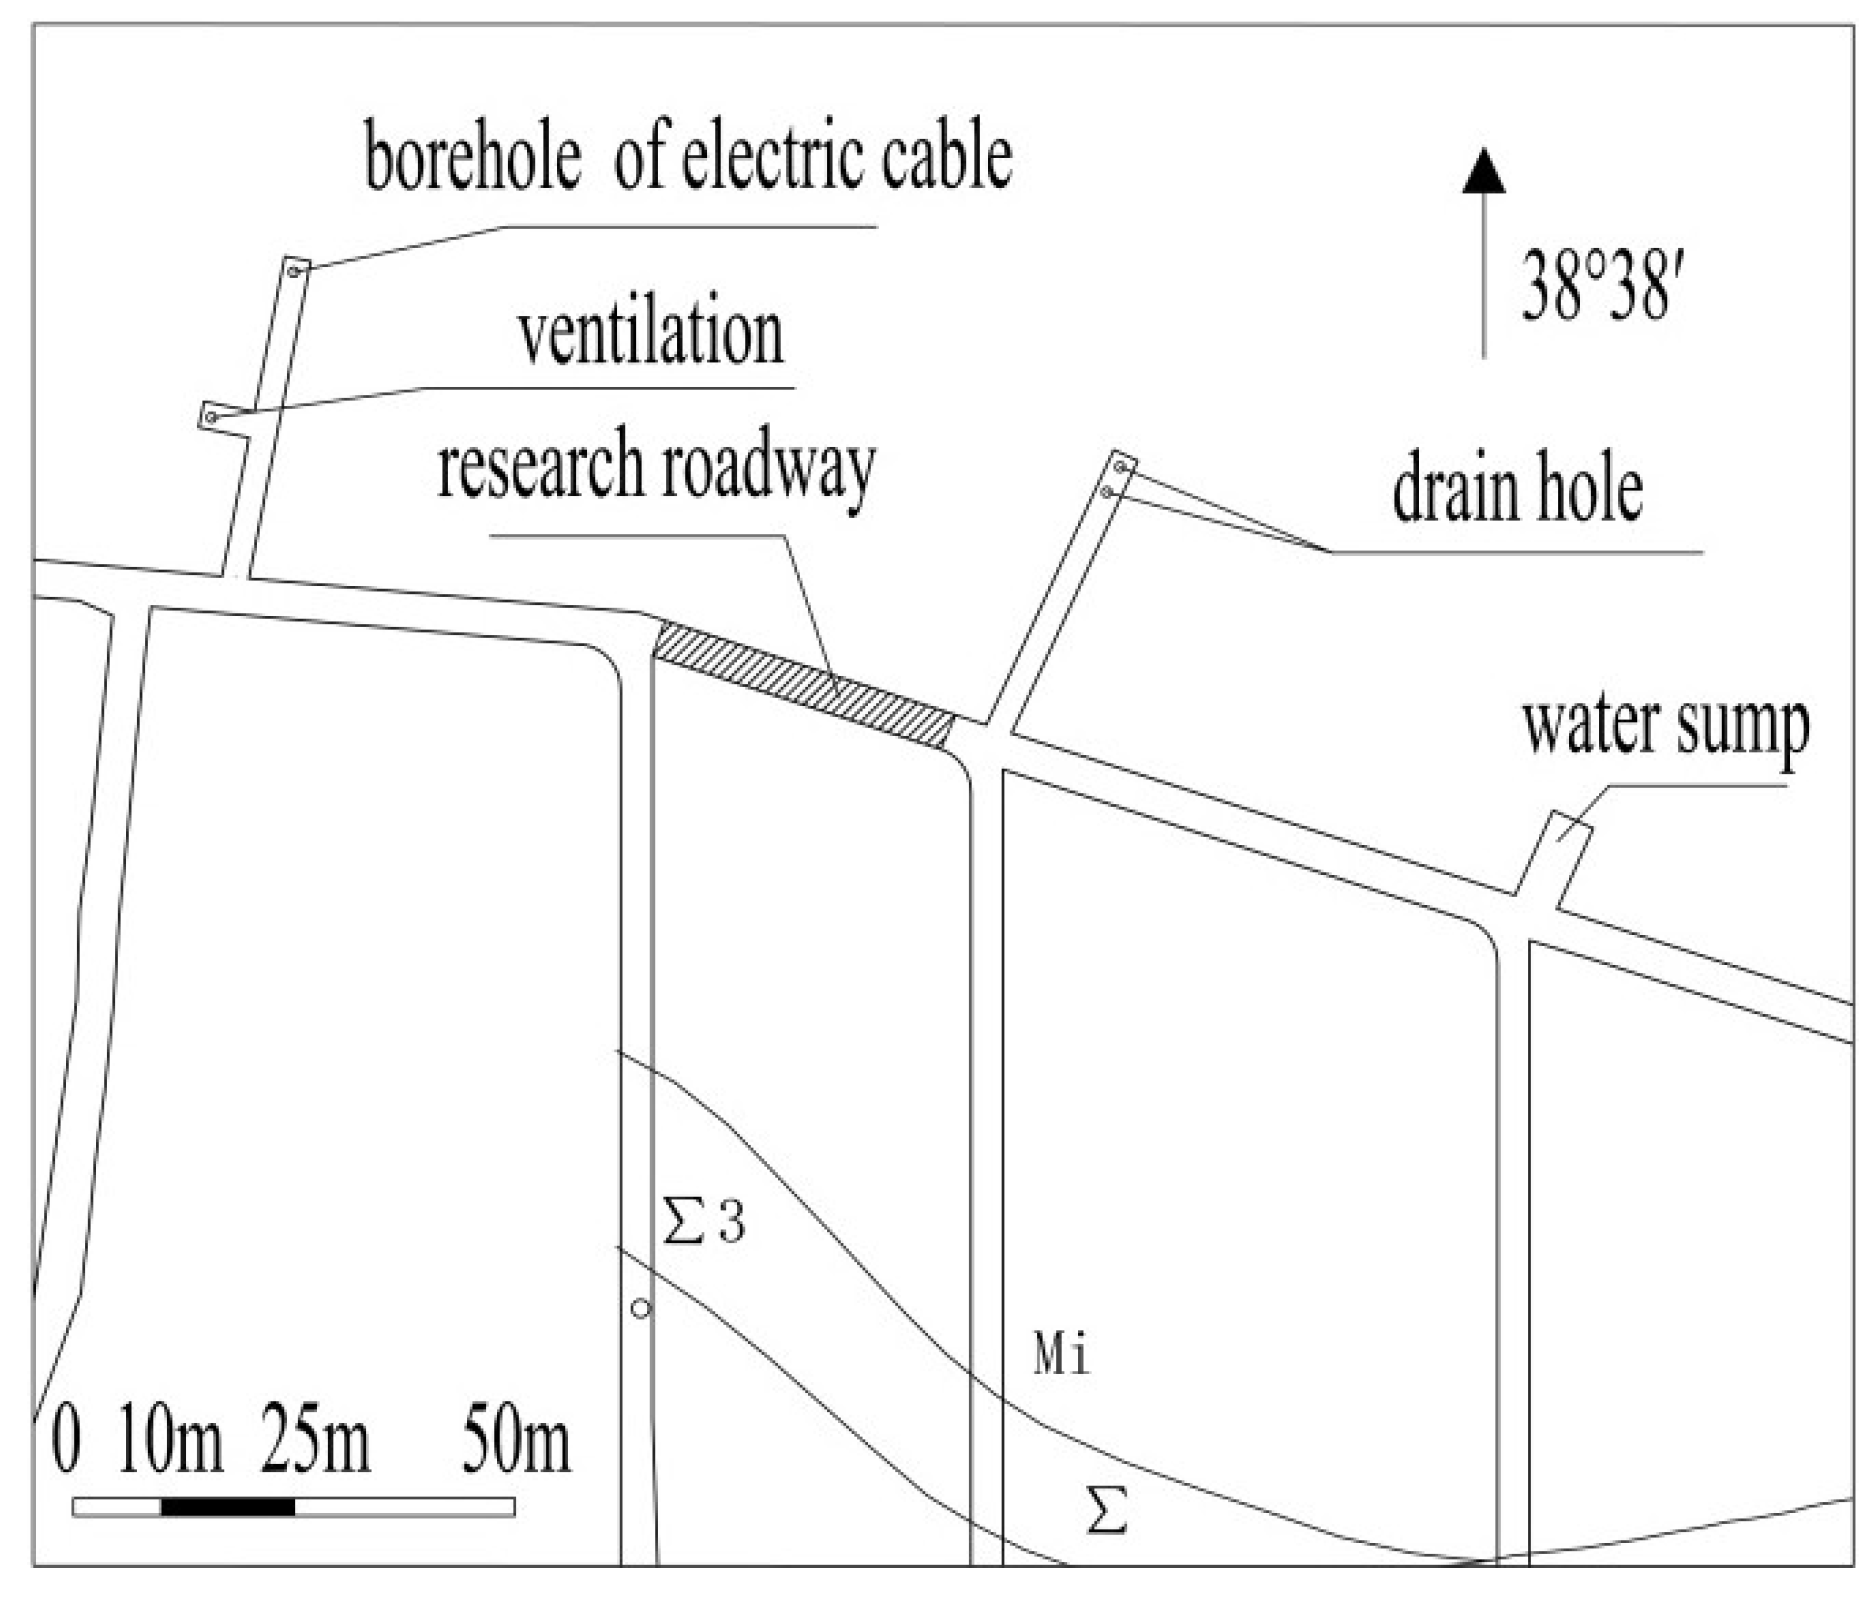
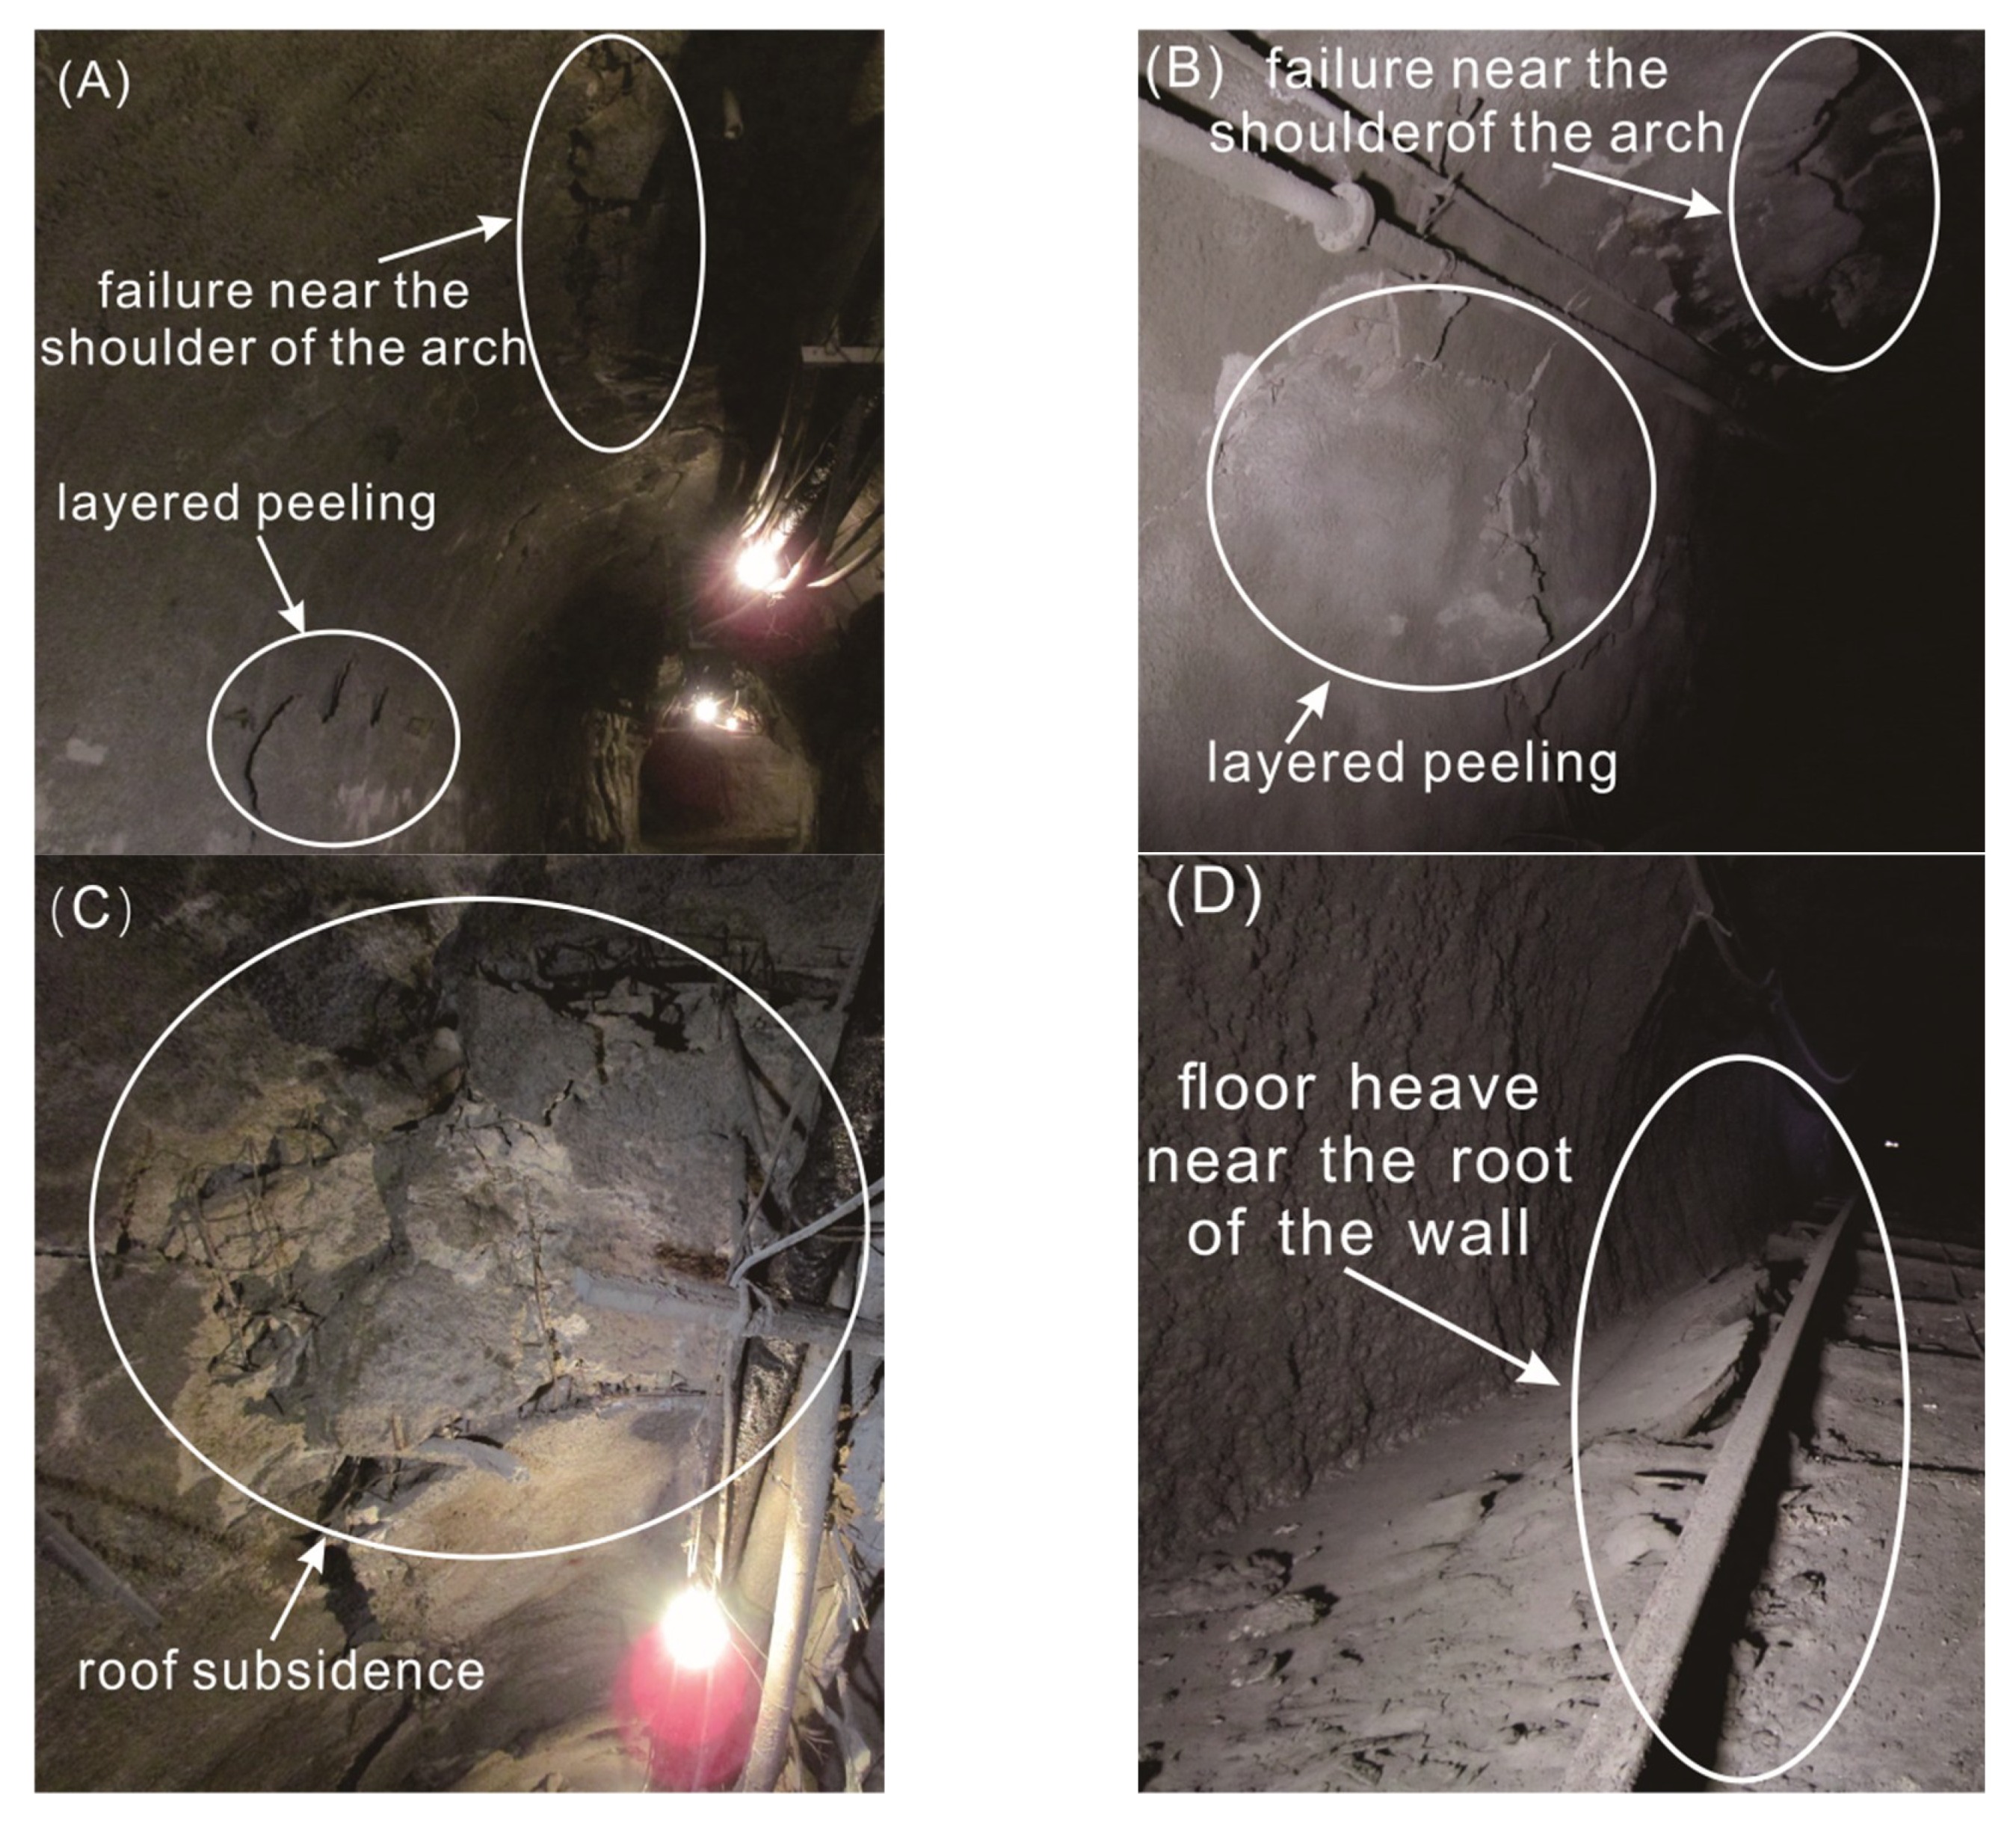
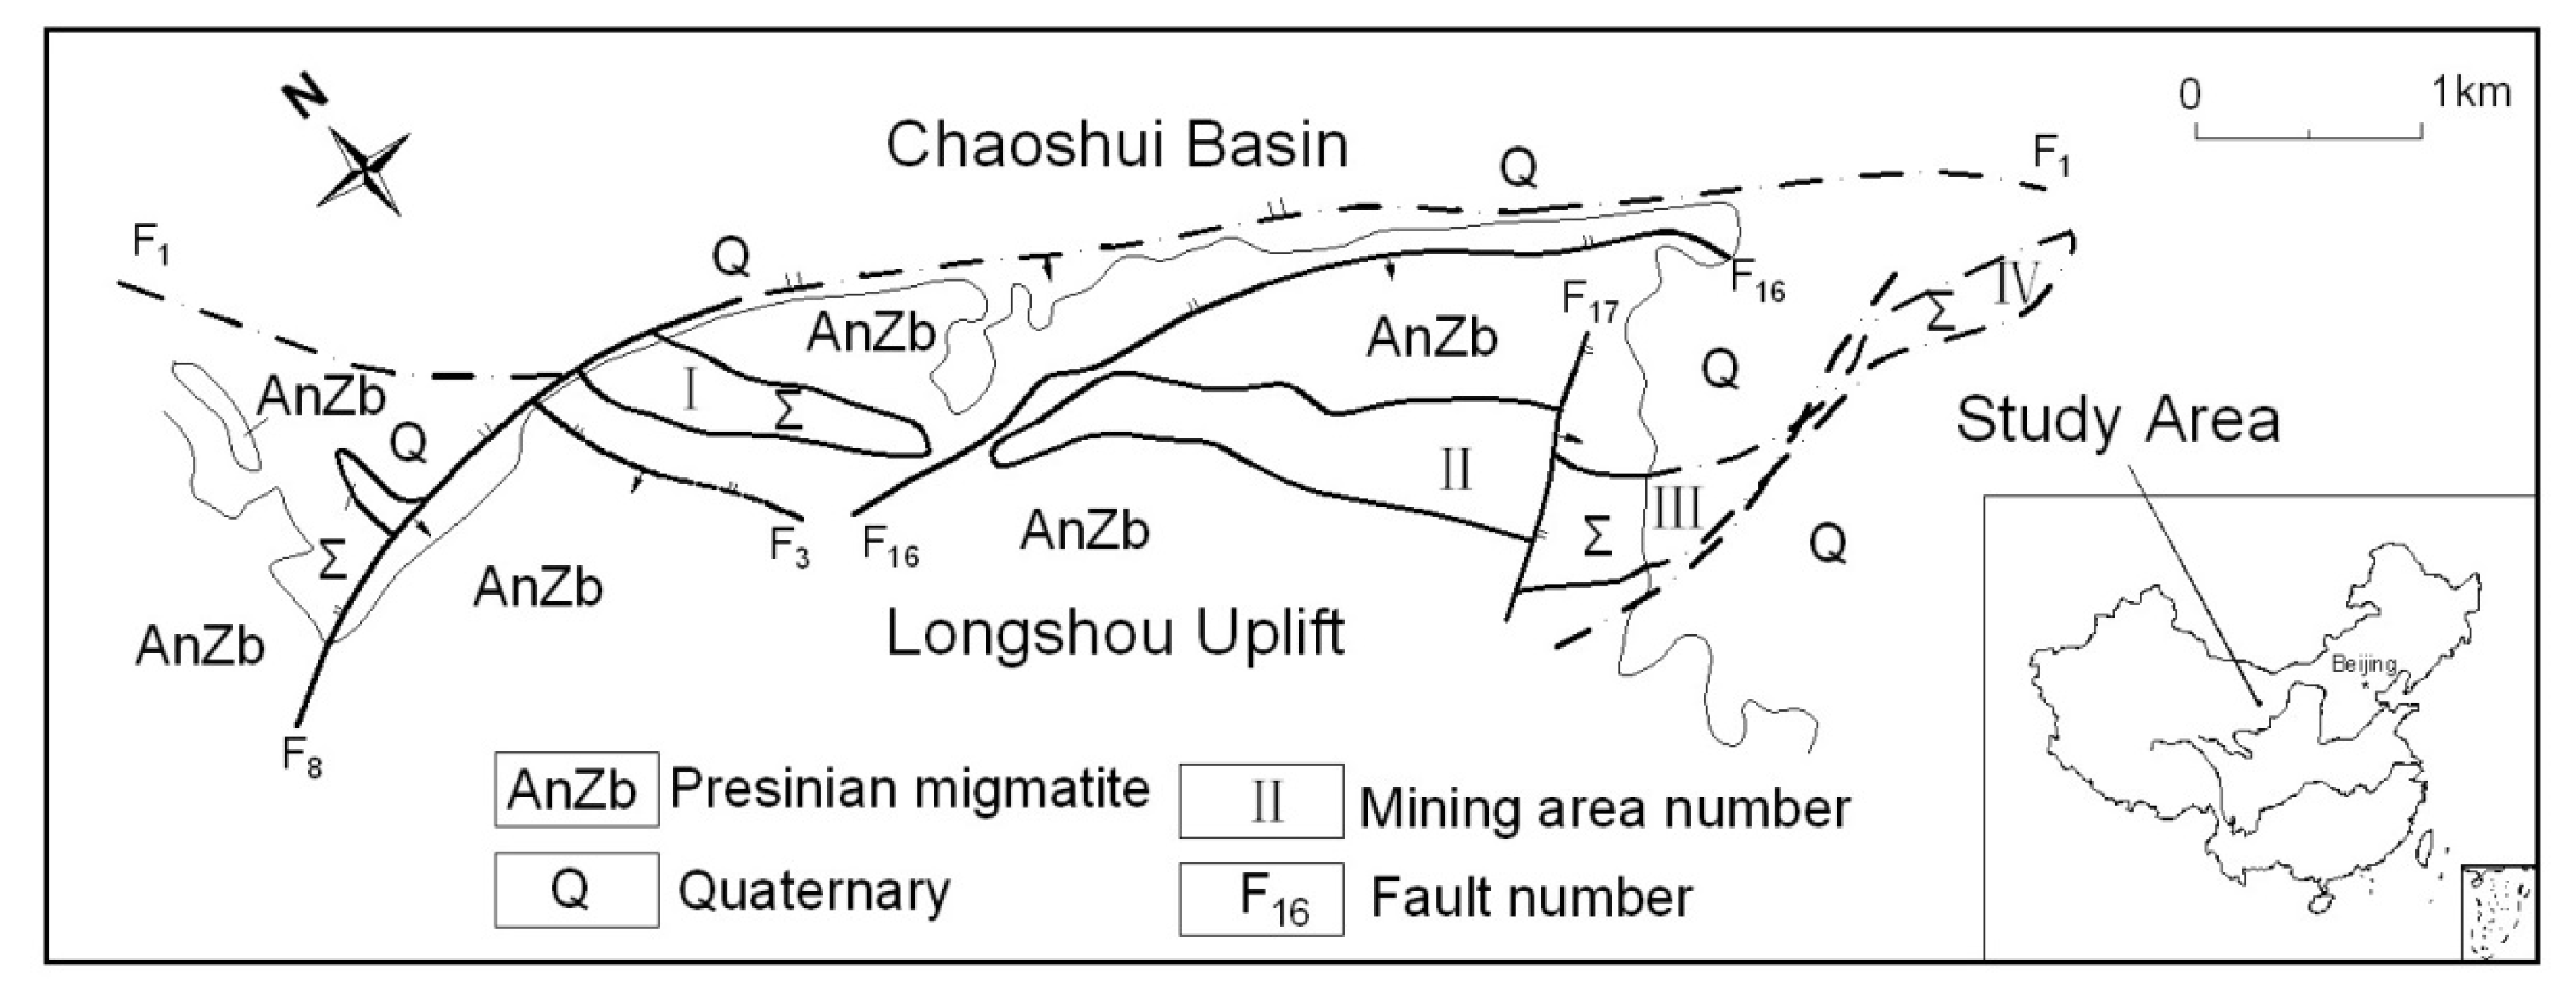
3.1. Geological Background

Jinchuan Mine, the largest nickel production base in China, is located in Jinchang City, Gansu Province. The ore deposit is about 6.5 km long, 200 m wide, and over 1000 m deep. It is a large and complex deposit with high ground stress, deep buried ore bodies, and broken rocks. The engineering geology of this area is shown in Figure 5. Due to its extremely complex regional geological background, special engineering geological environment, and distinctive rock mechanics, Jinchuan Mine has attracted the attention of scholars and experts at home and abroad. With the mining depth increasing, the safety of deep roadways has become a prominent problem in the Jinchuan mining area [35,36,37].
The simulated test roadway in this paper is located in mining area II at a depth of about 750 m, as shown in Figure 6 The surrounding rock is mainly gray-white marble with a massive structure and a medium-fine grain crystalloblastic texture. The main mineral compositions include dolomite, calcite, serpentine, and a small amount of quartz stone. There is only Quaternary pore water and a small amount of structural fissure water in this mining area, so the hydrogeological conditions have little impact on the project. The intact rock and rock mass mechanical parameters in the tentative roadway are shown in Table 1. The value of the in situ stress near the test roadway is shown in Table 2, and there is a linear relationship between the three principal stresses and the depth as follows [38,39]:
σ 1 = 8.620 + 0.018 H σ 2 = 3.984 + 0.017 H σ 3 = 0.077 + 0.00.024 H
where σ 1 , σ 2 , σ 3 are the maximum principal stress, the intermediate principal stress, and the minimum principal stress (unit: MPa); H is the depth in m.
The test roadway adopts a semi-circular arched shape because of the reasonable stress distribution and high utilization rate. The primary support is a composite supporting scheme including a double-layer bolt-mesh-anchor and U-shaped steel, as shown in Figure 7. The anchor rod with cement mortar is made of secondary rebar and has a length of 2250 mm, a diameter of 22 mm and spacing of 1000 × 1000 mm. The anchor plate is made of an ordinary steel plate with a thickness of 10 mm and a size of 200 × 200 mm. Concrete with a compressive strength is 25 MPa is used for shotcrete lining, and the thickness of a single layer is 100 mm. The U-shaped steel support uses U36 steel, and the specific parameters of each support structure are shown in Table 3, Table 4 and Table 5 [40,41].

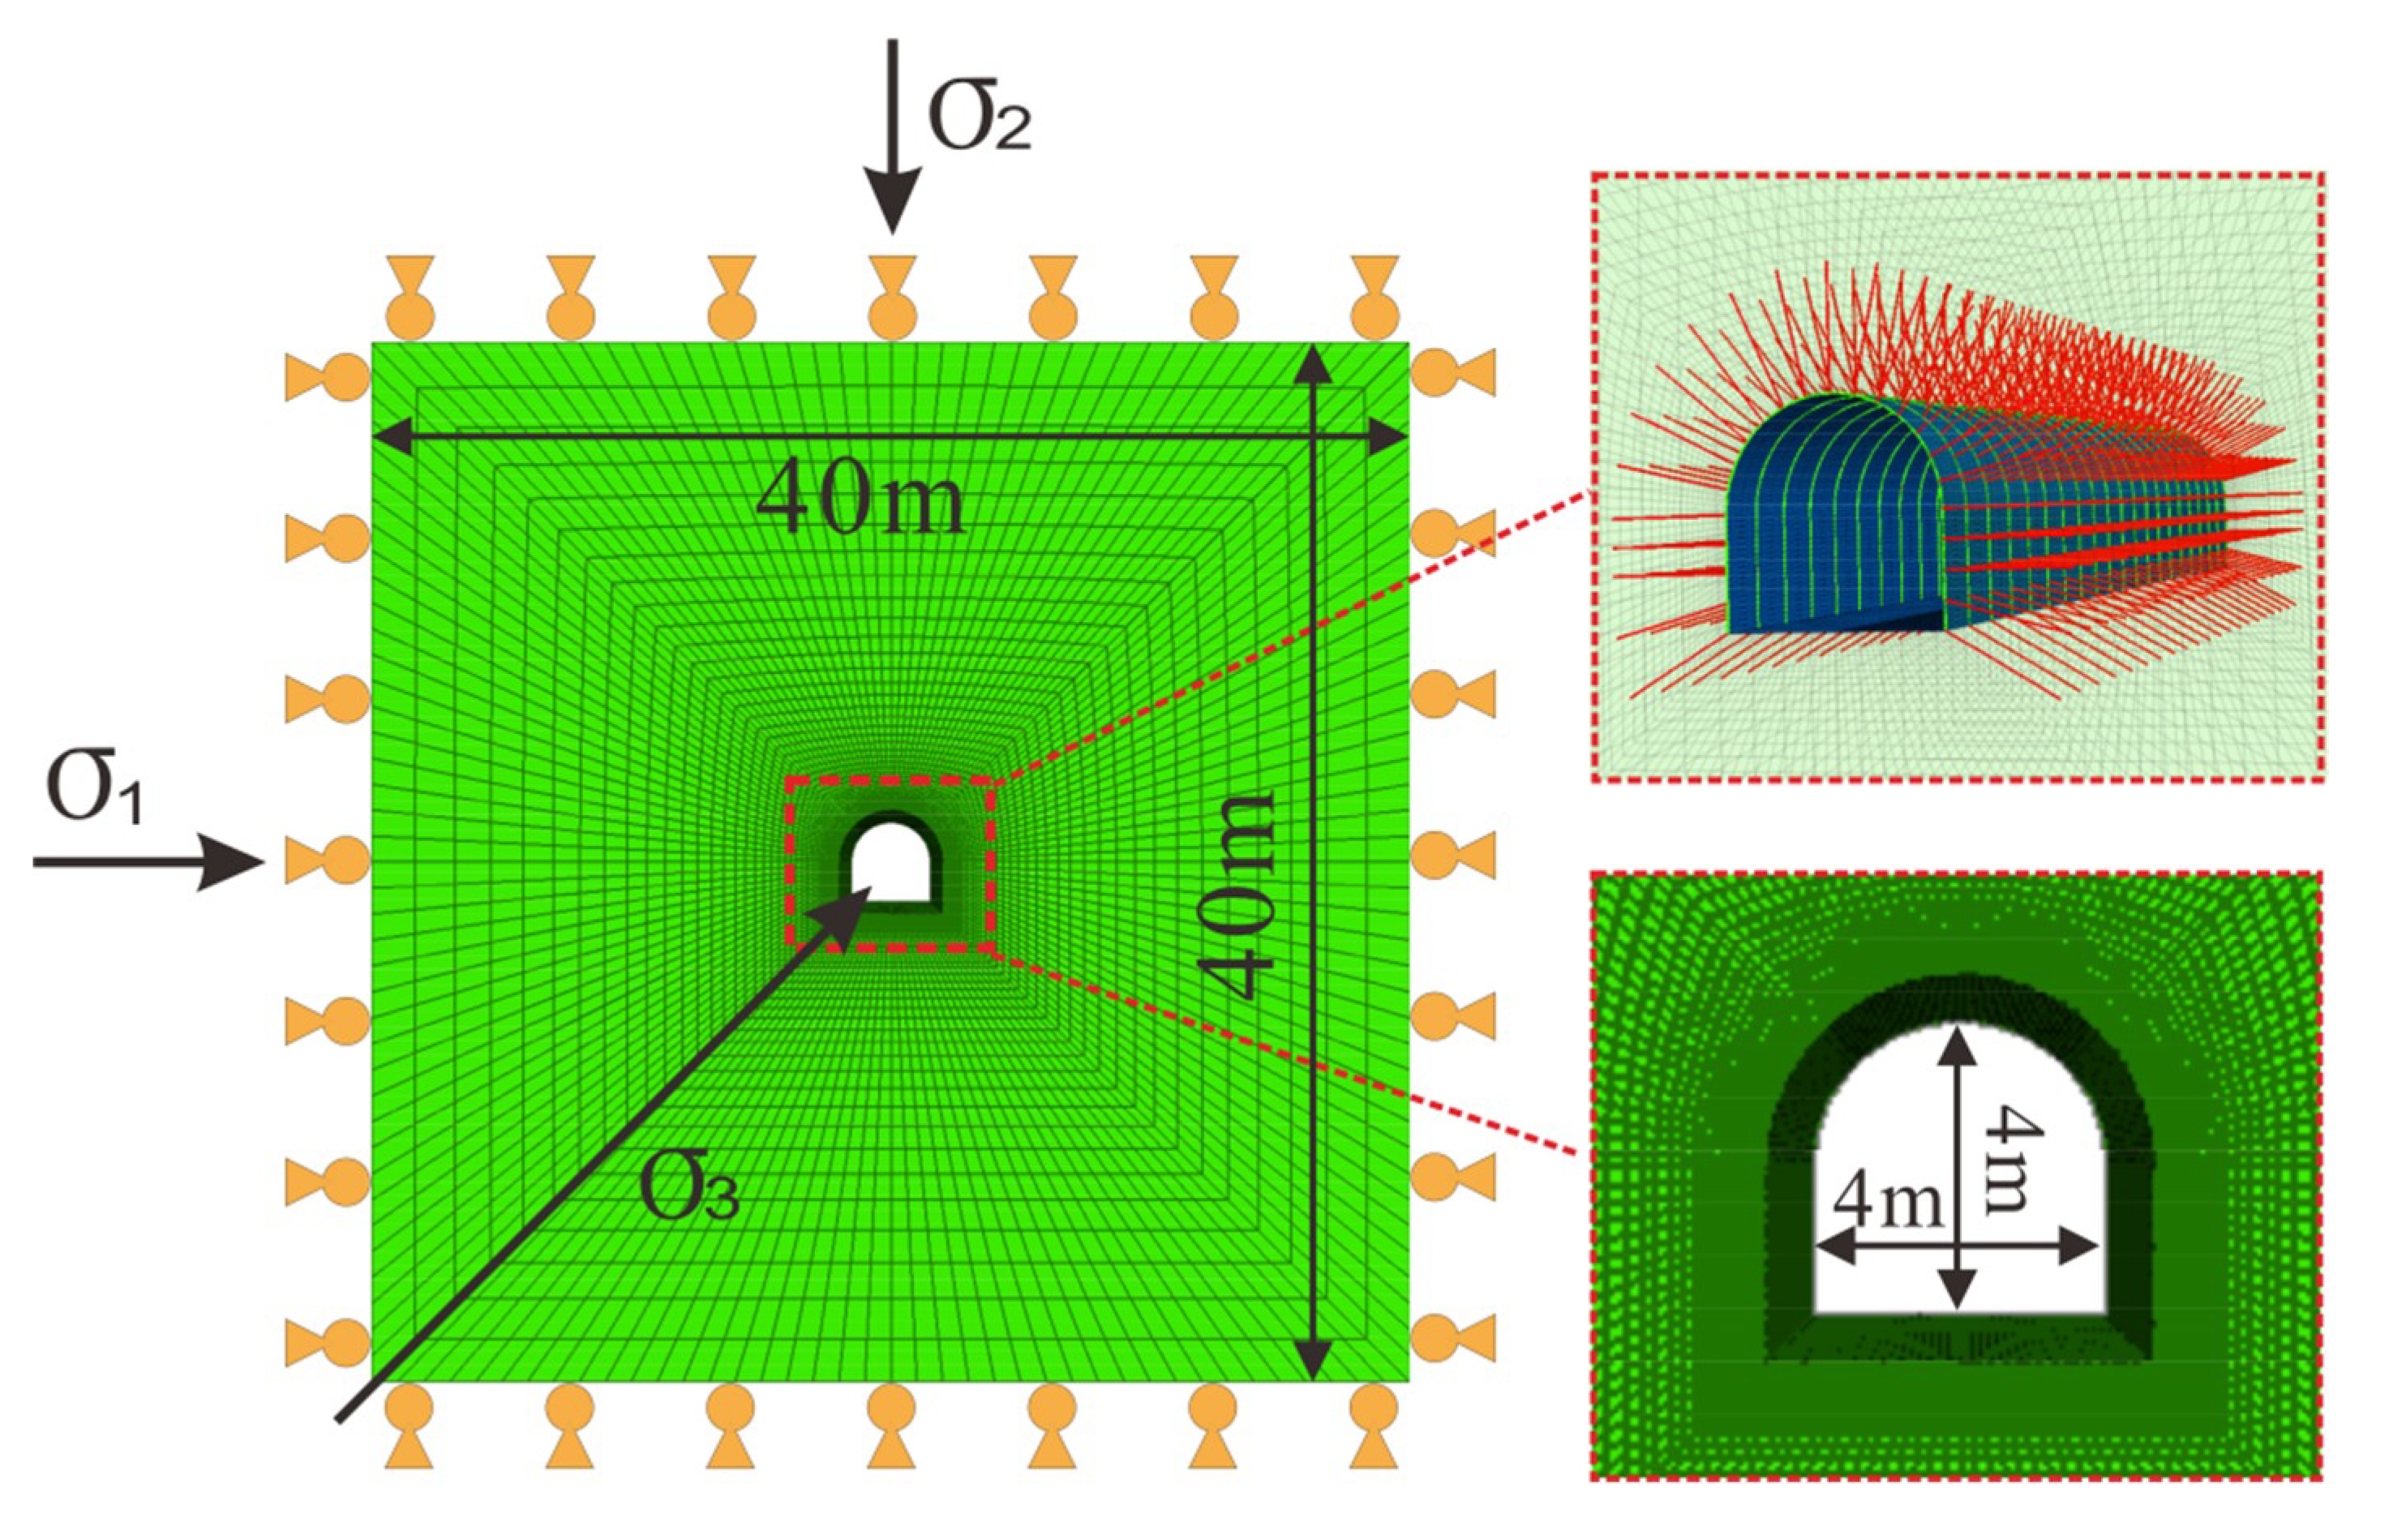
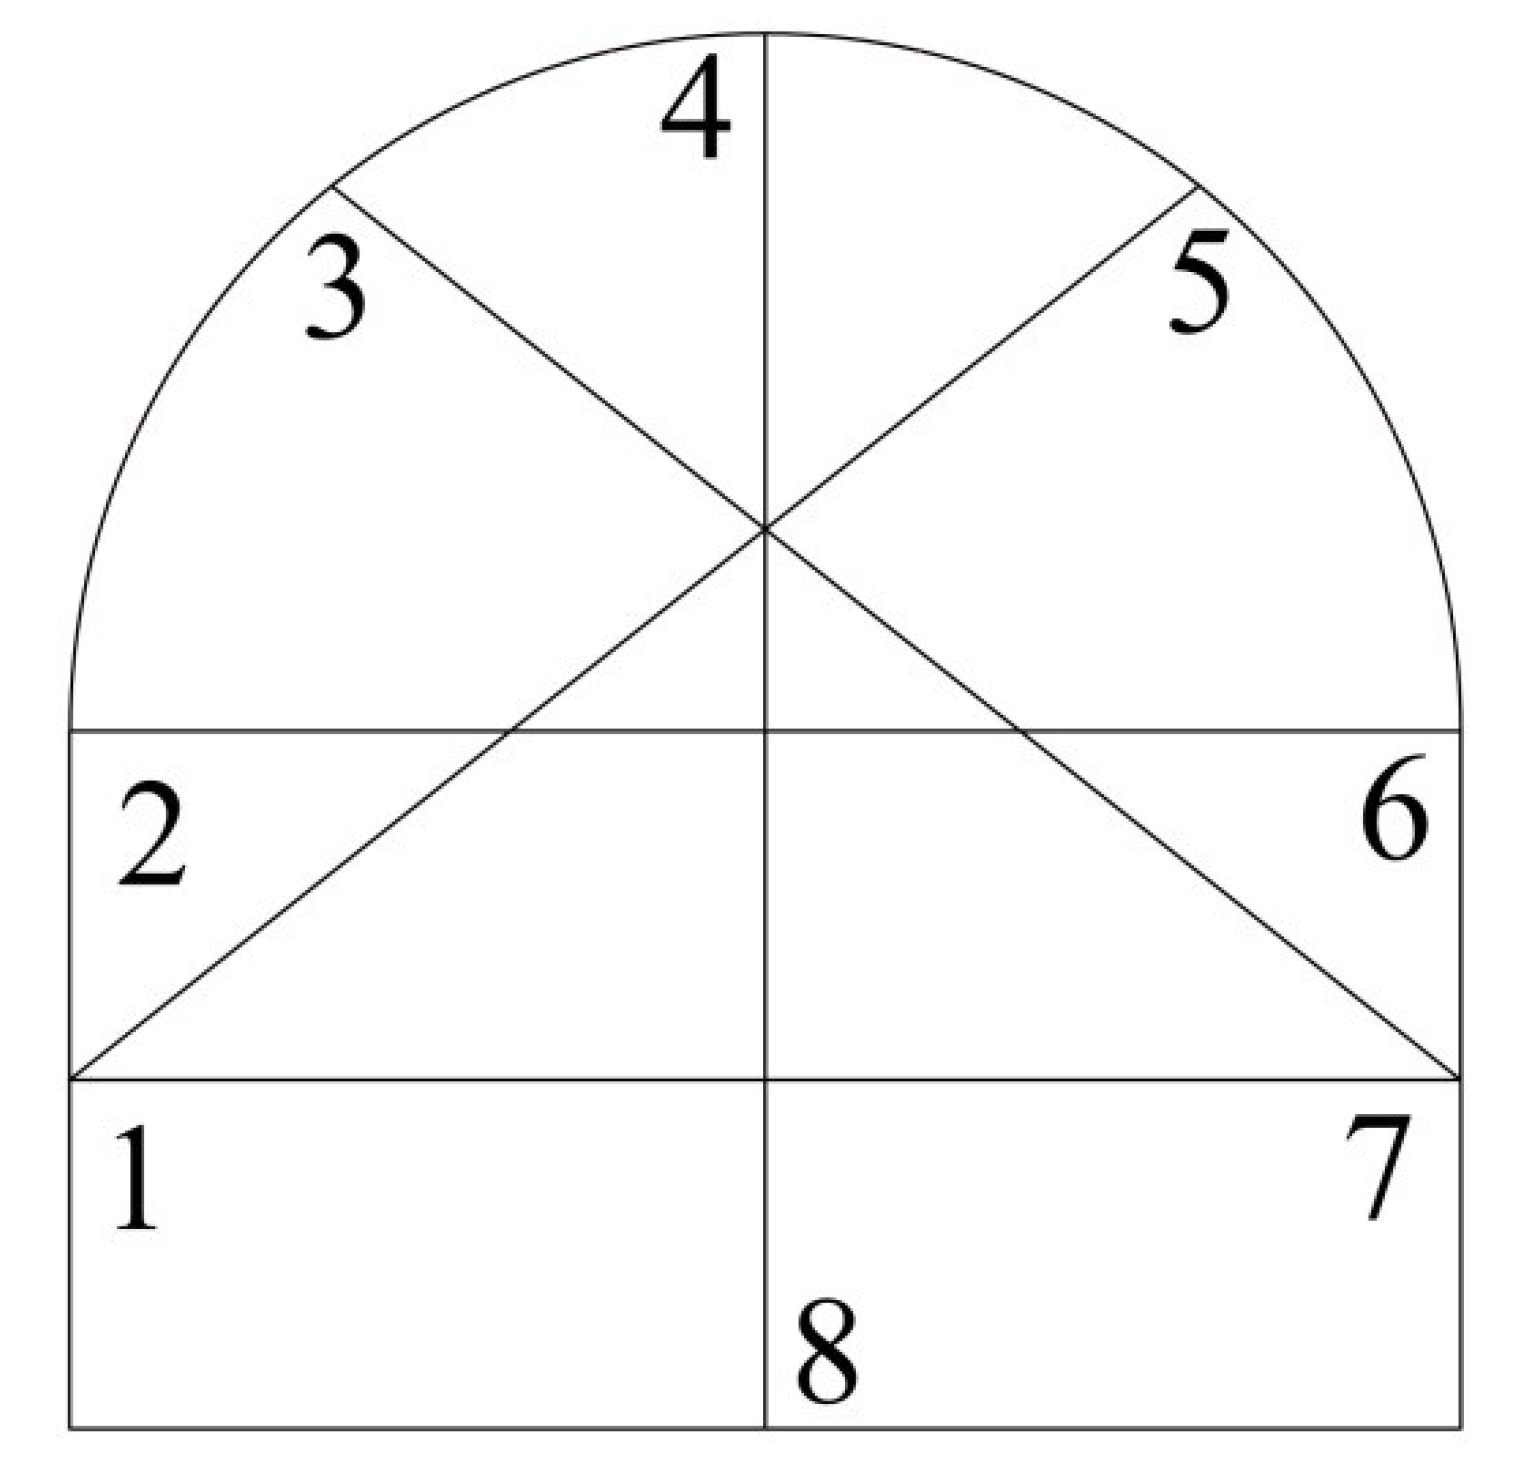
3.2. Numerical Model Establishment

The numerical model, as shown in Figure 8, was established according to the actual standard size of the tentative roadway: the semicircle arch radius is 2 m, and the height of the straight wall is also 2 m. The dimensions of the entire model are 40 m in length, 20 m in width, and 40 m in height. The displacement boundary is set in six directions to control the normal displacement, and triaxial ground stresses are applied in the model. The primary support is simulated based on the structural units in the software: a beam unit for the U-shape steel, a cable unit for the anchor, and a Shell unit for the concrete spray layer. In this program, Equation (4) is an incremental distribution function between 0–1 and the value of the parameters only affects the shape of the curve, so the value is required to be within a reasonable range, namely, the value of λ is in the same order of magnitude as c, m and λ refers to the literature [27] and [42]. Thus, λ and m were selected to be 1 × e6 and 2 respectively, and m was taken as 5 in Equation (7). Six numerical simulations were carried out in this paper, using the MC, SS, and SSD models under no support and primary support, respectively.

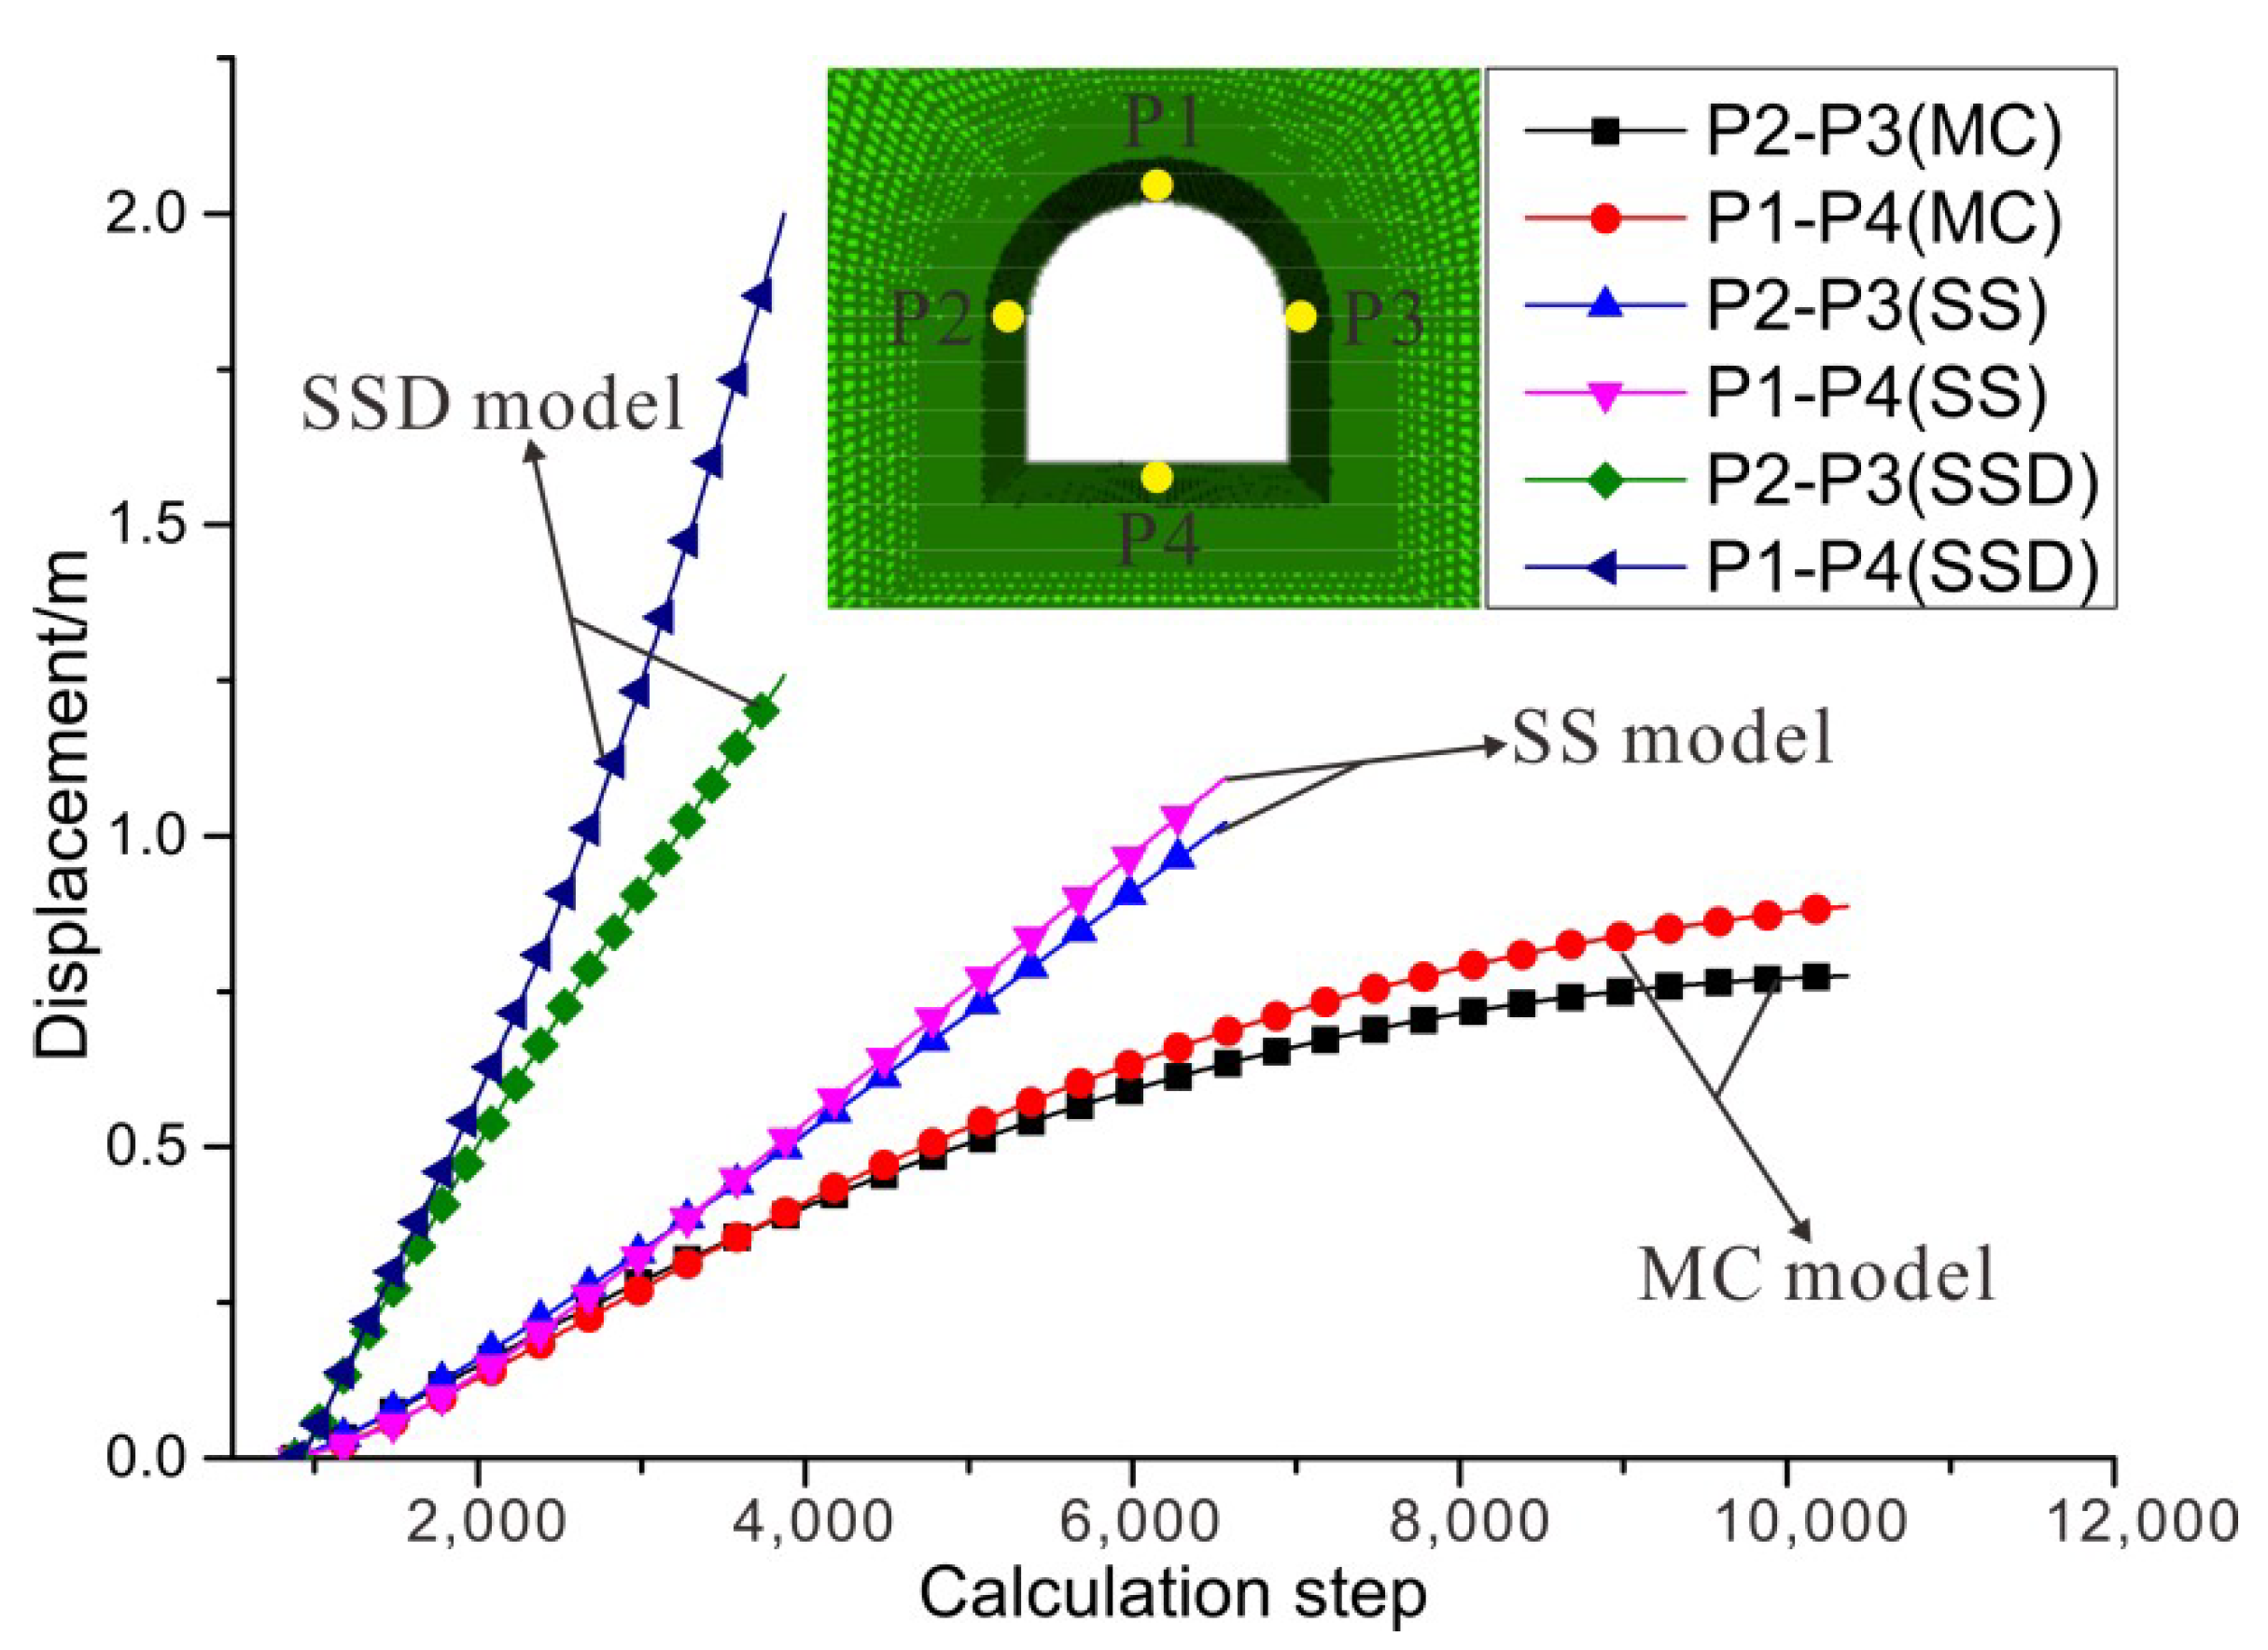
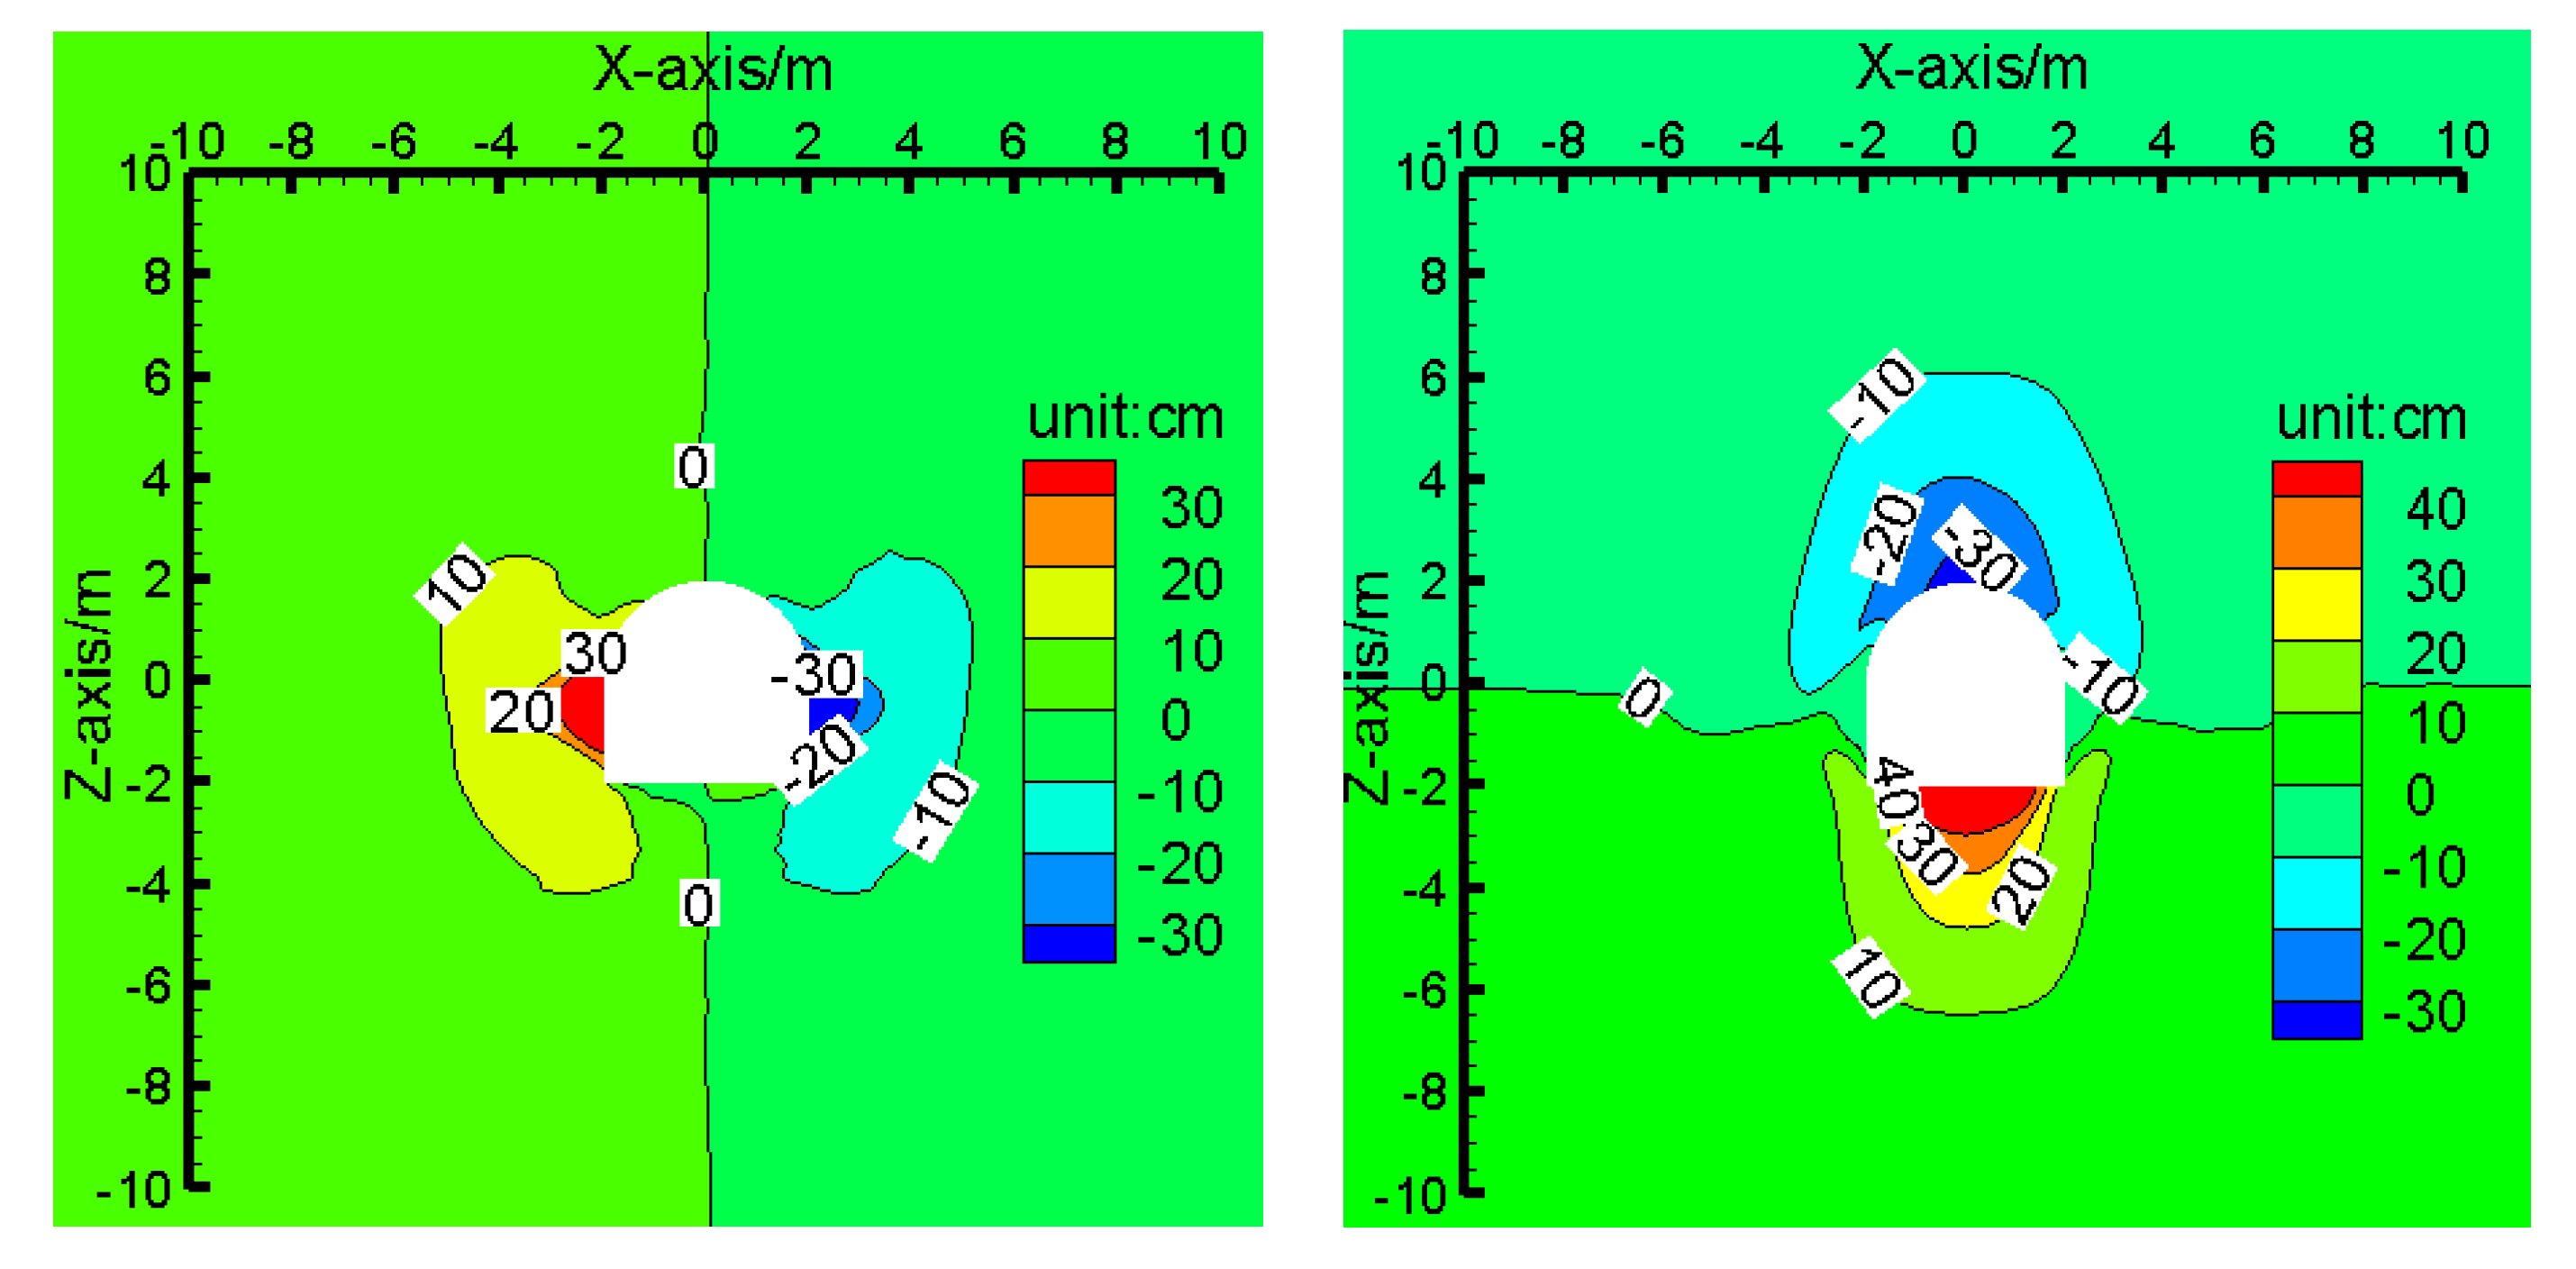
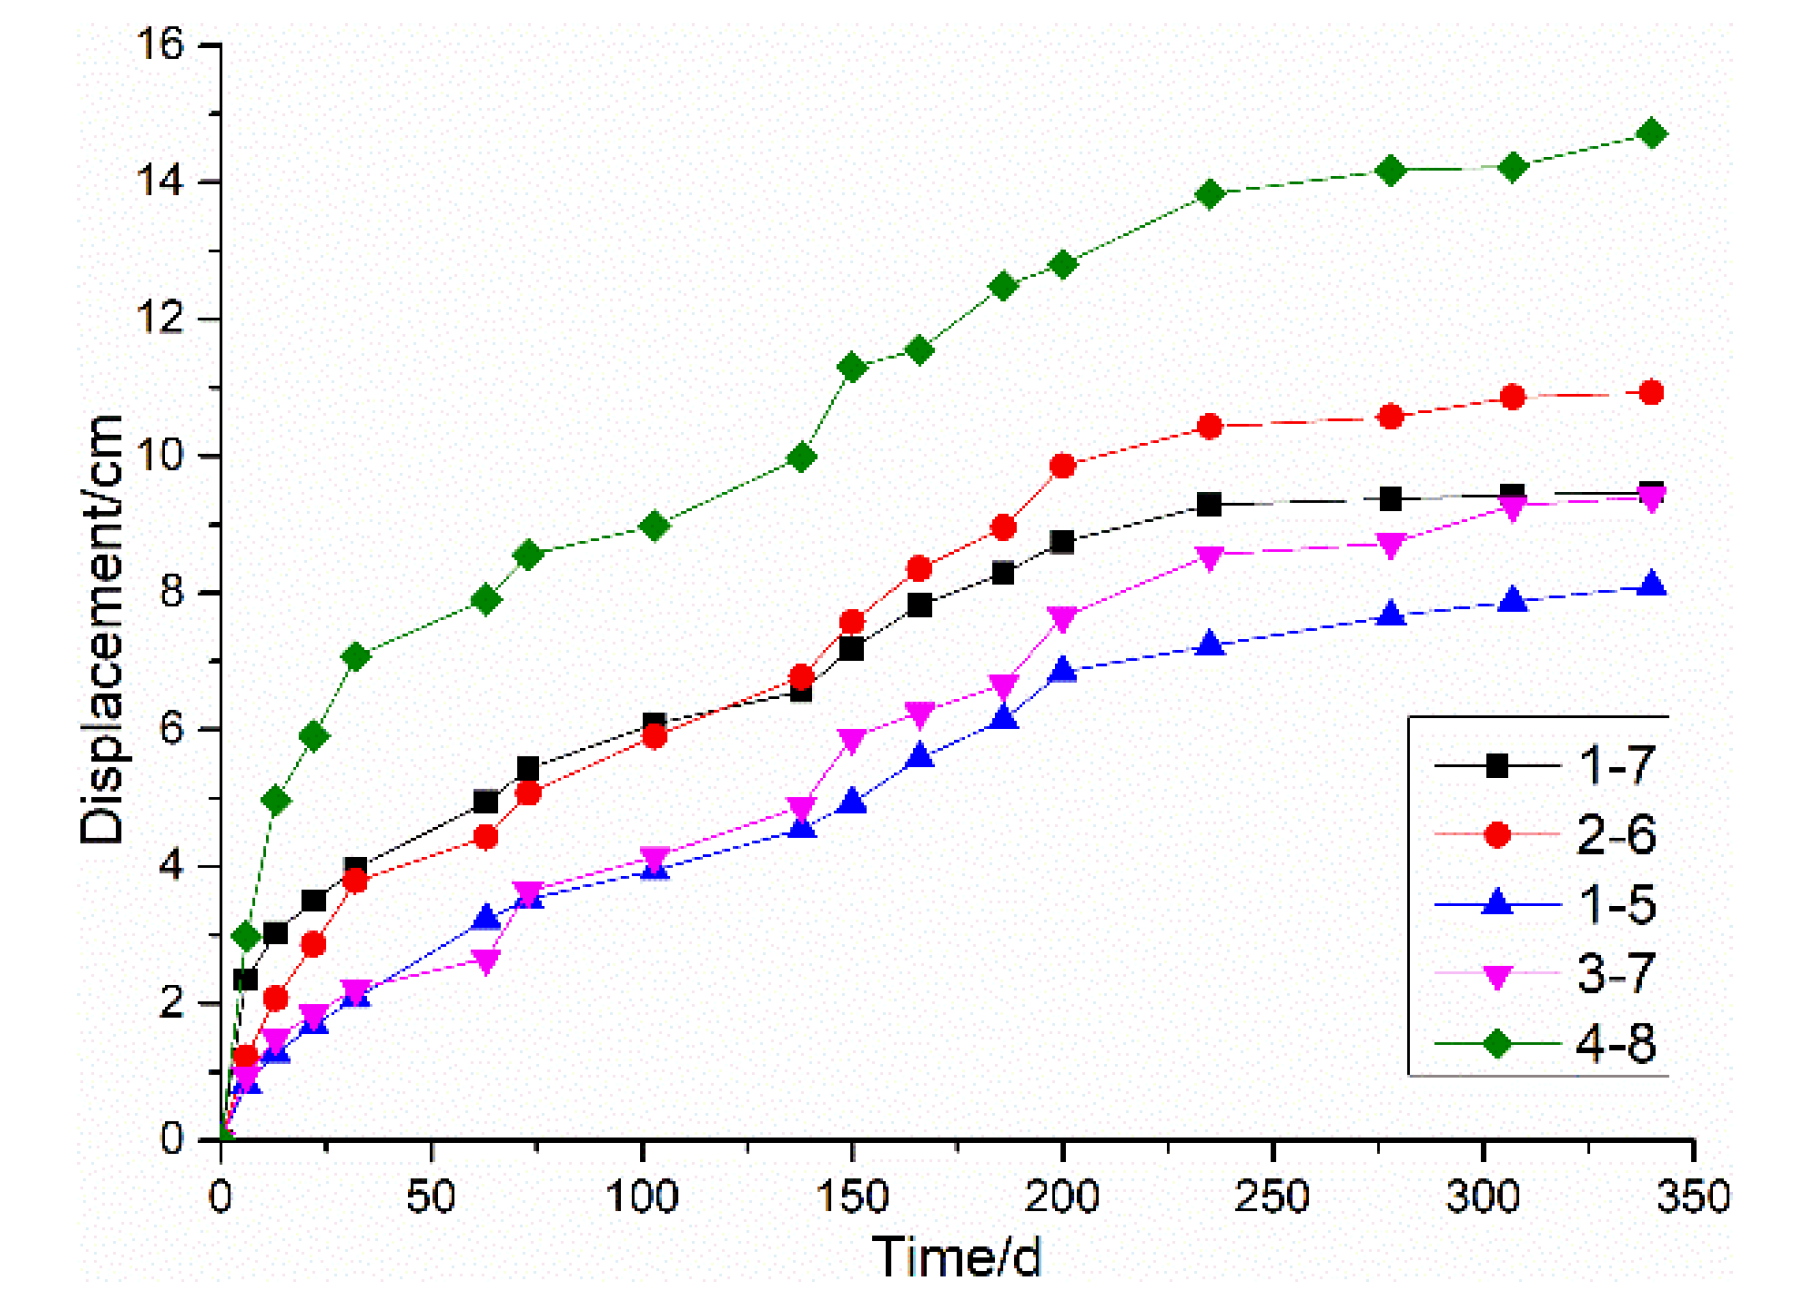
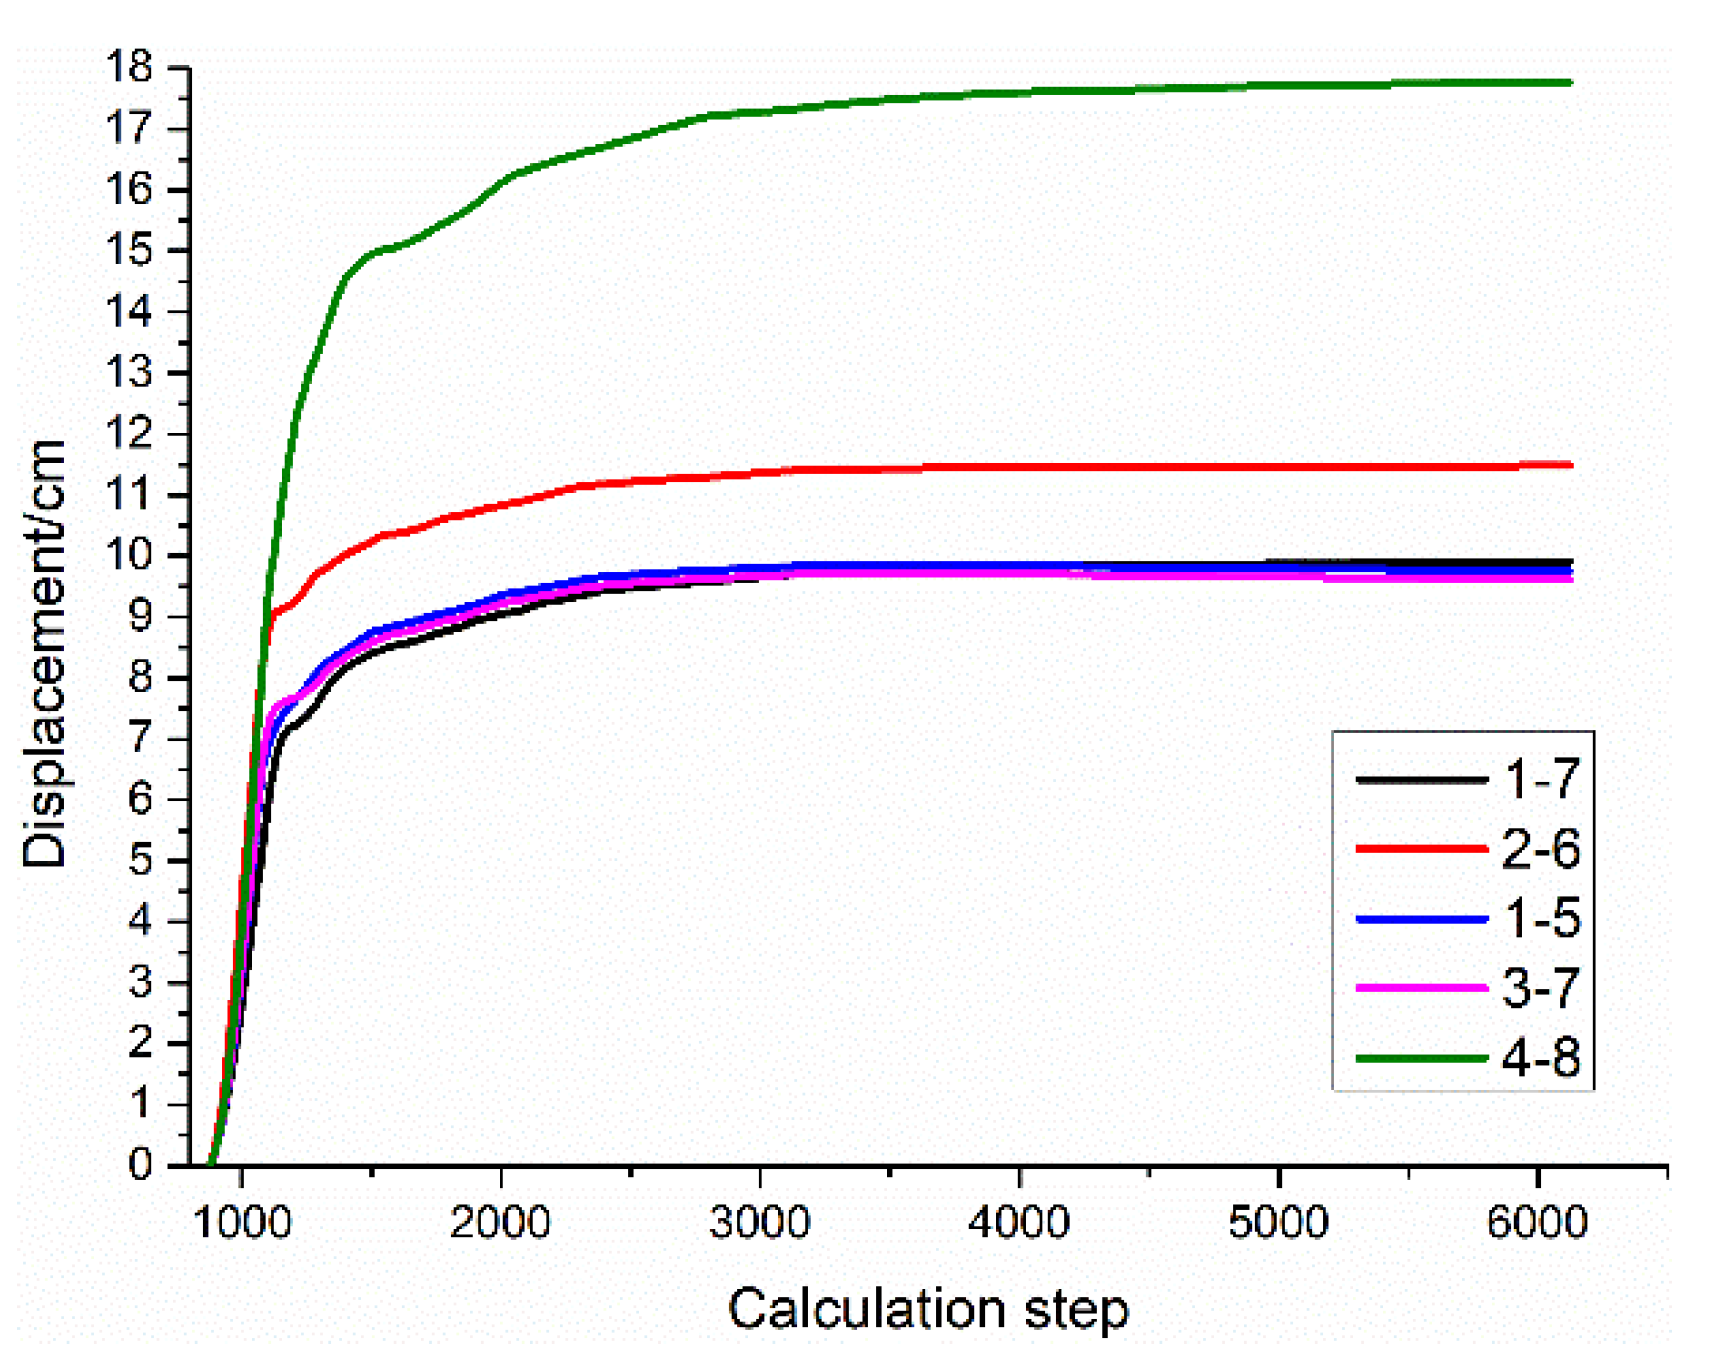
3.3. Results Analysis

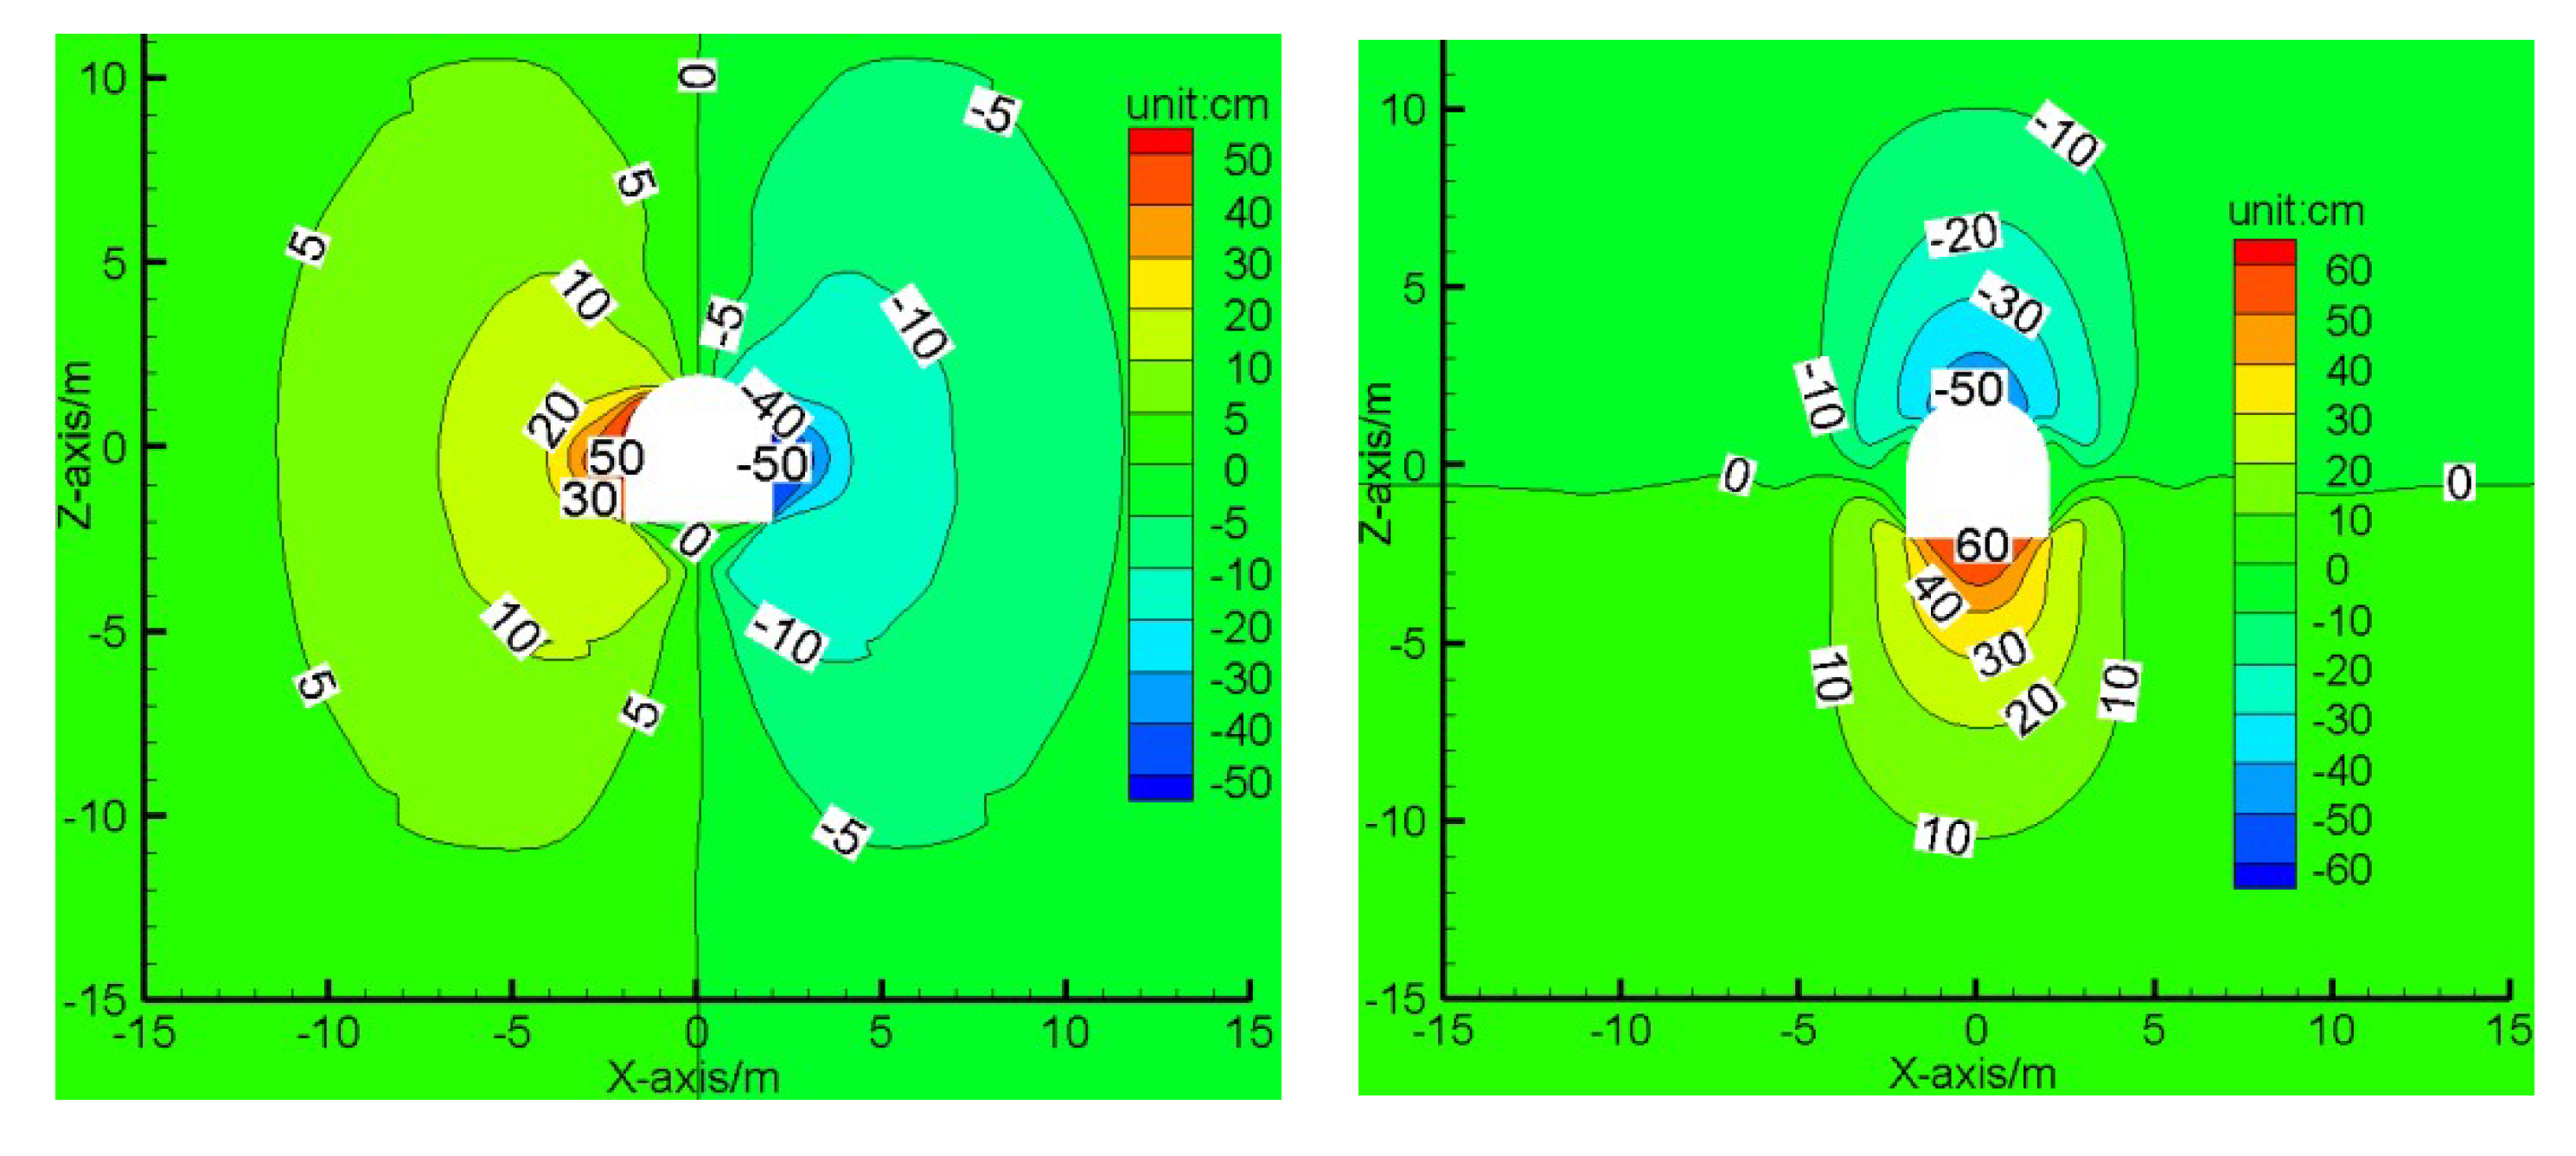
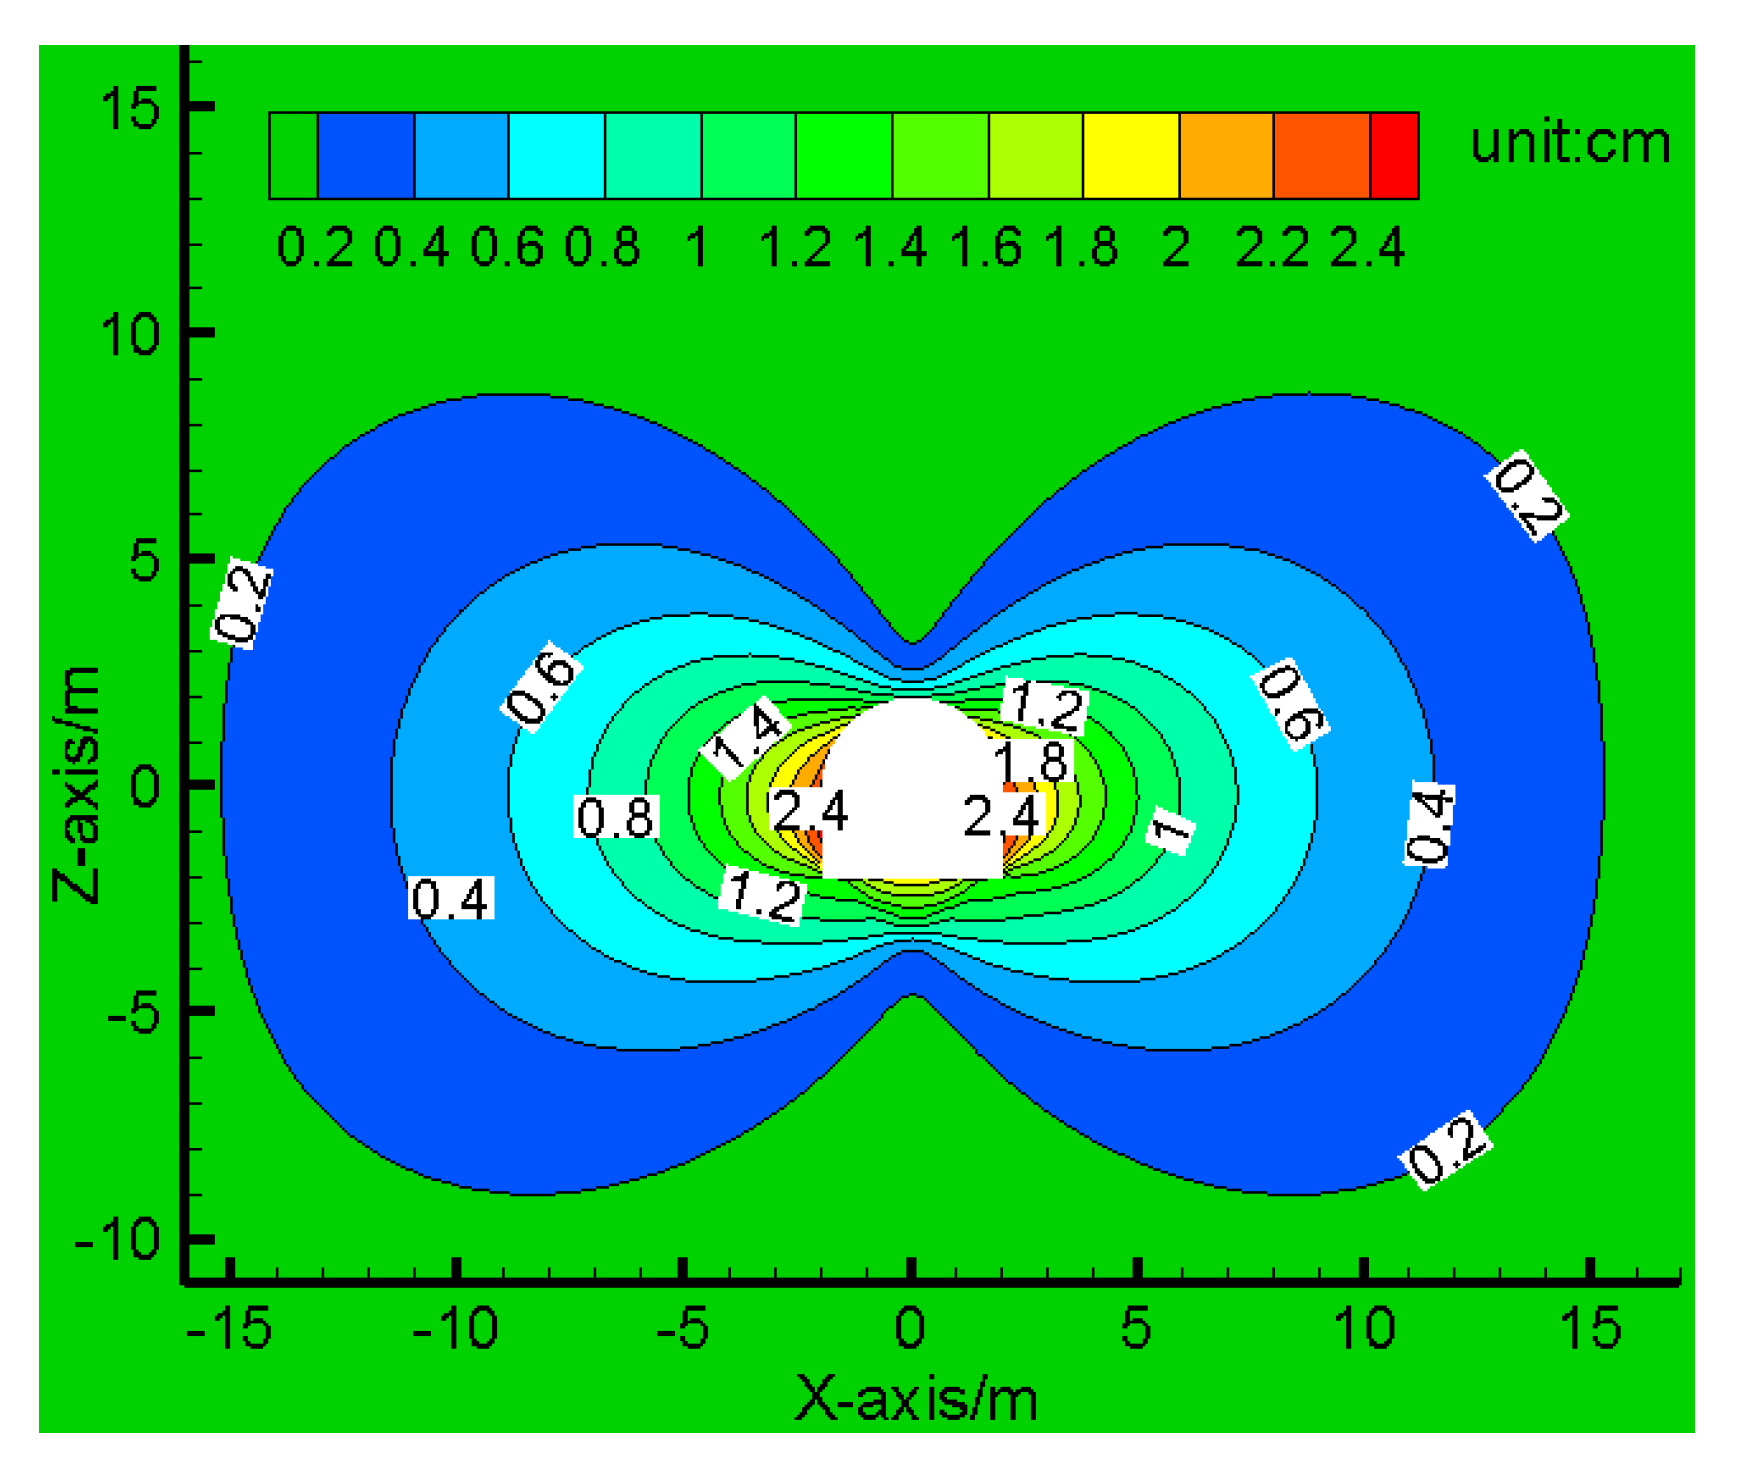
3.3.1. Unsupported Condition

The results of the horizontal and vertical displacement of the surrounding rock mass under the unsupported condition calculated using the MC model, SS model, and SSD model are shown in Figure 9, Figure 10, Figure 11 and Figure 12.
It can be seen from the Figures above that the excavation caused serious uneven deformation, including floor heave, roof subsidence and side shrinkage, in the surrounding rock of the roadway in the unsupported condition. The SSD model results of the maximum deformation of the sidewall, floor, and roof can be seen in Figure 11; the values are approximately 70, 100, and 100 cm, respectively. For horizontal displacement, the maximum value produced by the MC and SS models is uniformly distributed in a semi-elliptical way on the sidewall. However, the maximum value appeared near the shoulder of the arch, and the displacement distribution was layered in the SSD model, which coincides with the deformation and failure of the roadway near the study area, as shown in Figure 13(A) and (B). For the vertical displacement, the distribution characteristics are similar to the horizontal characteristics. Moreover, bigger deformations occurred on the roof, and the root of the wall in the SSD model was able to reflect the actual status of the roadway better, as shown in Figure 13(C) and (D). In order to compare the differences among the three models more directly, four monitoring points were set on the roof, floor, and two sides of the roadway. Figure 12 reveals that the displacement between two points increased the fastest in the SSD model, which illustrates that the strain-softening and statistical damage really work in this application. In summary, the SSD model can perform a better qualitative analysis of roadway deformation and failure.

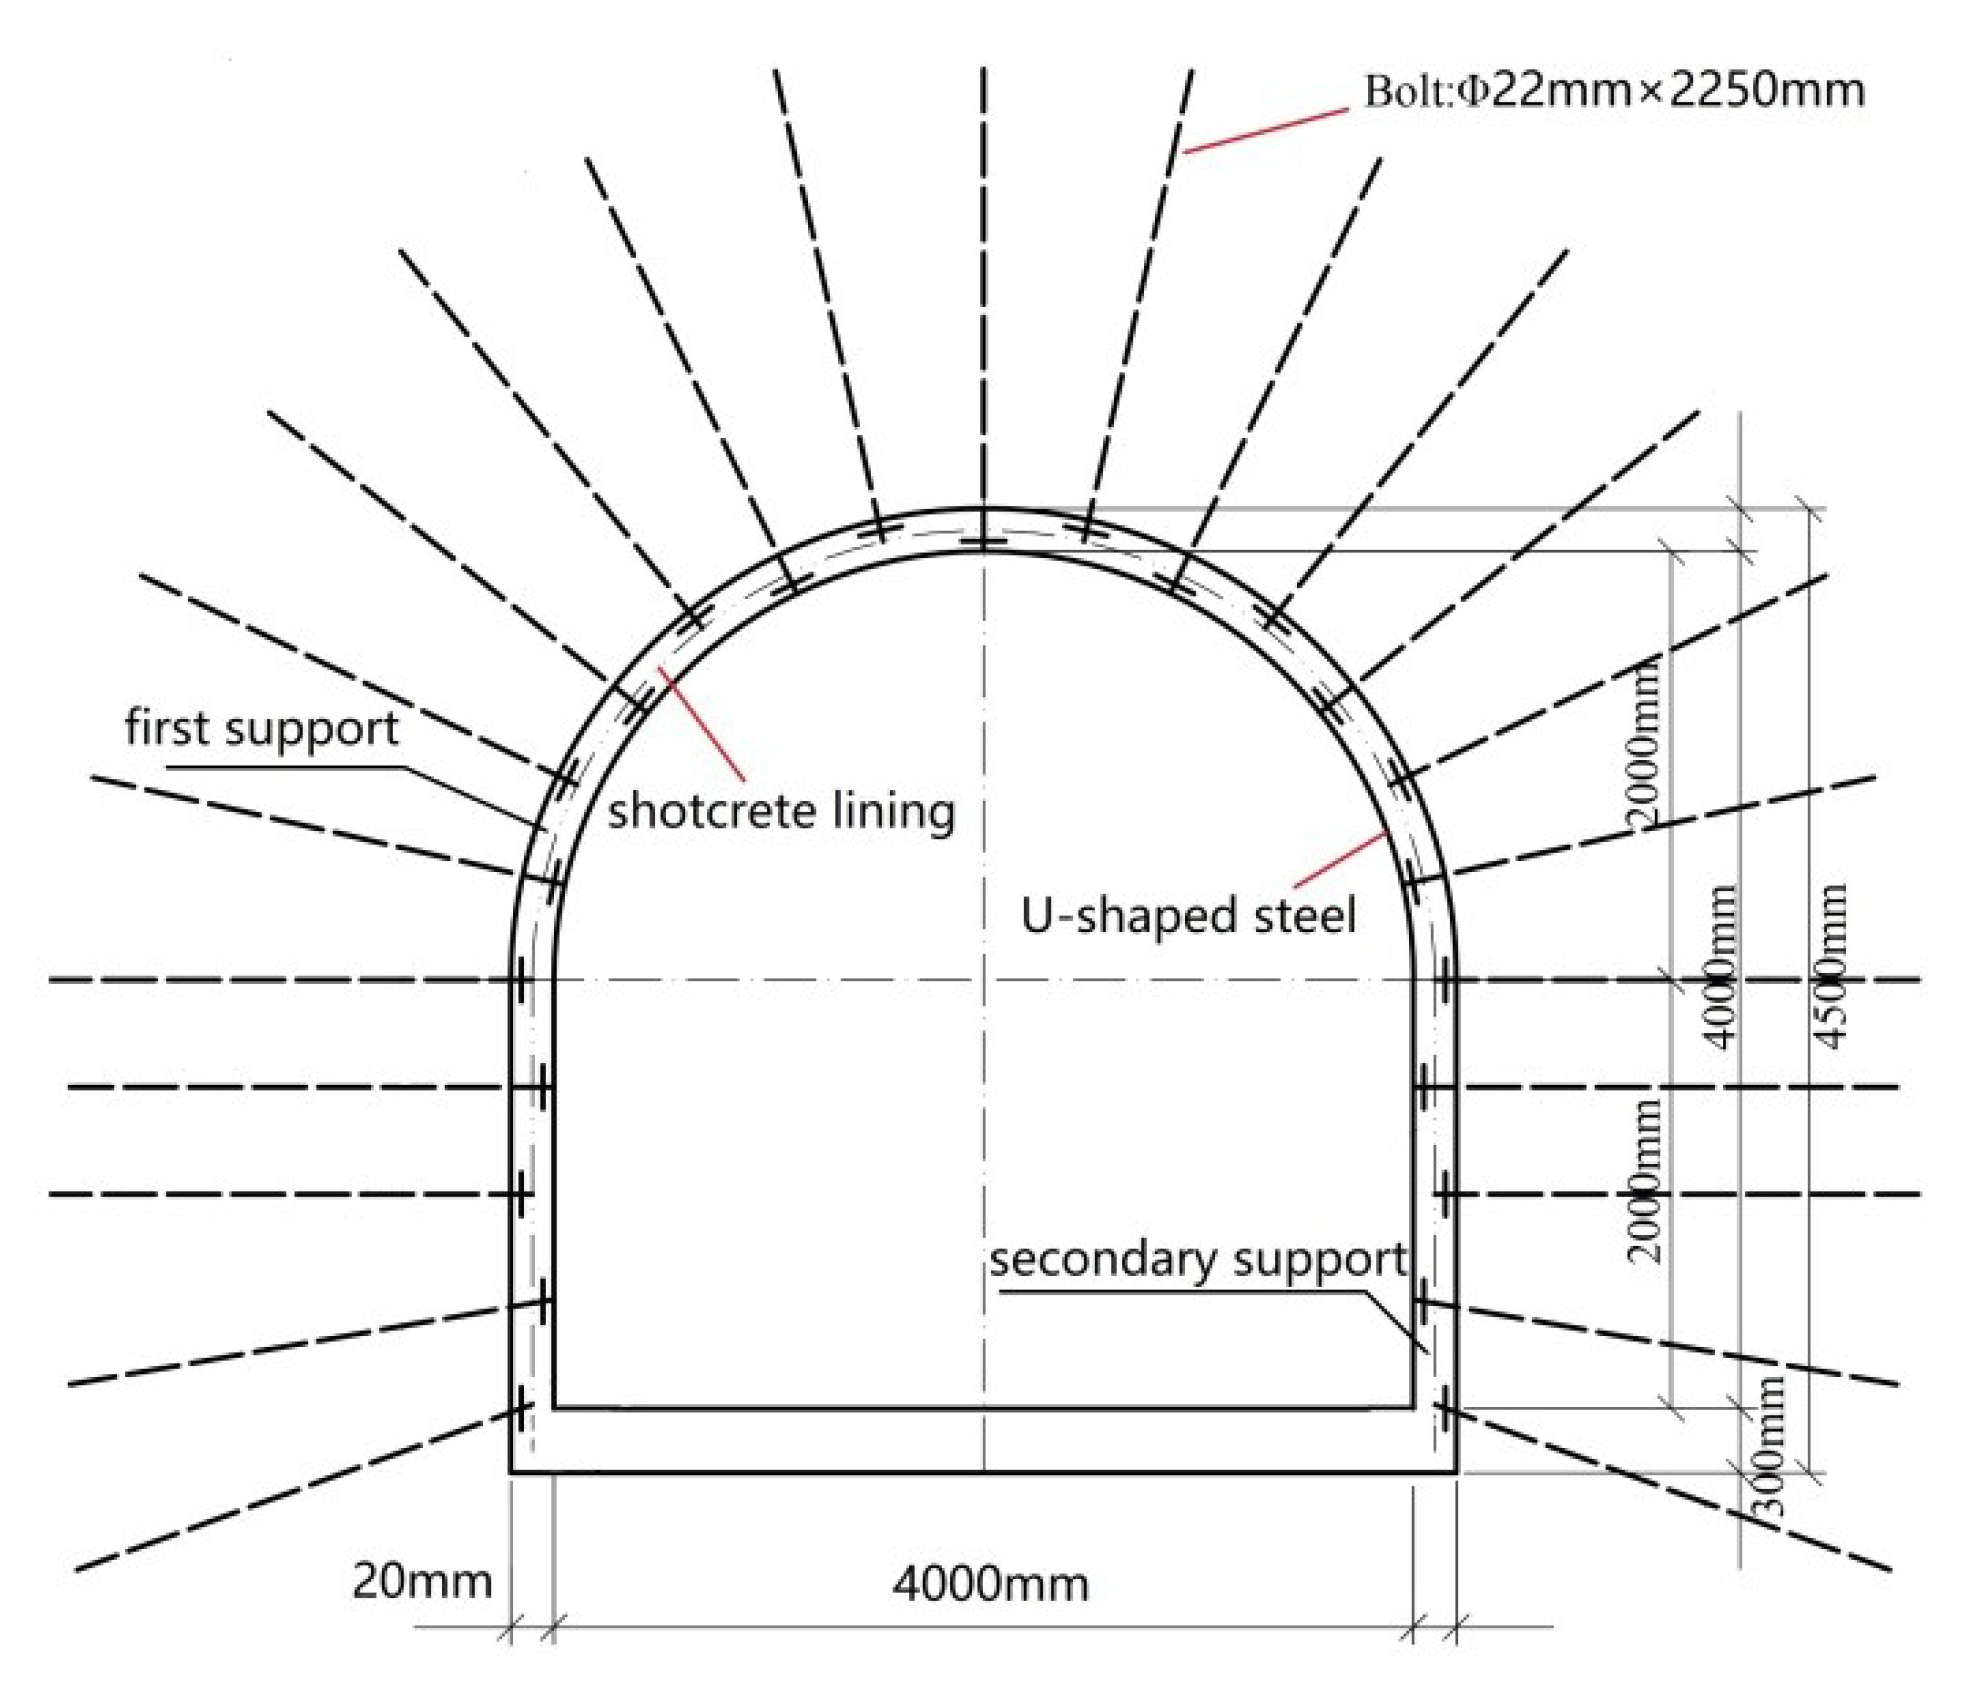
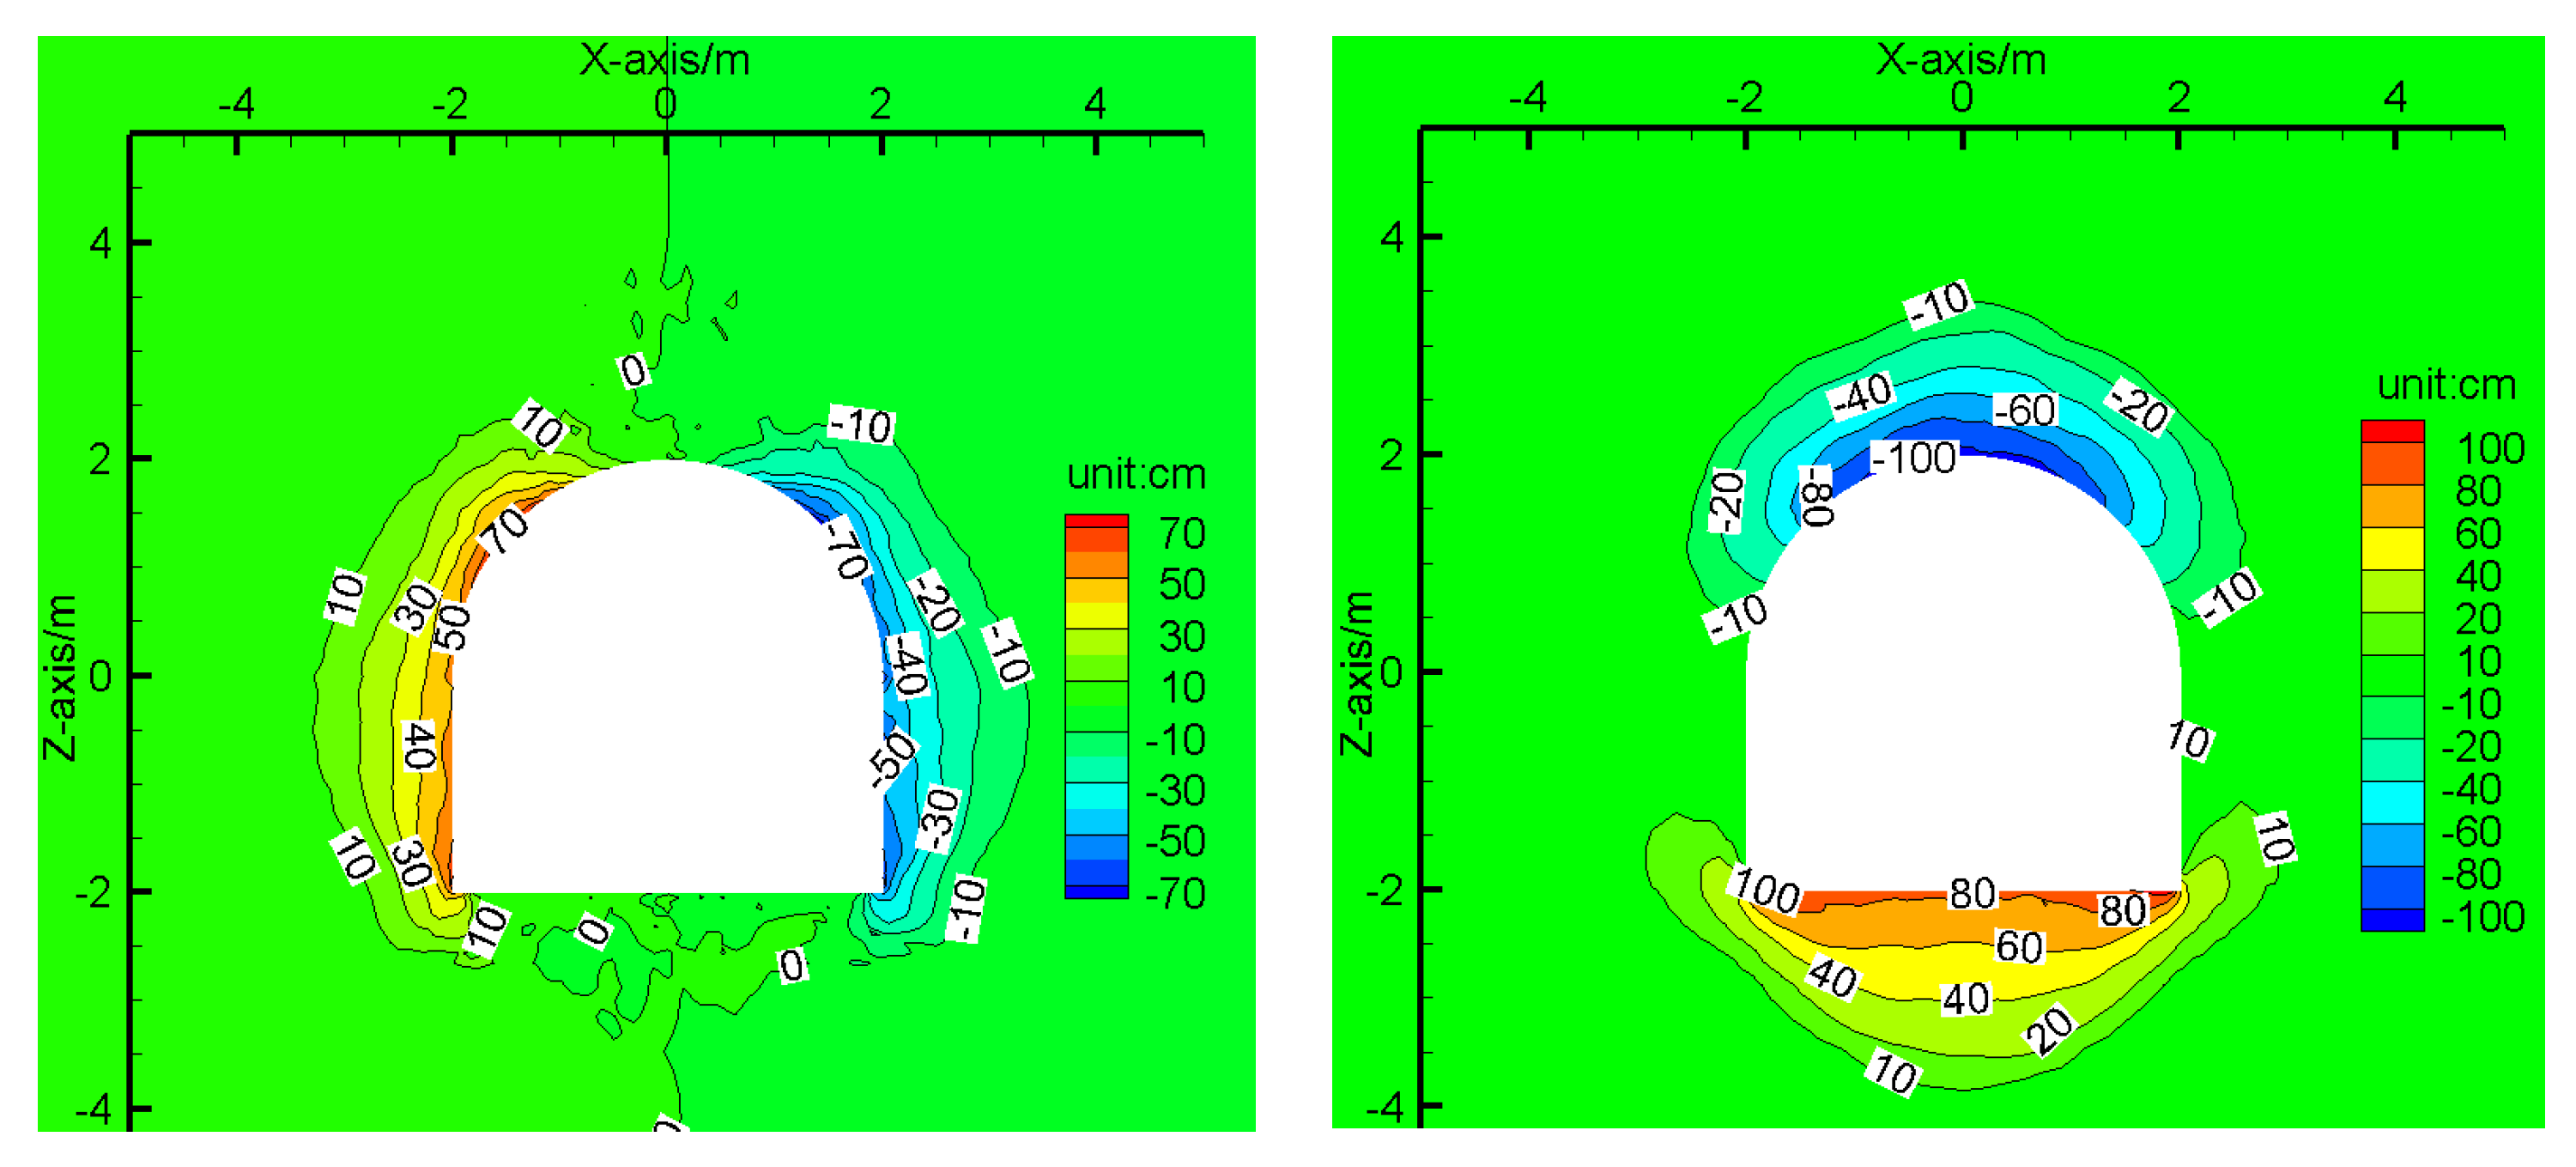
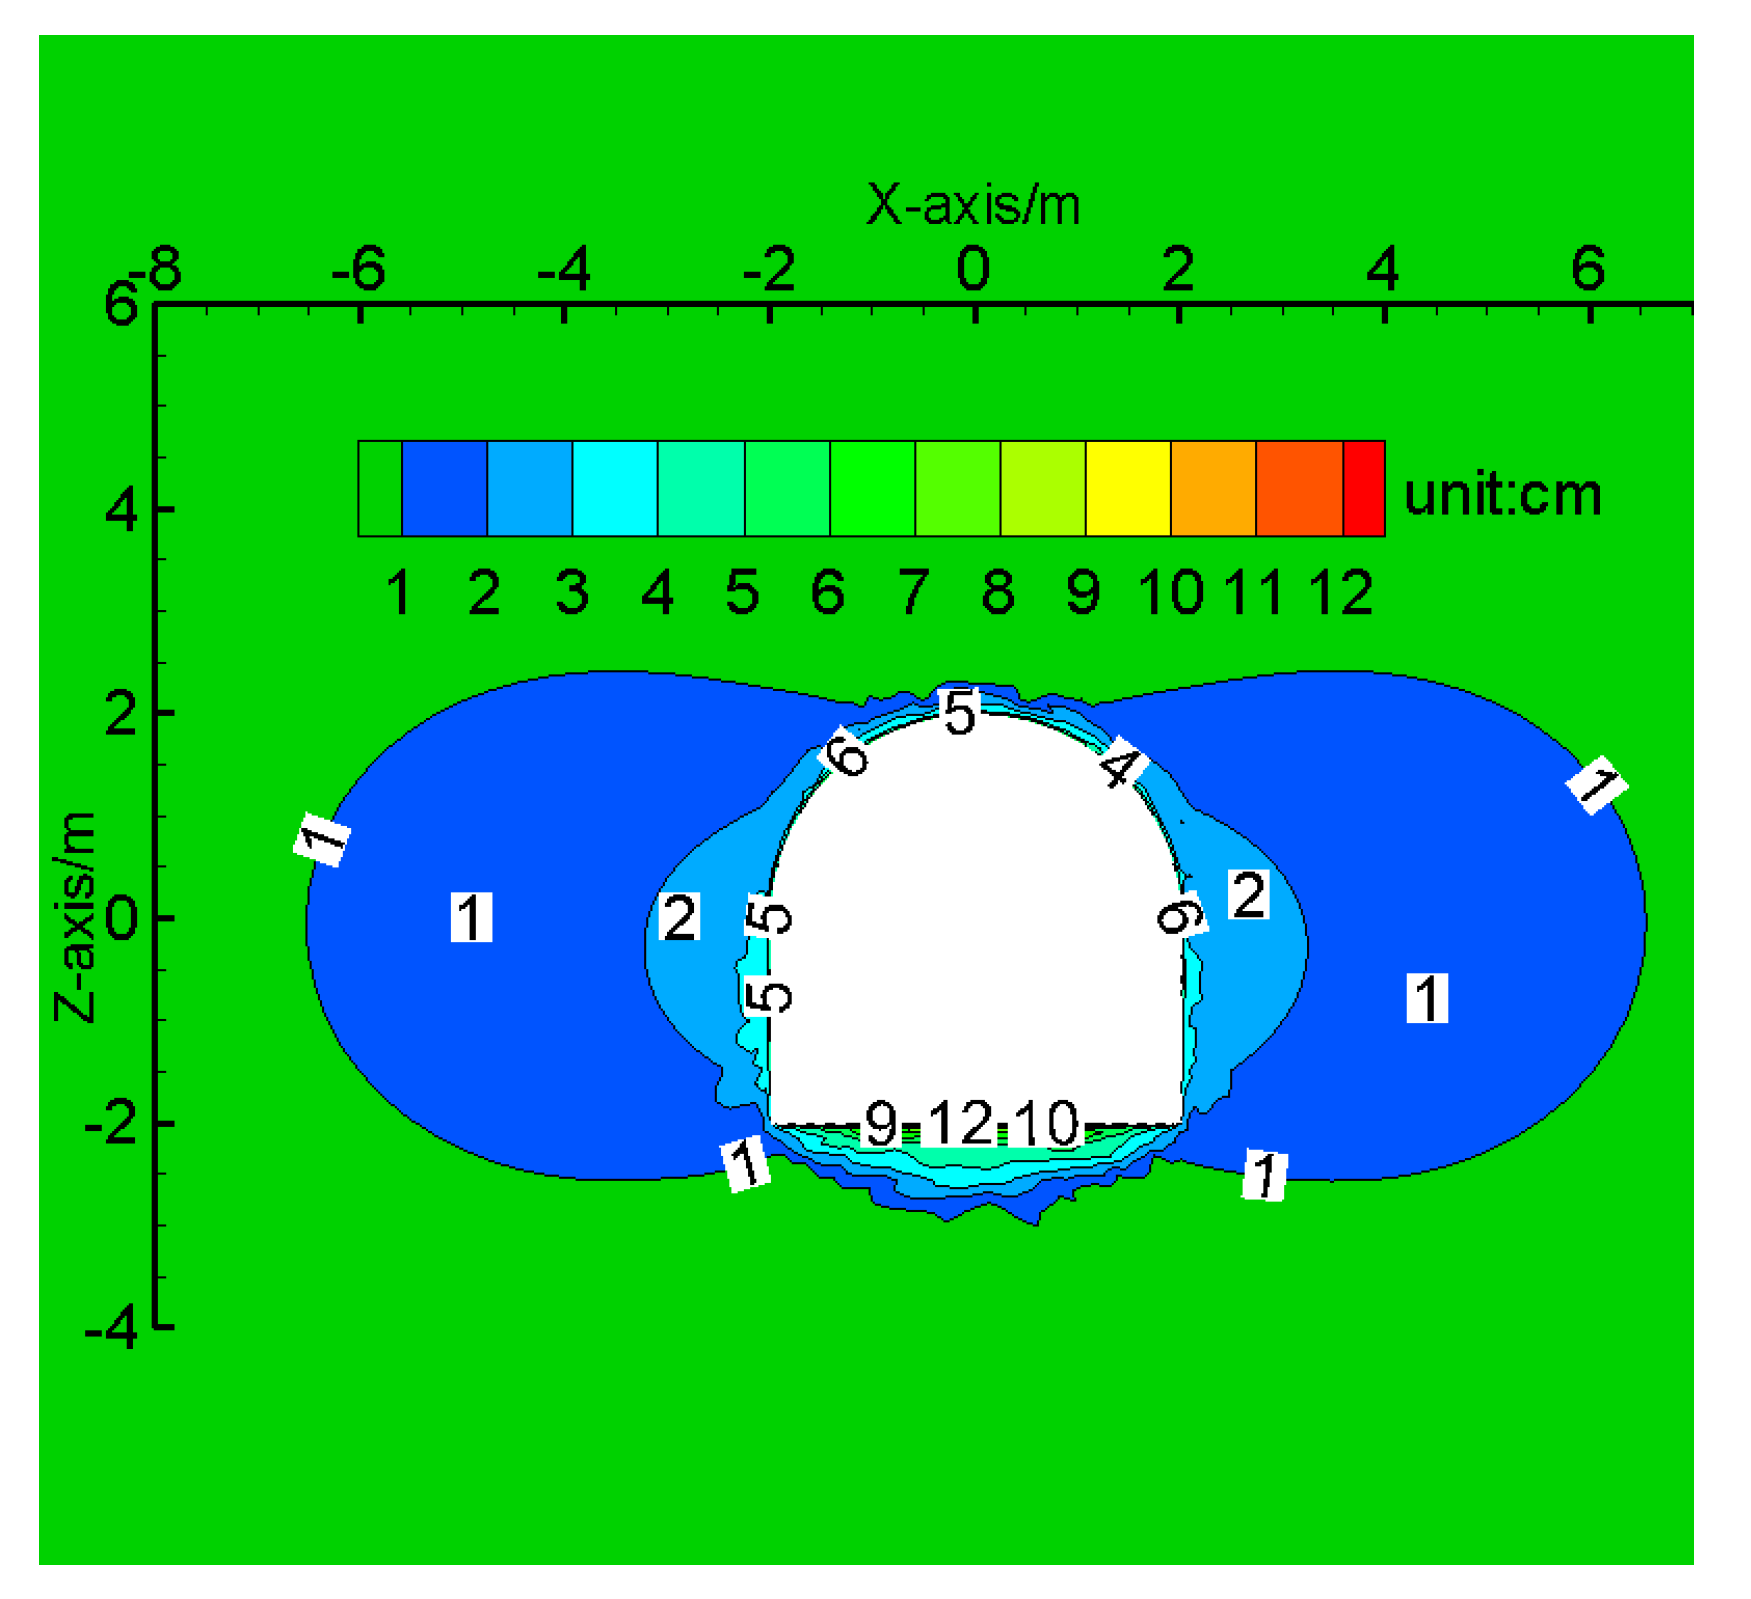
3.3.2. Under Primary Support

The computation results of the displacement of surrounding rock mass under the primary support based on the MC, SS, and SSD models were obtained and are shown in Figure 14, Figure 15 and Figure 16 in which the displacement is the result of the horizontal and vertical displacement.
As can be seen from the figures above, the current support method effectively controls the convergence deformation of the roadway, and the overall deformation is reduced by about an order of magnitude. The deformation of the roadway in the first two models mainly involves horizontal convergence, while the deformation of the roadway in the SSD model is larger at the roof and floor. The values of displacement in the MC and SS models are bigger than in the other two models.
At the same time, field monitoring was carried out in the test roadway in order to measure the deformation of the roadway and compare it with the numerical simulation results. Five monitoring sections with spacings of 5 m were selected for the test roadway, and eight monitoring points were set on each section, as shown in Figure 17. The deformation of each section was periodically monitored using a laser range finder (Figure 18). In the past year, 17 measurements were made on the test roadway, which is sufficient to accurately quantify the development of the surrounding rock deformation.
The average displacement curves of the monitoring points in the five sections are shown in Figure 19. I can be observed that the deformation process of the surrounding rock can be divided into three stages. Using 15 days and 200 days as the boundary points, the deformation experienced three stages: rapid growth, slow growth, and basic stability. At the last measurement, the maximum deformation occurred between points 4 and 8, which is the deformation of the top and bottom plates, and that was about 15 cm.
Then, the displacement values of each monitoring point were extracted from the computation results and plotted into curves, as shown in Figure 20, Figure 21 and Figure 22.
Comparing the displacement curves of surrounding rock mass based on the three models with the monitoring results, we can see that the curves of the SSD model are most similar to the monitored ones, regardless of the distribution law or the value. In terms of the distribution law of displacement, both the SSD model and the field monitoring are characterized by vertical convergence rather than the horizontal convergence shown by the MC model and the SS model. Furthermore, the displacement values of the SSD model agree well with the measured values—the vertical convergence (4–8) values are about 18 and 15 cm, respectively, and the horizontal convergence (1–7 and 2–6) values are about 9 and 10 cm, respectively. Thus, the SSD model can perform a better quantitative analysis of roadway deformation and failure.

4. Conclusions

In order to study the stability of deep tunnels and to address the shortcomings of the current constitutive model, a strain-softening model of heterogeneous jointed rock mass considering statistical damage was developed and implemented through FLAC3D simulation software. Then, based on a test roadway in the Jinchuan nickel mining area in China, numerical simulation calculations were carried out using the MC, SS, and SSD models; the computation results were compared with the field-monitoring results.
The results show that the SSD model simulates the behavior of the surrounding rocks well, and it can perform a better qualitative and quantitative analysis of roadway deformation and failure. Furthermore, the case study in the test roadway of the Jinchuan mine shows that the deformations of the roof and floor are larger under the primary support area, which may serve as a reference for the support pattern of deep roadways and provide a reference for simulation calculations for other similar projects.

Author Contributions

Data curation, G.L. (Guang Li); Formal analysis, G.L. (Guang Li), H.Z. and F.M.; Methodology, G.L. (Guang Li), G.L. (Gang Liu) and F.M.; Software, G.L. (Guang Li) and G.L. (Gang Liu); Writing—original draft, G.L. (Guang Li), J.G. and G.L. (Gang Liu).

Funding

The research was funded by the National Science Foundation of China (Grant Nos. 41831293, 41877274, and 41772341). Grateful appreciation is expressed for the support.

Acknowledgments

The authors would like to express their sincere gratitude to Jinchuan mine for their data supports. In addition, the authors are grateful to assigned editor and three anonymous reviewers for their enthusiastic help and valuable comments which have greatly improved this paper.

Conflicts of Interest

The authors declare no conflict of interest.

References

  1. Hoek, E.; Brown, E.T. Underground Excavations in Rock; Institution of Mining and Metallurgy: London, UK, 1980. [Google Scholar]
  2. Hudson, J.A. Rock Engineering Systems: Theory and Practice; Ellis Horwood: New York, NY, USA, 1992. [Google Scholar]
  3. Jing, L.R. A review of techniques, advances and outstanding issues in numerical modeling for rock mechanics and rock engineering. Int. J. Rock Mech. Min. Sci. 2003, 40, 283–353. [Google Scholar] [CrossRef]
  4. Jiang, Q.; Feng, X.T.; Zhou, H. Study on acceptable minimum interval of long deeply-burial hydropower tunnels in Jinping II Hydropower Station. Rock Soil Mech. 2008, 29, 656–662. [Google Scholar]
  5. Yong, W.S.; Ren, X.H.; Chen, X.R. Stability analysis and supporting design of surrounding rocks of diversion tunnel for Jinping II Hydropower Station. Rock Mech. Eng. 2005, 24, 3777–3782. [Google Scholar]
  6. Hsiung, S.M.; Chowdhury, A.H.; Nstsrjs, M.S. Numerical simulation of thermal-mechanical processes observed at the drift scale heater test at Yucca Mountain, Nevada, USA. Int. J. Rock Mech. Min. Sci. 2005, 42, 652–666. [Google Scholar] [CrossRef]
  7. Stanfors, R.; Rhen, I.; Tullborg, E.L. Overview of geological and hydro-geological conditions of the Aspö hard rock laboratory site. Appl. Geochem. 1999, 14, 819–834. [Google Scholar] [CrossRef]
  8. Tsang, C.F.; Jing, L.R. The DECOVALEXIII project: A summary of activities and lessons learned. Int. J. Rock Mech. Min. Sci. 2005, 42, 593–610. [Google Scholar] [CrossRef]
  9. Simo, J.C.; Oliver, J.; Armero, F. An analysis of strong discontinuities induced by strain-softening in rate-independent inelastic solids. Comput. Mech. 1993, 12, 277–296. [Google Scholar] [CrossRef]
  10. Nikolic, M.; Ibrahimbegovic, A.; Miscevic, P. Brittle and ductile failure of rocks: Embedded discontinuity approach for representing mode I and mode II failure mechanisms. Int. J. Numer. Methods Eng. 2015, 102, 1507–1526. [Google Scholar] [CrossRef]
  11. Nikolic, M.; Ibrahimbegovic, A. Rock mechanics model capable of representing initial heterogeneities and full set of 3D failure mechanisms. Comput. Methods Appl. Mech. Eng. 2015, 290, 209–227. [Google Scholar] [CrossRef]
  12. Boon, C.W.; Houlsby, G.T.; Utili, S. Designing Tunnel Support in Jointed Rock Masses Via the DEM. Rock Mech. Rock Eng. 2015, 48, 603–632. [Google Scholar] [CrossRef]
  13. Mahabadi, O.K.; Lisjak, A.; Munjiza, A.; Grasselli, G. Y-Geo: New Combined Finite-Discrete Element Numerical Codefor Geomechanical Applications. Int. J. Geomech. 2012, 12, 676–688. [Google Scholar] [CrossRef]
  14. Wu, W.; Zhu, H.H.; Lin, J.S.; Zhuang, X.Y.; Ma, G.W. Tunnel stability assessment by 3D DDA-key block analysis. Tunn. Undergr. Space Technol. 2018, 71, 210–214. [Google Scholar] [CrossRef]
  15. Leandro, L.; Rasmussena; Pedro, P.; Cacciarib, P. Efficient 3D probabilistic stability analysis of rock tunnels using a Lattice Model and cloud computing. Tunn. Undergr. Space Technol. 2019, 85, 282–293. [Google Scholar]
  16. Zheng, F.; Leung, Y.F.; Zhu, J.B.; Jiao, Y.Y. Modified predictor corrector solution approach for efficient discontinuous deformation analysis of jointed rock masses. Int. J. Numer. Anal. Methods Geomech. 2019, 43, 599–624. [Google Scholar] [CrossRef]
  17. Cui, L.; Zheng, J.J.; Zhang, R.J.; Dong, Y.K. Elasto-plastic analysis of a circular opening in rock mass with confining stress dependent strain-softening behaviour. Tunn. Undergr. Space Technol. 2015, 50, 94–108. [Google Scholar] [CrossRef]
  18. Alejano, L.R.; Alonso, E.; Rodríguez-Dono, A.; Fernández-Manín, G. Application of the convergence-confinement method to tunnels in rock masses exhibiting Hoek–Brown strain-softening behaviour. Int. J. Rock Mech. Min. Sci. 2010, 47, 150–160. [Google Scholar] [CrossRef]
  19. Zhou, X.P.; Qian, Q.H.; Yang, H.Q. Strength criteria of deep rock mass. Rock Mech. Eng. 2008, 27, 117–123. [Google Scholar]
  20. Leandro, A.; Alfonso, R.D.; Maria, V. Plastic radii and longitudinal deformation profiles of tunnels excavated in strain-softening rock masses. Tunn. Undergr. Space Technol. 2012, 30, 169–182. [Google Scholar]
  21. Lee, Y.K.; Pietruszczak, S. A new numerical procedure for elasto-plastic analysis of a circular opening excavated in a strain-softening rock mass. Tunn. Undergr. Space Technol. 2008, 23, 588–599. [Google Scholar] [CrossRef]
  22. Park, K.H.; Tonravanich, B.; Lee, J.G. A Simple Procedure for Ground Response Curve of Circular Tunnel in Elastic-Strain Softening Rock Masses. Tunn. Undergr. Space Technol. 2008, 23, 151–159. [Google Scholar] [CrossRef]
  23. Li, X.; Cao, W.G.; Su, Y.H. A statistical damage constitutive model for softening behavior of rocks. Eng. Geol. 2012, 143, 1–17. [Google Scholar] [CrossRef]
  24. Cao, W.G.; Li, P.; Zhao, M.H. On statistical damage constitutive model and its parameters for rock based on normal distribution. Chin. Hydrogeol. Eng. Geol. 2008, 32, 11–14. [Google Scholar]
  25. Liu, C.; Yang, L.; Cao, W. A statistical damage softening constitutive model for rock and back analysis of its parameters. Chin. J. Undergr. Space Eng. 2007, 3, 453–457. [Google Scholar]
  26. Weibull, W. A statistical distribution function of wide applicability. J. Appl. Mech. 1951, 18, 293–297. [Google Scholar]
  27. Yang, J.P.; Chen, W.Z.; Wu, G.J. Numerical determination of strength parameters of fractured rock masses using finite element method. Chin. J. Rock Mech. Eng. 2011, 30, 4002–4010. [Google Scholar]
  28. Cao, W.G.; Zhang, S.; Zhao, M.H. Study on statistical damage constitutive model of rock based on new definition of damage. Rock Soil Mech. 2006, 27, 41–46. [Google Scholar]
  29. Lemaitre, J.; Chaboche, J.L. Mechanics of Solid Materials; Cambridge University Press: Cambridge, UK, 1990. [Google Scholar]
  30. Lemaitre, J.A. How to use damage mechanics. Nucl. Eng. Des. 1984, 80, 233–245. [Google Scholar] [CrossRef]
  31. Li, S.; Li, G. Effect of heterogeneity on mechanical and acoustic emission characteristics of rock specimen. J. Cent. South Univ. Technol. 2010, 17, 1119–1124. [Google Scholar] [CrossRef]
  32. Liu, H.Y.; Kou, S.Q.; Lindqvist, P.A.; Tang, C.A. Numerical modelling of the heterogeneous rock fracture process using various test techniques. Rock Mech. Rock Eng. 2007, 40, 107–144. [Google Scholar] [CrossRef]
  33. Zhu, W.C.; Liu, J.; Tang, C.A.; Zhao, X.D.; Brady, B.H. Simulation of progressive fracturing processes around underground excavations under biaxial compression. Tunn. Undergr. Space Technol. 2005, 20, 231–247. [Google Scholar] [CrossRef]
  34. Itasca, F. Fast Lagrangian Analysis of Continua in 3 Dimensions; Online Manual: Hongkong, China, 2013. [Google Scholar]
  35. Ma, F.S.; Zhao, H.J.; Yuan, R.M.; Guo, J. Ground movement resulting from underground backfill mining in a nickel mine (Gansu Province, China). Nat. Hazards 2015, 77, 1475–1490. [Google Scholar] [CrossRef]
  36. Zhao, H.J.; Ma, F.S.; Zhang, Y.; Guo, J. Monitoring and mechanisms of ground deformation and ground fissures induced by cut-and-fill mining in the Jinchuan Mine 2, China. Environ. Earth Sci. 2013, 68, 1903–1911. [Google Scholar] [CrossRef]
  37. Lu, R.; Ma, F.S.; Guo, J.; Zhao, H.J. Analysis and monitoring of roadway deformation mechanisms in nickel mine, China. Concurr. Comput. Pract. Exp. 2018, 30, 350–362. [Google Scholar] [CrossRef]
  38. Jinchuan Non-Ferrous Metal Company, Beijing Central Engineering and Research Institute for Non-Ferrous Metallurgical Industry. The Research Report on the Technical Cooperation Rock Mechanics between China and Sweden; Jinchuan Non-Ferrous Metal Company: Hong Kong, China, 1988. [Google Scholar]
  39. Jinchuan Non-Ferrous Metal Company, Chinese Society of Rock Mechanics and Engineering. Engineering Geology and Rock Mechanics Problems in Jinchuan Nickel Mine; Jinchuan Non-Ferrous Metal Company: Hong Kong, China, 1996. [Google Scholar]
  40. Li, G.; Ma, F.S.; Guo, J. Application of steel tube confined concrete support in Jinchuan mine. Gold Sci. Technol. 2017, 25, 57–66. [Google Scholar]
  41. Li, G.; Ma, F.S.; Liu, G. Study on supporting parametric optimizing design and evaluate supporting effect of deep roadway in Jinchuan mine. Gold Sci. Technol. 2018, 26, 605–614. [Google Scholar]
  42. Tang, C.A.; Liu, H.Y.; Qin, S.Q. Influence of heterogeneity on crack propagation modes in brittle rock. Prog. Geophys. 2017, 32, 2200–2206. [Google Scholar]
Figure 1. Stress–strain relation of an element.
Sustainability 11 02399 g001
Figure 2. Program flowchart of the statistical damage (SSD) model.
Sustainability 11 02399 g002
Figure 3. Numerical model of the rock specimen.
Sustainability 11 02399 g003
Figure 4. Stain–stress–acoustic emission ringing count curves of different models.
Sustainability 11 02399 g004
Figure 5. Engineering geological map of Jinchuan mine.
Sustainability 11 02399 g005
Figure 6. Location of the test roadway.
Sustainability 11 02399 g006
Figure 7. Primary supporting method of the tentative roadway.
Sustainability 11 02399 g007
Figure 8. Numerical model of primary supporting.
Sustainability 11 02399 g008
Figure 9. Horizontal and vertical displacement of the surrounding rock mass under no support calculated by the MC model.
Sustainability 11 02399 g009
Figure 10. Horizontal and vertical displacement of the surrounding rock mass under no support calculated by the SS model.
Sustainability 11 02399 g010
Figure 11. Horizontal and vertical displacement of surrounding rock mass under no support calculated by the SSD model.
Sustainability 11 02399 g011
Figure 12. Displacement curve of monitoring points in the roadway under no support calculated by the three models.
Sustainability 11 02399 g012
Figure 13. Deformation and failure of the roadway near the study area: (A,B), surface cracking and layered peeling; (C) roof subsidence; (D) floor heave.
Sustainability 11 02399 g013
Figure 14. Displacement of the surrounding rock mass under current support calculated by the MC model.
Sustainability 11 02399 g014
Figure 15. Displacement of the surrounding rock mass under current support calculated by the SS model.
Sustainability 11 02399 g015
Figure 16. Displacement of the surrounding rock mass under current support calculated by the SSD model.
Sustainability 11 02399 g016
Figure 17. Monitoring points.
Sustainability 11 02399 g017
Figure 18. Field monitoring.
Sustainability 11 02399 g018
Figure 19. Displacement curves of the monitoring points at the roadway surface under current support.
Sustainability 11 02399 g019
Figure 20. Displacement curves of surrounding rock mass under current support calculated by the MC model.
Sustainability 11 02399 g020
Figure 21. Displacement curves of surrounding rock mass under current support calculated by the SS model.
Sustainability 11 02399 g021
Figure 22. Displacement curves of surrounding rock mass under current support calculated by the SSD model.
Sustainability 11 02399 g022
Table 1. Intact rock properties and rock mass properties of the tentative roadway.
ParametersRMRDensity (kg·m−3)Elastic Moduli (GPa)Poisson′s RatioInternal Friction Angle (°) Cohesion (MPa)Tensile Strength (MPa)
Marble2900640.16429.511
Rock mass39.7240060.26350.70.8
Table 2. Ground stress in the test section.
ParametersValue (MPa)Direction (°)Dip Angle (°)
σ137.01325
σ217.662.2−79
σ313.142−10
Table 3. Parameters of the concrete lining.
Thickness (mm)Elastic Moduli (GPa)Poisson’s RatioInternal Friction Angle (°)Cohesion (MPa)Normal Stiffness
(KN·m−3)
Shear Stiffness
(KN·m−3)
100280.2301.353.4 × 1043.0 × 104
Table 4. Parameters of the anchor bolt.
Elastic Moduli (GPa)Cross Sectional Area (mm2)Perimeter (mm)Cohesion (MPa)Breaking Force (KN)Stiffness (MPa)
210380549218517.5
Table 5. Parameters of the U-shaped steel supports.
Elastic Moduli (GPa)Poisson’s RatioCross Sectional Area (mm2)Polar Moment of Inertia (m4)Y Moment of Inertia (m4)Z Moment of Inertia (m4)
2000.34.57 × 10321.74 × 10−69.29 × 10−612.45 × 10⁻⁶

