Article

Intersection of Physical and Anthropogenic Effects on Land-Use/Land-Cover Changes in Coastal China of Jiangsu Province

1
School of Geography and Ocean Science, Nanjing University, Nanjing 210023, China
2
School of Public Management, Guangdong University of Finance & Economics, Guangzhou 510320, China
3
School of Urban and Resources Sciences, Jinling College of Nanjing University, Nanjing 210089, China
*
Authors to whom correspondence should be addressed.
Sustainability 2019, 11(8), 2370; https://doi.org/10.3390/su11082370
Submission received: 20 March 2019 / Revised: 8 April 2019 / Accepted: 12 April 2019 / Published: 20 April 2019

Abstract

:
China is experiencing substantial land-use and land-cover change (LUCC), especially in coastal regions, and these changes have caused many ecological problems. This study selected a typical region of Jiangsu Province and completed a comprehensive and detailed spatial-temporal analysis regarding LUCC and the driving forces. The results show that the rate of land-use change has been accelerating, with land-use experiencing the most substantial changes from 2005 to 2010 for most land-use types and the period from 2010 to 2015 showing a reversed changing trend. Built-up land that occupies cropland was the main characteristic of land-use type change. Southern Jiangsu and the coastline region presented more obvious land-use changes. Social-economic development was the main factor driving increased built-up land expansion and cropland reduction. In addition, land-use policy can significantly affect land-use type changes. For land-cover changes, the normalized difference vegetation index (NDVI) for the land area without land-use type changes increased by 0.005 per year overall. Areas with increasing trends accounted for 82.43% of the total area. Both precipitation and temperature displayed more areas that were positively correlated with NDVI, especially for temperature. Temperature correlated more strongly with NDVI change than precipitation for most vegetation types. Our study can be used as a reference for land-use managers to ensure sustainable and ecological land-use and coastal management.

1. Introduction

Research on land-use and land-cover change (LUCC) is an important topic in the field of global environmental change [1]. LUCC causes a series of social and ecological problems, such as problems with food security [2], carbon stock loss [3,4], hydrological processes [5], and biodiversity loss [6]. To protect natural environments and allow for sustainable development, many studies have focused on analyzing the driving forces of LUCC [7,8,9,10,11].
For land-use type changes, the driving forces are usually defined as population growth [12], economical and industrial development [13,14], urbanization [15], and climate change [16,17]. Environmental and socioeconomic driving factors for a certain region always interact with each other and cause comprehensive effects on land-use type changes [18,19]. For land-cover changes, the normalized difference vegetation index (NDVI) is a commonly used index to analyze the current state of vegetation growth. The data sources include Advanced Very High-Resolution Radiometry (AVHRR), MODIS, and Spot Vegetation (SPOT VGT) [20]. The driving forces of NDVI are usually affected by climate change indicators, such as temperature and precipitation [21,22,23,24]. In addition, the results of relevant studies vary due to the complexities of the regions and vegetation characteristics [23,25,26,27]. Most studies have focused on single ecosystems, such as forests [28], grasslands [29,30], croplands [31], and wetlands [32]. Other studies have focused on the entire study area without consideration of different land coverages [33,34].
In recent years, some scholars have begun to study the changes in NDVI for different land use [35,36] and vegetation types [7,25,37] in some regions. Most studies focus on only land-use type changes or NDVI changes for an entire region without considering the effects of land-use type changes. This methodology can cause significant errors or deviations in the analysis of climate-based driving forces, especially in regions that have obvious land-use type changes [38]. Therefore, to provide a more accurate analysis, NDVI analyses should exclude transformed land-use areas. In addition, a comprehensive analysis, including driving forces analysis of both land-use type changes and land-cover changes, remains necessary.
Since the reform and opening up of policies proposed in 1978, China has been under continuous economic development and urbanization and is undergoing increasingly significant landscape changes [39,40], especially in coastal regions [41,42,43]. As China’s most developed coastal region, Jiangsu Province possesses a strong economy and LUCC is undergoing constant and substantial changes that have caused many environmental problems [3,44]. Jiangsu Province is within a transitional climate zone of warm temperate and subtropical climate zones and has diverse vegetation types, especially large areas of paddy land. In addition, land use in Jiangsu often has marine characteristics, such as saline vegetation [45] and salt pans distributed along the coastline [42]. The few previous related studies in this region were mainly carried out from the aspect of completing a driving forces analysis for only land-use type changes [44] or for analyzing NDVI changes in the whole area without the exclusion of transformed land areas, and without consideration of different vegetation types [46].
Since 2006, most coastal provinces in China have drawn up their coastal development plans and have had them approved by the Chinese government. Jiangsu Province enacted its development plan in 2009 [42] and is facing a greater challenge to solve the contradiction between social-economic development and environmental protection. Therefore, a further comprehensive study in this region is necessary and meaningful, as it would reveal the main driving forces of LUCC and guide land managers and the government to create more effective land-use policies and strategies.
Thus, our study attempts to fill in the current gaps of knowledge and has the following objectives: (1) show the LUCC characteristics both spatially and temporally; (2) determine the main land-use conflicts between economic development and environmental protection; and (3) help to determine the main driving forces for LUCC and propose relevant sustainable land-use strategies. This research considers the intersected physical and anthropogenic effects on LUCC since such comprehensive analysis is still lacking. This research has been performed at high resolution, with 30 m grid land use map and 500 m grid NDVI images. The NDVI changes analysis has been based on detailed vegetation types and the land-cover changes analysis excludes the effects from land-use changes. A research framework design such as this greatly improves the accuracy of the analysis, which can provide a technical reference for this research field. In addition, the land-use strategies proposed for Jiangsu are applicable to other regions facing the same LUCC problems in China and abroad.

2. Data and Methodology

2.1. Study Area

Jiangsu Province is located in eastern China, facing the Yellow Sea, within the longitudes of 116°18′ E–121°57′ E and the latitudes of 30°45′ N–35°20′ N (Figure 1). The economy in Jiangsu is considered strong within China, both historically and currently, and the gross domestic product (GDP) per capita is larger than that in the other provinces in China [47]. The annual temperature range is 13.6–16.1 °C, and the annual cumulative rainfall is approximately 1000 mm. A total of 85% of the terrain is plains with diverse vegetation types, and the natural vegetation includes evergreen coniferous forests, evergreen and deciduous broad-leaved forests, bamboo forests, grassland, and coastal saline vegetation, but these account for only 6% of the total regional area. There is a large area of crop vegetation covered in paddy fields and dry croplands, accounting for more than 80% of the entire regional area.

2.2. Data Sources

Land-use maps with a spatial resolution of 30 m were created from the Landsat data (TM/ETM+), with time series of 1995, 2000, 2005, 2010, and 2015. The land-use classifications included 6 first-level classifications and 25 second-level classifications [48]. These data are provided by the Institute of Geographic Sciences and Natural Resources Research. The comprehensive valuation accuracy of the first level of land use was >93%, and that of the second level was >90% [49]. The statistical data of land-use structure from 1995–2015 were provided by the Land and Resources Department of Jiangsu Province. The climate data from 13 meteorological stations were obtained from the China meteorological data network (http://data.cma.gov.cn/). The 500 m MODIS sensor NDVI data from 2000–2015 were provided by the International Scientific & Technical Data Mirror Site, Computer Network Information Center, Chinese Academy of Sciences (http://www.gscloud.cn), with all original data from the TERRA satellite. The digital vegetation types map was obtained from the Atlas of Jiangsu Province at a scale of 1:2,000,000 [50]. Population change and economic development were acknowledged as the main land-use change drivers [44], which were obtained from the “Jiangsu Statistical Yearbook”.

2.3. Methods

2.3.1. Land-Use Type Changes and Driving Forces Analysis

Physical conditions in Jiangsu Province are usually stable, while experiencing a variety of social-economic changes. Therefore, the social-economic driving factors may suitably explain land-use type changes [44]. Overall, quantitative analysis was performed for the following land-use types that presented obvious changes in linear trends: cropland Y 1 , residential and industrial land Y 2 , and transportation land Y 3 . Finally, the following driving factors were selected and assigned to the three land-use types: GDP X 1 , fixed-asset investment X 2 , urbanization rate X 3 , total population X 4 , urban population X 5 , rural population X 6 , urban per capita housing area X 7 , rural per capita housing area X 8 , annual passenger capacity X 9 , and annual cargo capacity X 10 . When the driving factors were selected and assigned to the different land-use types, the actual impact relationships were seriously considered. For example, we consider X 1 , X 2 and X 3 to represent the economic and urbanization levels, and therefore, these variables exhibit a significant influence on the changes in all land-use types; X 4 was assigned to Y 2 because Y 2 includes both urban residential land and rural residential land, and we consider that X 4 alone can suitably explain the influence of population on Y 2 . Therefore, X 5 and X 6 were not used to avoid repetitive analyses. For cropland, we believe that urban population and rural population should be discussed separately to provide a more accurate analysis (Table 1).
Using SPSS software, correlation analyses and multivariate models were applied to analyze the relationships between land-use type changes and various variables. The modelling steps were as follows: (1) Perform a correlation analysis. (2) Carry out a multicollinearity diagnosis on the independent variables of the main factor according to the correlation analysis results. If there is no multicollinearity between the driving factors, use the multivariate linear regression model to perform the analysis. (3) If there is multicollinearity between the driving factors, use the ridge trace to calculate the value of parameter k, establish a ridge regression model and perform the regression analyses [51].
The areas of woodlands, grasslands, and water were relatively small, and the linear change effects were not obvious. Although these area changes were also affected by social-economic forces, land-use policy had a much more obvious influence on their area changes. Therefore, we did not perform a quantitative analysis but discussed land-use policy qualitatively in further detail in the discussion.

2.3.2. NDVI, Climate Change, and Their Relationship

We performed an annual analysis of land-cover and climate change. The Kriging method was employed using ArcGIS 10.2, and annual precipitation and temperature maps were produced that cover the entire area of Jiangsu Province. Areas that had land-use type changes were removed to reduce deviation in the accuracy of the analyses. A simple linear slope analysis model was used to analyze the changing trends from 2000 to 2015 for each map [52,53] via Equation (1). In addition, for the relationship between NDVI and climate change, Pearson’s correlations for NDVI and temperature, and NDVI and precipitation were analyzed, and two-tailed P-values were used to determine the significance for each relationship. The calculations of slope and Pearson’s correlations were completed using coded programming in the MATLAB software.
s l o p e = n × i = 1 n i × N D V I i i = 1 n i i = 1 n N D V I i n × i = 1 n i 2 ( i = 1 n i ) 2
where slope is the NDVI changing trend, n is the number of studied time intervals (years), NDVIi is the annual NDVI for year i, and slope > 0 and slope < 0 represent increasing and decreasing tendencies of NDVI, respectively. To check the validity of the model, a p-test was used, and the tendencies were classified into 5 categories: highly significant (−) (slope < 0 and P < 0.01), significant (−) (slope < 0 and 0.01 ≤ P < 0.05), no significant change (P ≥ 0.05), significant (+) (slope > 0 and 0.01 ≤ P < 0.05), and highly significant (+) (slope > 0 and P < 0.01). Additionally, the same method was used to analyze the annual slopes of precipitation and temperature.

3. Results

3.1. Spatiotemporal Land-Use Changes

As shown in Table 2, from 1995–2015, the most prevalent land-use type was paddy fields, accounting for approximately 40% of the entire area. The second largest land-use type during this period was dry croplands, with the percentage decreasing from 25% to 24%. The area of paddy fields decreased continuously, with the area decreasing by 612.3 km2, 1053.53 km2, 1675.82 km2, and 557.17 km2 within the different periods. Dry cropland decreased continuously during the first three periods, with the period from 2005–2010 being the most substantial reduction of 2930.7 km2, however, the changing trend was reversed and showed a substantial increase of 2435.86 km2 during the period from 2010–2015. Jiangsu also has abundant water resources. Water areas accounted for 13.47% of the total area in 1995, continued to increase to 15.3% in 2010, but then decreased to 13.7% in 2015. The total water area increased by 2050.34 km2 from 1995–2010, most of which occurred from 2000–2005, but then the area decreased by 1625.95 km2 from 2010–2015. Built-up land experienced the most substantial changes, with the area increasing by 6118.42 km2 in the first three periods; then, the rate of increase accelerated, especially during the period from 2005–2010, which exhibited an increase of 4388.82 km2. Areas of woodlands and grasslands in Jiangsu appeared rather low, both decreasing from 1995–2010 but increasing from 2010–2015.
Land transformation analysis (Table 3) shows that 6.14% of land areas experienced a land-use type change from 1995–2015. A total of 3357.91 km2 of paddy fields were converted to built-up lands, accounting for 84.1% of the entire area transformed from paddy fields. Water areas were the second most abundant land-use type converted from paddy fields, but this area was much smaller than the area transformed to built-up land. For dry croplands, an area of 934.46 km2 was converted to built-up lands, and dry croplands contributed to the second highest transformation to water areas of 101.37 km2. The area transformed to woodlands was only 107.93 km2 and was mainly transformed from built-up lands. A total of 30.8% of grasslands, which is an area of 541.79 km2, was transformed, including transformation of 293.08 km2 to water areas and 113.07 km2 to built-up lands. Water area was mainly converted to built-up lands and grasslands, with areas of 215.47 km2 and 203.42 km2, respectively. Built-up lands were also converted to other land-use types, with the total area being 978.68 km2, and dry cropland was the main land-use type transformed to built-up lands, followed by grasslands and water areas.
A total of 93.86% of land in Jiangsu exhibited the same land-use types in 2015 to those in 1995. The largest areas of the remaining paddy field were located across the entire province, especially in the central and southern areas. The unchanged dry cropland (i.e., cropland with no land-use type changes from 1995 to 2015) was mainly distributed in the north and east along the coastline. Woodland distribution appeared to be more obvious in the southwest and north. Grasslands were distributed along rivers and coastlines. However, for built-up land, it was more concentrated in the south than in the north (Figure 2a). Figure 2b shows that the converted land was distributed across the whole province, especially in the southern part and the regions near the coastal line. The transformed land in the south appears more intensive and concentrated, where the conversion of paddy fields to built-up land was mainly distributed. The transformation area of the coastline region was much larger than that of the land blocks because transformation from grasslands mainly occurred at the coastline region. The midwest area also showed a large intensive and concentrated transformation, with conversion from dry croplands to woodlands, and the northern area displayed more transformation from dry croplands than the southern area. The conversion from woodlands was mainly distributed in the south-western and northern areas of Jiangsu, while water area conversion was distributed across the whole study area. Conversion of built-up lands to other land-use types was distributed more substantially in the north.

3.2. Driving Forces of Land-Use Changes

Correlation analysis (Table 4) shows that X1–X3, X5, X7, and X8 are all negatively correlated with cropland area change (Y1), all passed the significance test (P < 0.01), and all exhibited absolute values of correlation coefficients higher than 0.9, except for X2 (−0.895). In contrast, for rural populations (X6), these changes correlated positively with cropland area changes. Residential and industrial land (Y2) and transportation land (Y3) all correlated significantly and positively with their driving forces at a level of P < 0.01 and with high positive correlation coefficients. These results indicate that the social-economic driving forces we selected can suitably explain the decrease in cropland and the increase in built-up land.
According to the correlation analyses, an obvious multicolinearity was observed among the selected driving factors. Therefore, a ridge regression model was used to eliminate multicolinearity and establish linear regression models for each land-use type and their driving forces. Due to nonlinear changes in grasslands, we did not establish a linear regression model for this land-use type change. We found that the established regression model for croplands (Y1), residential and industrial lands (Y2), and transportation lands (Y3) can suitably describe the relationship between land-use area changes and driving forces, with R2 values of 0.897, 0.955, and 0.926, respectively, which were all significant at a level of P < 0.01.
Y1 = 53,352.83 − 0.014X1 − 0.029X2 − 24.778X3 − 0.293X5 + 0.349X6 − 79.926X7 − 31.057X8 (R2 = 0.846, P = 0.0004)
Y2 = 4847.52 + 0.028X1 + 0.055X2 + 14.646X3 + 0.818X4 + 59.111X7 + 19.92X8 (R2 = 0.955, P = 0.0000)
Y3 = 461.86 + 0.008X1 + 0.022X2 + 0.666X3 + 0.029X4 + 0.00008X9 + 0.0011X10 (R2 = 0.926, P = 0.0036)

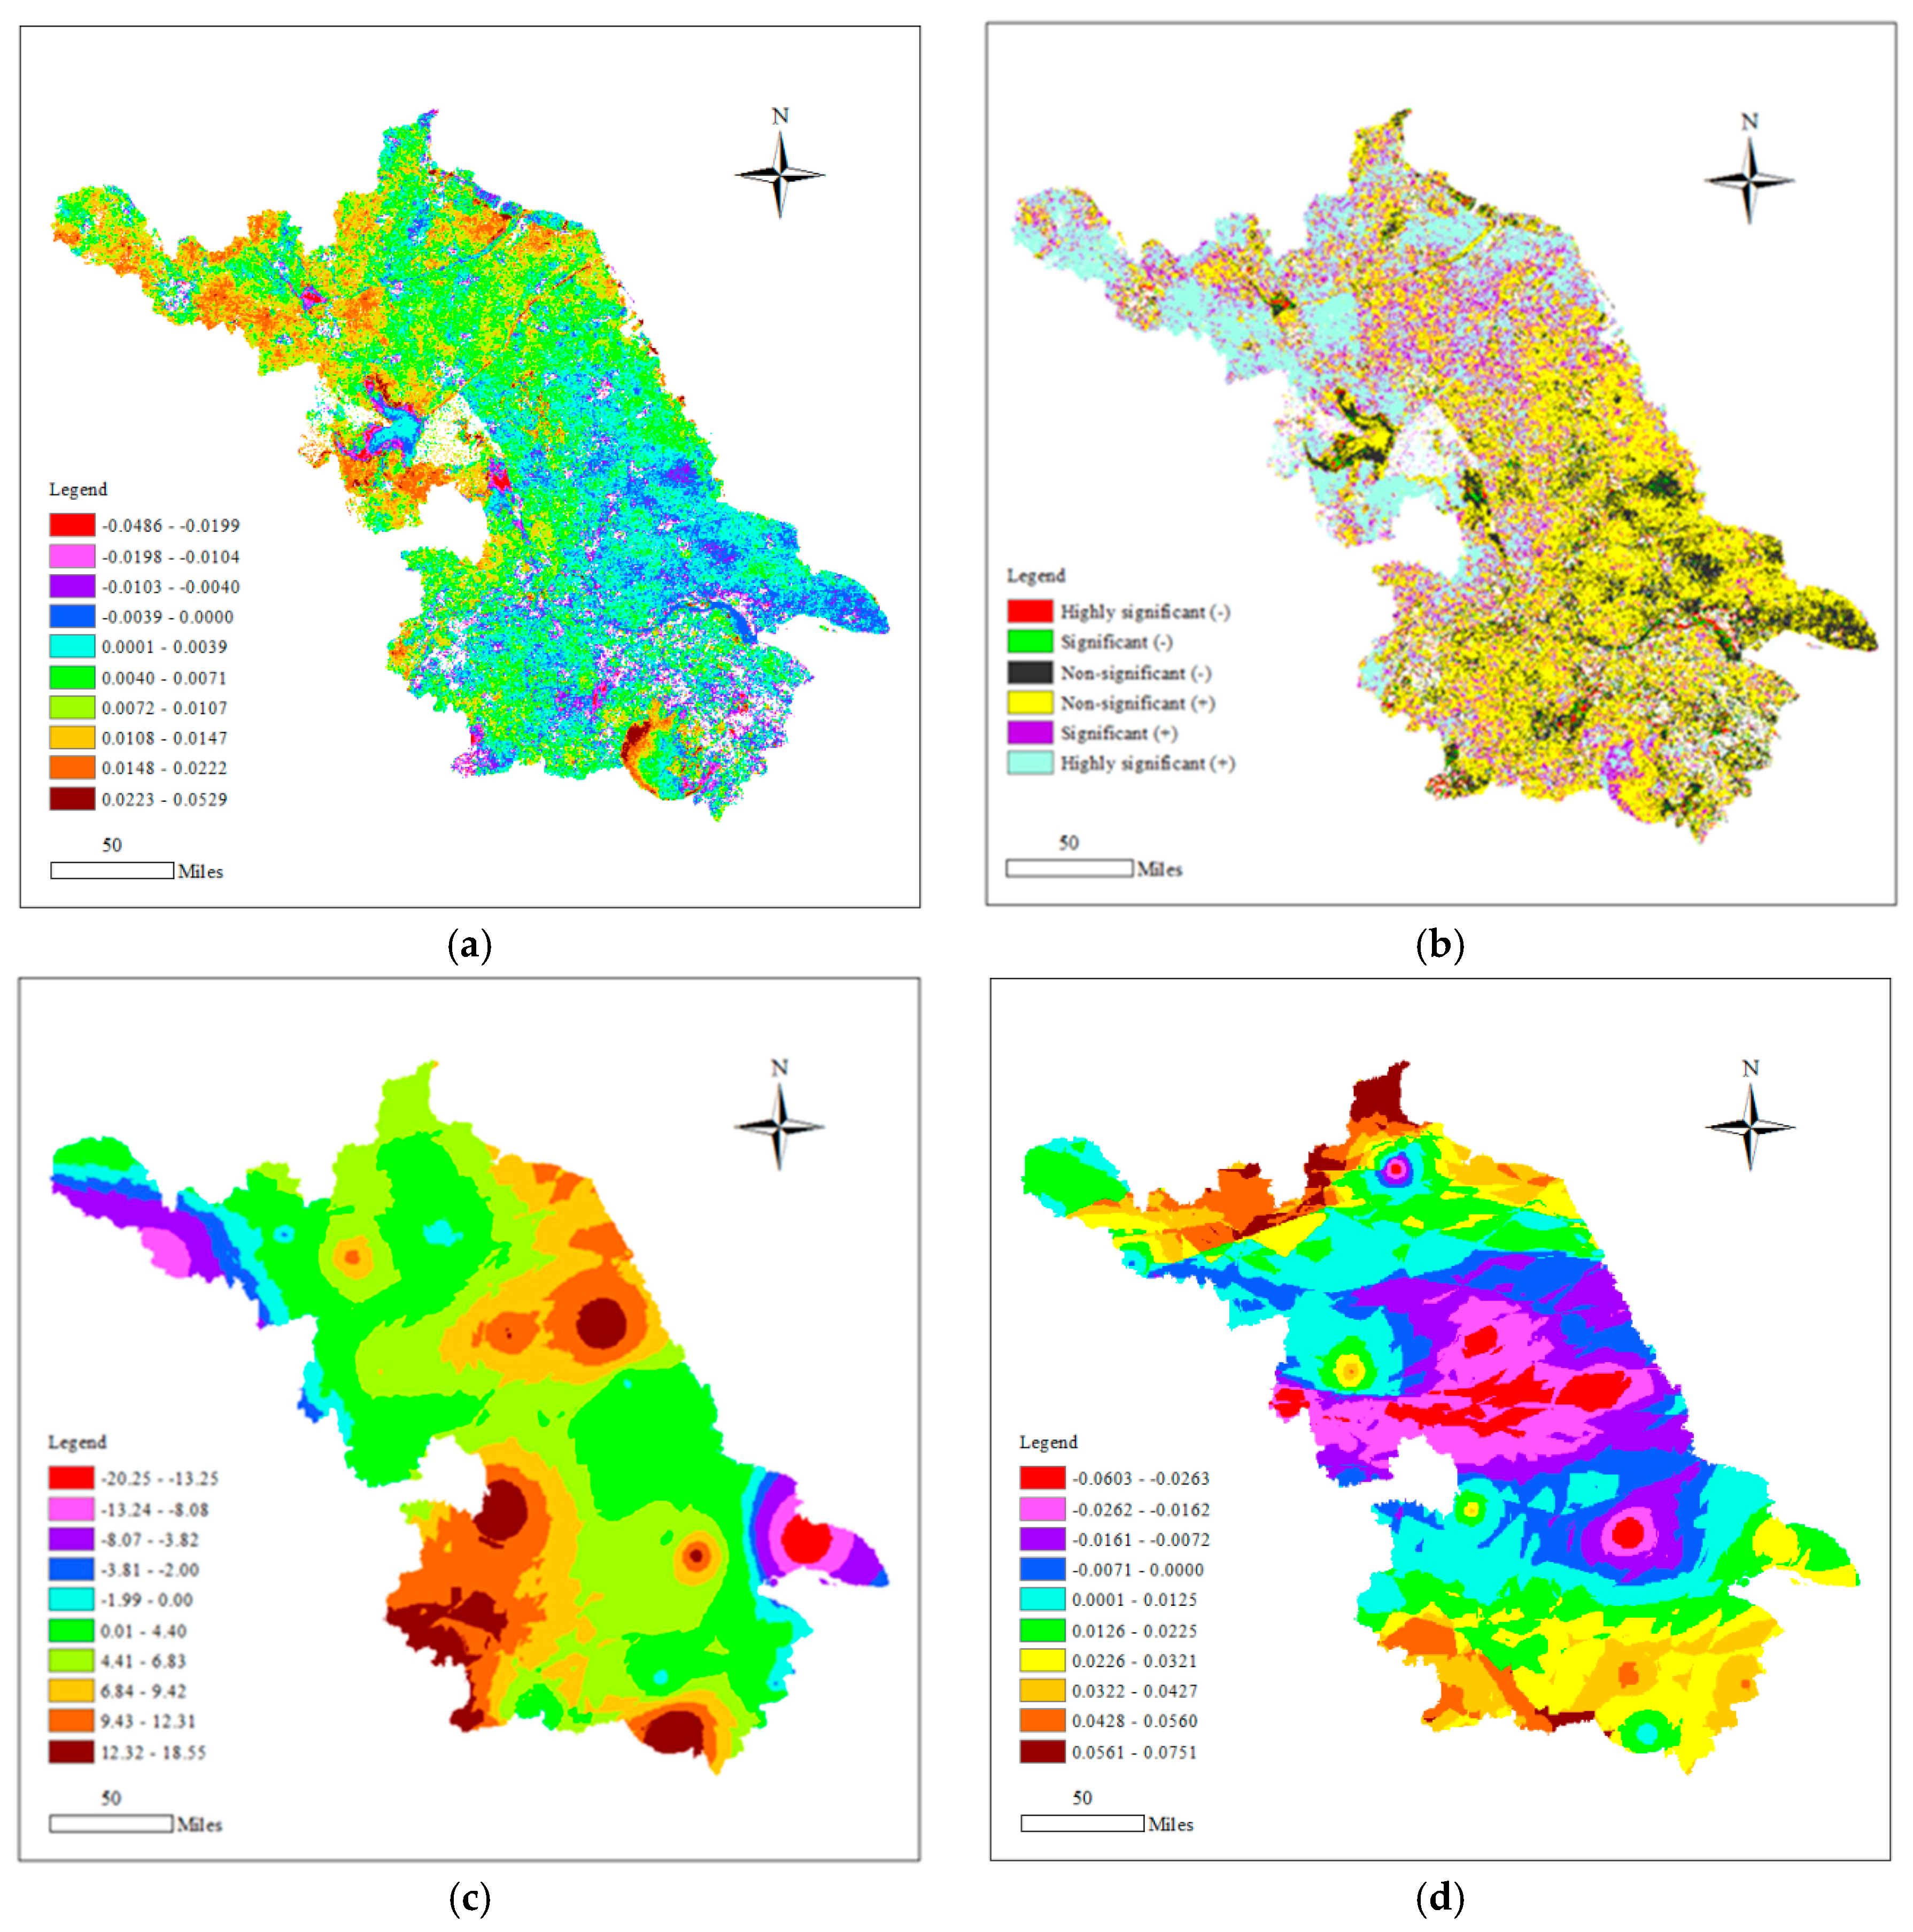
3.3. Spatiotemporal Land-Cover Changes and Climate Change

As shown in Figure 3a,b, from 2000 to 2015, mean annual NDVI changing trends varied between −0.0486 and 0.0529 among grids, and the mean value for all changes increased by 0.005 annually with a standard deviation of 0.0068. The area of the map with a decreasing trend accounted for only 17.57% of the whole vegetated area, with more area being distributed in the middle and south of Jiangsu Province. The highly significant decreasing and significant decreasing areas accounted for only 1.31% and 1.41% of the entire map, respectively. For the areas exhibiting increasing trends, highly significant, significant, and nonsignificant increases accounted for 26.05%, 15.15%, and 41.23% of the entire vegetated area. Highly significant increasing areas were mainly distributed in the north and northwest of Jiangsu Province, with significant and nonsignificant increasing areas being scattered across the entirety of Jiangsu. For the mean annual changing trend of precipitation and temperature (Figure 3c,d), none of the changing trends passed the significance test. Annual mean precipitation and temperature increased 4.76 mm and 0.009 °C per year, with standard deviations of 5.1 mm and 0.022 °C, respectively. Precipitation presented an increasingly dominant trend, the areas with increasing trends accounted for 87.65% of the entirety of Jiangsu Province, and the small amount of area with decreasing trends was located in only the northwest and southeast corners. For temperature, the area with decreasing trends accounted for 37.23% of the whole area, much larger than that of precipitation, and presented a wider distribution in the middle of Jiangsu.
Figure 4 presents the overall annual changes in NDVI, precipitation, and temperature for different vegetation types. The figure illustrates that the annual NDVI of dry croplands, paddy fields, forests, and grasslands all presented significantly increasing trends from 2000 to 2015, and all had P-values that passed the 0.05 significance test. Dry croplands, forests, and grasslands all passed the 0.01 significance test. The NDVI for different vegetation types presented similar changing trends, with the lowest annual mean NDVI values all appearing in 2005, and fluctuating increases from 2005 to 2015. For precipitation, it presented increasing for all vegetation types but nonsignificant changing trends, with all of their P-values being much larger than 0.05. The values fluctuated substantially among the different years and exhibited similar changing trends for all vegetation types, with the highest values appearing in 2003, while 2004 and 2013 were both troughs. For temperature, the fluctuations were even greater than those for precipitation. The general changing trend for dry cropland vegetation and paddy field vegetation presented a weak decreasing trend, while forests and grasslands exhibited a weak increasing trend, and the fluctuation trend among the different years were also similar for the four vegetation types.

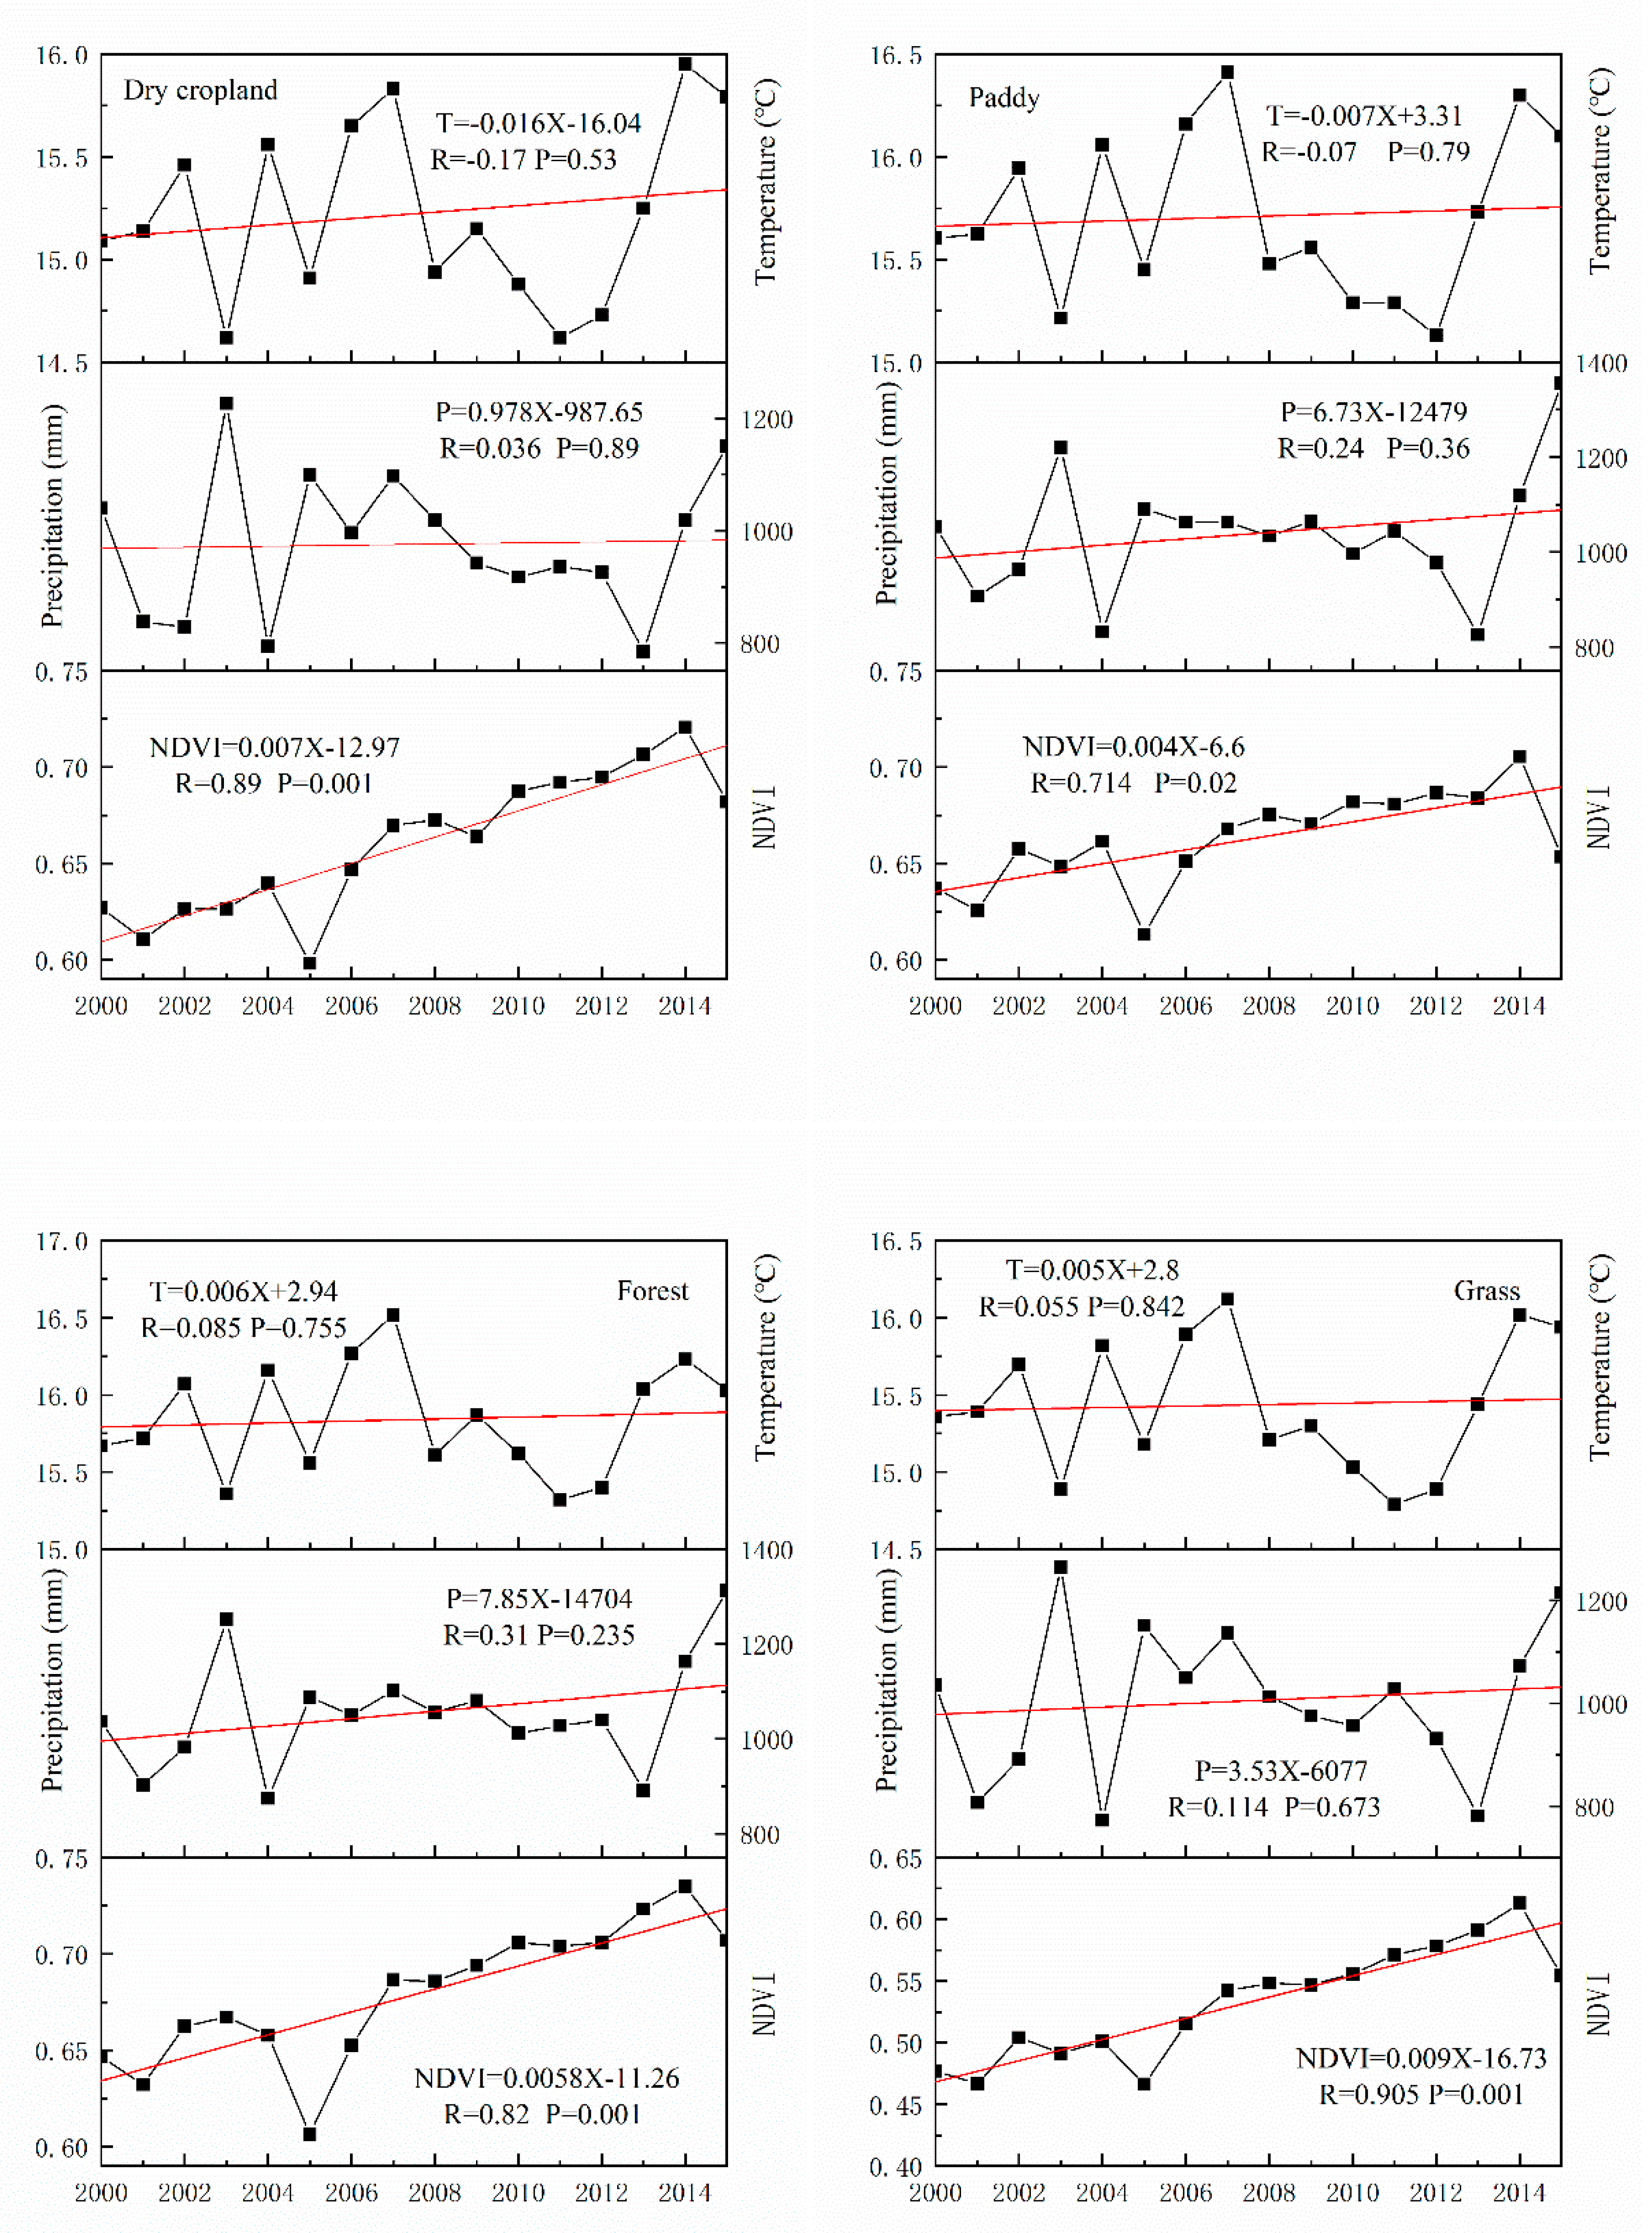
3.4. Correlation Between Climate Change and NDVI

Statistically, both precipitation and temperature showed predominantly positive correlations (R) with NDVI for the whole area without land-use type changes (Figure 5a,c). The positively correlated areas accounted for 54.31% and 72.26% of the whole area and mean correlation coefficient values (R) of 0.028 and 0.147 for precipitation and temperature, respectively. All the negatively correlated areas presented mean R values of −0.22 and −0.17 for precipitation and temperature, respectively, while all positively correlated areas presented mean R values of 0.24 and 0.27, respectively. The P-value tests indicated only a small percentage of the areas passed the P > 0.05 significance test for both negative and positive correlations of both precipitation and temperature (Figure 5b,d). The negative and positive nonsignificant areas accounted for 44.36% and 51.35% of the whole area for correlations between precipitation and NDVI, and those percentages were 27.63% and 69.18% for correlations between temperature and NDVI. Spatial analyses show that the negative correlations between precipitation and NDVI were mainly distributed in the central and northwestern parts of Jiangsu, while the positive correlations were distributed in the south and north. The areas of negative correlation between temperature and NDVI significantly decreased compared to precipitation, which were still mainly present in central Jiangsu and presented a dispersed distribution among the positive correlations of NDVI in south Jiangsu. The positive correlation showed a wide distribution across Jiangsu, especially in the north, where there was a denser distribution.
Table 5 shows the overall correlations coefficients for different vegetation types, which indicates that temperature is more strongly correlated to NDVI than precipitation for most vegetation types, although the values are not all high. The percentage of the area with positive correlations accounted for approximately 70% of all paddies and grasslands, and approximately 80% of dry croplands and forests. For precipitation, the percentages of the positive areas all substantially decreased except for forests. Paddy fields presented similar percentage values for both the positive and negative correlations, which leads to a weak correlation coefficient of –0.005 between NDVI and precipitation.

4. Discussion

During rapid economic development and urbanization, LUCC in China is rather substantial and accelerates with variable rates, especially for built-up land in coastal regions [41,42,43]. The LUCC can greatly reflect natural environmental changes, human lives, and social development [54]. Driving force analysis may help to predict land-use changes in the future and help to assign land-use control to aspects that control the driving factors. This analysis also clearly shows how land-cover responds to climate change under global warming.
Jiangsu Province benefits from China’s highest level of economy but bears China’s most substantial land-use changes and faces high pressures due to conflicts between economic-social development and the ecological environment. Thus, LUCC and driving forces analysis in this type of area is very necessary and meaningful. As compared with previous studies, our study is the first to comprehensively analyze both land-use type changes and land-cover changes in Jiangsu. With the support of a strong dataset to perform a detailed analysis, the land-use change analysis not only presented the spatial distribution but also included yearly statistical data to enable us to build correlations and regression analyses with driving forces. Furthermore, more land-use types were chosen during the relationship analysis in this study as compared with previous studies [44]. For land-cover changes, we excluded land area with land-use type changes, as these can reduce errors when examining the effect of climate change on NDVI. Moreover, NDVI and climate change analysis has only recently been carried out for all of the Jiangsu vegetation without the consideration of different vegetation types and has generally only been analyzed in temporal series, with no spatial distribution analysis [46]. Our study not only analyzed different vegetation types but also performed change analyses and correlation analyses in spatial. Therefore, our study made many improvements and presents a more accurate analysis result to guide land-use management.
Built-up land expansion is the main form of land-use change in Jiangsu Province and is very common in China [38] since the country is undergoing rapid urbanization. However, land-use change in China is quite different from that in some developed countries, such as in Europe [55,56], USA [57], and Australia [58], which have already completed the urbanization process. Because Jiangsu is located in a region with high population and economic levels, land-use transformation was more obvious in Jiangsu than in undeveloped regions of China, such as the northwest inland region [41]. Built-up land occupying cropland is the main land-use type change characteristic of Jiangsu, which has been caused mainly by social-economic development and is consistent with previous studies about land-use change in Jiangsu [44,47]. From 1995 to 2010, the population increased to 803 × 104, and the urbanization rate in Jiangsu increased from 27.3% to 60.6%. In order to accommodate more people living in urban areas and under the influence of high economic levels promoted by the real estate market [54], urban areas rapidly expanded during this period. Although the population in rural areas greatly decreased, the consolidation of idle rural residential land may take a long time [42]. Since cropland accounted for more than 80% of the Jiangsu area with a wide distribution across Jiangsu, the expansion of built-up lands will surely occupy a large area of cropland. The spatial distribution of land transfer in Figure 2 demonstrates our conclusion that social-economic development is the main driver of land-use type changes. Economic levels in Jiangsu presented a characteristic increase from north to south, and according to our analysis, land-use changes presented the same regular patterns, in other words, land transfers were denser in the south.
Previous studies have shown that land-use policy may significantly affect certain land-use changes [43,59], which was also reflected in our study. For example, land-use changes were denser in coastal regions, which may be affected by the coastal development policy in China, and land use may be under higher pressure to change in the future since Jiangsu Province enacted a new coastal development plan in 2009 [42]. According to our land-use data, some land area presented irregular changes and did not show obvious responses to social-economic driving forces. For example, water area is the only ecological land-use type to present an increasing trend, which was most obvious from 2000 to 2005 due to the development of aquaculture, as many land areas have been converted to fish ponds [60]. Although grassland presented a decreasing trend, the 2020 targeted coastal land-use plan made by the Jiangsu government plans to plant 333 km2 of grass areas in coastal Jiangsu [42]. Jiangsu’s total area is increasing as a result of natural sedimentation and also due to the impact of the tideland reclamation policy which has had an important effect on accelerating the increase in total land area [3,60]. Therefore, the effects from land-use policy greatly affect land-use type change.
Land-cover change analysis showed NDVI for the whole Jiangsu area experienced an increasing dominant change, which is consistent with the only study about NDVI in Jiangsu that showed that even cites has a similar increasing rate of 0.005 per year [46]. Correlation analysis shows that the response of NDVI to the variation in temperature was more pronounced overall than that in precipitation, and the same conclusion can be found from a previous study on eastern China, including Jiangsu Province [33]. A proportion of 45.69% of the NDVI negatively correlated with precipitation because Jiangsu has high precipitation rates. Moderate precipitation is essential to promote vegetation growth, but excessive precipitation can cause other determinant changes that can greatly affect vegetation growth. For example, excessive water input builds an anaerobic environment within the root zone [61,62], which decreases soil nutrients [63] and prevent vegetation growth. Rainfall can increase cloud cover and thus lead to less solar radiation, which is essential for vegetation growth [29,64]. The temperature conditions also need to be moderate, as high temperature accelerates evapotranspiration which causes water deficiency, and hence decreases ecosystem productivity [65,66]. For NDVI, the negative correlation coefficients of temperature are higher than that of precipitation, which indicates that, overall, temperature, as compared with precipitation, is a more essential factor for vegetation growth in Jiangsu.
North Jiangsu presented a substantial NDVI values increase, which can be explained by the lower precipitation and temperature conditions in the north as compared with other regions; increased precipitation and temperature in the north can promote vegetation growth, which is more substantial for precipitation (Figure 5a,b). In central Jiangsu, precipitation increased while temperature decreased, which caused NDVI values to show a weak change, including both increasing and decreasing trends. In the south, precipitation and temperature generally both increased, and positive correlations between precipitation and NDVI, and also between temperature and NDVI were both widespread. However, negative correlations showed an interacting distribution among the positive correlations. This finding occurred because, as compared with the northern and central areas, the southern area has higher precipitation and temperature level, and the hydrothermal condition may be excessive for some vegetated areas.
The analysis of different vegetation types shows that the requirement of temperature conditions for paddy fields may not be as important as it is for the other three vegetation types, and with respect to the precipitation over the paddy fields, irrigation may offset the effect of precipitation on vegetation growth to some extent. Increases in both precipitation and temperature increase forest NDVI values for most forest areas, which is determined partly by vegetation properties and partly because forests are mainly distributed in the north, which has relatively lower precipitation and temperature conditions.
Although many improvements were made in this study as compared with previous studies, some uncertainties and shortcomings are inevitable and exist in our study. For the NDVI data, the MODIS sensor was launched in December 1999, and to match the land-use images and exclude the transferred land areas, a time period from 2000 to 2015 may be too short, which may be a limitation that could influence the accuracy of our analysis. For spatial precision in our study, the precipitation and temperature maps interpolated based on 13 meteorological stations which may not be sufficient and may have led to errors. In addition, NDVI change and responses to climate change are complex processes, and precipitation and temperature can influence NDVI to produce a comprehensive assessment of vegetation growth [64]. In addition, there are many other climate variables that can affect NDVI, for example, humidity has been reported to have a much stronger negative effect on annual NDVI change than both precipitation and temperature in Jiangsu [46]. Therefore, to increase accuracy, more climate variables need to be included, and the interaction effect among different climate variables should be analyzed in future studies.

Author Contributions

J.W. and D.Z. designed the study and supervised the project; X.C. and X.G. outlined the manuscript and conducted the statistical analysis; X.C. wrote the main body of the manuscript; Y.Y. and Y.L. collected data and finished model running; M.Z. and J.L. revised the manuscript and the figures; all of the authors reviewed the manuscript.

Funding

This work was funded by the Youth Innovation Talent Humanities and Social Science Project of the Guangdong Provincial Education Department (No. 2016WQNCX040), the National Natural Science Foundation of China (41801201) and the Qing Lan Project of Jiangsu Province (2017).

Conflicts of Interest

The authors declare no conflict of interest.

References

  1. Mooney, H.A.; Duraiappah, A.; Larigauderie, A. Evolution of natural and social science interactions in global change research programs. Proc. Natl. Acad. Sci. USA 2013, 110 (Suppl. 1), 3665–3672. [Google Scholar] [CrossRef] [PubMed] [Green Version]
  2. Chou, J.M.; Dong, W.J.; Wang, S.Y.; Fu, Y.Q. Quantitative analysis of agricultural land use change in China. Phys. Chem. Earth. 2015, 87–88, 3–9. [Google Scholar] [CrossRef]
  3. Chuai, X.W.; Huang, X.J.; Wang, W.J.; Wu, C.Y.; Zhao, R.Q. Spatial simulation of land use based on terrestrial ecosystem carbon storage in coastal Jiangsu, China. Sci. Rep. 2014, 4, 5667. [Google Scholar] [CrossRef]
  4. Zhang, M.; Huang, X.J.; Chuai, X.W.; Yang, H.; Lai, L.; Tan, J.Z. Impact of land use type conversion on carbon storage in terrestrial ecosystems of China: A spatial-temporal perspective. Sci. Rep. 2015, 5, 10233. [Google Scholar] [CrossRef] [Green Version]
  5. Liu, Y.Y.; Zhang, X.N.; Xia, D.Z.; You, J.S.; Rong, Y.S.; Bakir, M. Impacts of land-use and climate changes on hydrologic processes in the Qingyi River watershed, China. J. Hydrol. Eng. 2013, 18, 1495–1512. [Google Scholar] [CrossRef]
  6. Wang, W.J.; Guo, H.C.; Chuai, X.W.; Dai, C.; Lai, L.; Zhang, M. The impact of land use change on the temporospatial variations of ecosystems services value in China and an optimized land use solution. Environ. Sci. Policy. 2014, 44, 62–72. [Google Scholar] [CrossRef]
  7. Chuai, X.W.; Huang, X.J.; Wang, W.J.; Bao, G. NDVI, temperature and precipitation changes and their relationships with different vegetation types during 1998–2007 in Inner Mongolia, China. Int. J. Climatol. 2013, 33, 1696–1706. [Google Scholar] [CrossRef]
  8. Drummond, M.A.; Auch, R.F.; Karstensen, K.A.; Sayler, K.L.; Taylor, J.L.; Loveland, T.R. Land change variability and human–environment dynamics in the United States Great Plains. Land Use Policy 2012, 29, 710–723. [Google Scholar] [CrossRef]
  9. Kindu, M.; Schneider, T.; Teketay, D.; Knoke, T. Drivers of land use/land cover changes in Munessa-Shashemene landscape of the south-central highlands of Ethiopia. Environ. Monit. Assess. 2015, 187, 452. [Google Scholar] [CrossRef]
  10. Long, H.L.; Tang, G.P.; Li, X.B.; Heilig, G.K. Socio-economic driving forces of land-use change in Kunshan, the Yangtze River Delta economic area of China. J. Environ. Manag. 2007, 83, 351–364. [Google Scholar] [CrossRef]
  11. Schneeberger, N.; Bürgi, M.; Hersperger, A.M.; Ewald, K.C. Driving forces and rates of landscape change as a promising combination for landscape change research—An application on the northern fringe of the Swiss Alps. Land Use Policy 2007, 24, 349–361. [Google Scholar] [CrossRef]
  12. He, F.N.; Li, M.J.; Li, S.C.; Xiao, R. Comparison of changes in land use and land cover in China and the USA over the past 300 years. J. Geogr. Sci. 2015, 25, 1045–1057. [Google Scholar] [CrossRef] [Green Version]
  13. Song, W.; Chen, B.M.; Zhang, Y. Land-use change and socio-economic driving forces of rural settlement in China from 1996 to 2005. Chin. Geogr. Sci. 2014, 24, 511–524. [Google Scholar] [CrossRef]
  14. Zhao, R.F.; Chen, Y.N.; Shi, P.J.; Zhang, L.H.; Pan, J.H.; Zhao, H.L. Land use and land cover change and driving mechanism in the arid inland river basin: A case study of Tarim River, Xinjiang, China. Environ. Earth. Sci. 2013, 68, 591–604. [Google Scholar] [CrossRef]
  15. Dewan, A.M.; Yamaguchi, Y.; Rahman, M.Z. Dynamics of land use/cover changes and the analysis of landscape fragmentation in Dhaka Metropolitan, Bangladesh. GeoJournal. 2012, 77, 315–330. [Google Scholar] [CrossRef]
  16. Kicklighter, D.W.; Cai, Y.; Zhuang, Q.; Parfenova, E.I.; Paltsev, S.; Sokolov, A.P.; Melillo, J.M.; Reilly, J.M.; Tchebakova, N.M.; Lu, X. Potential influence of climate induced vegetation shifts on future land use and associated land carbon fluxes in northern Eurasia. Environ. Res. Lett. 2014, 9, 035004. [Google Scholar] [CrossRef]
  17. Román-Cuesta, R.M.; Carmona-Moreno, C.; Lizcano, G.; New, M.; Silman, M.; Knoke, T.; Malhi, Y.; Oliveras, I.; Asbjornsen, H.; Vuille, M. Synchronous fire activity in the tropical high Andes: An indication of regional climate forcing. Glob. Chang. Biol. 2014, 20, 1929–1942. [Google Scholar] [CrossRef]
  18. Jiang, Y.; Liu, J.; Cui, Q.; An, X.H.; Wu, C.X. Land use/land cover change and driving force analysis in Xishuangbanna Region in 1986–2008. Front. Earth Sci. 2011, 5, 288–293. [Google Scholar] [CrossRef]
  19. Kelarestaghi, A.; Jeloudar, Z.J. Land use/cover change and driving force analyses in parts of northern Iran using RS and GIS techniques. Arab. J. Geosci. 2011, 4, 401–411. [Google Scholar] [CrossRef]
  20. Fensholt, R.; Rasmussen, K.; Nielsen, T.T.; Mbow, C. Evaluation of earth observation based long term vegetation trends-Intercomparing NDVI time series trend analysis consistency of Sahel from AVHRR GIMMS, Terra MODIS and SPOT VGT data. Remote. Sens. Environ. 2009, 113, 1886–1898. [Google Scholar] [CrossRef]
  21. Cong, N.; Piao, S.L.; Chen, A.P.; Wang, X.H.; Lin, X.; Chen, S.P.; Han, S.J.; Zhou, G.S.; Zhang, X.P. Spring vegetation green-up date in China inferred from SPOT NDVI data: A multiple model analysis. Agric. For. Meteorol. 2012, 165, 104–113. [Google Scholar] [CrossRef]
  22. Nemani, R.R.; Keeling, C.D.; Hashimoto, H.; Jolly, W.M.; Piper, S.C.; Tucker, C.J.; Myneni, R.B.; Running, S.W. Climate-driven increases in global terrestrial net primary production from 1982 to 1999. Science. 2003, 300, 1560–1563. [Google Scholar] [CrossRef]
  23. Meng, M.; Ni, J.; Zong, M.J. Impacts of changes in climate variability on regional vegetation in China: NDVI-based analysis from 1982 to 2000. Ecol. Res. 2011, 26, 421–428. [Google Scholar] [CrossRef]
  24. Piao, S.L.; Fang, J.Y.; Zhou, L.M.; Ciais, P.; Zhu, B. Variations in satellite-derived phenology in China’s temperate vegetation. Glob. Chang. Biol. 2006, 12, 672–685. [Google Scholar] [CrossRef]
  25. Hou, P.; Wang, Q.; Cao, G.Z.; Wang, C.; Zhan, Z.M.; Yang, B.F. Sensitivity analyses of different vegetations responding to climate change in inland river basin of China. J. Geogr. Sci. 2012, 22, 387–406. [Google Scholar] [CrossRef]
  26. Ni, J.; Harrison, S.P.; Prentice, I.C.; Kutzbach, J.E.; Sitch, S. Impact of climate variability on present and Holocene vegetation: A model-based study. Ecol. Model. 2006, 191, 469–486. [Google Scholar] [CrossRef]
  27. Schultz, P.A.; Halpert, M.S. Global analysis of the relationships among a vegetation index, precipitation, and land surface temperature. Int. J. Remote. Sens. 1995, 16, 2755–2777. [Google Scholar] [CrossRef]
  28. Shary, P.A.; Sharaya, L.S. Change in NDVI of forest ecosystems in Northern Caucasus as a function of topography and climate. Contemp. Probl. Ecol. 2014, 7, 855–863. [Google Scholar] [CrossRef]
  29. Piao, S.L.; Mohammat, A.; Fang, J.Y.; Cai, Q.; Feng, J.M. NDVI based increase in growth of temperate grasslands and its responses to climate changes in China. Glob. Chang. Biol. 2006, 16, 340–348. [Google Scholar] [CrossRef]
  30. Yuan, X.L.; Li, L.H.; Chen, X.; Shi, H. Effects of Precipitation Intensity and Temperature on NDVI-Based Grass Change over Northern China during the Period from 1982 to 2011. Remote. Sens. 2015, 7, 10164–10183. [Google Scholar] [CrossRef] [Green Version]
  31. Li, Z.G.; Tang, H.J.; Yang, P.; Wu, W.B.; Chen, Z.X.; Zhou, Q.B.; Zhang, L.; Zou, J.Q. Spatiotemporal responses of cropland phenophases to climate change in Northeast China. J. Geogr. Sci. 2012, 22, 29–45. [Google Scholar] [CrossRef]
  32. Antico, A. Independent component analysis of MODIS-NDVI data in a large South American wetland. Remote. Sens. Lett. 2011, 3, 383–392. [Google Scholar] [CrossRef]
  33. Cui, L.L.; Shi, J. Temporal and spatial response of vegetation NDVI to temperature and precipitation in eastern China. J. Geogr. Sci. 2010, 20, 163–176. [Google Scholar] [CrossRef]
  34. Revadekar, J.V.; Tiwari, Y.K.; Kumar, K.R. Impact of climate variability on NDVI over the Indian region during 1981–2010. Int. J. Remote. Sens. 2012, 33, 7132–7150. [Google Scholar] [CrossRef]
  35. Hall-Beyer, M. Patterns in the yearly trajectory of standard deviation of NDVI over 25 years for forest, grasslands and croplands across ecological gradients in Alberta, Canada. Int. J. Remote. Sens. 2012, 33, 2725–2746. [Google Scholar] [CrossRef]
  36. Wang, F.; Wang, X.; Zhao, Y.; Yang, Z.F. Correlation analysis of NDVI dynamics and hydro-meteorological variables in growth period for four land use types of a water scarce area. Earth. Sci. Inform. 2014, 7, 187–196. [Google Scholar] [CrossRef]
  37. Bao, G.; Qin, Z.H.; Bao, Y.H.; Zhou, Y.; Li, W.J.; Sanjjav, A. NDVI-Based Long-Term Vegetation Dynamics and Its Response to Climatic Change in the Mongolian Plateau. Remote. Sens. 2014, 6, 8337–8358. [Google Scholar] [CrossRef] [Green Version]
  38. Chuai, X.W.; Yuan, Y.; Zhang, X.Y.; Guo, X.M.; Zhang, X.L.; Xie, F.J.; Zhao, R.Q.; Li, J.B. Multiangle land use-linked carbon balance examination in Nanjing City, China. Land Use Policy 2019, 84, 305–315. [Google Scholar] [CrossRef]
  39. Deng, X.Z.; Huang, J.K.; Rozelle, S.; Uchida, E. Economic growth and the expansion of urban land in China. Urban Stud. 2010, 47, 813–843. [Google Scholar] [CrossRef]
  40. Wang, J.; Chen, Y.Q.; Shao, X.M.; Zhang, Y.Y.; Cao, Y.G. Land-use changes and policy dimension driving forces in China: Present, trend and future. Land Use Policy 2012, 29, 737–749. [Google Scholar] [CrossRef]
  41. Chuai, X.W.; Huang, X.J.; Lu, Q.L.; Zhang, M.; Zhao, R.Q.; Lu, J.Y. Spatiotemporal Changes of Built-Up Land Expansion and Carbon Emissions Caused by the Chinese Construction Industry. Environ. Sci. Technol. 2015, 49, 13021–13030. [Google Scholar] [CrossRef]
  42. Chuai, X.W.; Huang, X.J.; Wang, W.J.; Zhao, R.Q.; Zhang, M.; Wu, C.Y. Land use, total carbon emissions change and low carbon land management in Coastal Jiangsu, China. J. Clean. Prod. 2015, 103, 77–86. [Google Scholar] [CrossRef]
  43. Long, H.L. Land use policy in China: Introduction. Land Use Policy 2014, 40, 1–5. [Google Scholar] [CrossRef]
  44. Du, X.D.; Jin, X.B.; Yang, X.L.; Yang, X.H.; Zhou, Y.K. Spatial pattern of land use change and its driving force in Jiangsu Province. Int. J. Environ. Res. Public. Health. 2014, 11, 3215–3232. [Google Scholar] [CrossRef]
  45. Li, J.L.; Zhao, H.B.; Yang, X.P. Study on the seasonal dynamics of zonal vegetation of NDVI/EVI of costal zonal vegetation based on MODIS data: A case study of Spartina alterniflora salt marsh on Jiangsu Coast, China. Afr. J. Agric. Res. 2011, 6, 4019–4024. [Google Scholar]
  46. Cao, L.; Xie, F.; Wu, Y.C.; Wang, Z.; Zhang, N.N.; Zhao, Y.W. Spatiotemporal variation characteristics and impact factors of NDVI in Jiangsu Province. Bull. Soil. Water. Conserv. 2015, 35, 151–154. (In Chinese) [Google Scholar]
  47. Huang, C.C.; Zhang, M.L.; Zou, J.; Zhu, A.X.; Chen, X.; Mi, Y.; Wang, Y.H.; Yang, H.; Li, Y.M. Changes in land use, climate and the environment during a period of rapid economic development in Jiangsu Province, China. Sci. Total Environ. 2015, 536, 173–181. [Google Scholar] [CrossRef] [PubMed]
  48. Zhang, Z.X.; Wang, X.; Zhao, X.L.; Liu, B.; Yi, L.; Zuo, L.J.; Wen, Q.K.; Liu, F.; Xu, J.Y.; Hu, S.G. A 2010 update of National Land Use/Cover Database of China at 1:100,000 scale using medium spatial resolution satellite images. Remote. Sens. Environ. 2014, 149, 142–154. [Google Scholar] [CrossRef]
  49. Ning, J.; Liu, J.Y.; Kuang, W.H.; Xu, X.L.; Zhang, S.W.; Yan, C.Z.; Li, R.D.; Wu, S.X.; Hu, Y.F.; Du, G.M.; et al. Spatiotemporal patterns and characteristics of land-use change in China during 2010–2015. J. Geogr. Sci. 2018, 28, 547–562. [Google Scholar] [CrossRef]
  50. Jiangsu Fundamental Geographic Information Center. Atlas of Jiangsu Province; Chinese Map Press: Beijing, China, 2004. (In Chinese) [Google Scholar]
  51. Wang, G.G.; Liu, Y.S.; Li, Y.R.; Chen, Y.F. Dynamic trends and driving forces of land use intensification of cultivated land in China. J. Geogr. Sci. 2015, 25, 45–57. [Google Scholar] [CrossRef]
  52. Stow, D.; Daeschner, S.; Hope, A.; Douglas, D.; Petersen, A.; Myneni, R.; Zhou, L.; Oechel, W. Variability of the seasonally integrated normalized difference vegetation index across the north slope of Alaska in the 1990s. Int. J. Remote. Sens. 2003, 24, 1111–1117. [Google Scholar] [CrossRef]
  53. Liu, C.Y.; Dong, X.F.; Liu, Y.Y. Changes of NPP and their relationship to climate factors based on the transformation of different scales in Gansu, China. Catena. 2015, 125, 190–199. [Google Scholar] [CrossRef]
  54. Liu, J.Y.; Kuang, W.H.; Zhang, Z.X.; Xu, X.L.; Qin, Y.W.; Ning, J.; Zhou, W.C.; Zhang, S.W.; Li, R.D.; Yan, C.Z.; et al. Spatiotemporal characteristics, patterns, and causes of land-use changes in China since the late 1980s. J. Geogr. Sci. 2014, 24, 195–210. [Google Scholar] [CrossRef]
  55. Salvati, L.; Zambon, I.; Chelli, F.M.; Serra, P. Do spatial patterns of urbanization and land consumption reflect different socioeconomic contexts in Europe? Sci. Total. Environ. 2018, 625, 722–730. [Google Scholar] [CrossRef] [PubMed]
  56. Schulp, C.J.E.; Levers, C.; Kuemmerle, T.; Tieskens, K.F.; Verburg, P.H. Mapping and modelling past and future land use change in Europe’s cultural landscapes. Land Use Policy 2019, 80, 332–344. [Google Scholar] [CrossRef]
  57. Kuang, W.H.; Chi, W.F.; Lu, D.S.; Dou, Y.Y. A comparative analysis of megacity expansions in China and the US: Patterns, rates and driving forces. Landsc. Urban Plan. 2014, 132, 121–135. [Google Scholar] [CrossRef]
  58. Burgin, S.; Franklin, M.J.; Hull, L. Wetland loss in the transition to urbanisation: A case study from Western Sydney, Australia. Wetlands. 2016, 36, 985–994. [Google Scholar] [CrossRef]
  59. Zhan, J.Y.; Shi, N.N.; He, S.J.; Lin, Y.Z. Factors and mechanism driving the land-use conversion in Jiangxi Province. J. Geogr. Sci. 2010, 20, 525–539. [Google Scholar] [CrossRef]
  60. He, Q.H. Land Use/Cover Change and the Effect to Ecological Environment in Coastal Jiangsu, China; Nanjing Normal University: Nanjing, China, 2011. (In Chinese) [Google Scholar]
  61. Fu, G.; Li, S.W.; Sun, W.; Shen, Z.X. Relationships between vegetation carbon use efficiency and climatic factors on the Tibetan Plateau. Can. J. Remote. Sens. 2016, 42, 16–26. [Google Scholar] [CrossRef]
  62. Yang, Y.T.; Guan, H.D.; Shen, M.; Liang, W.; Jiang, L. Changes in autumn vegetation dormancy onset date and the climate controls across temperate ecosystems in China from 1982 to 2010. Glob. Chang. Biol. 2015, 21, 652–665. [Google Scholar] [CrossRef] [PubMed]
  63. Schuur, E.A.G.; Chadwick, O.A.; Matson, P.A. Carbon cycling and soil carbon storage in mesic to wet Hawaiian montane forests. Ecology 2001, 82, 3182–3196. [Google Scholar] [CrossRef]
  64. Zhang, Y.J.; Xu, M.; Chen, H.; Adams, J. Global pattern of NPP to GPP ratio derived from MODIS data: Effects of ecosystem type, geographical location and climate. Glob. Ecol. Biogeogr. 2009, 18, 280–290. [Google Scholar] [CrossRef]
  65. Chuai, X.W.; Qi, X.X.; Zhang, X.Y.; Li, J.S.; Yuan, Y.; Guo, X.M.; Huang, X.J.; Park, S.J.; Zhao, R.Q.; Xie, X.L.; et al. Land degradation monitoring using terrestrial ecosystem carbon sinks/sources and their response to climate change in China. Land Degrad. Dev. 2018, 29, 3489–3502. [Google Scholar] [CrossRef]
  66. Zhang, G.G.; Kang, Y.M.; Han, G.D.; Sakurai, K. Effect of climate change over the past half century on the distribution, extent and NPP of ecosystems of Inner Mongolia. Glob. Chang. Biol. 2011, 17, 377–389. [Google Scholar] [CrossRef]
Figure 1. Location of Jiangsu Province and vegetation coverages.
Sustainability 11 02370 g001
Figure 2. Spatial distribution of unchanged lands (a) and transformed lands (b) from 1995 to 2015. In Figure 2b, the numbers 1–7 represent paddy fields, dry croplands, woodlands, grasslands, water areas, built-up lands, and unused lands, respectively. Code “12” in Figure 2b represents the transfer of paddy field to dry cropland, et cetera.
Sustainability 11 02370 g002
Figure 3. Spatial patterns of mean annual NDVI changing trends from 2000 to 2015 for the unchanged land area (a), the NDVI changing trend significance tests (b), the mean annual precipitation changing trends (mm/yr) (c), and the temperature changing trends (°C/yr) (d) for the entirety of Jiangsu. Highly significant (+), significant (+), nonsignificant (+), nonsignificant (−), significant (−), and highly significant (−) areas are shown in (b), where the NDVI increasing trends are significant at the 99% and 95% confidence levels, the nonsignificant increasing and decreasing, and NDVI decreasing trends are significant at the 99% and 95% confidence levels, respectively.
Sustainability 11 02370 g003
Figure 4. Annual changes in NDVI, precipitation (mm), and temperature (°C) for the different vegetation types from 2000 to 2015.
Sustainability 11 02370 g004
Figure 5. Correlation coefficients and significance tests between NDVI and precipitation (a,b), and NDVI and temperature (c,d). Highly significant (+), significant (+), nonsignificant (+), nonsignificant (−), significant (−) and highly significant (−) areas are shown in (b) and (d), where the positive correlations between NDVI and precipitation and temperature are significant at the 99% and 95% confidence levels, and the nonsignificant positive and negative correlations, and the negative correlations are significant at the 99% and 95% confidence levels, respectively.
Sustainability 11 02370 g005
Table 1. Driving forces for land-use change analysis.
Land-Use TypeSelected Driving Forces
Y 1 X 1 , X 2 , X 3 , X 5 , X 6 , X 7 , X 8
Y 2 X 1 , X 2 , X 3 , X 4 , X 7 , X 8
Y 3 X 1 , X 2 , X 3 , X 4 , X 9 , X 10
Table 2. Area and their changes for different land-use types of Jiangsu Province in different years (km2).
YearPaddy FieldDry CroplandWoodlandGrasslandWater AreaBuilt-up LandUnused Land
199544,785.91 25,708.64 3424.09 1759.32 13,773.02 13,933.61 20.55
200044,173.60 25,607.05 3382.84 1488.69 14,066.59 14,668.12 18.25
200543,120.08 25,440.51 3387.84 1402.09 14,374.38 15,663.21 17.03
201041,444.26 22,509.81 3127.08 935.33 15,823.37 20,052.03 227.95
201540,887.09 24,945.66 3336.05 1474.63 14,197.41 18,529.47 34.84
1995–2000−612.30 −101.59 −41.25 −270.64 293.57 734.51 −2.30
2000–2005−1053.53 −166.54 5.00 −86.60 307.79 995.09 −1.22
2005–2010−1675.82 −2930.70 −260.76 −466.77 1448.98 4388.82 210.91
2010–2015−557.17 2435.86 208.96 539.30 −1625.95 −1522.56 −93.10
Table 3. Land transformation matrix of Jiangsu Province from 1995 to 2015 (km2).
2015
Paddy FieldDry CroplandWoodlandGrasslandWater AreaBuilt-up LandUnused LandTotal
1995Paddy Field40,792.9316.63 12.70 13.15 591.58 3357.91 1.03 44,785.91
Dry Cropland8.15 24,651.845.11 5.89 101.37 934.46 1.82 25,708.63
Woodland1.02 1.46 3316.151.24 4.58 98.98 0.65 3424.09
Grassland3.20 186.44 0.00 1217.53239.08 113.07 0.00 1759.32
Water Area65.86 29.54 1.80 215.47 13,241.35203.42 15.58 13,773.02
Built-up Land14.60 59.75 0.22 21.34 16.57 13,821.070.07 13,933.61
Unused Land1.33 0.00 0.08 0.00 2.88 0.57 15.7120.55
Total40,887.0924,945.663336.051474.6314,197.4118,529.4734.84103,405.13
Table 4. Results of correlation analysis between land-use changes and driving forces.
X1X2X3X4X5X6X7X8X9X10
Y1−0.903 **−0.895 **−0.942 **−0.949 **0.938 **−0.955 **−0.941 **
Y20.984 **0.986 **0.917 **0.954 **0.967 **0.927 **
Y30.957 **0.974 **0.873 **0.884 **0.917 **0.934 **
All passed significance test at the ** P < 0.01 level.
Table 5. Mean correlation coefficients (R) between NDVI and climate change, and area percentages of the positive and negative correlation coefficients.
Vegetation TypeCorrelation Coefficients (R)Area Percentages of Correlation Coefficients
PrecipitationTemperaturePrecipitation
(+)
Precipitation
(−)
Temperature
(+)
Temperature
(−)
Dry cropland0.0710.1857.9142.0979.6720.33
Paddy field−0.0050.1351.1348.8768.7131.29
Forest0.20.1677.5622.4477.6022.40
Grass0.0240.1558.1141.8972.6327.37
“+” and “−” represent positive and negative correlations, respectively.

