Techno-Economic and Sensitivity Analysis of Rainwater Harvesting System as Alternative Water Source


1
Faculty of Integrated Technologies, Universiti Brunei Darussalam, Jalan Tungku Link, Gadong BE1410, Brunei Darussalam
2
School of Information, Systems and Modelling, Faculty of Engineering and Information Technology, University of Technology Sydney, Ultimo, NSW 2007, Australia
*
Author to whom correspondence should be addressed.
Sustainability 2019, 11(8), 2365; https://doi.org/10.3390/su11082365
Submission received: 19 March 2019
/
Revised: 14 April 2019
/
Accepted: 15 April 2019
/
Published: 20 April 2019
(This article belongs to the Section Sustainable Engineering and Science)
Abstract
:This paper formulates a rainwater harvesting model, with system and economic measures to determine the feasibility of a rainwater harvesting system, which uses water from the mains to complement the system. Although local meteorological and market data were used to demonstrate the model, it can also be easily adapted for analysis of other localities. Analysis has shown that an optimum tank size exists, which minimizes the cost per unit volume of water. Economic performance measures have indicated that rainwater harvesting system is currently infeasible to be implemented in Brunei; with capital cost and water price being shown to be among the prohibiting factors. To improve feasibility, a combination of rebate scheme on capital cost and raising the current water price has been proposed. It has also been shown that the system is more viable for households with high water demand.
1. Introduction
Rapid growth of the world population puts ever increasing demands on basic utilities, such as energy and water. Increase usages of scarce natural resources to support these demands are necessary and inevitable, however more can be done to improve utilization efficiencies as well as explore possible alternative sources. Indeed, the literatures are filled with efforts by researchers and engineers in developing methods of improving efficiencies and exploring different sources of energy and water [1,2] discussed different methods of improving energy efficiencies along different stages of energy usage; from production, generation, and consumptions, whilst [3,4] exploring different sources of energy production, such as nuclear, geothermal, different generations of biofuels, etc. Similar efforts have also been reported on methods of improving the efficiencies of water usage [5,6] as well as exploring different possible sources of water, such as through fog harvesting, rainwater, and wastewater recycling, etc. [7,8,9].
Researches regarding the improvement of the efficiencies and exploration of alternative sources for energy and water are especially relevant for Brunei, which is a small tropical country in the South East Asia region. It is recently reported that Brunei is one of the highest consumers of both energy and water in the region [10]. Whilst a lot of researches have been made on energy, specifically for Brunei [11], there are as yet limited studies addressing water issues in the country. Among areas that are related to water conservation, Rainwater Harvesting (RWH) may have the potential to be developed in Brunei, due to its abundance of rain all year round with average monthly rainfall of 248 mm, between 1984 and 2013 [12]. This far exceeds the 45 mm minimum average monthly rainfall that was reported in Australia [13], a country that has successfully implemented the RWH system. Furthermore, RWH has also been successfully implemented in some neighboring countries in the region, most notably in Malaysia [14]. The possible applications of RWH system are wide, covering both urban [7,9] and rural areas [5,8], as well as household [15], potable [13], agricultural [16], and wildfire combat [17] usages. In the context of Brunei, urban RWH system for household application (i.e., toilet, laundry and garden usage) is relevant. This is because coverage of mains water distribution system is already extensive, reaching most of the population who mostly live in urban areas and use the most water. It is not extended for potable usage due to the cost that is associated with providing potable water as well as the acceptability of using alternative water source for potable usage, at this initial stage. To make it more palatable for the people to implement the RWH system, water from the mains water distribution system shall complement water from the RWH system, to ensure that there will be no period whereby demand from the household cannot be met.
The main variable in RWH system is rainfall, with analysis of the RWH system typically relying on the water balance model [15,18], which utilizes historical daily rainfall data as predictor of future rainfall. Although, there have also been attempts to analyze the performance of the RWH system based on limited rainfall data [19], with some degrees of success. [18] has shown that there is a strong correlation between water savings from RWH system and average annual rainfall at a given location; an encouraging result for Brunei, which experiences high levels of rainfall. The authors in [20] have analyzed the RWH system in blocks of apartment and have concluded that a large tank size is necessary in order to maximize water savings and increase reliability. Similar improvement in reliability with increasing tank size has also been reported in [21]. On the other hand, [22] has demonstrated the importance of dimensioning tank size based on demand and collected rainwater; with economic benefits being derived by reducing the tank size for low demanding application or where there is an consistent amount of rainfall, without a considerable drop in reliability. As such, importance should be taken in finding the optimum tank size of RWH system for a given location.
Other than quantification of system performance of the RWH system, some researchers have also analyzed its financial performance to help determine its feasibility. [7,23] have developed mathematical model with variable tank sizes and they have restructured the model as an optimization problem to in order to minimize the net present value of the system [7] and cost per unit volume of water [23]. In [18,24], the benefit ratio has been used to determine feasibility, with benefit ratios of less than 1 calculated for both Korea and Australia, indicating the infeasibility of the system, except with government intervention. Net present value has also been used to determine feasibility [13], concluding with the need of government intervention to promote RWH system.
In this paper, the RWH model has been formulated with local historical rainfall data used to simulate the system, in order to obtain its system performance measures. The system is complemented by water from the main water pipe, and hence unique from other previous works [15,18,19,20]. Local costings were used to obtain financial measures to ascertain feasibility. Sensitivity analysis on selected data parameters were also performed to determine the effect of varying certain parameters on the system, as well as to propose possible strategies of promoting the RWH system. Although local data were used, methodologies, model, and performance measures that have been developed may be easily adapted to conduct feasibility studies in other countries.
2. Methodology
2.1. Rainwater Harvesting (RWH) Model
The RWH system is composed of a rain water collection subsystem as well as the storage and supply subsystem. The collection subsystem, which usually normally includes roof, guttering, and piping, is responsible for maximising rainwater collection, whilst the storage and supply subsystem stores collected rainwater and provides supplies as per demand from the household. The storage and supply subsystem includes water tank and, if necessary, water pump as well as water cleaning and filtration devices, such as first flush system, leaf-eaters, etc. Common uses for the RWH system are for toilet, laundry [25], and gardening use [18], although some RWH systems may also supply clean potable water for human consumption [13]. Depending on the availability of mains water supply, water demand from the household may solely rely on the RWH system [13]. However, the common configuration of RWH system is a RWH system that is complemented by mains water supply [18].
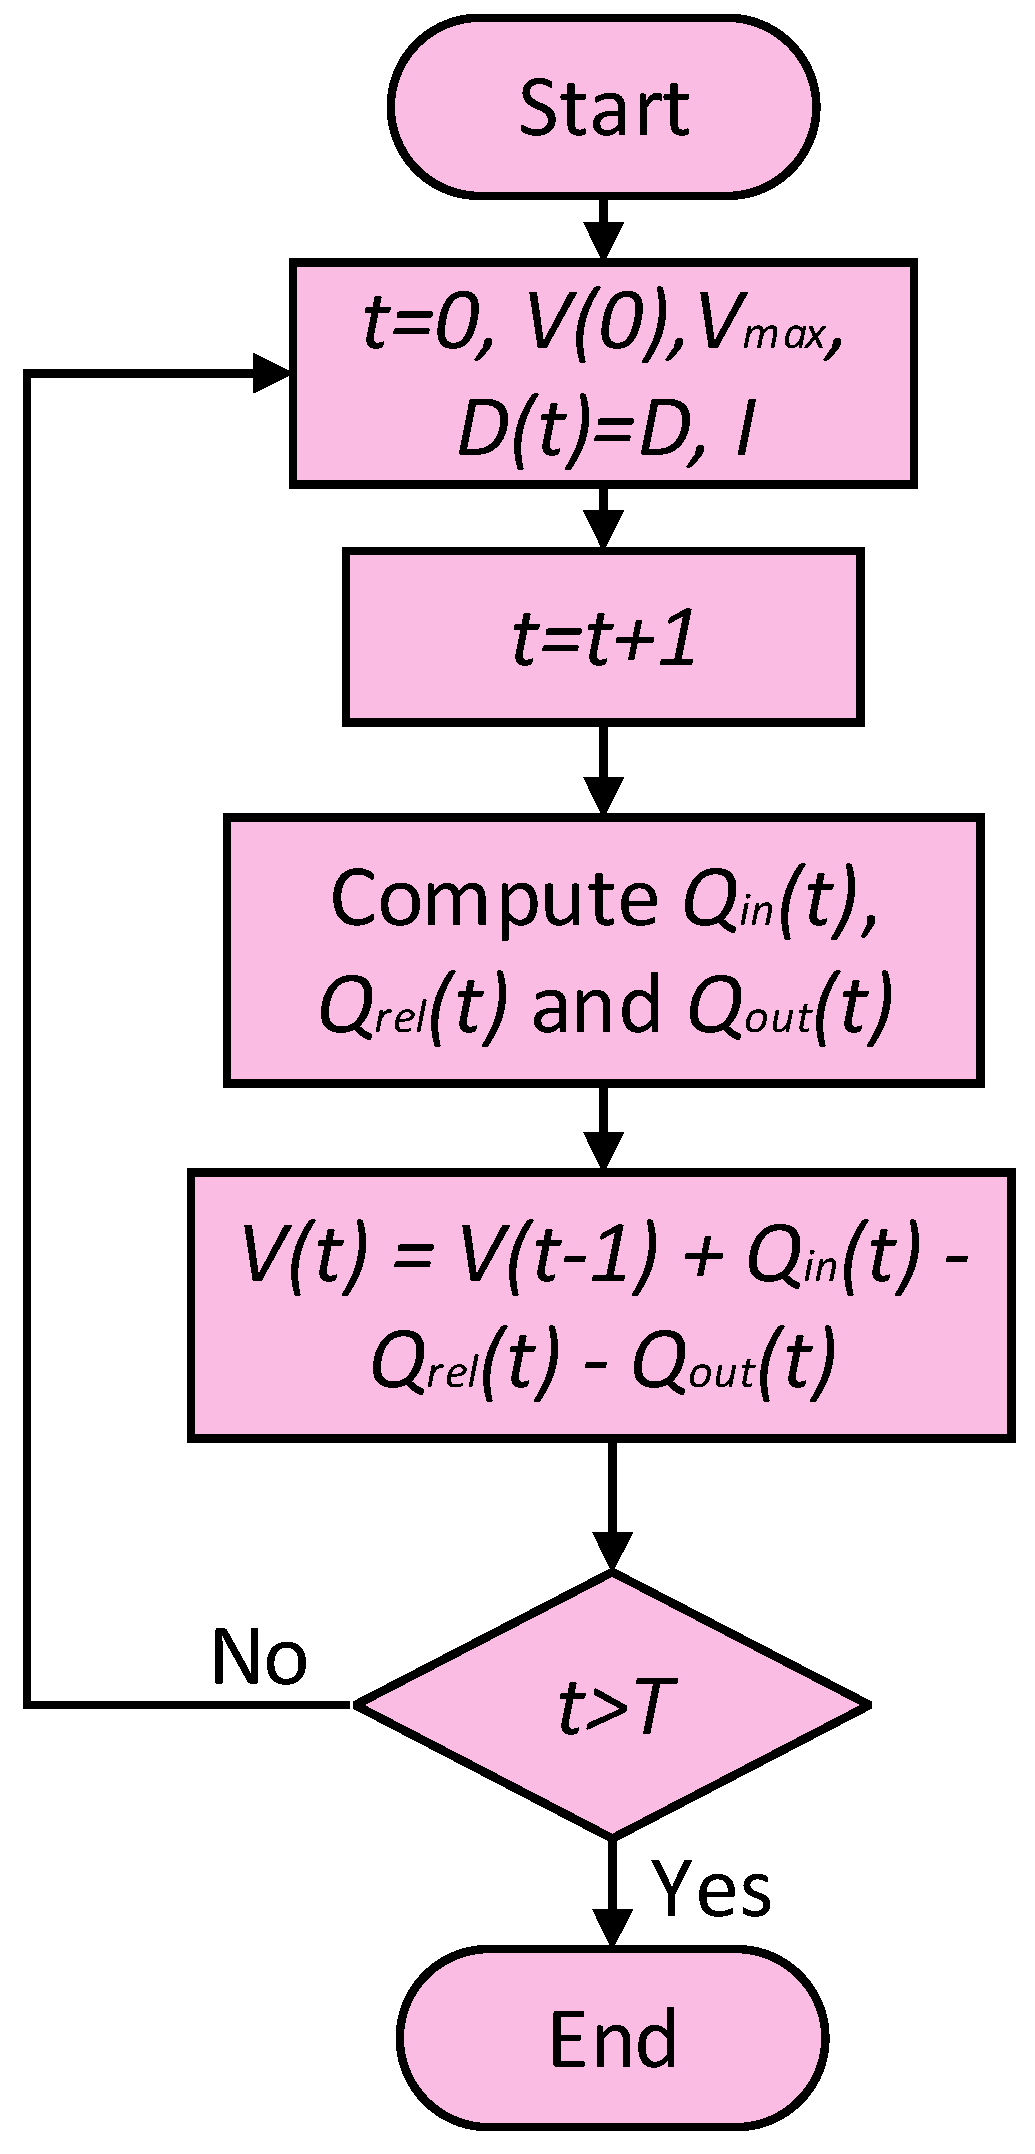
The volume of rainwater in the water tank of the system at time t is dependent on the volume of rainwater in the tank at the end of previous time period i.e., , the volume of rainwater entering the tank from the collection subsystem at time t i.e., , the volume of rainwater released by the system to meet its demand at time t i.e., , and the volume of rainwater overflowing from the RWH system at time t i.e., . Mathematically, is:
Via recursive substitutions and taking as the initial volume of rainwater in the water tank at time , Equation (1) above may be conveniently expressed as:
The amount of rain water collected is dependent on the catchment area and coefficient of the roof , which is dependent on its material and local rainfall at time t. Given that rainfall data at time t is given by I(t), the volume of water entering the system is:
where factor of 0.001 is used to convert I(t) from mm to m.
Rainwater from the storage system may be released to meet household demand for its intended purpose or, if the water tank is full, it may overflow. Of course, the volume of water released, , to supply the household is dependent on whether sufficient water exists in the tank to meet its demand in the first place. and are given by:
where functions min(a,b) and max(a,b) give the minimum and maximum values, respectively, of either a or b. is the demand of the household at time t and Vmax is the maximum capacity of the water tank. It may be seen from the above models that the ability of the system to meet its demand is dependent on the amount of rainwater that is already harvested in the tank, , which is dependent on tank size, the amount of overflowing rainwater from the system, and the amount of rainwater collected . Amount of rainwater that is collected is, in turn, dependent on the amount of rainfall.
The above RWH model is generic, in the sense the model can be used to adapt to the timescale of the rainfall data, whether it is daily, hourly, etc. In this paper, daily timescale was used for analysis, using daily rainfall data and demand data. Figure 1 gives the flowchart of the RWH model used, with output from the model used as the input in the calculations of different performance measures of the RWH system.
2.2. Performance Measures of Rainwater Harvesting System
The RWH system is measured according to two different, albeit related perspectives: its system performance and its economic feasibility. Where applicable, these measures are jointly considered. Additionally, sensitive analysis on certain important parameters is performed to identify the effect of these parameters on the feasibility of the system.
2.2.1. System Performance Measures
For a household that solely relies on the RWH system as its source of water supply [13], reliability is a critical measure that needs to be taken into consideration. Reliability of System (RoS) is measured as the percentage of the number of days that the system is able to fully meet water household demand from the total number of days, T, under consideration. As such, gives the expected number of days per year that the household would not receive enough water supply to fully-satisfy its demand. Obviously, a higher RoS value corresponds to a more reliable RWH system. Defining threshold function f as:
Reliability of the system is given by:
However, reliability is a less critical measure for the RWH system under consideration, as the mains water supply is used to supplement water from the RWH system. This may be accomplished by using simple float valve system to control water, as is necessary from the mains water supply. For the system under consideration, a more suitable measure is in terms of water saving potential. Average annual water saving (WS) is simply the average annual volume of water supplied by the RWH system. To relate it with the demand of the household, the percentage water savings (PWS) may be used; being defined as annual water saving in proportion to annual water demand of the household. These are given by:
Ideally, water that was collected from the RWH system matches perfectly, in terms of timing and quantity, with water demand from the household, such that all water collected may be immediately used. This would eliminate the needs of a water tank. However, normal RWH system operations necessitate rainwater from the collection area to be collected in a tank, to be stored for future use. In this regard, rainwater use efficiency (RUE) may be used to measure the utilisation efficiency of rainwater. Defined as the percentage of total water supplied by the system to satisfy household demand to the total rainwater input to the system, a high RUE value is desirable, as it indicates that rainwater that was collected by the RWH system is used efficiently; with most collected rainwater being used to meet household demand rather than overflowing from the tank. Conversely, large overflows of water would result in lower RUE value. Another important performance parameter is the utilisation of system (UoS), which relates to the efficiency of the tank. This is defined as the average annual amount of rainwater supplied by the system to its maximum storage capacity; essentially, the amount of water supplied per unit volume of water tank. High UoS value indicates efficient utilisation of the water tank. RUE and UoS are given by:
2.2.2. Life Cycle Cost of the System
Life Cycle Cost (LCC) may be used to evaluate economic feasibility, based on current costs of different system components under current market conditions. This allows for the identification of high-cost components and, hence, allows a more focused approach by manufacturers as well as authorities, in order to promote the use of RWH system in Brunei. Initial capital cost (CC) and maintenance cost in year i (MCi) are included in LCC calculation. CC includes rainwater tank, piping, guttering, water pump, first flush, and leaf eater devices, and also, the necessary labour cost to set up the system. MC includes scheduled cleaning cost of the tank as well as the replacement cost of water pump. The importance of cleaning the inside of the tank needs to be emphasised, as tropical countries, such as Brunei, are prone to mosquitoes infestation from stagnant water and, as such, regular scheduled cleaning is of utmost important.
The use of collected water from the system is only restricted to toilet, laundry, and gardening usages, as extending to potable use would require extra processes, such as chlorination and advance filtering processes; increasing cost of the system even further. Furthermore, the socio-acceptability of using rainwater for non-potable usage is easier to accomplish. Of course, in the future, this may be extended to potable use.
For calculation purposes, present value calculations are used where applicable; to acknowledge the time value of money, with r taken as the prevailing interest rate value. Taking N as the expected lifetime of the system, the net present value of a RWH system is given by:
The LCC of RWH system is used to compare the feasibility of the system against purely relying on water from mains water supply, as Brunei has almost 100% water coverage. In this paper, it is assumed that water from the RWH system may be supplemented by mains water supply. As such, irrespective of availability of rainwater in the RWH system, water demand shall be fully satisfied; either using collected rainwater from the RWH system or water for the mains. At one extreme, water demand is fully satisfied by the RWH system, whilst at another extreme, mains water supply delivers all water that is needed by the household. As shall become apparent, the implementation of RWH system utilises both rainwater and water from the mains supply with different proportions. The determination of total LCC per litre of water consumed would then require consideration on the amount of water used from the RWH system and the mains pipe, as well as the costs of obtaining both sources of water. Final water unit cost (FWC) is calculated by:
As most of the water is obtained from the mains i.e., , final water unit cost (FWC) approaches water price from the mains, . Conversely, as most of the water is obtained from the RWH system i.e., , the final water unit cost approaches the average life cycle cost of the RWH system, .
The feasibility and viability of RWH system are also evaluated by estimating the time that is required to gain financial return similar to initial investment, termed its Payback Period (PP). Initial investment equates to initial CC, whilst financial return (FR) is calculated by considering the current cost of 1 m3 of water from the mains (), annual water savings, as well as expected maintenance cost. Financial Return in year i, FRi is taken as:
Payback Period (PP) is then calculated by determining the number of years that initial capital cost of the system may be recouped back while using yearly financial return in Equation (14), above.
2.2.3. Sensitivity Analysis
Important system and economic performance measures of the RWH system are calculated based on key assumptions and parameters. These performance measures are normally used as basis for determining the feasibility of the system and its economic benefits. Capital cost (CC), labour cost, maintenance cost (MC), rainfall data, water demand, and water price, from mains water supply are some of the key parameters used, which forms an alternative to the RWH system. Research papers, technical notes, industry representatives, latest market prices, and past meteorological data are the bases that comprise these important key parameters. Where relevant and appropriate, sources of these key parameters are properly indicated and referenced. Technological advancement, changes in market prices due to interactions of supply and demand, changes in behaviour of the population, and other factors may cause some of these key parameters to vary; consequently, changing the system and economic performance measures of the RWH system.
The effects of variations of some key parameters on system and economic performance measures are assessed via sensitivity analysis. In this regard, three (3) important parameters are considered: daily water demand (Dt), initial capital cost (CC), and water price () from the main water supply. Consumers determine daily water demand, and it may increase with an increase in house occupancy and usage. The market typically determines initial capital cost and water price; although government may purposely control these two important components.
3. Results and Discussion
3.1. Data for the Rainwater Harvesting (RWH) System
Local Brunei data were used to determine system and economic feasibilities of the RWH system, with data from Table 1 being used as input to the RWH model. It needs to be noted that although local data were used, the RWH model and performance measures may be easily adapted to measure feasibility in other localities, by merely changing the meteorological and economic data.
Three (3) types of housing estate were considered in this study; type A house at Mentiri, type B house at Panaga, and type C house at Meragang [26], with total floor area of 300 m2, 250 m2, and 135 m2, respectively. All of the house types are double-storey houses, with approximate roof areas of 150 m2, 125 m2, and 67.5 m2, respectively. Type A house is a single detached house with hip roof type, requiring four sets of guttering to be constructed on all four-sides of the house for rainwater collection, whilst a type B house is a semi-detached house with open-gable roof type, requiring three sets of guttering on the three-sides of the semi-detached house. Both types A and B houses are assumed to have garden area of 2.5 times their roof areas. Type C house is a terrace house with open-gable roof type, which is composed of eight terrace houses per block. For mid-terrace type C house, only one set of guttering is required to be installed on the back side of the house, in order to collect rainwater from the back part of the roof only. This effectively reduces the collection area to half of the total roof area. Collecting water from the front part of the roof necessitates extending piping across the house, which is impractical and expensive, and hence avoided in this study. On the other hand, both front and back roofs are utilised for water collection for end-terrace type C house, requiring two sets of guttering to be installed. Figure 2 gives the typical type A, B, and C houses at the three estates. Mid and end-terrace type C houses were assumed to have a garden of 1.5 and 2.5 times their roof areas, respectively. The runoff coefficient Croof of the roof was taken to be 0.9 [27].
Daily rainfall data from 1979 to 2016; ranging a span of 38 years period, were used as input to the RWH model. These data were obtained from the Brunei Darussalam Meteorological Department (BDMD) and are plotted in Figure 3.
Two use scenarios were considered; with collected rainwater being only used (1) for toilet and laundry use [25] and (2) for toilet, laundry, and garden use [13]. For the benefit of this paper, the different house types are denoted by types A1, B1, C1 mid-terrace, and C1 end-terrace for scenario 1, and types A2, B2, C2 mid-terrace, and C2 end-terrace for scenario 2.
As the housing estates are relatively new, it is assumed that all house types have an ultra-low flush toilet installed, requiring an average of 6 L (0.006 m3) per flush. Water consumption from toilet usage was taken to be 34.4 L (0.0344 m3) per person per day [28]. A washing machine with 151.4 L (0.1514 m3) of water per load was assumed, requiring an average of 35 L (0.035 m3) of water per person per day [28]. The average occupancies per household for type A, B, and C houses that were considered in this study were 6.41, 5.82, and 3.18 person per household, respectively [26]. As such, for type A, B, and C houses, these assumptions resulted in annual water demands from the toilet and laundry usage of 162.4 m3, 147.4 m3, and 80.6 m3, respectively. Water demands for gardening are dependent on the size of the garden of the house and the amount of daily rainfall, with rainfall reducing watering requirements.
For economical appraisal of the system, data in Table 2 were used as basis. The lifetime of the RWH system was taken to be 25 years [13]. Interest rate was taken to follow local historical interest rate value, which has consistently been at 5.5% for the past 10 years. Costing information was obtained from industry [29] and literatures [13], with optimistic costs being taken into consideration. The tank sizes were varied between 0.5 m3–5 m3, in view of finding optimal tank size for different house types [22].
3.2. Performance of the Rainwater Harvesting System
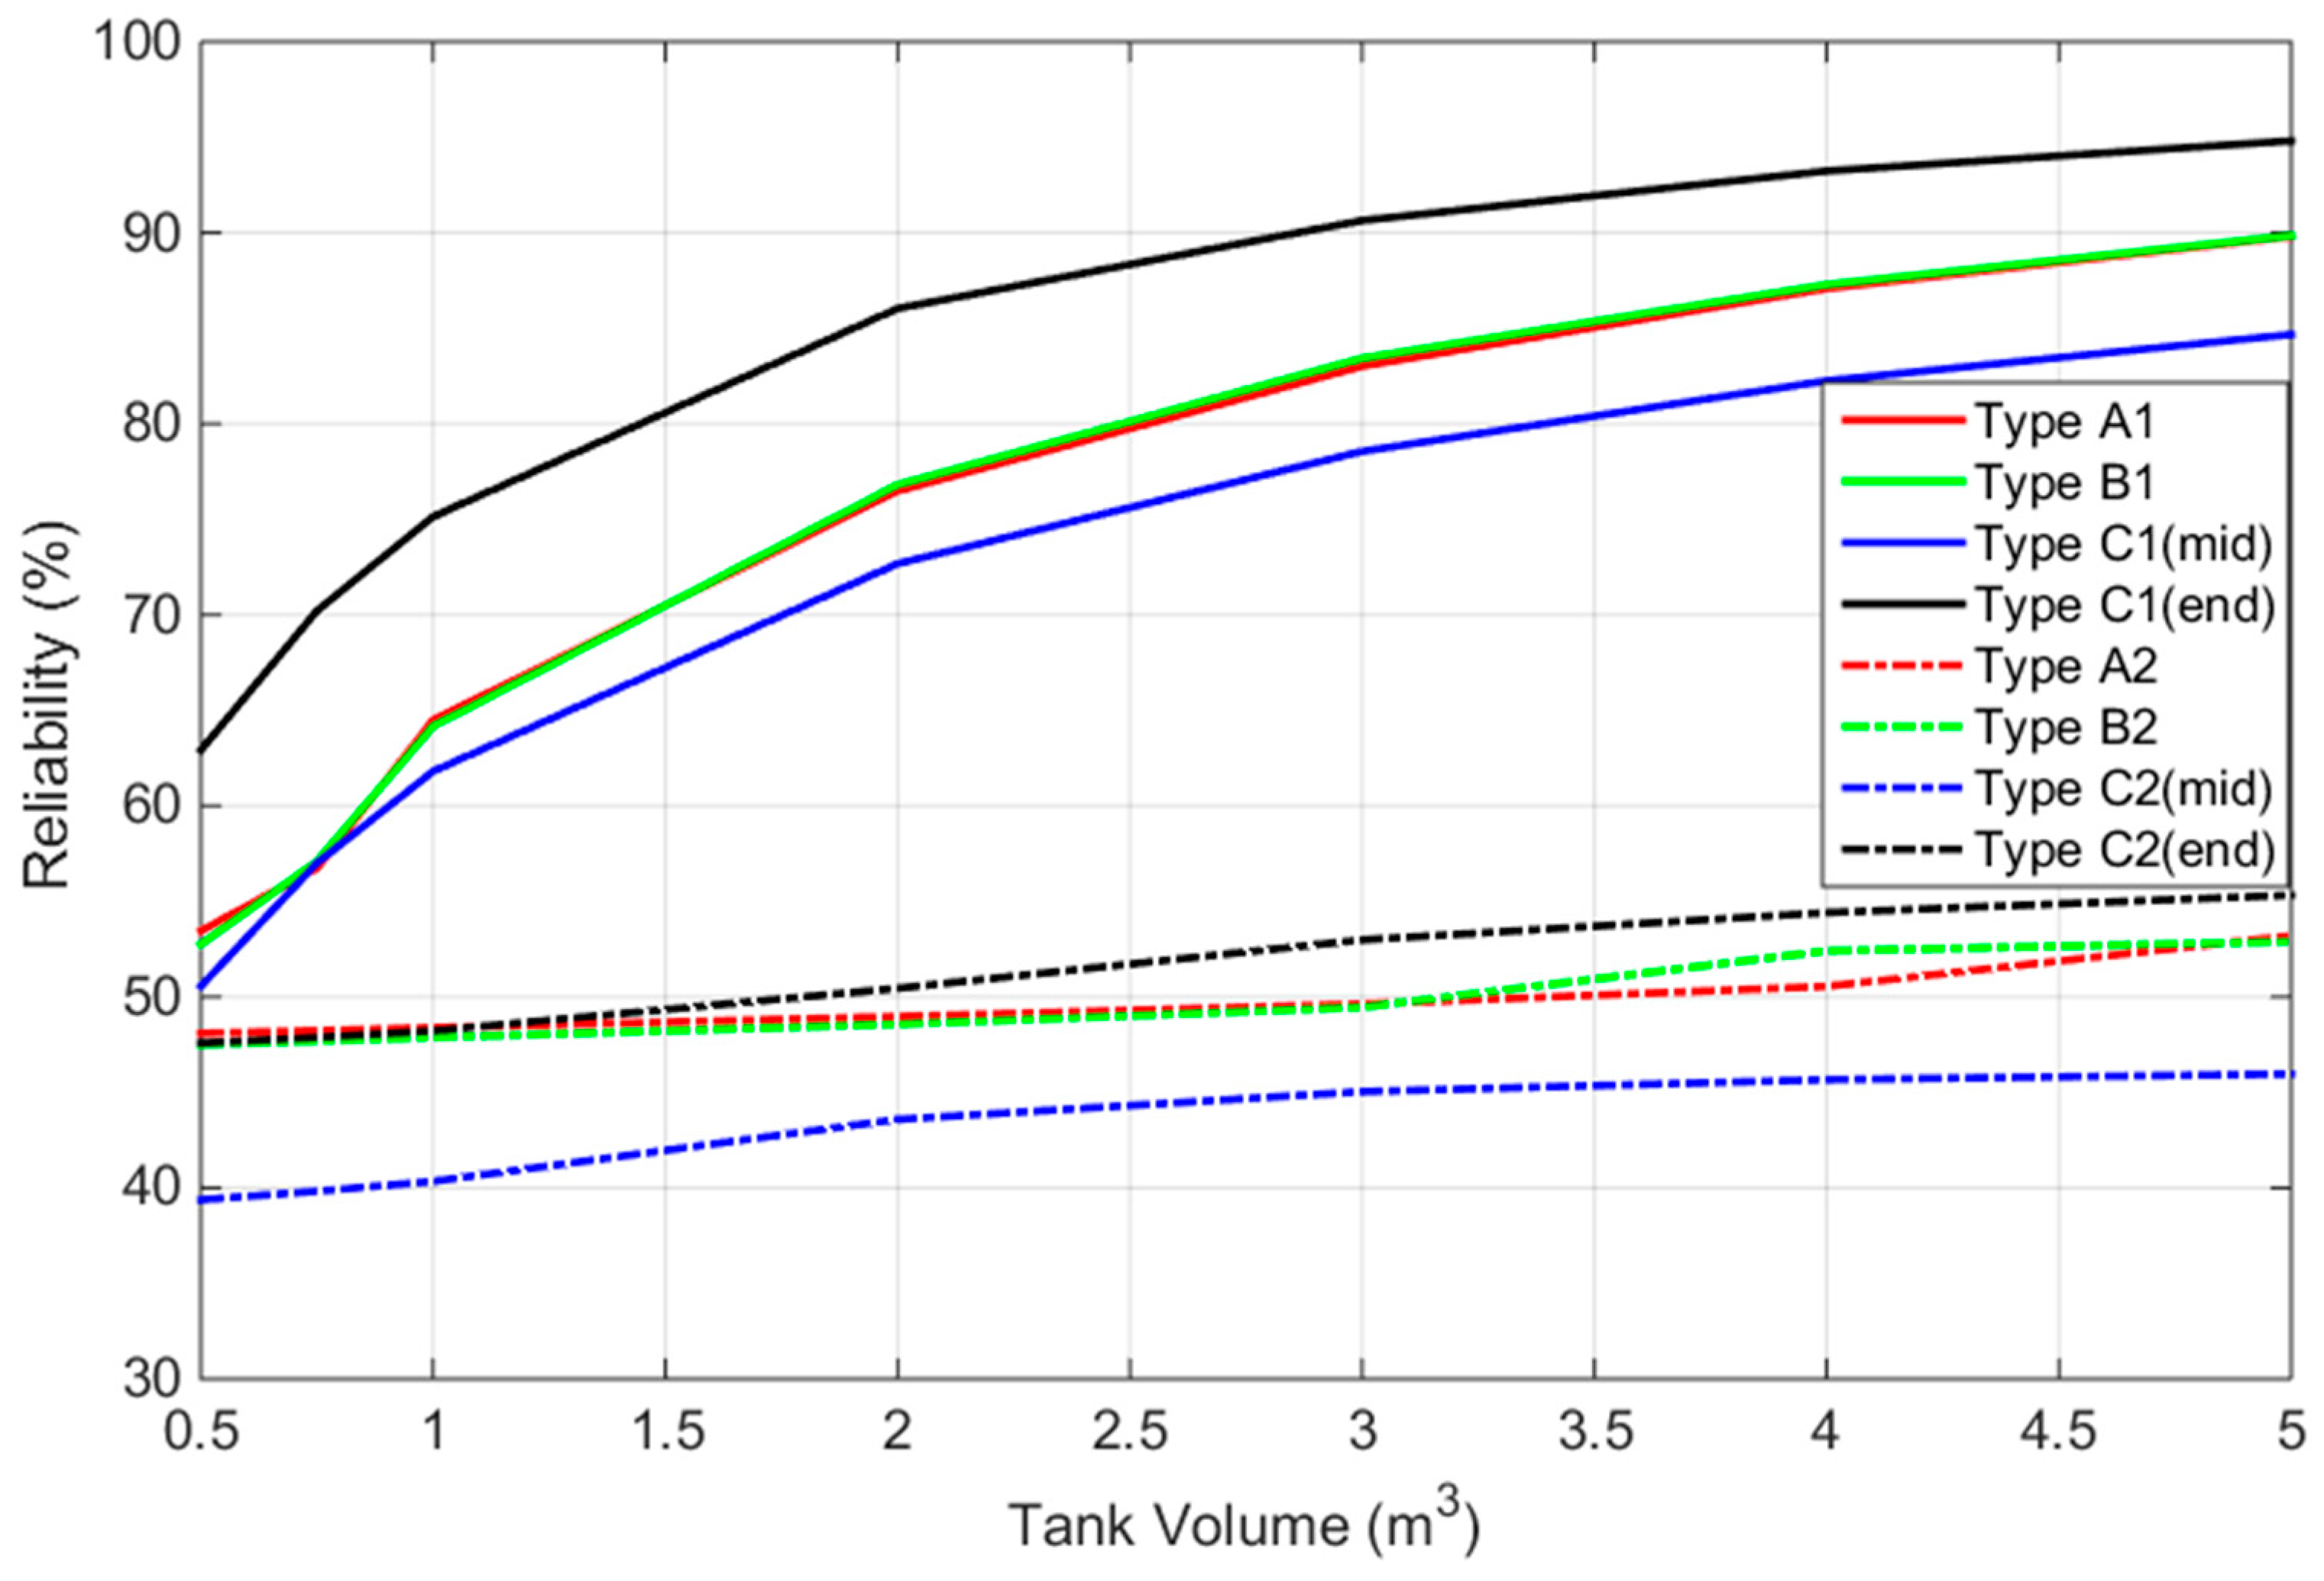
Figure 4 gives reliability of the RWH system for different tank sizes for type A, B, and C houses, while considering the two use scenarios. Generally, reliabilities for toilet, laundry, and garden use are lower than systems for toilet and laundry only; due to higher daily water demand from multiple usages.
When comparing reliabilities for the different house types, it can be seen that installing RWH system on type C end-terrace house gives the best reliability for all tank volumes. Type A and B houses, with almost the same performances, and type C mid-terrace house, performing the worst, follow this. Low reliability of type C mid-terrace house may be attributed to the smaller collection area, only collecting rainwater from the back half of the roof, with an area of 33.75 m2.
Generally, it can be seen that reliability increases with increase in tank size. Initially, increasing the tank size results in a large improvement in reliability, however, as tank size gets larger, increasing the size even further only causes minimal improvement in reliability. It needs to be highlighted that, even increasing tank size to the maximum 5 m3 does not give 100% reliability. With 5 m3 tank size, the reliabilities are 89.8%, 89.8%, 84.7%, and 94.8% for types A, B, C mid-terrace, and C end-terrace houses, respectively, in the case of toilet and laundry use only. Expanding usage to gardening provides much lower reliability values.
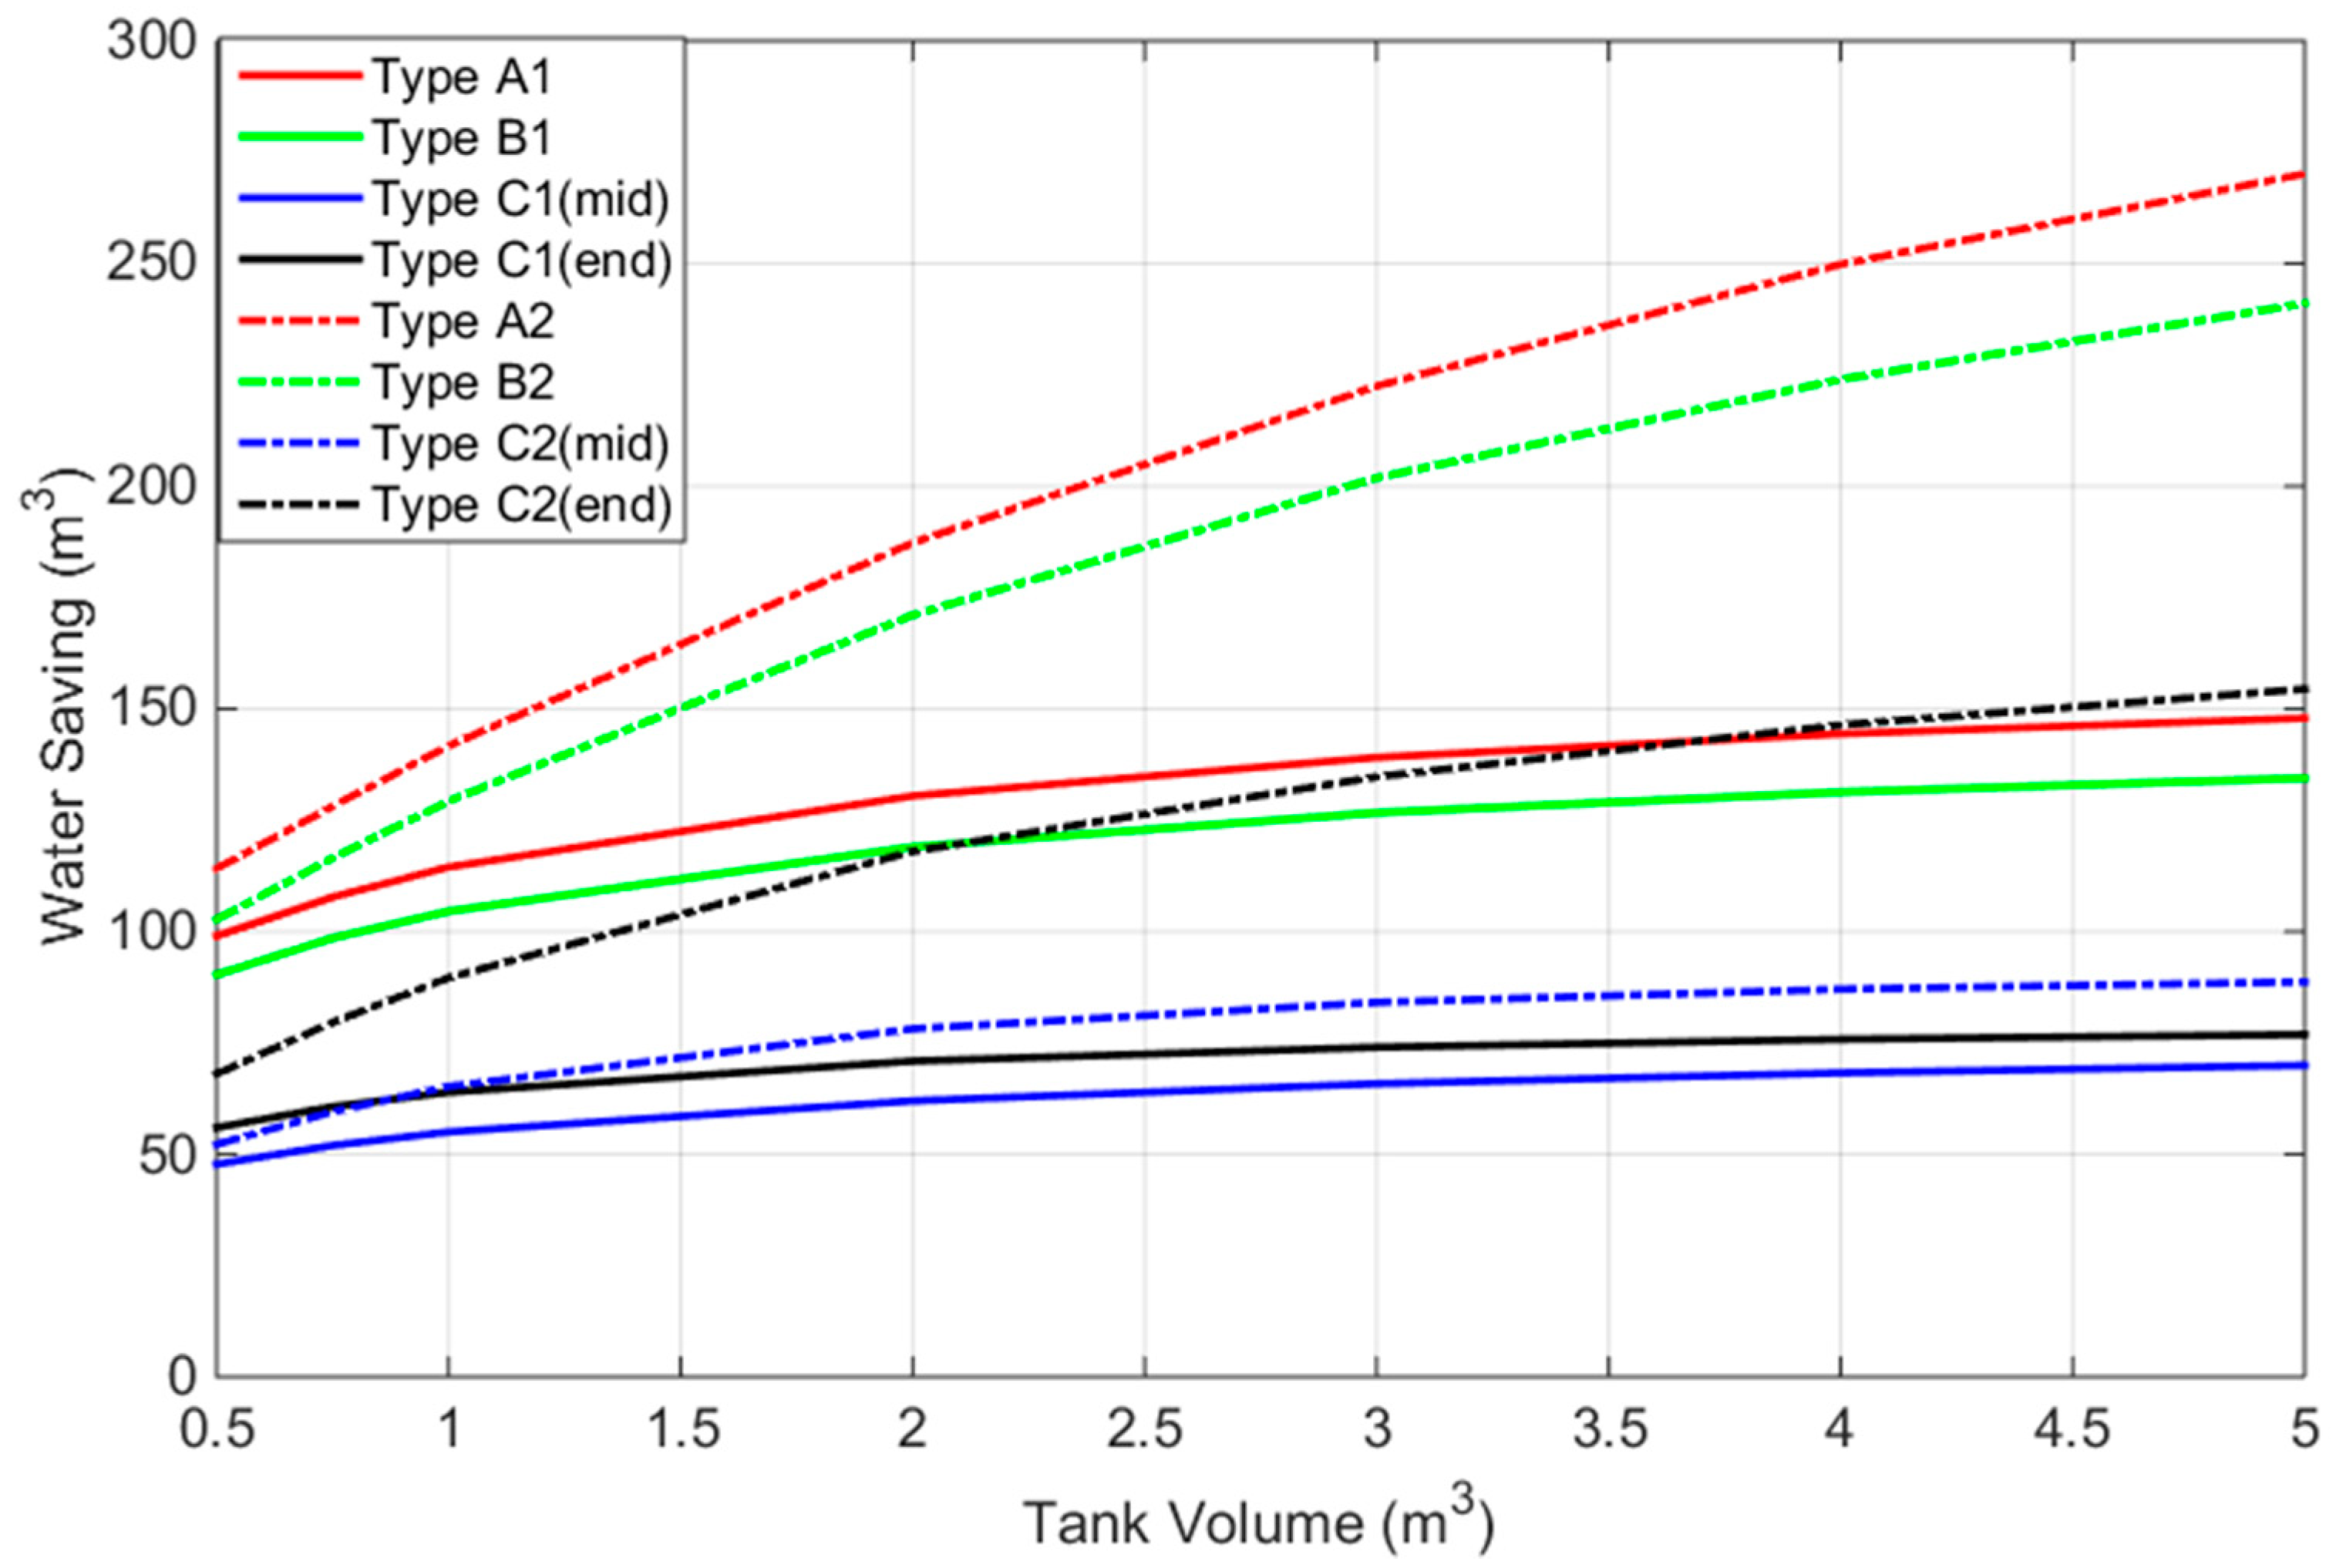
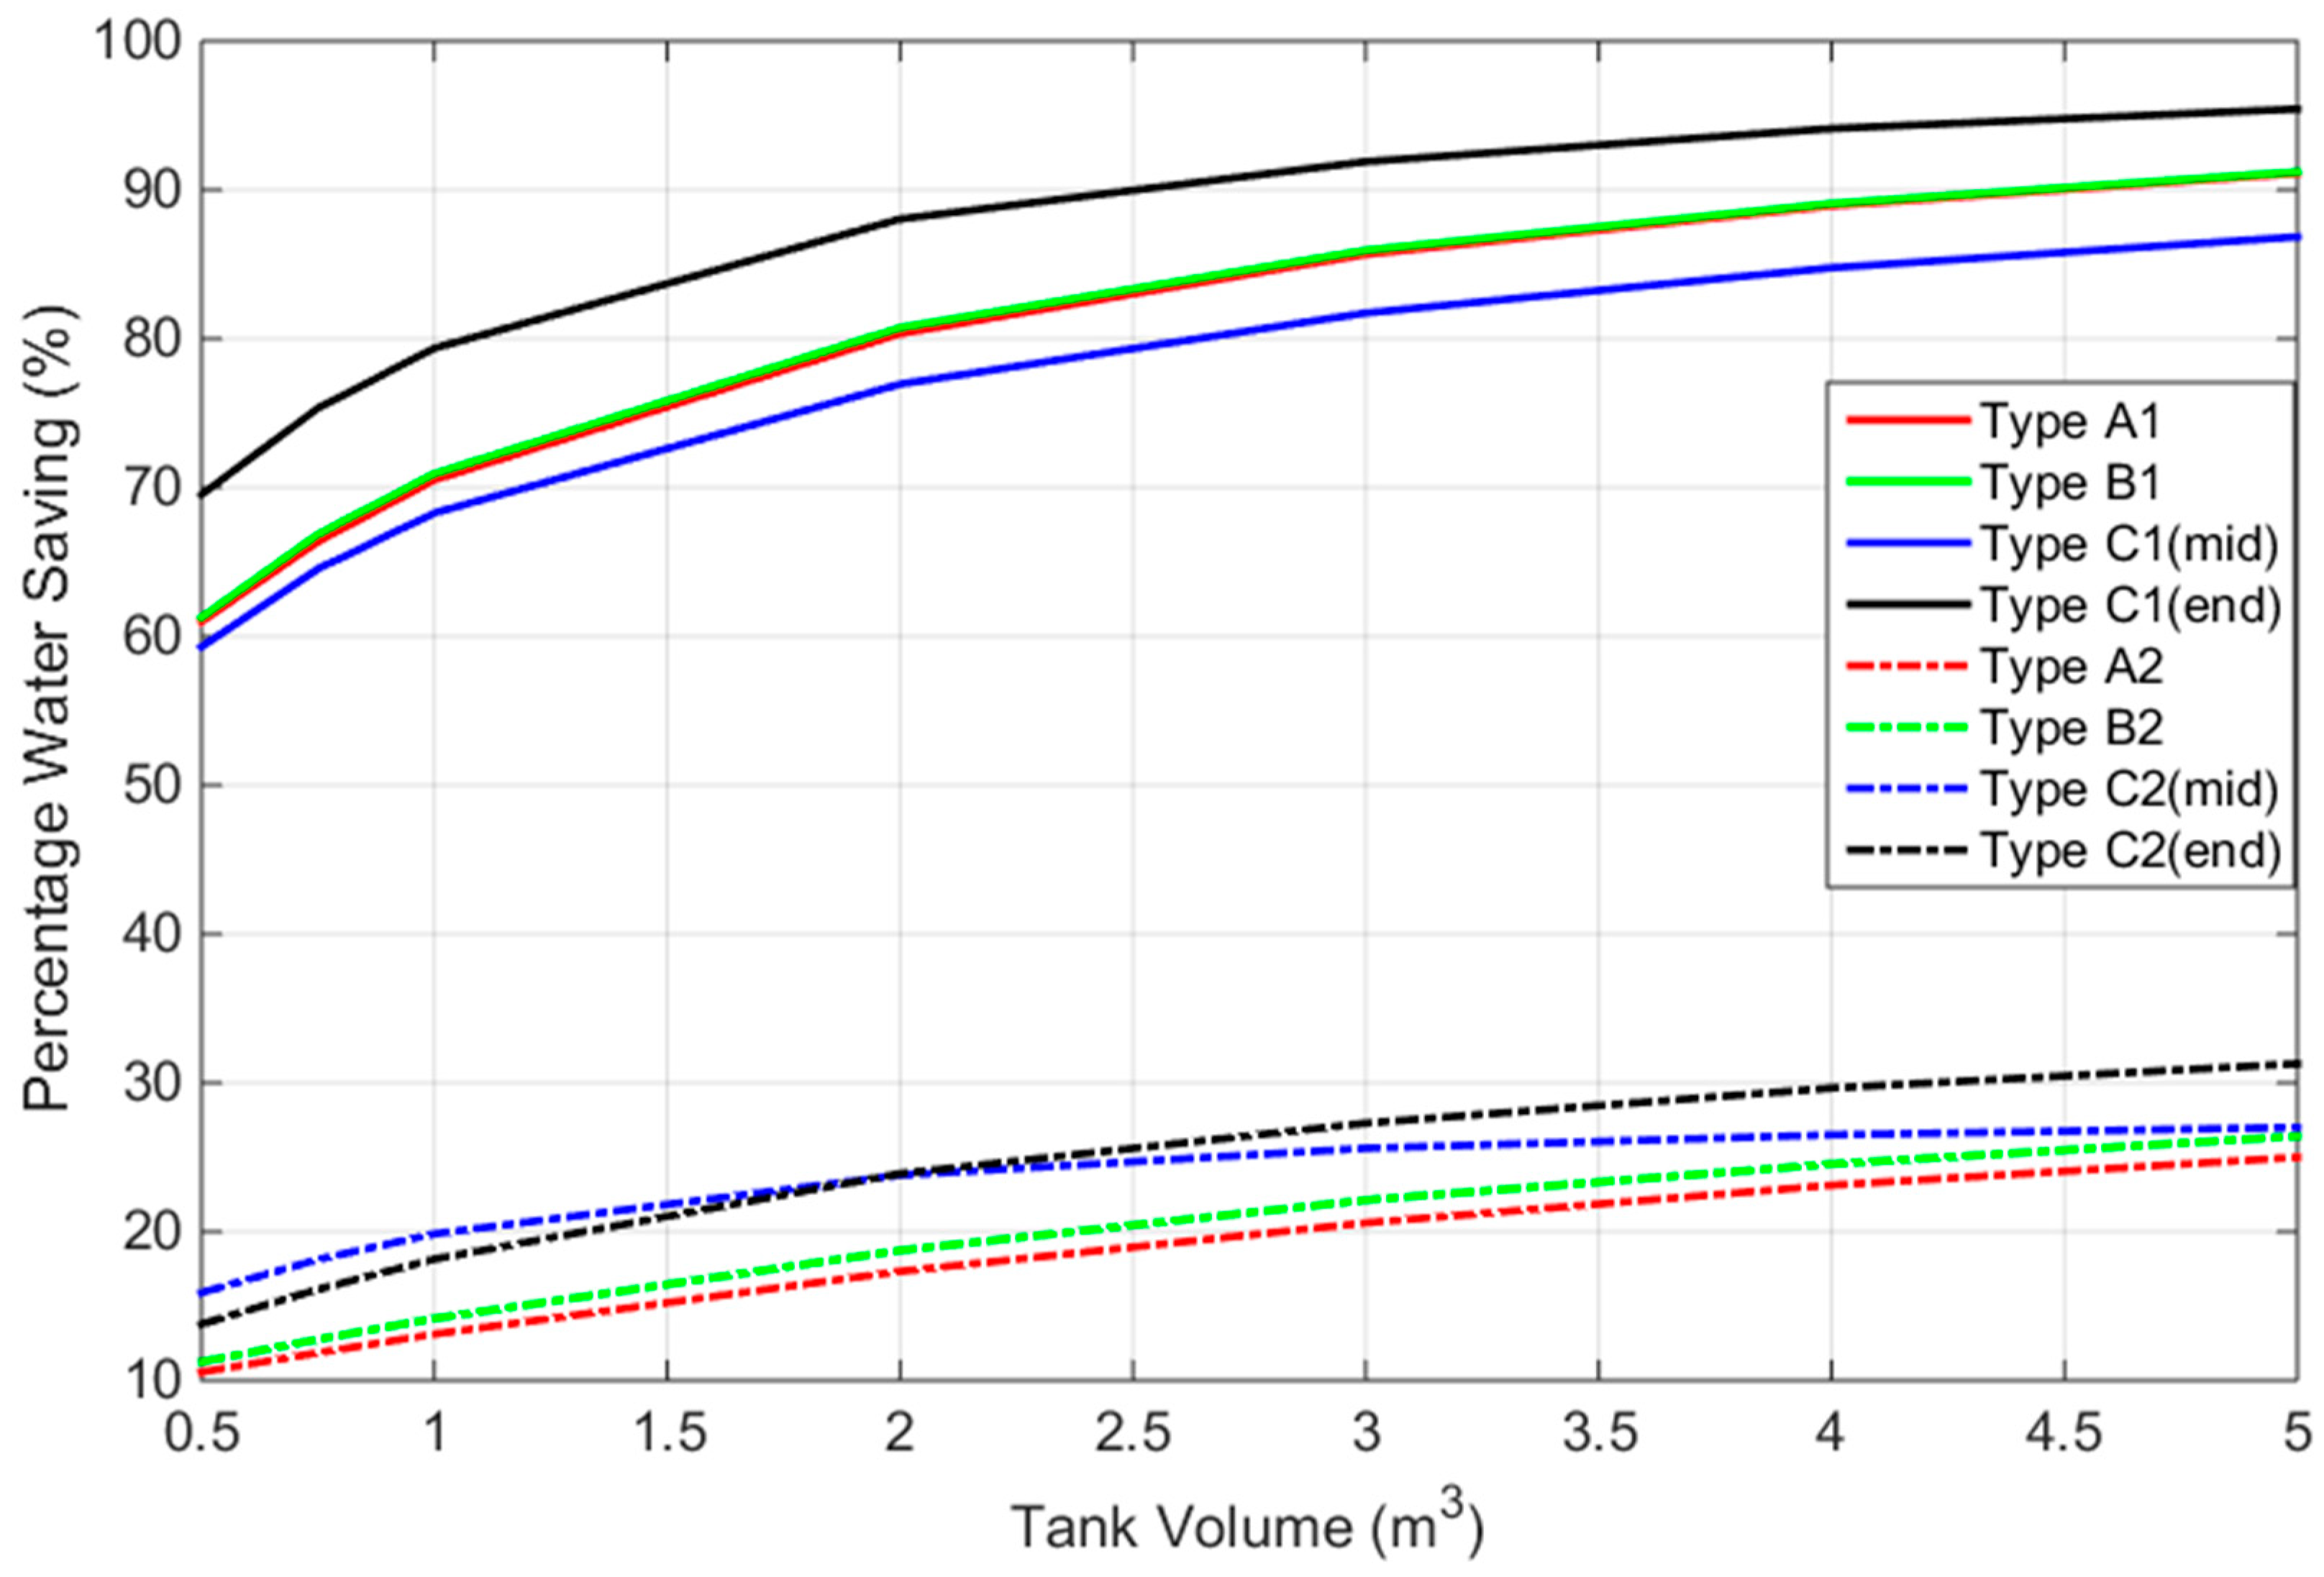
Figure 5 and Figure 6 depict the actual amount of water savings (WS) and the percentage water savings (PWS) as proportion of water demand, with different tank sizes for different types of houses. Generally, using the RWH systems for toilet, laundry, and gardening give larger water saving as opposed to using it for only toilet and laundry. However, water savings, as percentage of water demand for RWH systems for toilet, laundry, and gardening, are lower due to its higher demand. For both water use scenarios, type A house enjoys the most savings. Type B, C end, and C mid-terrace houses follow this. Similar to reliability, an initial increase in tank size considerably increases water saving, however water saving flattens as the tank size is increased beyond a certain volume. Type A, B, C mid ,and C end-terrace houses have the potential to annually save 147.9 m3, 134.4 m3, 70.0 m3, and 76.9 m3 of water, respectively, for toilet and laundry use only, whilst 270.1 m3, 241.1 m3, 88.7 m3, and 154.5 m3, respectively, for combined toilet, laundry, and garden use.
In terms of percentage water savings in relation to demand, for toilet and laundry use only, it can be seen that the type C end-terrace house has the greatest potential to satisfy the needs of the household with the ability to supply 95.4% of household demand using a 5 m3 tank. This is followed by type B, A, and C mid-terrace houses, supplying 91.2%, 91.1%, and 86.8% of water demand. Although, type A house has the potential to save the most amount of water, it ranks third in terms of PWS. This is because of the relatively higher water demand from type A house for toilet and laundry use only, which is assumed to be 162.4 m3/year, due to its higher average occupancy. This is in contrast to type C end-terrace house. Although the amount of water that is saved is lesser than the type A house, lower water demand meant that the system is able to satisfy higher percentage of its demand, and hence, higher PWS.
Expanding usage to include gardening effectively increases water demand and results in a decrease in PWS, as can be seen in Figure 6. With small tank size of less than 2 m3, type C mid-terrace house gives the highest PWS, but type C end-terrace house gives the highest PWS with a large tank volume. During rainy days, water demand from gardening is reduced and the water tank needs to store the excess water. With small tank, it is important that water demand matches with water collection, with minimal excess, as there is less room for water storage. However, as volume is increased, excess water can be easily stored for future usage, and hence the matching of demand and collection becomes less important. This may explain the apparent high PWS of type C end-terrace house, with large tank size.
Figure 7 depicts the relationship between rainwater utilisation efficiency (RUE), representing the amount of water that is supplied by the RWH system to total collected rainwater, and tank sizes. Again, using the RWH systems for combined toilet, laundry, and garden use only give higher RUE values as compared to using it for toilet and laundry. As in previously, this boils down to higher demand. For a given usage scenario, type C mid-terrace house gives the highest RUE. This is followed by type C end-terrace, B, and lastly, type A house. Given the relatively smaller roof collection area of type C mid-terrace house, the system utlilises most of the collected rainwater; initially, being stored in the tank, and then used to meet household water demand. As roof collection area is increased; as in the case for type C end-terrace, B, and A houses, it can be expected that more rainwater accumulates in the tank and, depending on water demand, more rainwater may overflow and become wasted.
It is expected that, as the volume of tank is increased, more rainwater are stored and less are wasted through overflow. The larger volume of stored rainwater may be used to meet demand when there is less input to the system due to less rain. This ability of larger water tank to cushion against low rainwater input results in larger water savings and, consequently, large improvement in RUE. However, as the tank size gets too large, most of the stored rainwater remains unused; and hence, less improvement in RUE is observed with larger tank size. For combined toilet, laundry, and garden use, maximum RUE values of 97.0%, 84.5%, 71.2%, and 66.5% are achievable for type C mid, C end-terrace, B, and A houses, respectively. However, for toilet and laundry use only, RUE of types C mid, C end-terrace, B, and A houses reach 76.5%, 42.0%, 39.7%, and 36.4%, respectively.
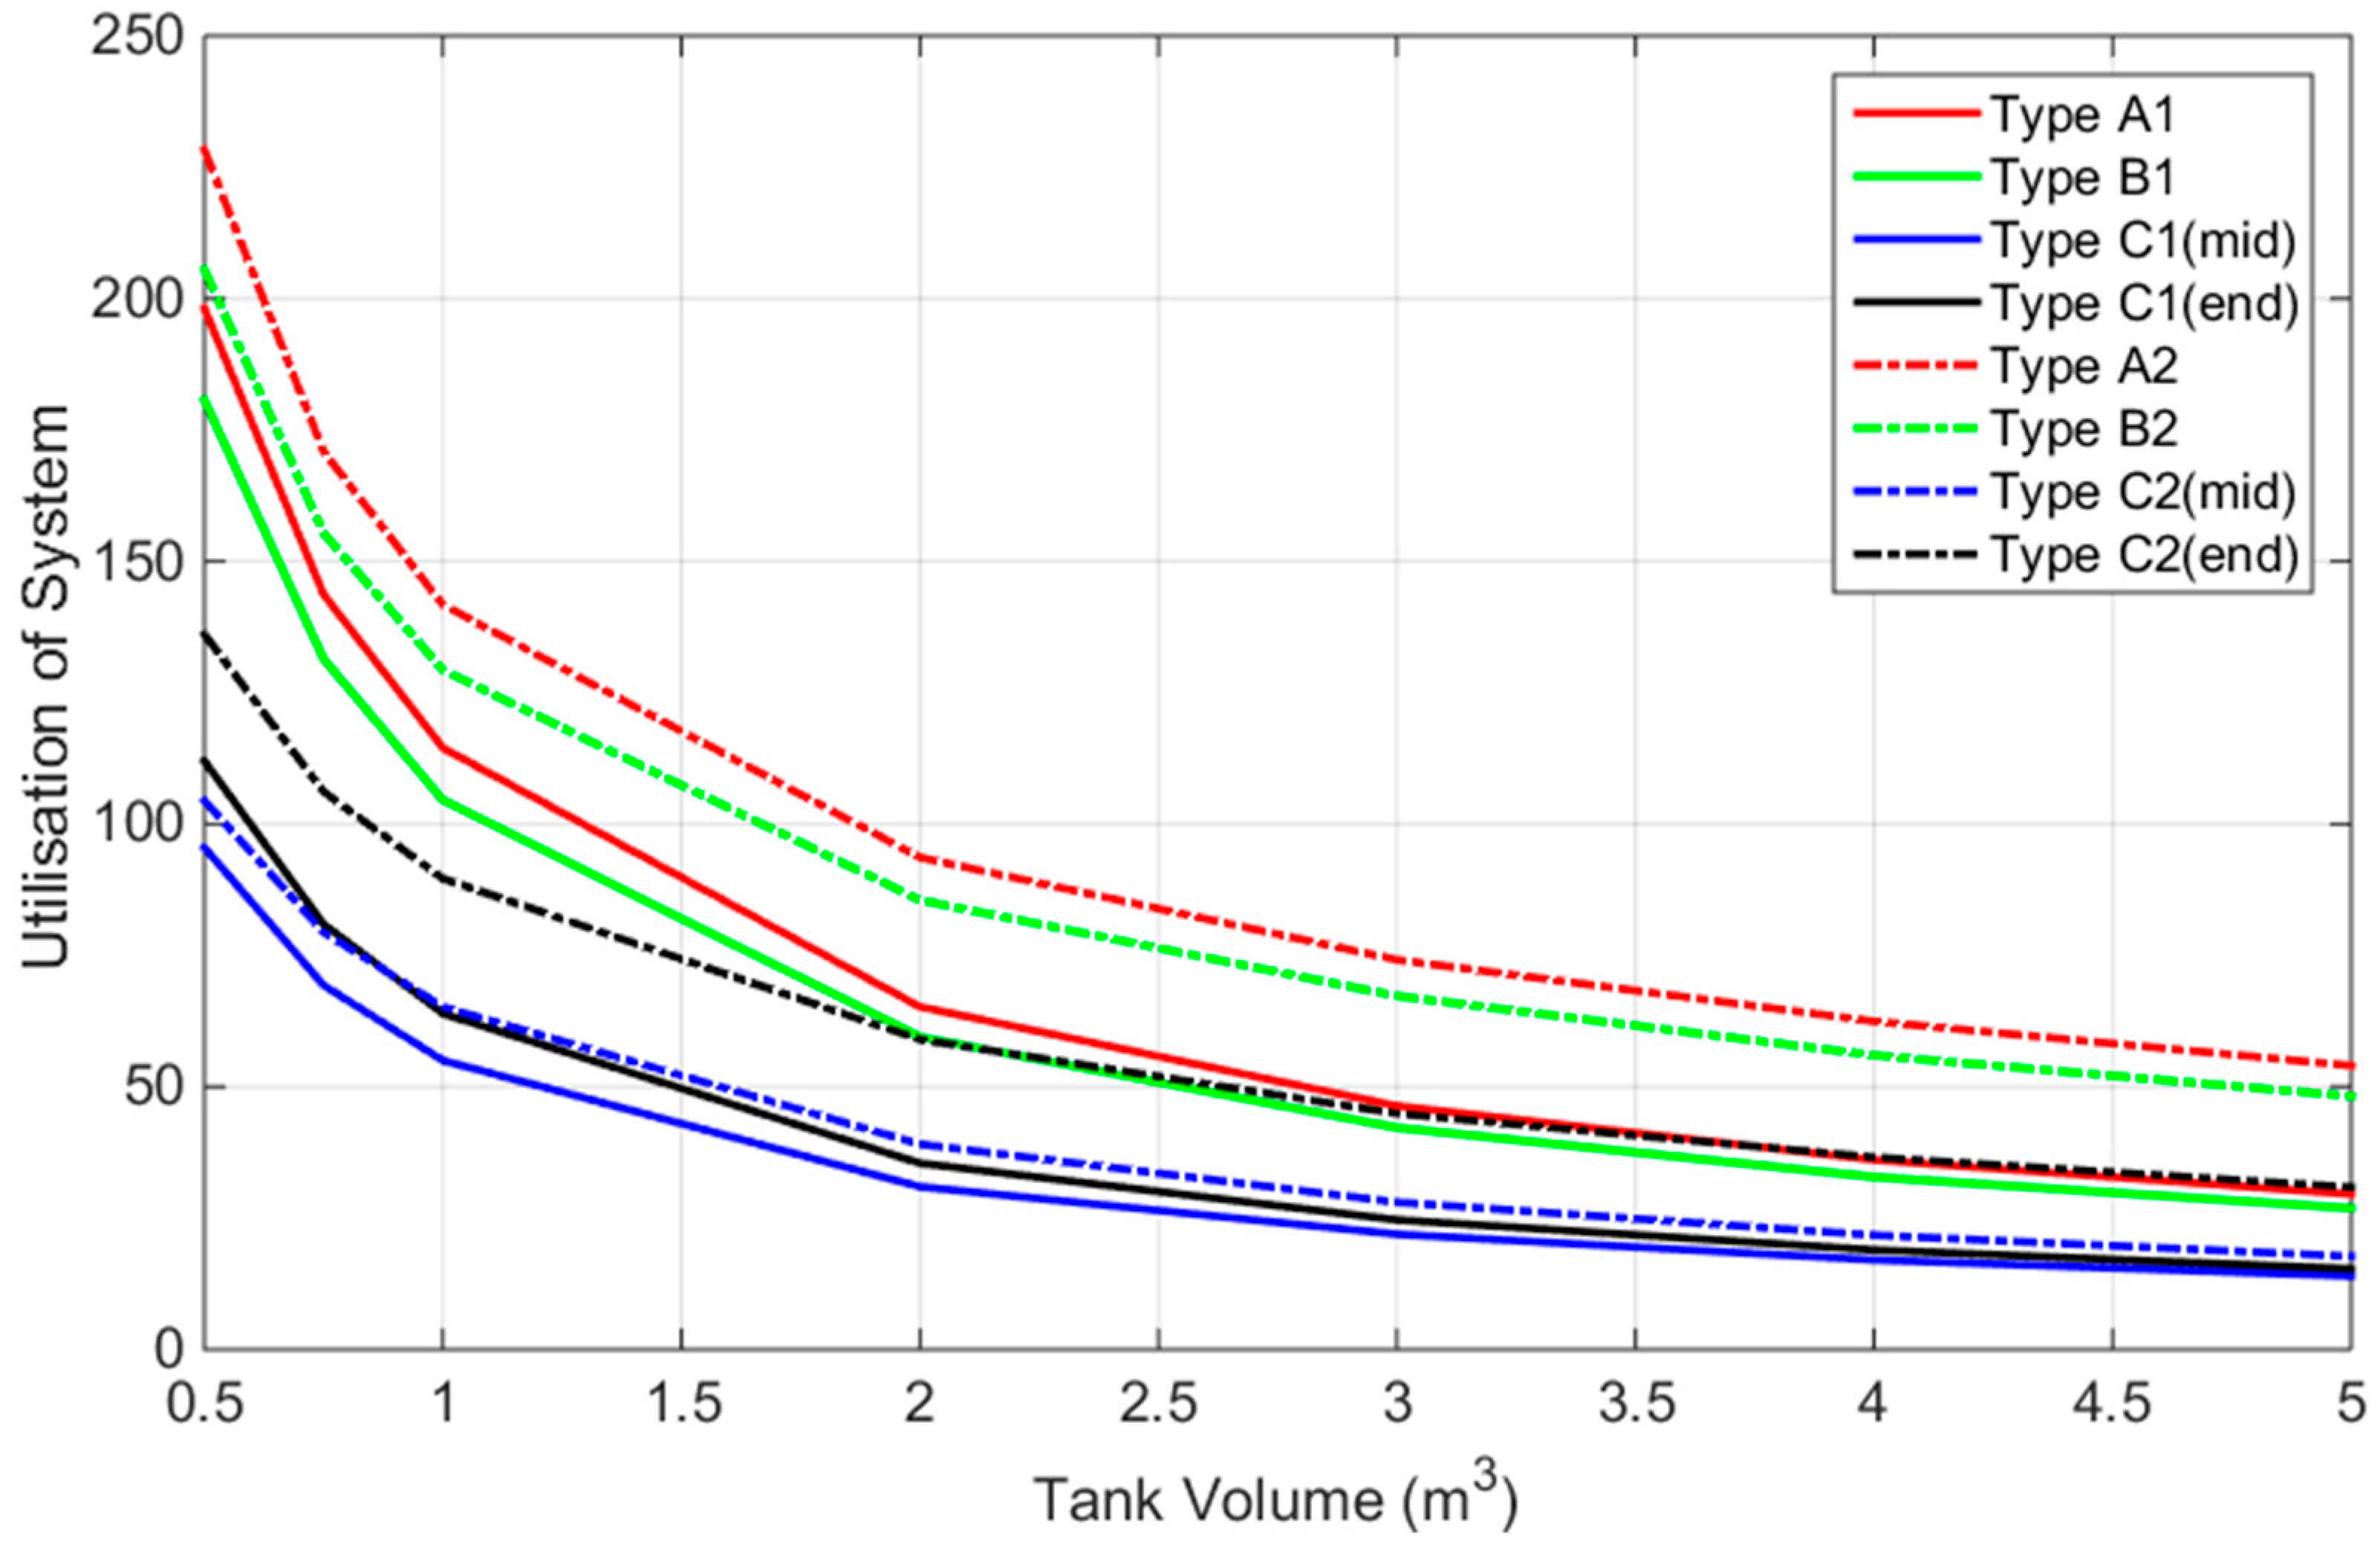
Figure 8 depicts the utilisation of system, which gives an indication of efficiency of the tank, with different tank sizes for different types of houses. Due to higher water demand, the UoS of RWH systems utilising the collected rainwater for combined toilet, laundry, and garden use, are generally higher. Higher water savings from type A house results in higher UoS. Type B, C end, and C mid-terrace houses, in terms of UoS performances, follow type A house. Intuitively from equation (10), above, increasing the tank size would result in a reduction of UoS, which can be clearly observed from the figure. This occurs despite the increase in water savings, as depicted in Figure 5.
It has been shown that type C end-terrace house provides the most reliable RWH system with 5 m3 tank size; providing 94.8% and 55.3% reliabilities, and satisfying 95.4% and 31.3% of water demand, for toilet and laundry use only, and for combined toilet, laundry, and garden use, respectively. Although reliability is of utmost importance for a system relying solely on rainwater, it is of secondary importance for the RWH system under consideration. This is because supplemental input from mains water supply may be used should there be no rainwater left in the system. For such a system, the amount of water saved is a more appropriate performance measure. The results have shown that type A house could potentially save the most amount of water from the RWH system and, consequently, gives the highest UoS. For toilet and laundry use only, type A house could potentially save 148 m3 of water with corresponding UoS of 29.6, whilst for combined toilet, laundry and garden use, 270 m3 of water could be potentially be saved with corresponding UoS of 54.0.
Another useful measure is rainwater utilisation efficiency; with type C mid-terrace house for combined toilet, laundry, and garden use, providing the highest utilisation of 97.0%. It has been shown that, as tank size is increased and the system is able to store more rainwater, less overflow happens, resulting in high RUE. The extra capacity also increases water savings and, accordingly, percentage water savings, resulting in a more reliable system. However, the increase in water savings is less in proportion to the increase in tank size, resulting in lower UoS.
The effect of increasing water demand through garden use for a given tank size is an increase in water savings and UoS. As rainfall remains constant for a given locality, RUE also increases. However, an increase in demand has the effect of reducing percentage water saving as well as reducing reliability.
3.3. Life Cycle Cost and Payback Period of RWH System
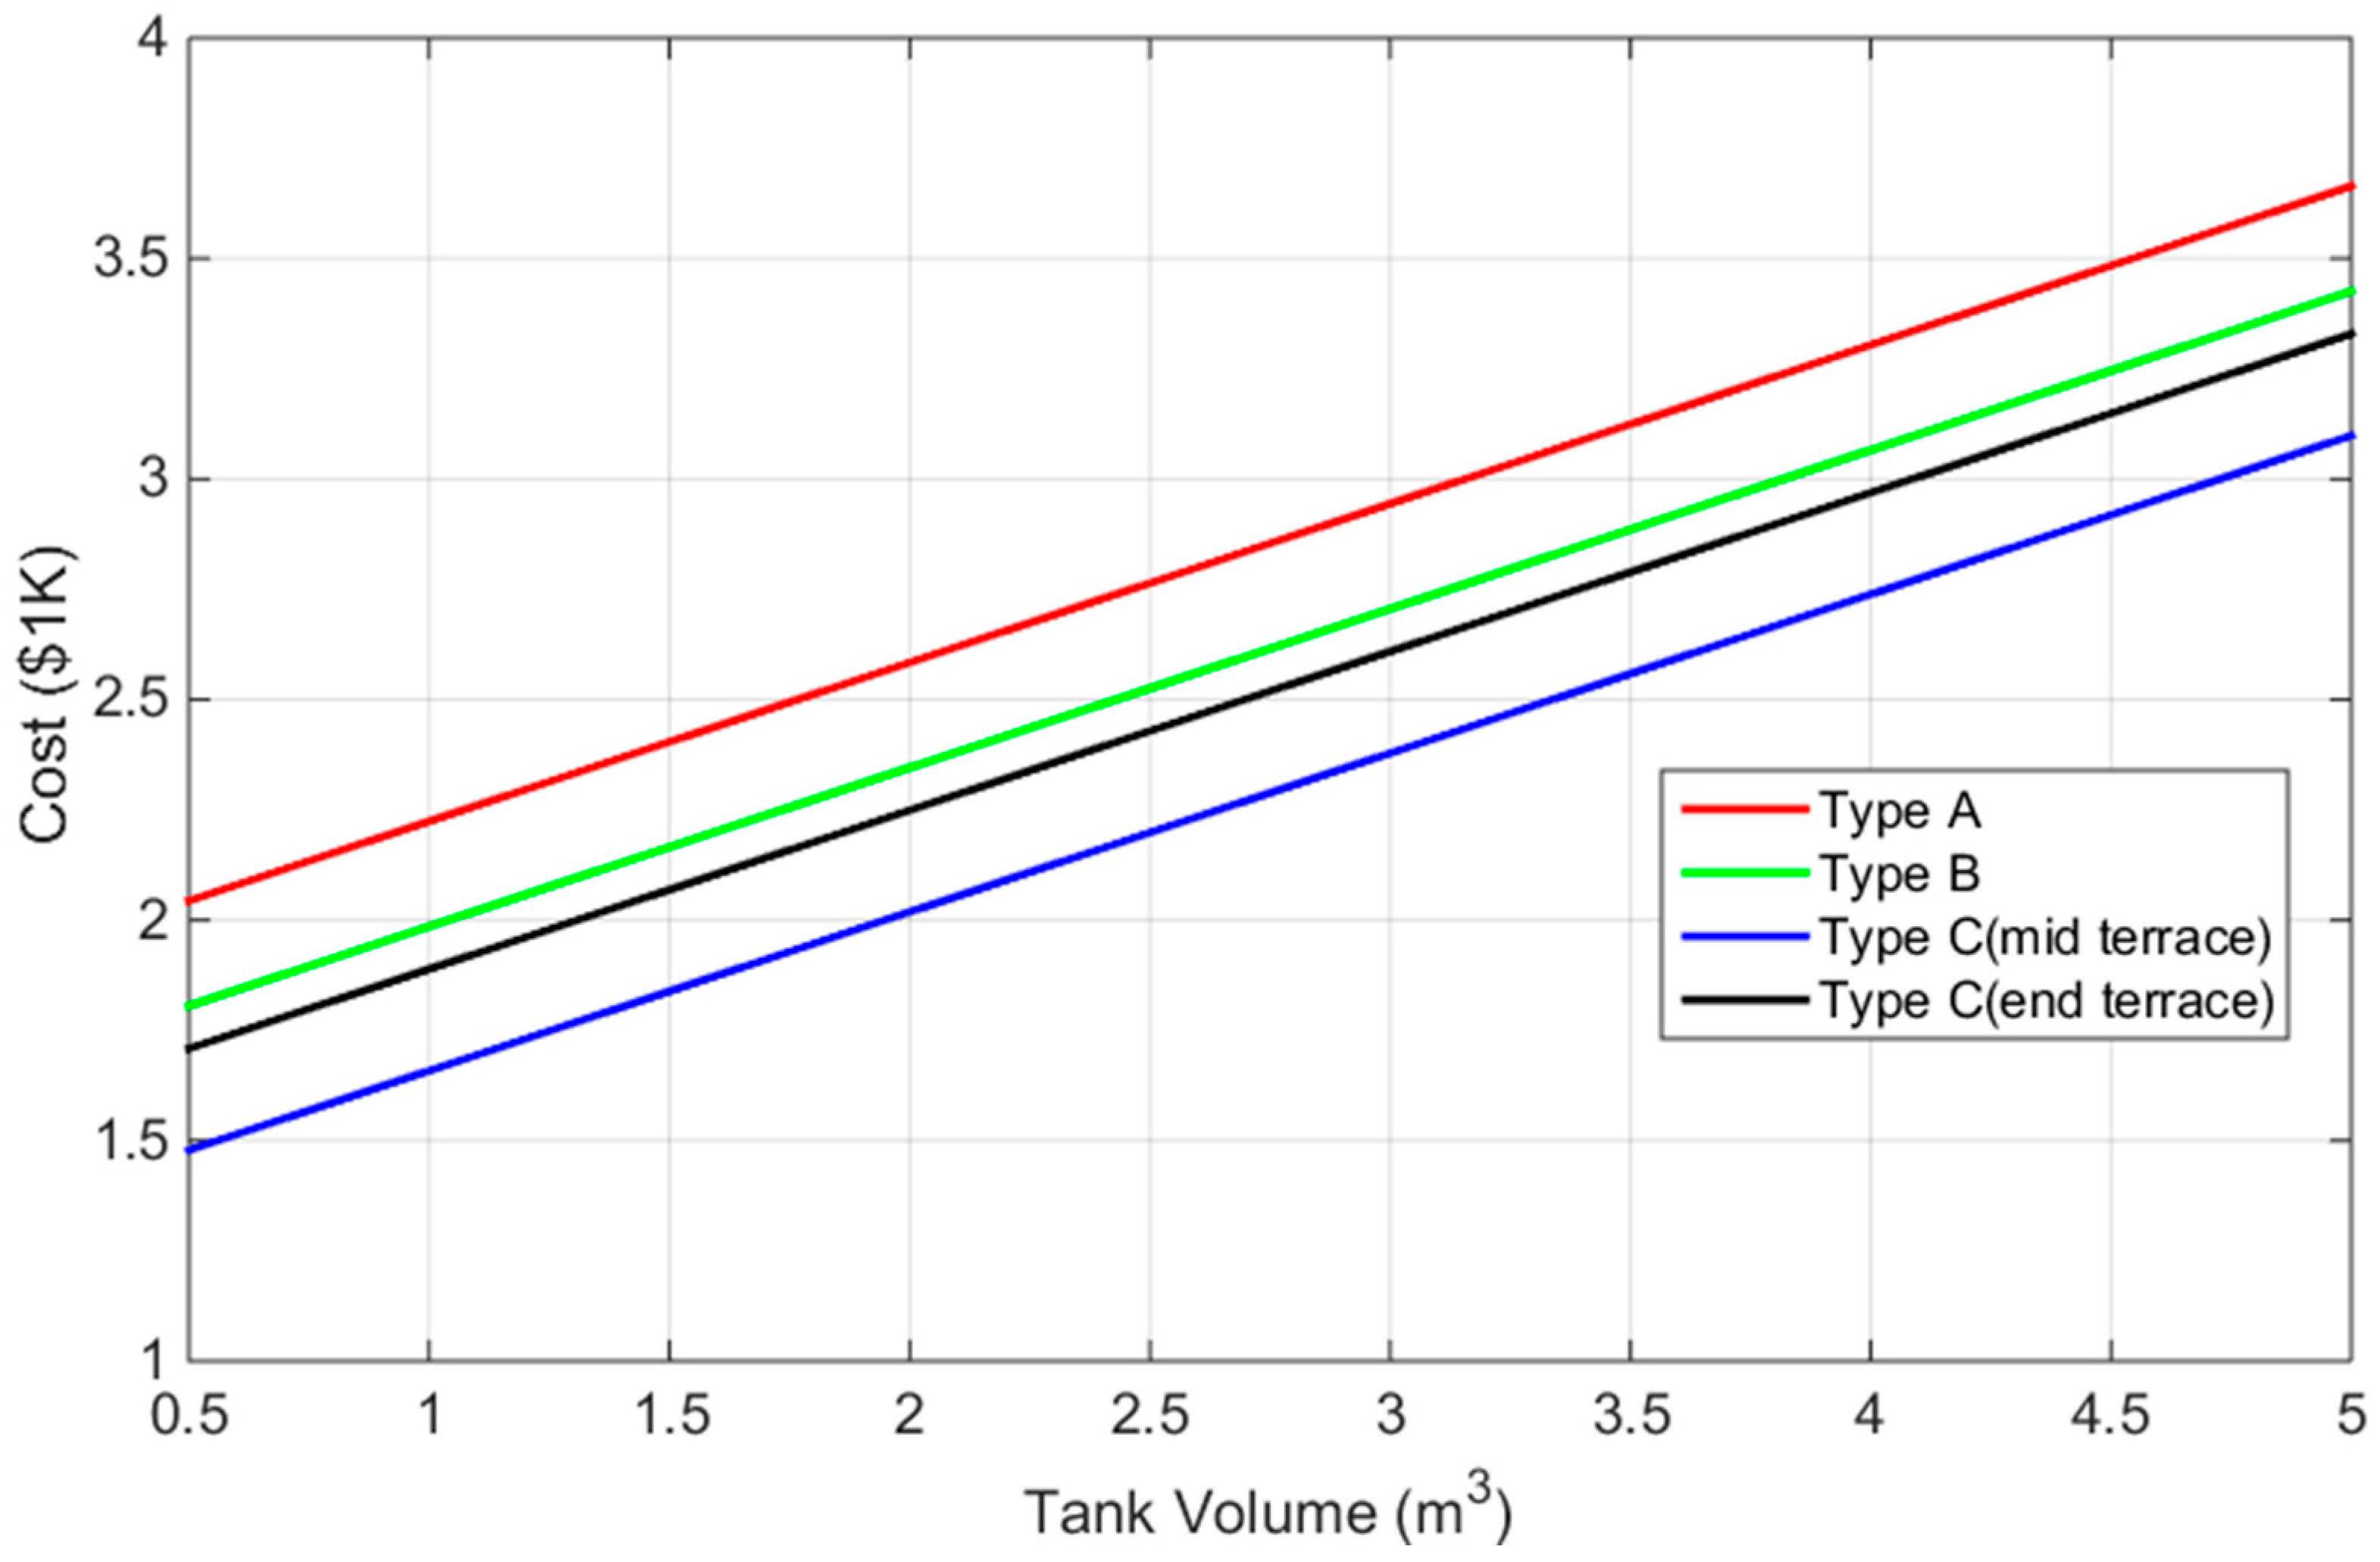
Figure 9 shows the life cycle cost of the RWH system, which includes the initial capital and maintenance costs. Table 3 gives the breakdown of LCCs for different house types.
As can be seen from Figure 9 and Table 3, for a given house type, CC varies depending on tank size, which is between 0.5 m3 and 5 m3, with a larger tank size increasing CC. CC dominates the total cost of the system. For the smallest tank size, initial CCs for type A, B, C mid, and C end-terrace houses are $1403, $1165, $838, and $1068, respectively; representing 68.7%, 64.5%, 56.7%, and 62.5% of the total LCCs of the systems. As tank size is increased to 5 m3, CCs jump to $3023, $2785, $2458, and $2688 for type A, B, C mid, and C end-terrace houses, respectively; representing 82.5%, 81.3%, 79.3%, and 80.8% of total LCCs.
Generally, the larger the house, the higher the capital cost; due to more guttering, piping, etc., which are needed to cover the increase in rooftop area. This can be clearly seen when comparing the CCs of type A, B, and C houses, which have differing roof areas. CC of type C end-terrace house is higher than type C mid-terrace house, which is due to the type C mid-terrace house only utilising half of the total roof area. However, this comes with a reduction in potential water saving, as can be seen in Figure 5.
It is interesting to note that, although RWH system for type A house represents the most expensive system, it has the potential to save the most water, as can be seen from Figure 5, which is capable of saving up to 147.9 m3 of water for toilet and laundry use only, and 270.1 m3 of water for combined toilet, laundry, and garden use. Total LCC for type A house with 5 m3 tank size is $3664: being composed of $3023 CC and $641 MC. Type B, C end, and C mid-terrace houses follow this. Type C mid-terrace house represents the cheapest RWH system, which is only capable of saving 70.0 m3 of water for toilet and laundry use, and 88.7 m3 of water for combined toilet, laundry, and gardening use, with a total LCC of $3098.
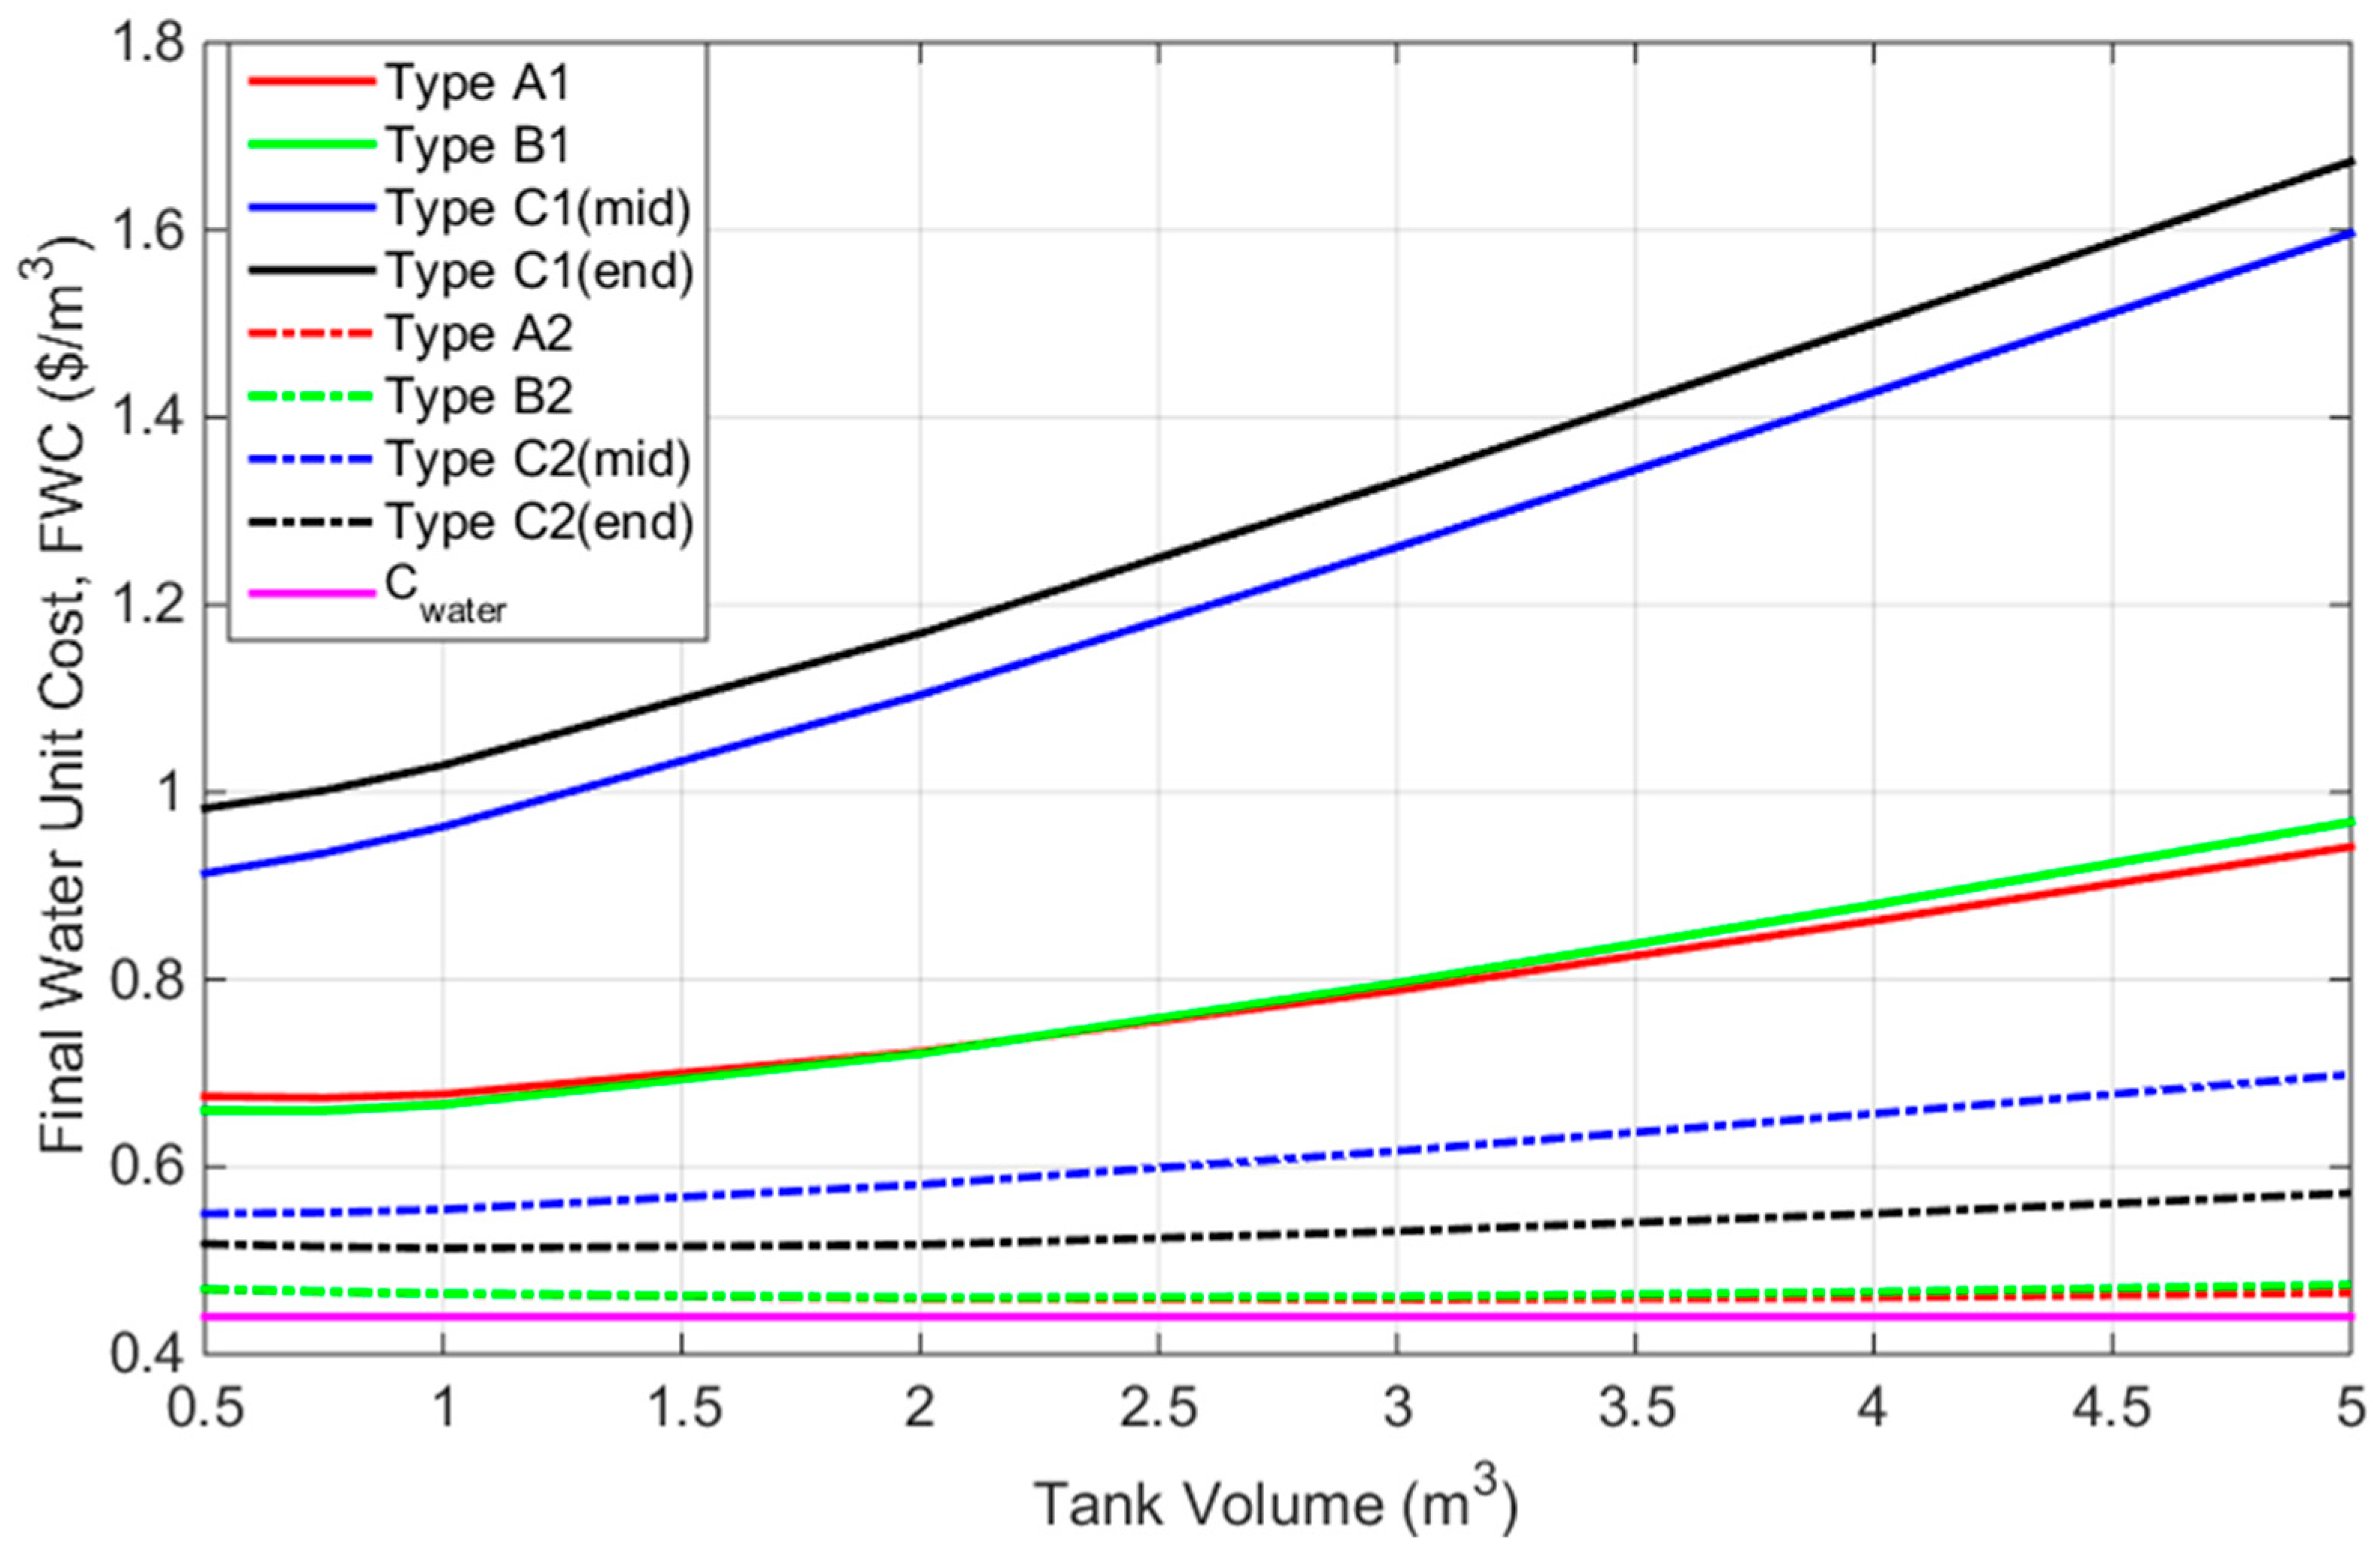
Given that the most expensive RWH system has the potential to save the most amount of water, it would be interesting to compare the life cycle cost per litre of water for different house types. Figure 10 provides this. As can be seen, the use of RWH system gives final water unit costs (FWC), which are more expensive than the current water price at from the mains water supply, irrespective of tank sizes and house types. This is certainly expected, given that water is a subsidised commodity in Brunei.
Generally, it can be seen that combined toilet, laundry, and gardening use gives lower FWC, as compared to toilet and laundry use only, for all house types. The most expensive RWH system, type A house gives the lowest FWC. For combined toilet, laundry, and garden use, lowest FWC of is obtained for type A house, with 3 m3 tank volumes. This represents the cheapest FWC value, albeit still 1.8 cents higher than the current water price from the mains. Type C end-terrace house with toilet and laundry use only provides the most expensive FWC, as can be seen from the figure.
For a given house type, there exists a given tank volume that gives the lowest FWC. Table 4 tabulates this. For combined toilet, laundry, and gardening use, type A house gives the cheapest FWC value, whilst type C mid-terrace is the most expensive, whilst for toilet and laundry use only, type B house gives the cheapest FWC value with type C end-terrace being the most expensive. It may be said that decisions on the optimum tank size to be used are dependent on many factors; rainwater collection area, water demand, and costs of raw materials, to name a few.
Figure 11 depicts the payback period (PP) of RWH system. The time for RWH system to recoup its initial CC or its payback period ranges from 1.8 years to 6.9 years, depending on house types, tank sizes, and water demand. Type B house for combined toilet, laundry, and gardening use gives the shortest payback period of 1.8 years using 2 m3 tank volumes, a payback period of nearly 1/14 of the lifetime of the RWH system. This is closely followed by type A house with 1.9 years.
Although result on payback period is encouraging, caution should be exercised in using PP for interpreting the feasibility of the system. For houses that solely rely on the RWH system, PP that is obtained from the result is indeed pleasing and indicates the economic feasibility of the system. However, since the RWH system that may be supplemented by water from mains supply is considered, the cost per unit volume or FWC of the system is a more justified measure, with comparison to water price from mains supply. As it stands, the lowest cost per unit volume from the RWH system is for type A house for combined toilet, laundry, and garden use; which is still expensive when compared to the current mains water price of . This indicates that, as compared to directly obtaining water from the mains, the RWH system is still economically infeasible for implementation in Brunei.
To relate the different economic measures, it can be seen that the LCC of the system increases with the increase in tank size. Initially, increasing the tank size results in a proportionally large increase in WS. This results in a decrease in FWC and PP at the small tank size. However, after some tank size, the increment in LCC is proportionately more than the increase in WS, resulting in an increase in both FWC and PP. As such, it can be concluded that, for every house types, there exist optimum tank sizes that would give minimum FWC.
Additionally, utilising water from the RWH system for gardenin, effectively increases water demand and, as can be seen previously, increases WS. Although LCC remains the same, increased WS results in a reduction in FWC, and as annual financial return is also increased, results in shorter PP. The importance of FWC in determining the feasibility of RWH system, through a comparison with current water price, also needs to be highlighted.
3.4. Sensitivity Analysis
Sensitivity analysis was performed to investigate the effect of changing selected parameters on the FWC of the system. Three (3) input parameters were chosen in this paper: daily water demand (Dt), initial capital cost (CC), and water price () from the mains. As can be seen from the results, combined toilet, laundry, and gardening use gives superior results for all performance measures, due to higher water demand from the household. CC is the dominant cost that is associated with the RWH system, which covers more than 50% of its LCC, as shown in Table 3. CC is made up of cost of water tank, water pump, piping, guttering and accessories as well as labour cost; with changes in CC perhaps being due to the variation in market prices of components or government driven using rebate scheme. Finally, water price from the mains is currently government subsidised and it may be used to encourage use of the RWH system.
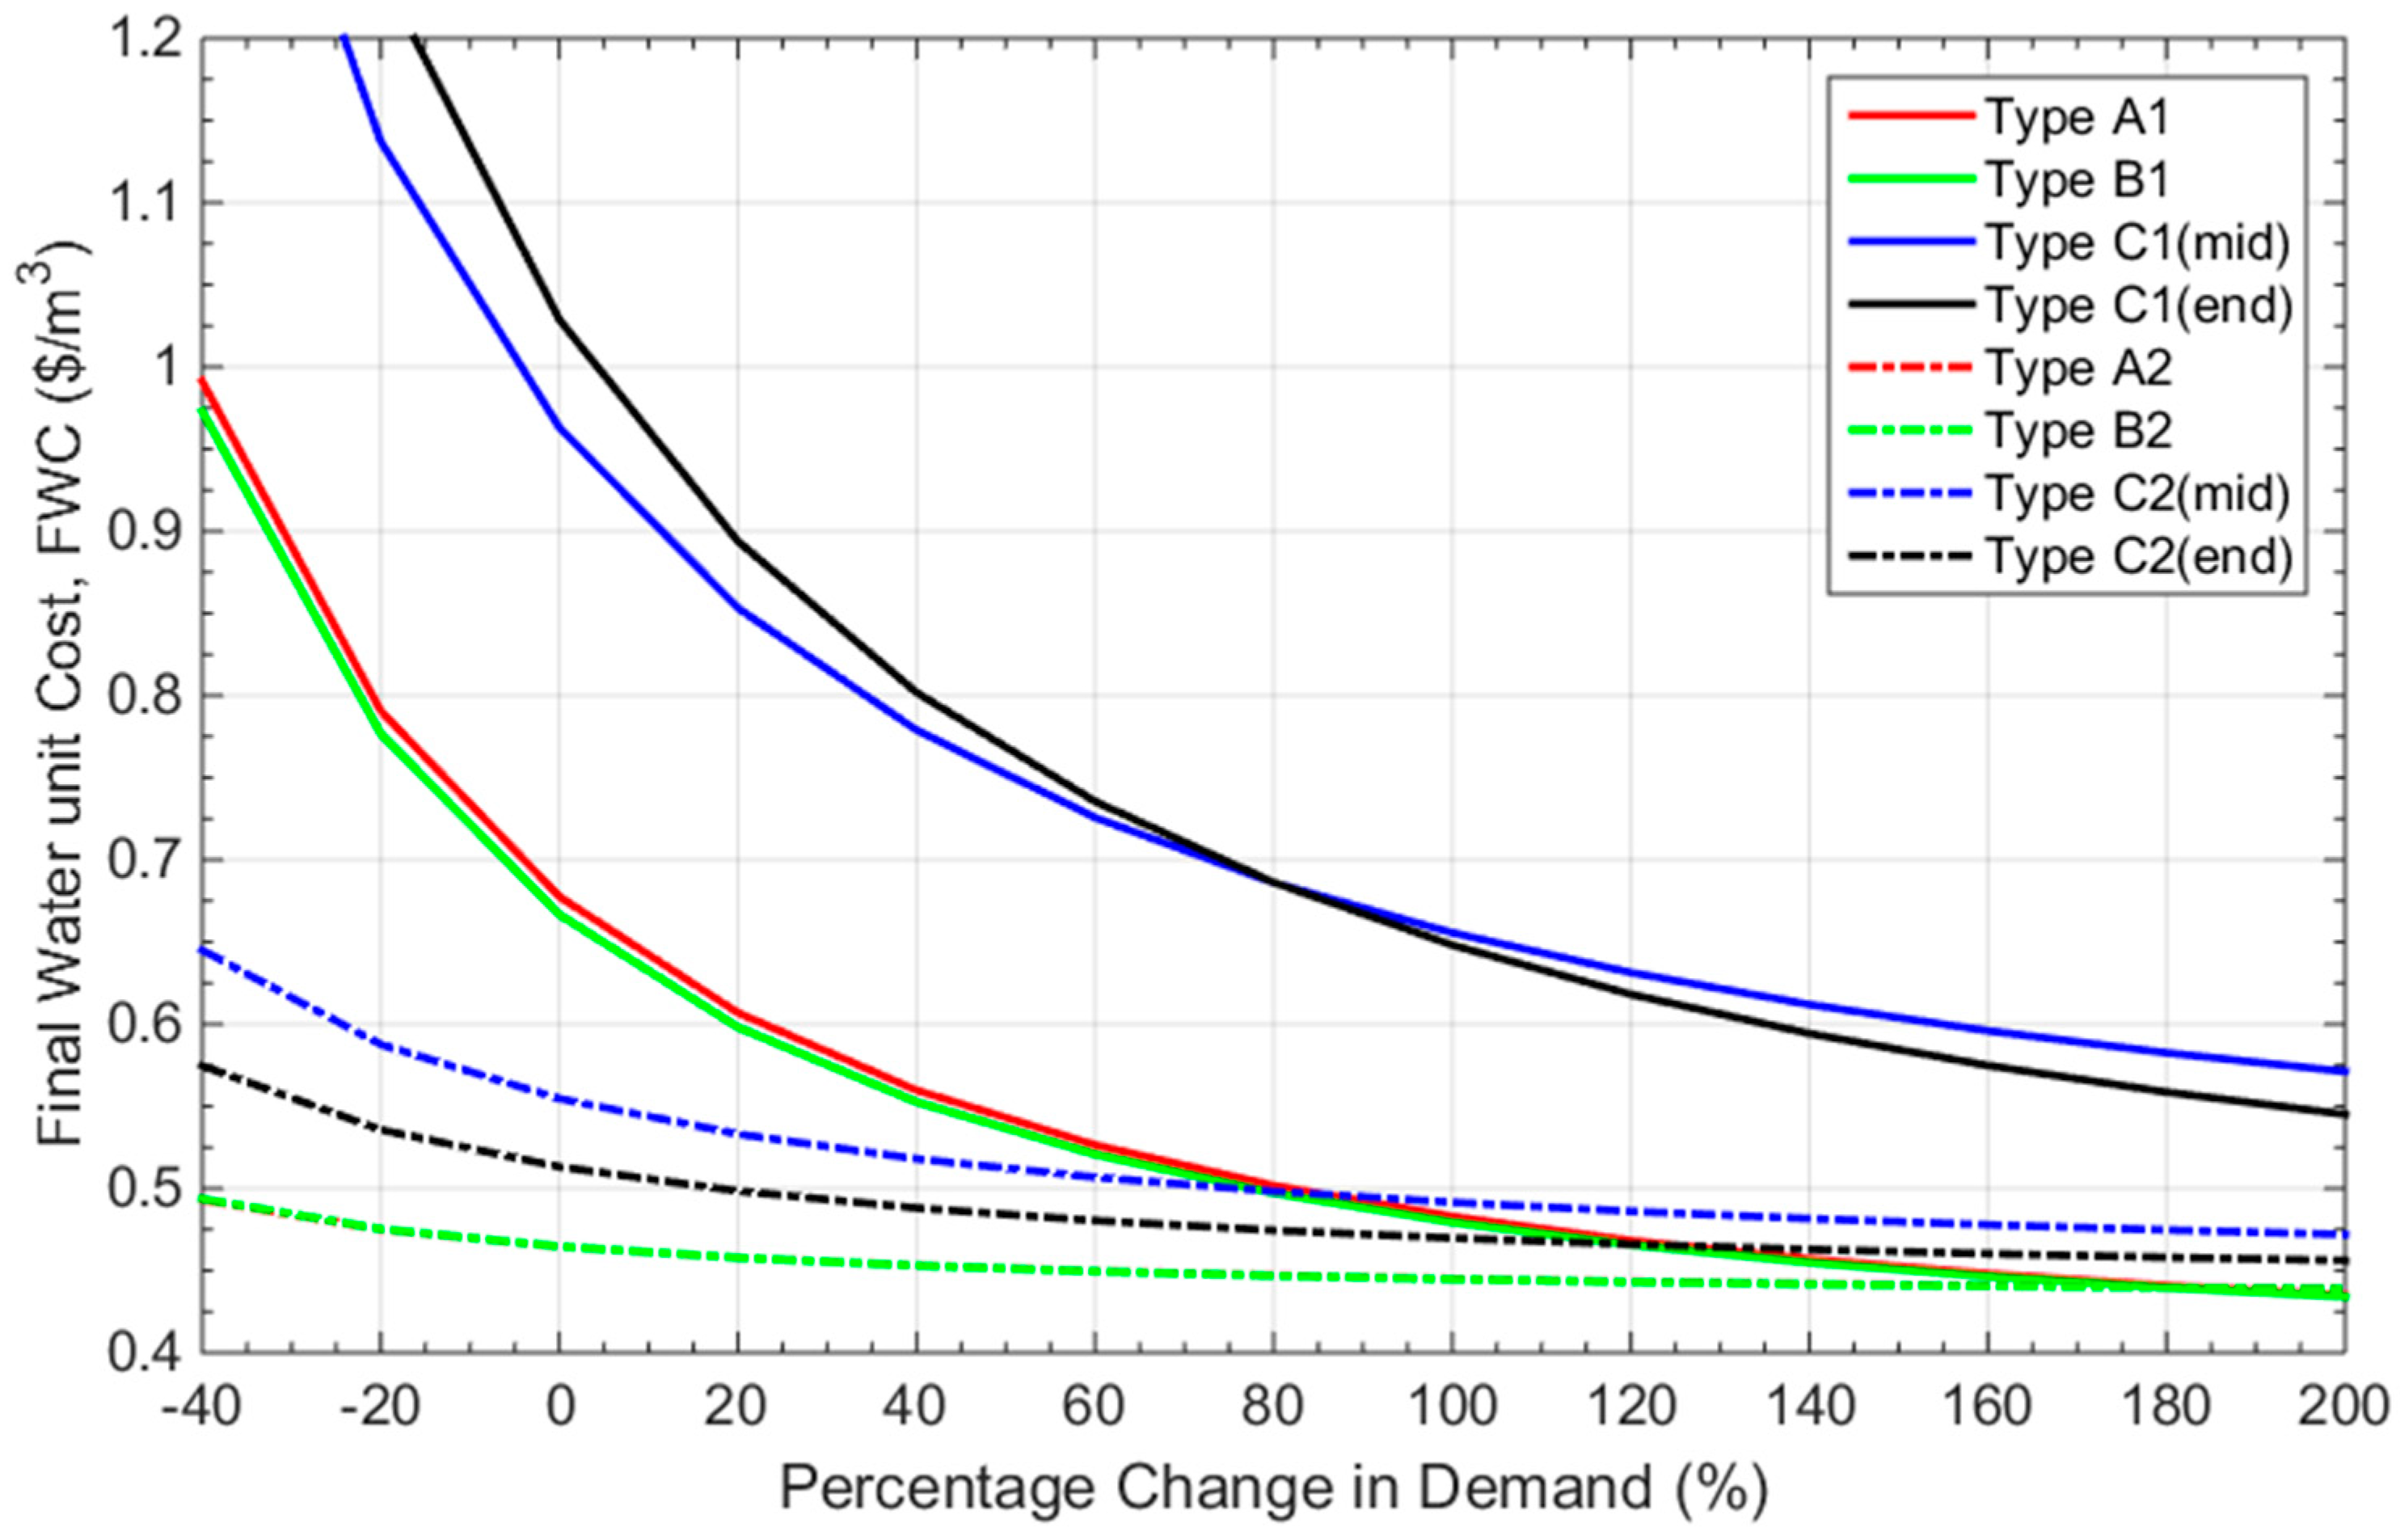
Figure 12, Figure 13 and Figure 14 show the effect of varying daily water demand (Dt), capital cost (CC), and water price () from the mains, on FWC. As can be seen from Figure 12, reducing water demand increases FWC, whilst increasing demand reduces FWC; with this behaviour being consistent across all house types. A similar result has been shown in [13]. This is indeed good news for households with high water demand, irrespective of whether it is due to acceptable reasons, such as larger than average occupancy, high level of gardening activities, and expansion of rainwater usage to other possible usage, such as for washing cars, etc., or due to less praiseworthy reasons, such as excessive water usage.
For toilet and laundry use only, type A and B houses have FWCs of less than current water price, , after a 180% and 200% increase, respectively, in water demand from our key assumptions, whilst for combined toilet, laundry, and garden use, both type A and B houses have FWCs of less than after 180% increase in demand. Both type C mid and end-terrace houses have FWCs that are higher than for the range of changes in water demand under consideration.
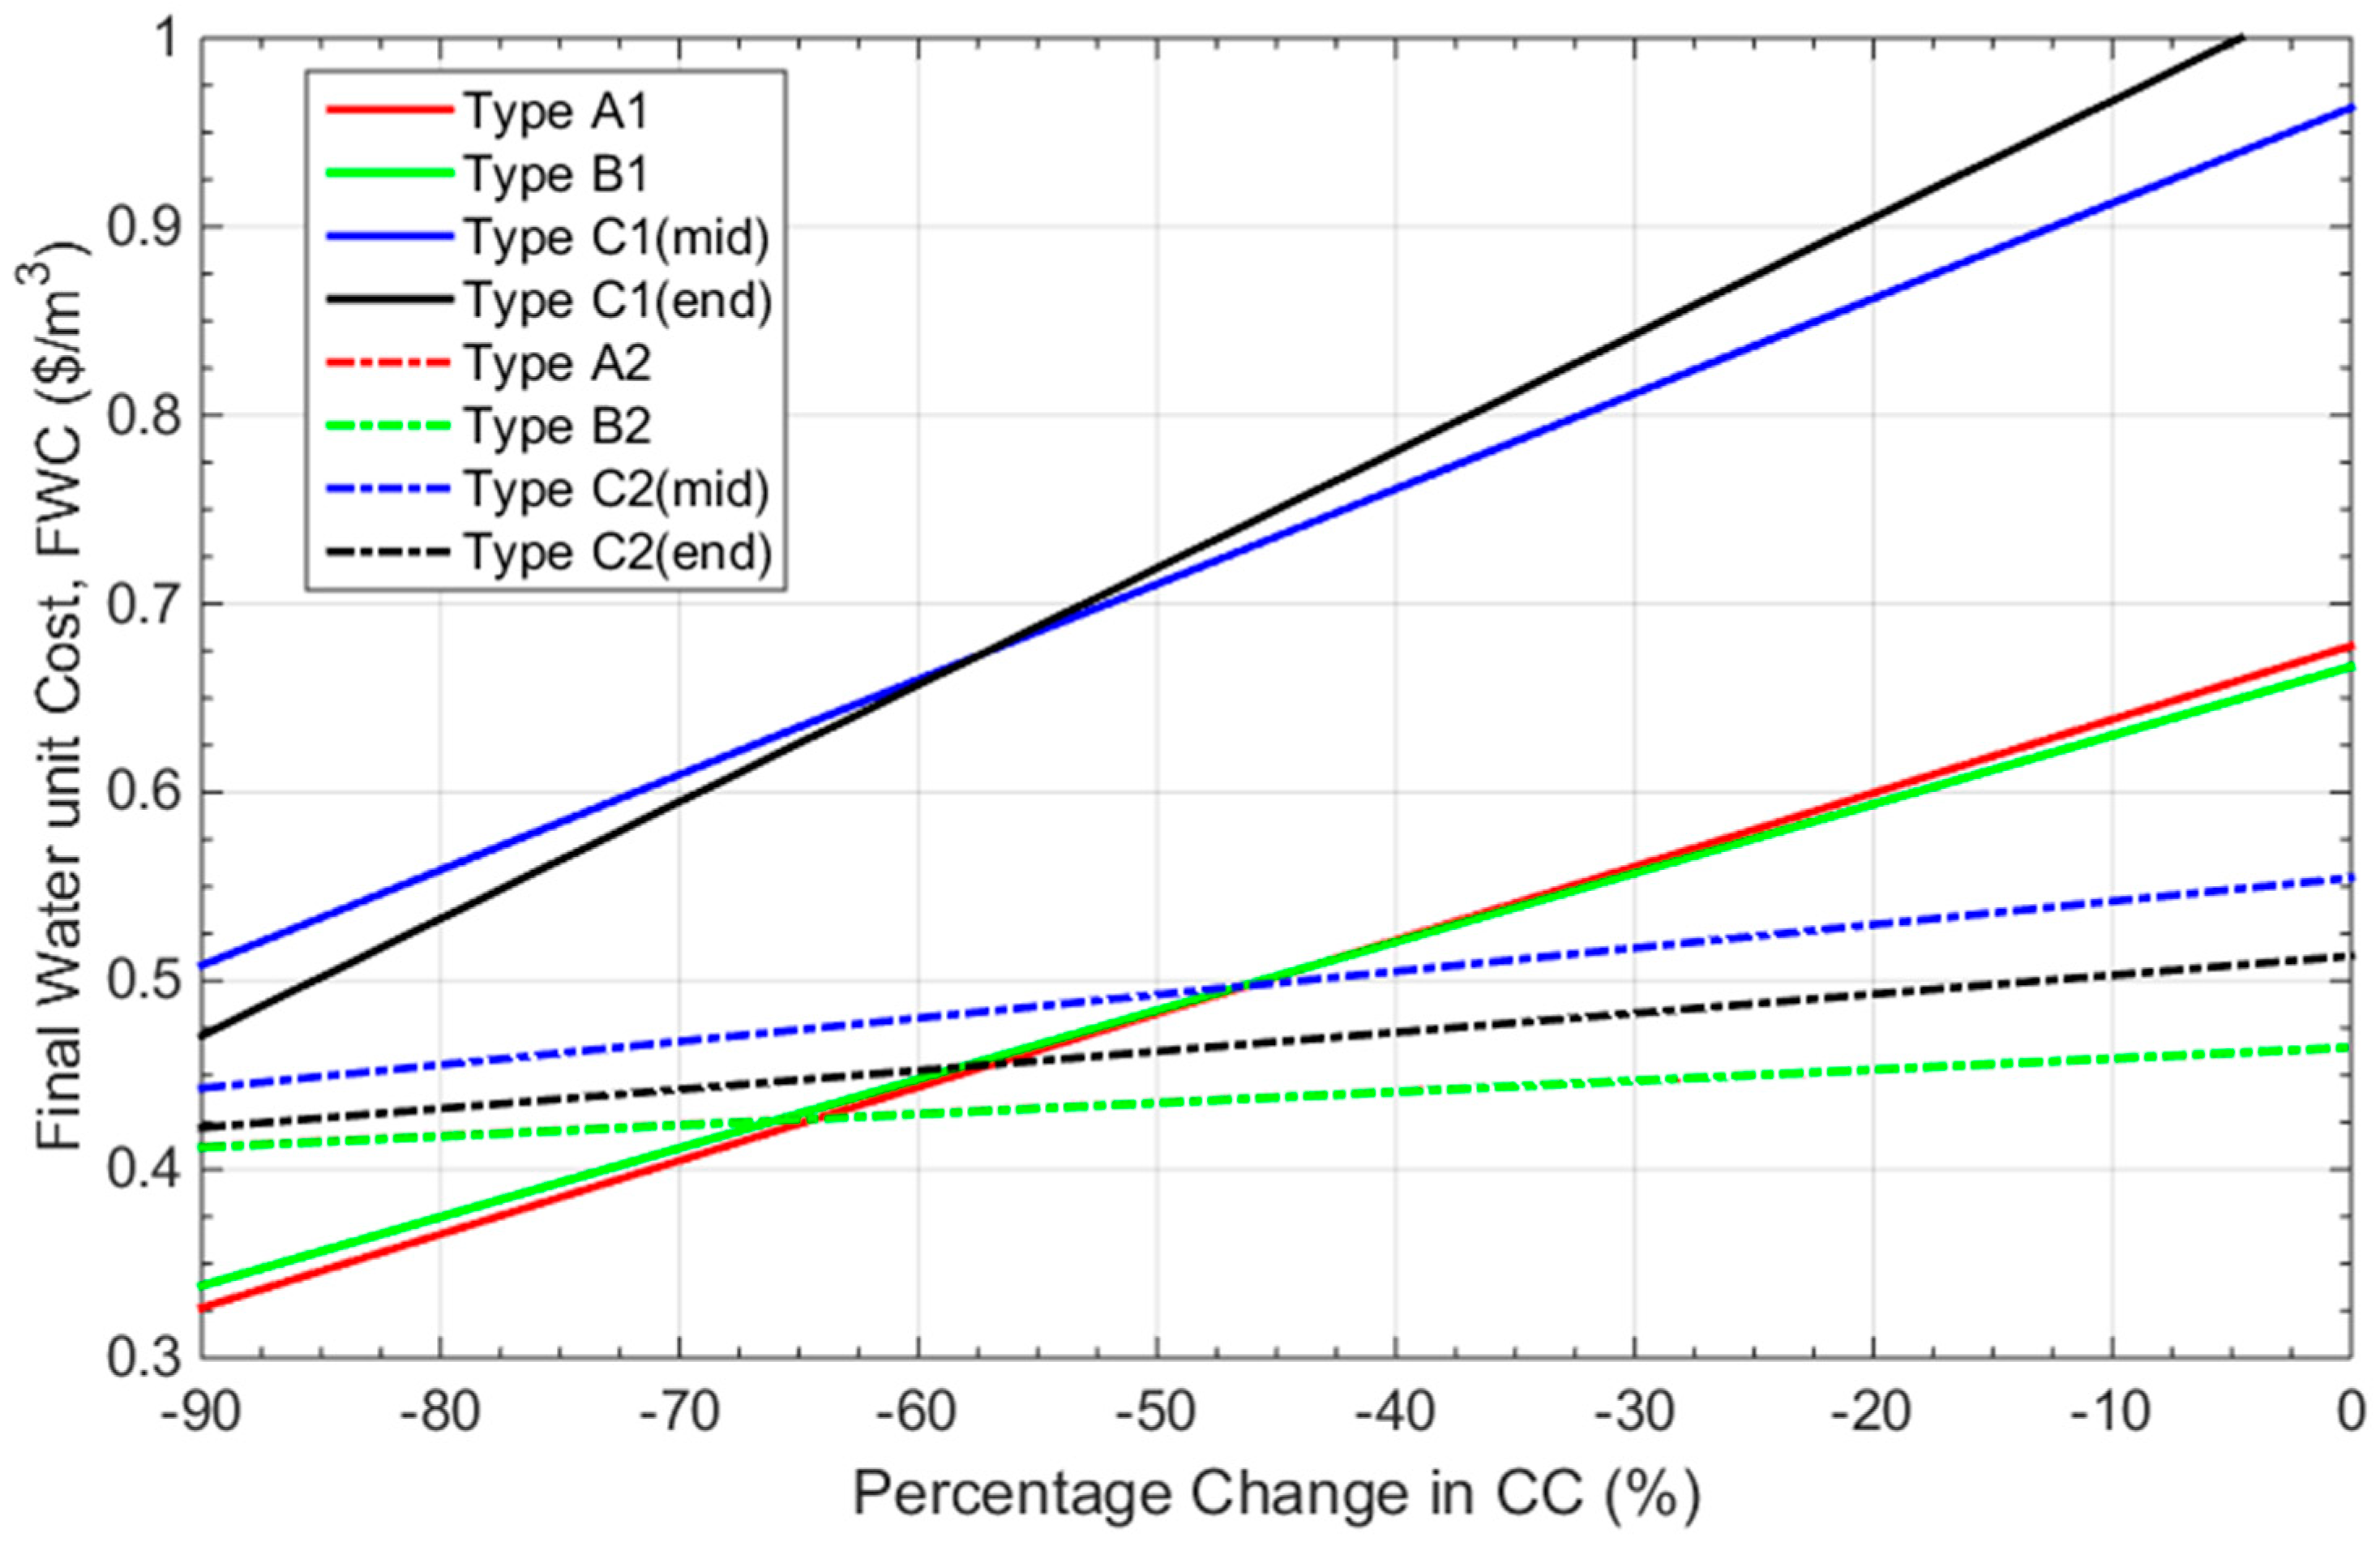
Figure 13 shows the effect of changing CC on FWC; with only reduction in CC considered as FWC values under current key assumptions are already more expensive than current water price from the mains. As expected, FWC decreases with a reduction in CC for all house types. For toilet and laundry use only, FWCs of less than $0.44/m3 are obtained for type A and B houses after 60% reduction in CCs. FWCs of both type C mid and end-terrace houses turn out in excess of $0.44/m3, even with a 90% reduction in CC. However, for combined toilet, laundry, and gardening use, type A, B, C mid, and end-terrace houses have FWCs of less than $0.44/m3 after approximately 40%, 40%, 90% and 70% reductions in CCs, respectively. It is interesting to note that, after approximately 65% reduction in CCs, FWCs of both type A and B houses with RWH system used for toilet and laundry only, turn out to be cheaper than FWCs of all house types with RWH system used for combined toilet, laundry, and garden use.
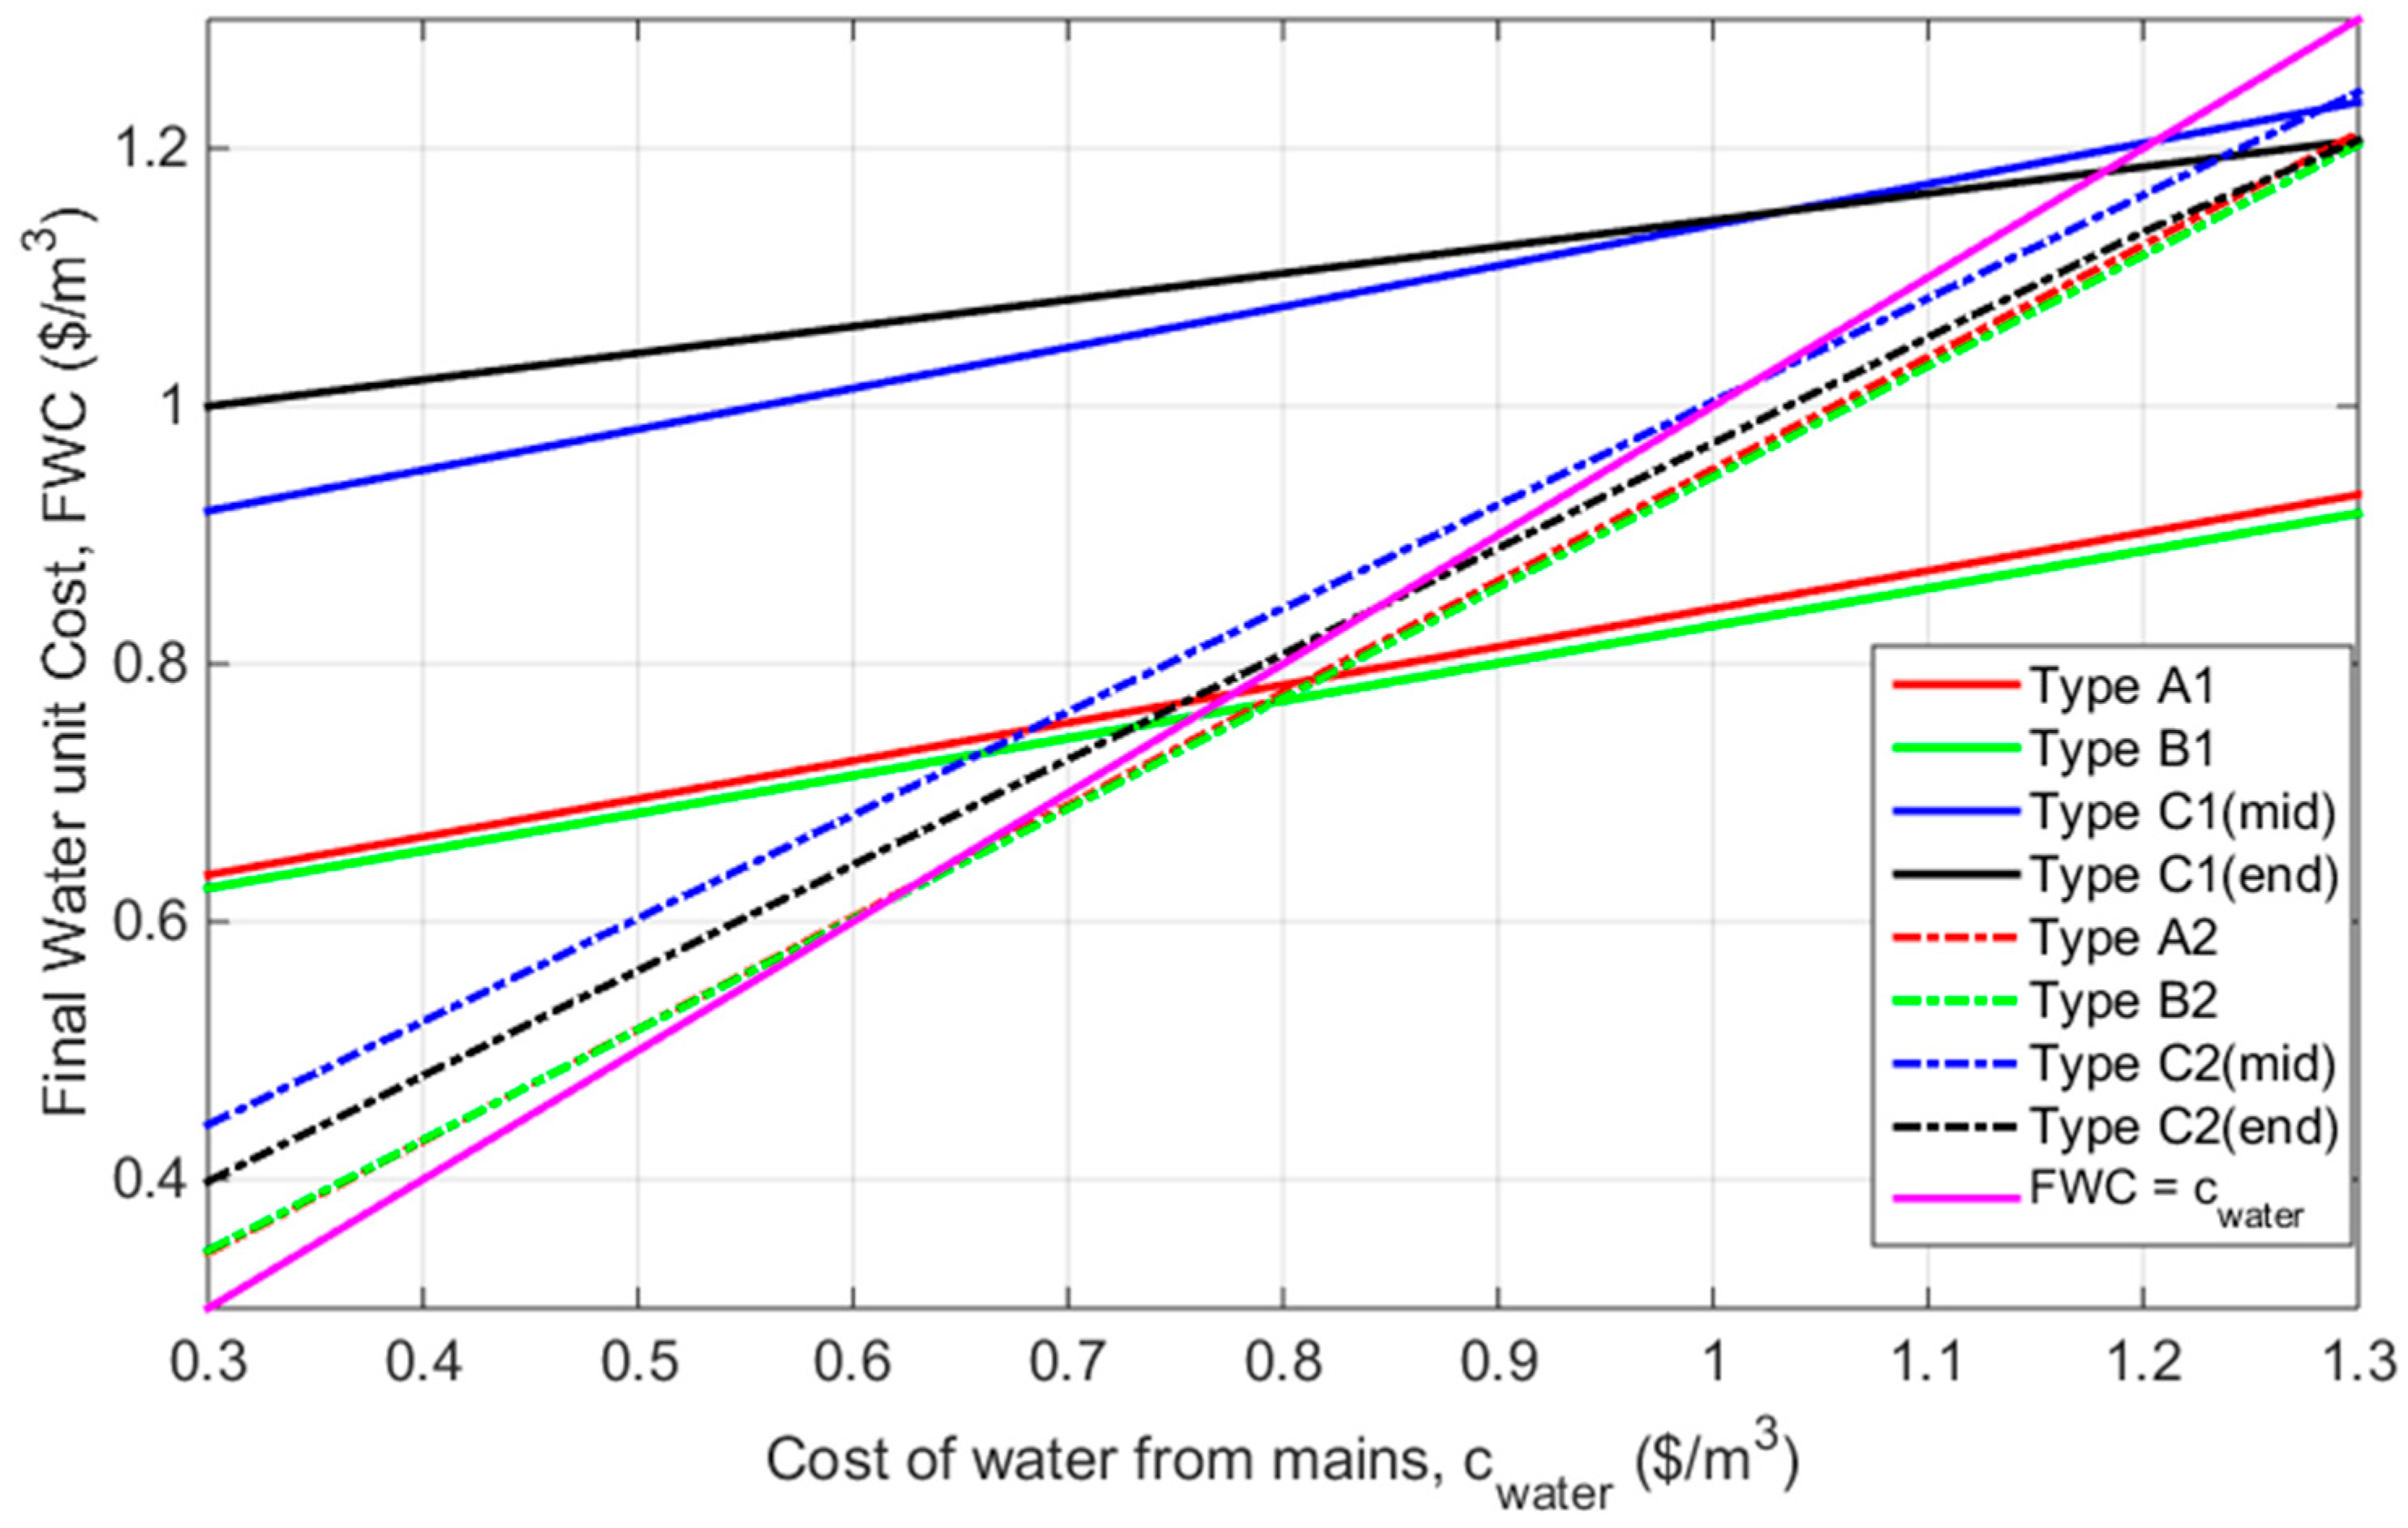
Sensitivity of FWC to changes in water price, is given in Figure 14 with line plotted; where the area under the line indicates that the implementation of RWH system would make FWC cheaper than solely relying on the mains. Generally, it can be seen that increasing increases FWC. However, the increase in FWC is slower than the increase in , making the RWH system more attractive. Conversely, reducing , decreases FWC, with a smaller decrease in FWC in comparison to making the RWH system less attractive. For toilet and laundry use only, needs to be increased to $0.76/m3, $0.75/m3, $1.22/m3, and $1.18/m3 for type A, B, C mid, and end-terrace houses, respectively, for the RWH system to be economically competitive than water from the mains. On the other hand, needs to be increased to $0. 65/m3, $0.65/m3, $1.00/m3, and $0.85/m3 for type A, B, C mid, and end-terrace houses, respectively, for combined toilet, laundry, and gardening use. These results clearly indicate that the current subsidised cost of water is a strong impediment on the development of RWH system in Brunei. It is interesting to highlight that, at the current cost of water in Singapore (Brunei’s neighbouring country) of $1.52/m3 [30], the implementation of the RWH system is feasible and economical, irrespective of house types and usage.
The results on sensitivity of both CC and are, indeed, very encouraging; as both of these parameters may, in part, be controlled by the government. The government may introduce a rebate scheme to encourage new installations. This effectively reduces CC and, consequently, stimulates the use of RWH system. Similarly, may be increased by removing part of subsidies on water and, even, slapping tax on water price and, hence, making RWH system more attractive. These control instruments may be utilised on its own or both. The initial cost of rebate scheme [18] is initially borne by the government; with a long term view of reducing water demand from the mains, whilst the removal of subsidy or imposing tax on water, directly affects the consumer through an increase in water price. In view of these, it is recommended that both the rebate scheme and price increase be utilised in a balanced way, so as not to overly burden both the consumers and government.
Table 5 shows that for rebate rate of 50% of CC and water price increased to double its current rate, , FWCs of the RWH system for all house types are cheaper than . These indicate that the RWH system may be feasible, with government intervention.
4. Conclusions
A mathematical model that may be used to simulate effectiveness of rainwater harvesting system, based on historical local rainfall data, with timescale that may be adapted according to rainfall data availability, has been proposed in this paper. Subsequently, local meteorological data and market prices were used to simulate the model and derive different measures, to determine the feasibility and economic-viability of RWH system in the country. Although local data were used, other countries may adopt methodologies to analyse the implementation of RWH system at their own localities. The performance of RWH system were examined for three types of houses: type A, B, and C houses, from common housing estates in Brunei, with two use cases being considered: toilet and laundry use only, and combined toilet, laundry, and garden use. System performance measures: reliability, water savings, percentage water savings, rainwater utilisation efficiency and utilisation of system, and financial performance measures: life cycle cost, final water unit price, and payback period, were determined.
For the RWH system under consideration, water savings and final water unit cost have been determined to be the two performance measures of primary importance. Generally, the RWH system for combined toilet, laundry, and garden use has been found to perform better in terms of amount of potential water saved as well as cost per unit volume, as compared to system for toilet and laundry use only. Tank size is important in designing the RWH system, where it has been shown that water savings generally increase with tank size, with an optimum tank size that minimises final water unit cost. When comparing between the different house types, it has been shown that type A house could potentially save the most amount of water, with potential savings of up to 147.9 m3 of water. Again, type A house also gives the lowest final water unit cost of using 3 m3 tank size, giving potential water savings of 222.5 m3. Life cycle cost has been determined to be $2944, with the majority of the cost being associated with initial capital cost. However, this lowest FWC is still more expensive than the current water price and, hence, not economically viable as of yet. Capital cost and water price have been identified as prohibiting factors.
Sensitivity analysis has also been performed. Currently, RWH system is more suitable for houses with higher than average water demand. Reduction in capital cost and increase in water price from the mains have also been shown to improve the economic viability of the RWH system. Although both capital cost and water price are normally market driven, it may be used by the government to promote the RWH system through rebate and via a reduction of water subsidy. Policymakers need to look at the current level of water subsidy and determines whether transferring parts of the subsidy into rebates on RWH system may save the government money in the long term. Indeed, transferring parts of the water subsidy into rebate is a double edge sword; reducing capital cost of RWH system, and hence making the RWH system more affordable, whilst at the same time increasing water price, and hence making RWH system more competitive over its alternative. This paper has shown that doubling the current water price to and providing rebate of around 45% of the capital cost are able to make RWH system market competitive in Brunei.
Author Contributions
Conceptualization, P.E.A.; methodology, P.E.A.; software, P.E.A.; validation, P.E.A.; formal analysis, P.E.A.; investigation, P.E.A.; resources, P.E.A.; data curation, P.E.A.; writing—original draft preparation, P.E.A.; writing—review and editing, P.E.A. and T.M.; visualization, P.E.A.; supervision, T.M.; project administration, P.E.A.; funding acquisition, P.E.A.
Funding
The work in this paper is made possible with funding from Faculty Research Grant of Universiti Brunei Darussalam.
Acknowledgments
The author would like to acknowledge the assistance of Brunei Darussalam Meteorological Services (BDMS), particularly, Hjh Saidah Hj. Mirasam and Harnina Morani, for their assistance and cooperation in sharing the rainfall data. The authors also would like to acknowledged the Centre for Advanced Modeling and Geospatial Information Systems (CAMGIS), UTS under Grants 321740.2232397.
Conflicts of Interest
The authors declare no conflict of interest. And the funders had no role in the design of the study; in the collection, analyses, or interpretation of data; in the writing of the manuscript, or in the decision to publish the results.
References
- Abas, A.E.P.; Mahlia, T.M.I. Development of energy labels based on consumer perspective: Room air conditioners as a case study in Brunei Darussalam. Energy Rep. 2018, 4, 671–681. [Google Scholar] [CrossRef]
- Mahlia, T.M.I.; Lim, J.Y.; Aditya, L.; Riayatsyah, T.M.I.; Pg Abas, A.E.; Nasruddin. Methodology for implementing power plant efficiency standards for power generation: Potential emission reduction. Clean Technol. Environ. Policy 2018, 20, 309–327. [Google Scholar] [CrossRef]
- Aditiya, H.B.; Mahlia, T.M.I.; Chong, W.T.; Nurc, H.; Sebayang, A.H. Second generation bioethanol production: A critical review. Renew. Sustain. Energy Rev. 2016, 66, 631–653. [Google Scholar] [CrossRef]
- Brennan, L.; Owende, P. Biofuels from microalgae—A review of technologies for production, processing, and extractions of biofuels and co-products. Renew. Sustain. Energy Rev. 2010, 14, 557–577. [Google Scholar] [CrossRef]
- Berbel, J.; Gutierrez-Marín, C.; Expósito, A. Impacts of irrigation efficiency improvement on water use, water consumption and response to water price at field level. Agric. Water Manag. 2018, 203, 423–429. [Google Scholar] [CrossRef]
- Evans, R.G.; Sadler, E.J. Methods and technologies to improve efficiency of water use. Water Resour. Res. 2008, 44. [Google Scholar] [CrossRef] [Green Version]
- Campisano, A.; Modica, C. Optimal sizing of storage tanks for domestic rainwater harvesting in Sicily. Resour. Conserv. Recycl. 2012, 63 (Suppl. C), 9–16. [Google Scholar] [CrossRef]
- Zhang, Y.; Grant, A.; Sharma, A.; Chen, D.; Chen, L. Alternative water resources for rural residential development in Western Australia. Water Resour. Manag. 2009, 24. [Google Scholar] [CrossRef]
- Ozcelik, M.; Sarp, G. Evaluation of sustainable water supply alternatives in karstified rock masses using GIS and AHP methodology for Antalya (Turkey) urban area. Environ. Earth Sci. 2018, 77. [Google Scholar] [CrossRef]
- Ahmad, A.; Othman, H.M. Electricity consumption in Brunei Darussalam: Challenges in energy conservation. Int. Energy J. 2014, 14, 155–166. [Google Scholar]
- Malik, A. Assessment of the potential of renewables for Brunei Darussalam. Renew. Sustain. Energy Rev. 2011, 15, 427–437. [Google Scholar] [CrossRef]
- Hasan, D.S.N.A.b.P.A.; Ratnayake, U.; Shams, S. Evaluation of rainfall and temperature trends in Brunei Darussalam. AIP Conf. Proc. 2016, 1705, 020034. [Google Scholar] [CrossRef]
- Dumit Gómez, Y.; Teixeira, L.G. Residential rainwater harvesting: Effects of incentive policies and water consumption over economic feasibility. Resour. Conserv. Recycl. 2017, 127 (Suppl. C), 56–67. [Google Scholar] [CrossRef]
- Lee, K.E.; Mokhtar, M.; Hanafiah, M.M.; Halim, A.A.; Badusah, J. Rainwater harvesting as an alternative water resource in Malaysia: Potential, policies and development. J. Clean. Prod. 2016, 126, 218–222. [Google Scholar] [CrossRef]
- Rahman, A. Recent advances in modelling and implementation of rainwater harvesting systems towards sustainable development. Water 2017, 9, 959. [Google Scholar] [CrossRef]
- Terêncio, D.P.S.; Fernandes, L.F.S.; Cortes, R.M.V.; Pacheco, F.A.L. Improved framework model to allocate optimal rainwater harvesting sites in small watersheds for agro-forestry uses. J. Hydrol. 2017, 550, 318–330. [Google Scholar] [CrossRef]
- Terêncio, D.P.S.; Sanches Fernandes, L.F.; Cortes, R.M.V.; Moura, J.P.; Pacheco, F.A.L. Rainwater harvesting in catchments for agro-forestry uses: A study focused on the balance between sustainability values and storage capacity. Sci. Total Environ. 2018, 613–614, 1079–1092. [Google Scholar] [CrossRef]
- Rahman, A.; Keane, J.; Imteaz, M.A. Rainwater harvesting in greater Sydney: Water savings, reliability and economic benefits. Resour. Conserv. Recycl. 2012, 61 (Suppl. C), 16–21. [Google Scholar] [CrossRef]
- Nguyen, D.C.; Han, M.Y. Proposal of simple and reasonable method for design of rainwater harvesting system from limited rainfall data. Resour. Conserv. Recycl. 2017, 126 (Suppl. C), 219–227. [Google Scholar] [CrossRef]
- Eroksuz, E.; Rahman, A. Rainwater tanks in multi-unit buildings: A case study for three Australian cities. Resour. Conserv. Recycl. 2010, 54, 1449–1452. [Google Scholar] [CrossRef]
- Su, M.-D.; Lin, C.-H.; Chang, L.-F.; Kang, J.-L.; Lin, M.-C. A probabilistic approach to rainwater harvesting systems design and evaluation. Resour. Conserv. Recycl. 2009, 53, 393–399. [Google Scholar] [CrossRef]
- Sanches Fernandes, L.F.; Terêncio, D.P.S.; Pacheco, F.A.L. Rainwater harvesting systems for low demanding applications. Sci. Total Environ. 2015, 529, 91–100. [Google Scholar] [CrossRef] [PubMed]
- Pelak, N.; Porporato, A. Sizing a rainwater harvesting cistern by minimizing costs. J. Hydrol. 2016, 541, 1340–1347. [Google Scholar] [CrossRef]
- Kim, K.; Yoo, C. Hydrological modeling and evaluation of rainwater harvesting facilities: Case study on several rainwater harvesting facilities in Korea. J. Hydrol. Eng. 2009, 14, 545–561. [Google Scholar] [CrossRef]
- Matos, C.; Teixeira, C.A.; Duarte, A.A.; Bentes, I. Domestic water uses: Characterization of daily cycles in the north region of Portugal. Sci. Total Environ. 2013, 458–460, 444–450. [Google Scholar] [CrossRef]
- Shabunko, V.; Lim, C.M.; Mathew, S. EnergyPlus models for the benchmarking of residential buildings in Brunei Darussalam. Energy Build. 2018, 169, 507–516. [Google Scholar] [CrossRef]
- Mun, J.S.; Han, M.Y. Design and operational parameters of a rooftop rainwater harvesting system: Definition, sensitivity and verification. J. Environ. Manag. 2012, 93, 147–153. [Google Scholar] [CrossRef]
- Homewaterworks. Indoor Water Use. Available online: https://www.home-water-works.org/indoor-use (accessed on 25 November 2018).
- Green Brunei. Rainwater Harvesting. Available online: https://green-brunei.com/rainwater-harvesting/ (accessed on 25 November 2018).
- Singapore’s National Water Agency. Water Price. 2018. Available online: https://www.pub.gov.sg/watersupply/waterprice (accessed on 25 November 2018).
Figure 1.
Rain water harvesting (RWH) model used.

Figure 2.
Typical houses considered: (a) type A—single-detached house, (b) type B—semi-detached house, and (c) type C—terrace house (mid and end-terrace) [26].
Figure 2.
Typical houses considered: (a) type A—single-detached house, (b) type B—semi-detached house, and (c) type C—terrace house (mid and end-terrace) [26].

Figure 3.
Daily rainfall data from 1979–2016, as per data from Brunei Darussalam Meteorological Department (BDMD).
Figure 3.
Daily rainfall data from 1979–2016, as per data from Brunei Darussalam Meteorological Department (BDMD).

Figure 4.
Reliability of the RWH system with different tank sizes for different house types.

Figure 5.
Water savings from using the RWH system, with different tank sizes for different house types.
Figure 5.
Water savings from using the RWH system, with different tank sizes for different house types.

Figure 6.
Percentage water saving from using the RWH system in proportion to demand, with different tank sizes for different house types.
Figure 6.
Percentage water saving from using the RWH system in proportion to demand, with different tank sizes for different house types.

Figure 7.
Rainwater utilisation efficiency (RUE) of RWH system, with different tank sizes for different house types.
Figure 7.
Rainwater utilisation efficiency (RUE) of RWH system, with different tank sizes for different house types.

Figure 8.
Utilisation of system (UoS) using different tank sizes for different house types.

Figure 9.
Life cycle cost of RWH system, with different tank sizes for different house types.

Figure 10.
Final water unit cost (FWC), with different tank sizes for different house types.

Figure 11.
Payback period (PP) of RWH System, using different tank sizes for different house types.

Figure 12.
Final water unit cost (FWC) against percentage change in water demand for different house types.
Figure 12.
Final water unit cost (FWC) against percentage change in water demand for different house types.

Figure 13.
Final water unit cost (FWC) against percentage change in capital cost (CC).

Figure 14.
Final water unit cost (FWC) against water price from the mains ().


Table 1.
Important information on types of houses considered.
| Descriptions | Type A | Type B | Type C (Mid) | Type C (End) |
|---|---|---|---|---|
| Shape | Rectangular | |||
| Size | 16.5 m, 8.9 m | 14 m, 8.9 m | 7 m, 9.6 m | 7 m, 9.6 m |
| Height | 6.2 m | |||
| Roof Area | 150 m2 | 125 m2 | 67.5 m2 | 67.5 m2 |
| Average Occupancy | 6.41 | 5.82 | 3.18 | 3.18 |
| Roof Type | Hip | Open-Gable | Open-Gable | Open-Gable |
| Roof Coefficient | 0.9 | |||
| Garden size | 2.5× roof area | 2.5× roof area | 1.5× roof area | 2.5× roof area |
Table 2.
Summary of economic data.
| Input Data | Data |
|---|---|
| Project Lifetime (N, Year) | 25 years |
| Interest Rate (r, %) | 5.5% |
| Gutter (B$/m) | $10.00/m–$11.50/m |
| Pipe (B$/m) | $3.50/m–$4.50/m |
| Tank (B$/m3) | $0.30/L–0.50/L |
| Water Pump per Horse Power (B$/HP) every 10 years | $400.00–700.00 |
| Water Tank Cleaning Service (B$) annually | $20.45 |
Table 3.
Summary of life cycle cost of RWH system.
| House Types | Descriptions | Capital Cost | Maintenance Cost | Total Cost |
|---|---|---|---|---|
| Type A | LCC (B$) | $1403–$3023 | $641 | $2044–$3664 |
| LCC (%) | (68.7%–82.5%) | (17.5%–31.5%) | (100%) | |
| Type B | LCC (B$) | $1165–$2785 | $641 | $1805–$3425 |
| LCC (%) | (64.5%–81.3%) | (18.7%–35.5%) | (100%) | |
| Type C (Mid-Terrace) | LCC (B$) | $838–$2458 | $641 | $1478–$3098 |
| LCC (%) | (56.7%–79.3%) | (20.7%–43.3%) | (100%) | |
| Type C (End-Terrace) | LCC (B$) | $1068–$2688 | $641 | $1709–$3329 |
| LCC (%) | (62.5%–80.8%) | (19.2%–37.5%) | (100%) |
Table 4.
Optimum tank size and final water unit cost.
| Descriptions | Opt. Tank Size (m3) | Water Savings (m3) | LCC ($) | FWC ($/m3) |
|---|---|---|---|---|
| Toilet and Laundry Usage only | ||||
| Type A | 0.75 m3 | 107.7 m3 | $2134 | $0.674/m3 |
| Type B | 0.75 m3 | 98.5 m3 | $1895 | $0.660/m3 |
| Type C (mid) | 0.5 m3 | 47.8 m3 | $1478 | $0.913/m3 |
| Type C (end) | 0.5 m3 | 56.0 m3 | $1709 | $0.983/m3 |
| Combined Toilet, Laundry and Gardening Usage | ||||
| Type A | 3 m3 | 222.5 m3 | $2944 | $0.458/m3 |
| Type B | 2 m3 | 171.0 m3 | $2345 | $0.460/m3 |
| Type C (mid) | 0.5 m3 | 52.2 m3 | $1478 | $0.550/m3 |
| Type C (end) | 1 m3 | 89.6 m3 | $1889 | $0.513/m3 |
Table 5.
Rebate amount and final water unit cost (FWC) with and 45% rebate rate, with tank volume.
| Descriptions | Water Savings (m3) | LCC ($) | Rebate ($) | FWC (($/m3) |
|---|---|---|---|---|
| Toilet and Laundry Usage only | ||||
| Type A | 114.5 m3 | $1512 | $712 | $0.632/m3 |
| Type B | 104.5 m3 | $1380 | $605 | $0.630/m3 |
| Type C (mid) | 55.0 m3 | $1200 | $458 | $0.875/m3 |
| Type C (end) | 63.9 m3 | $1327 | $562 | $0.841/m3 |
| Combined Toilet, Laundry and Gardening Usage | ||||
| Type A | 141.7 m3 | $1512 | $712 | $0.821/m3 |
| Type B | 129.3 m3 | $1380 | $605 | $0.816/m3 |
| Type C (mid) | 65.2 m3 | $1200 | $458 | $0.851/m3 |
| Type C (end) | 89.6 m3 | $1327 | $562 | $0.828/m3 |
© 2019 by the authors. Licensee MDPI, Basel, Switzerland. This article is an open access article distributed under the terms and conditions of the Creative Commons Attribution (CC BY) license (http://creativecommons.org/licenses/by/4.0/).
Share and Cite
MDPI and ACS Style
Abas, P.E.; Mahlia, T. Techno-Economic and Sensitivity Analysis of Rainwater Harvesting System as Alternative Water Source. Sustainability 2019, 11, 2365. https://doi.org/10.3390/su11082365
AMA Style
Abas PE, Mahlia T. Techno-Economic and Sensitivity Analysis of Rainwater Harvesting System as Alternative Water Source. Sustainability. 2019; 11(8):2365. https://doi.org/10.3390/su11082365
Chicago/Turabian StyleAbas, Pg Emeroylariffion, and TMI Mahlia. 2019. "Techno-Economic and Sensitivity Analysis of Rainwater Harvesting System as Alternative Water Source" Sustainability 11, no. 8: 2365. https://doi.org/10.3390/su11082365
Note that from the first issue of 2016, this journal uses article numbers instead of page numbers. See further details here.