Mapping Urban Resilience for Spatial Planning—A First Attempt to Measure the Vulnerability of the System


Interuniversity Department of Regional and Urban Studies and Planning, Responsible Risk Resilience Centre, Politecnico di Torino, 10125 Torino, Italy
*
Author to whom correspondence should be addressed.
Sustainability 2019, 11(8), 2331; https://doi.org/10.3390/su11082331
Submission received: 21 March 2019
/
Revised: 3 April 2019
/
Accepted: 11 April 2019
/
Published: 18 April 2019
(This article belongs to the Special Issue Bridging the Gap: The Measure of Urban Resilience)
Abstract
:The concept of ‘resilience’ breaks down silos by providing a ‘conceptual umbrella’ under which different disciplines come together to tackle complex problems with more holistic interventions. Acknowledging the complexity of Davoudi’s approach (2012) means to recognize that ‘spatial resilience’ is influenced by many phenomena that are difficult to measure: the adaptation and transformation of a co-evolutive system. This paper introduces a pioneering approach that is propaedeutic to the spatial measure of urban resilience assuming that it is possible to define a system as being intrinsically vulnerable to stress and shocks and minimally resilient, as described by Folke in 2006. In this sense, vulnerability is counterpoised to resilience, even if they act simultaneously: the first includes the exposure to a specific hazard, whereas the second emerges from the characteristics of a complex socio-ecological and technical system. Here we present a Geographic Information System-based vulnerability matrix performed in ESRI ArcGIS 10.6 environment as an output of the spatial interaction between sensitivities, shocks, and linear pressures of the urban system. The vulnerability is the first step of measuring the resilience of the system by a semi-quantitative approach. The spatial interaction of these measures is useful to define the interventions essential to designing and building the adaptation of the built environment by planning governance. Results demonstrate how mapping resilience aids the spatial planning decision-making processes, indicating where and what interventions are necessary to adapt and transform the system.
1. Introduction
If we look at the international scientific debate around the concept of resilience and its relation with urban planning, also considering some practical experiences, the term creates a “conceptual umbrella” that provides a flourishing perspective for urban planning with a slippery and ambiguous definition [1,2]. This is the limit but also the strength of this concept that represents a metaphor to develop spatial policies of mitigation, adaptation, and transformation to the turbulences of the system [3]. As to what concerns the most cited approaches on urban resilience, two concepts emerge as paradigmatic: the co-evolutive perspective [4] and the multidisciplinary integration of knowledge that is necessary to assess the vulnerable and resilient capacity of a system [5]. Both approaches share the common assumption that urban resilience is a driver capable of steering the policies and the urban agenda of institutions, organizations, and social groups [6,7] towards a multi-level governance of urban systems to a long-period perspective.
The evolutionary definition of resilience provided by Davoudi (2012) is the one that explicitly refers to a co-evolutive condition of a system, and a challenge for planning. Therefore, the dynamic non-equilibrium of a system is an opportunity to create knowledge and intelligence through learning capacity, robustness, adaptation, and transformation [8,9].
Particularly, the perspective of dynamic co-evolution is an approach derived from social sciences [10], which considers the resilience of a complex system as an evolutionary process of adaptation [11]. The implication of this definition in the urban planning agenda is that resilience becomes a normative concept for territorial systems and mainly refers to how a new approach to spatial development supporting the adaptation and transformation of the system could be traced. At the same time, spatial resilience implies that territorial systems continually self-organize and adapt in the face of ongoing and unpredicted changes [12].
In this view, a recent reflection on the theoretical development of a common background on the meaning of spatial resilience in planning has been deepened in the paper written by the Responsible Risk Resilience Centre (R3C) research group of Politecnico di Torino (the manuscript—in press—is entitled “Territorial Resilience: Toward a Proactive Meaning for Spatial Planning”). The work concludes that “territorial resilience” is an emerging concept that supports the decision-making process, identifying vulnerabilities while improving the development of urban transformations coupled with nature-based solutions [13].
It is agreed that urban resilience is characterized by a co-evolution, self-adaptiveness, and learning capacity; the question on how to operationalize the concept into urban planning procedures remains unsolved to the lack of empirical knowledge of how to measure the degree of resilience in a specific context [14,15].
This paper wants to move a step forward from these theoretical works in the operationalization of this concept, and particularly it works toward the application of a pioneering empirical model to measure the degree of vulnerability in a specific study. The assumption here is that measuring urban resilience is necessary in order to operationalize the concept into a more normative approach for urban planning that shifts from the pure descriptive/analytical assessment to the definition of a spatial support system that aids the definition of the transformation of the system in a long-term and co-evolutive manner. Main findings are referred to the capacity to construct a spatial and measurable knowledge of the vulnerable dimension of territorial systems to design land use plans that generate a resilient adaptation [16]. Results indicate that a composite assessment can indicate ‘where’ and ‘what’ kind of urban planning measures are suitable to reduce the vulnerability achieving the resilience of the system. Urban transformations range from ‘grey’ to ’green’ infrastructures, adopting an integrated view of nature-based and technological solutions [17,18] according to contemporary resilience frameworks [19].
2. Measuring Vulnerability as a First Step to Resilience
Urban resilience has been measured both quantitatively and qualitatively with a predominance of indicator-based measurements that constitute the most considerable part of the research framework [3,20,21,22].
Measurement is mainly grounded on pre-emptive assessment, with an integration of multi-risk analysis and the qualitative study of governance models [23,24]. This specific knowledge is constructed in a GIS environment that creates local datasets to deliver maps of climate and risk vulnerabilities accounting for social, environmental, and economic components of the system [24,25,26].
In attempting to understand the spatial distribution of vulnerability in a system, a set of indicators were chosen as a proxy of the different group of variables (e.g., environment, land use, economy, and society) [27]. We approached structuring the GIS project to map vulnerabilities, taking into account the numerous limitations of an indicator based on quantitative or semi-qualitative measurements of a resilient system:
- Oftentimes, resilience is measured as the counter position of vulnerabilities and therefore the indicator-based quantitative methods do not lend to capturing intangible elements such as the social capital, power relations, partnership, and self-sufficiency that contradistinguish urban resilience;
- even when vulnerability is measured with different methodologies, indicators of the state of the system are mixed up with an indicator of response (coping capacity), generating confusion and misleading interpretations;
- the neglecting of a more self-adapting and governance capacity of the system in a proper measurement approach, namely ‘resilience’, may lead to ignoring the most important determinants factors that can lower the vulnerability of a system;
- indicators are, in the vast majority of cases, non-spatial but purely statistical and therefore useful for a cross-comparative analysis of different urban areas but unhelpful to construct a spatial support system that steers the urban agenda of local institutions.
However, even with the abovementioned limitations, quantitative approaches offer a systematic and reliable way to measure the different dimensions of resilience. Therefore, the methodology hereafter synthesized is composed with some warnings in mind.
First of all, vulnerability and resilience should be measured with different approaches since vulnerability is the predisposition of exposed elements to being impacted by hazard events [27]. While resilience includes the governance of the system, including planning regulation at different levels and the decision-making framework [28,29]. Resilience also deals with education and early communication: a well-educated and informed population could react coping with the disaster risk while using and disseminating the knowledge of hazardous effects [30].
Currently, in a great number of studies, ‘vulnerability’ overlaps with ‘resilience’ where the ‘resilience’ refers to what is properly claimed to be the coping capacity. Such an approach creates confusion and misleading interpretations since the resilience is not an endogenous character of the system (like the coping capacity) and is instead a dynamic and co-evolutive character that depends on the post-disaster effects on socio-ecological and technological systems (SETS) [16]. On the other side, what in most resilience frameworks is properly called ‘vulnerability’, is the sum of a linear or nonlinear relation between sensitivity, exposure, and the coping capacity. Independently of which indicator is, or is not, present in a spatial evaluation of the vulnerable dimension of the system, what emerges is that vulnerability is the product of a systematic analysis of the state and pressures of the system, while the resilience is a condition that is influenced by the vulnerable dimension but it is not a part of it.
This is why vulnerability and resilience should be measured separately, taking into account that a resilient system is one where vulnerable elements are less present and the adaptive capacity is strongly acknowledged. Therefore, methodologies of measurement should consider this theoretical distinction. If vulnerability is much more prone to be measured with semi-quantitative indicators using spatial indexes, the measurement of resilience should account for a more qualitative and documental-based approach mixed up with a certain knowledge of the governance and barriers that make the system capable of adapting and transforming the territory in an effective manner.
Secondly, vulnerability has to be spatially measured including the sensitivity, where sensitivity is the predisposition of the system’s components to be affected by potential damages suffering harm as a consequence of endogenous conditions [15,31,32].
In this paper, a first attempt into the spatial measurement of vulnerability is presented using a GIS-based framework performed in ESRI ArcGIS 10.6 (Environmental System Research Institute, Redlands, CA, USA) environment as an output of the spatial interaction between sensitivities, shocks, and linear pressures of the urban system. The area of investigation is the Municipality of Moncalieri, Turin (Italy) that represents an optimal context for this study.
The spatial assessment of vulnerability is considered just the first step of measuring resilience of the system by a semi-quantitative approach. The spatial interaction of these measures is useful to define the interventions essential to building the adaptation of the built environment by planning procedures [1,19,33]. In the second chapter of this paper, the methodology of measurement is presented along with the kind of indicators used, while the Discussion and Conclusion sections present the significant findings and implication of this study.
3. Materials and Methods
The spatial assessment of vulnerability is the product of an interaction between sensitivities, disturbances, and shocks analyzed by three different components of the system (environment and ecosystem services; land use, infrastructures and heritage; economy and population). Indicators are mapped by the spatial representation of composite values by raster images with pixel values of sensitivities, disturbances and shocks (see the list of indicators in the Table 1).
The categorization of indicators into groups of ‘components’ follows what has been done by previously published works on territorial resilience. From its definition [34] to its practical implementation in planning [35] the measurement of the vulnerability of the system has been analyzed using different criteria. To our knowledge, indicators are grouped in ‘components’ when referring to the main categories of social, economic and environment [36], into ‘resources’ when referring to capacities to react of the system (connections, services, natural resources, physical assets, economic assets, environmental assets, human assets, and social assets) [37], whilst ‘dimension’ and ‘sub-dimensions’ refer to analytical criteria existing on the system (environmental, social and economic, and their sub-dimensions of dynamism, robustness, efficiency, transport, and urban design) [38]. Within this background, our choice was to develop a simple and easy-to-comprehend framework composed of at least three main components that cover the abovementioned fields. Therefore, we optimize these approaches using a pragmatic categorization that matches the most essential ‘dimension’ of SETS: social aspects including economy, technological aspects including the infrastructures and the built-up heritage, and the environmental ones including the ecosystem service provisioning of the system.
The work here conducted focuses on a single component of vulnerability that is environment and ecosystem services. This decision is the effect of a sharp selection of a specific component of the system that is the ones linked with the ecological and environmental characteristics of the selected urban area. The selection of the indicators has been the output of an accurate study of the two main operational references of resilience framework. The first is the “100 Resilient Cities” program of the Rockefeller Foundation that aims to measure urban resilience working across government departments; the second is the “Smart Mature Resilience” framework that directs all available resources toward well-defined goals to ensure city resilience development and planning. Both programs provide working reports and documents with the list of indicators used to measure the resilience of the system.
At this stage, since the interaction between the components of the system are not well defined, it was decided to develop a simple and understandable methodology that links together different spatial indicators. Moreover, since the interaction between different groups of indicators is not codified by a standard algorithm, the selection of a few indicators was necessary to reach a comprehension of the framework.
As early mentioned, indicators are grouped into three categories: sensitivity (state of the system), disturbances, and shocks (pressures in the system).
Sensitivities are constituted by the spatial distribution of indicators (index or absolute values) in each part of the territory that are randomly distributed and describe the actual condition of the environment and ecosystem services.
The pressures of the system (divided into disturbances and shocks) are constituted by the areas that are affected by external agents of the environment the determined its slow or sudden modification under linear circumstances (land take) or unpredicted events (shocks such as floods or fires) (see Figure 1).
The spatial assessment of vulnerability is a product of an unweighted overlay (ESRI ArcGIS) of sensitivities, disturbances, and shocks.
The presented indicators (Table 1) refers to the component of natural asset (environment and resources) [38] that includes ecosystem services monitoring, the quality of landscape, and ecological resources. Here, the most common and diffuse supporting and regulative services are mapped [39] (HQ, CS, WY) while a sharp selection of landscape ecology indicators is provided (IMP, IFI, SH). The selection includes the different threats to which these resources are affected by: NDR, SDR, and CDS for linear disturbances and IBO, ALU, and ALA to shocks. The selection of every single indicator follows the recent approach proposed by McPherson [40,41] which indicates the pathway to apply the ecosystem service mapping approach to design resilient cities. The selected indicators resulted in the available work conducted on ecosystem service mapping done by InVEST, and the available GIS vector material shared with the technical office of the municipality.
In the sections that follow the structure of each indicator is deepened.
Indicators are the output of three different kinds of elaborations:
- “R3C” elaborations, when indicators are autonomously created by the Research Group of the Responsible Risk Resilience Centre, Interuniversity Department of Regional and Urban Studies and Planning, Politecnico di Torino (This work is the first output of the project “Measuring Resilience” initiated in early 2018, which aims to develop an operational framework to address urban resilience. The R3C Project aims at design and operationalize an interdisciplinary research methodology to implement resilience in regional and urban systems. The project has been used to set up an in-depth discussion around the epistemological knowledge of resilience by different theoretical scientific approaches and their practical applications through the operational research carried out by urban and regional planners, social scientists, anthropologists, engineers, historicist and ecologists);
- “Existent” indicators, that are the ones that were applied to the context without any kind of elaboration (despite clipping the pixel value in the context of analysis);
- Indicators that are the output of other mapping software, and particularly Integrated Evaluation of Ecosystem Services and their trade-off—“InVEST, ver. 3.4.4” of the Natural Capital Project.
3.1. Context of the Study
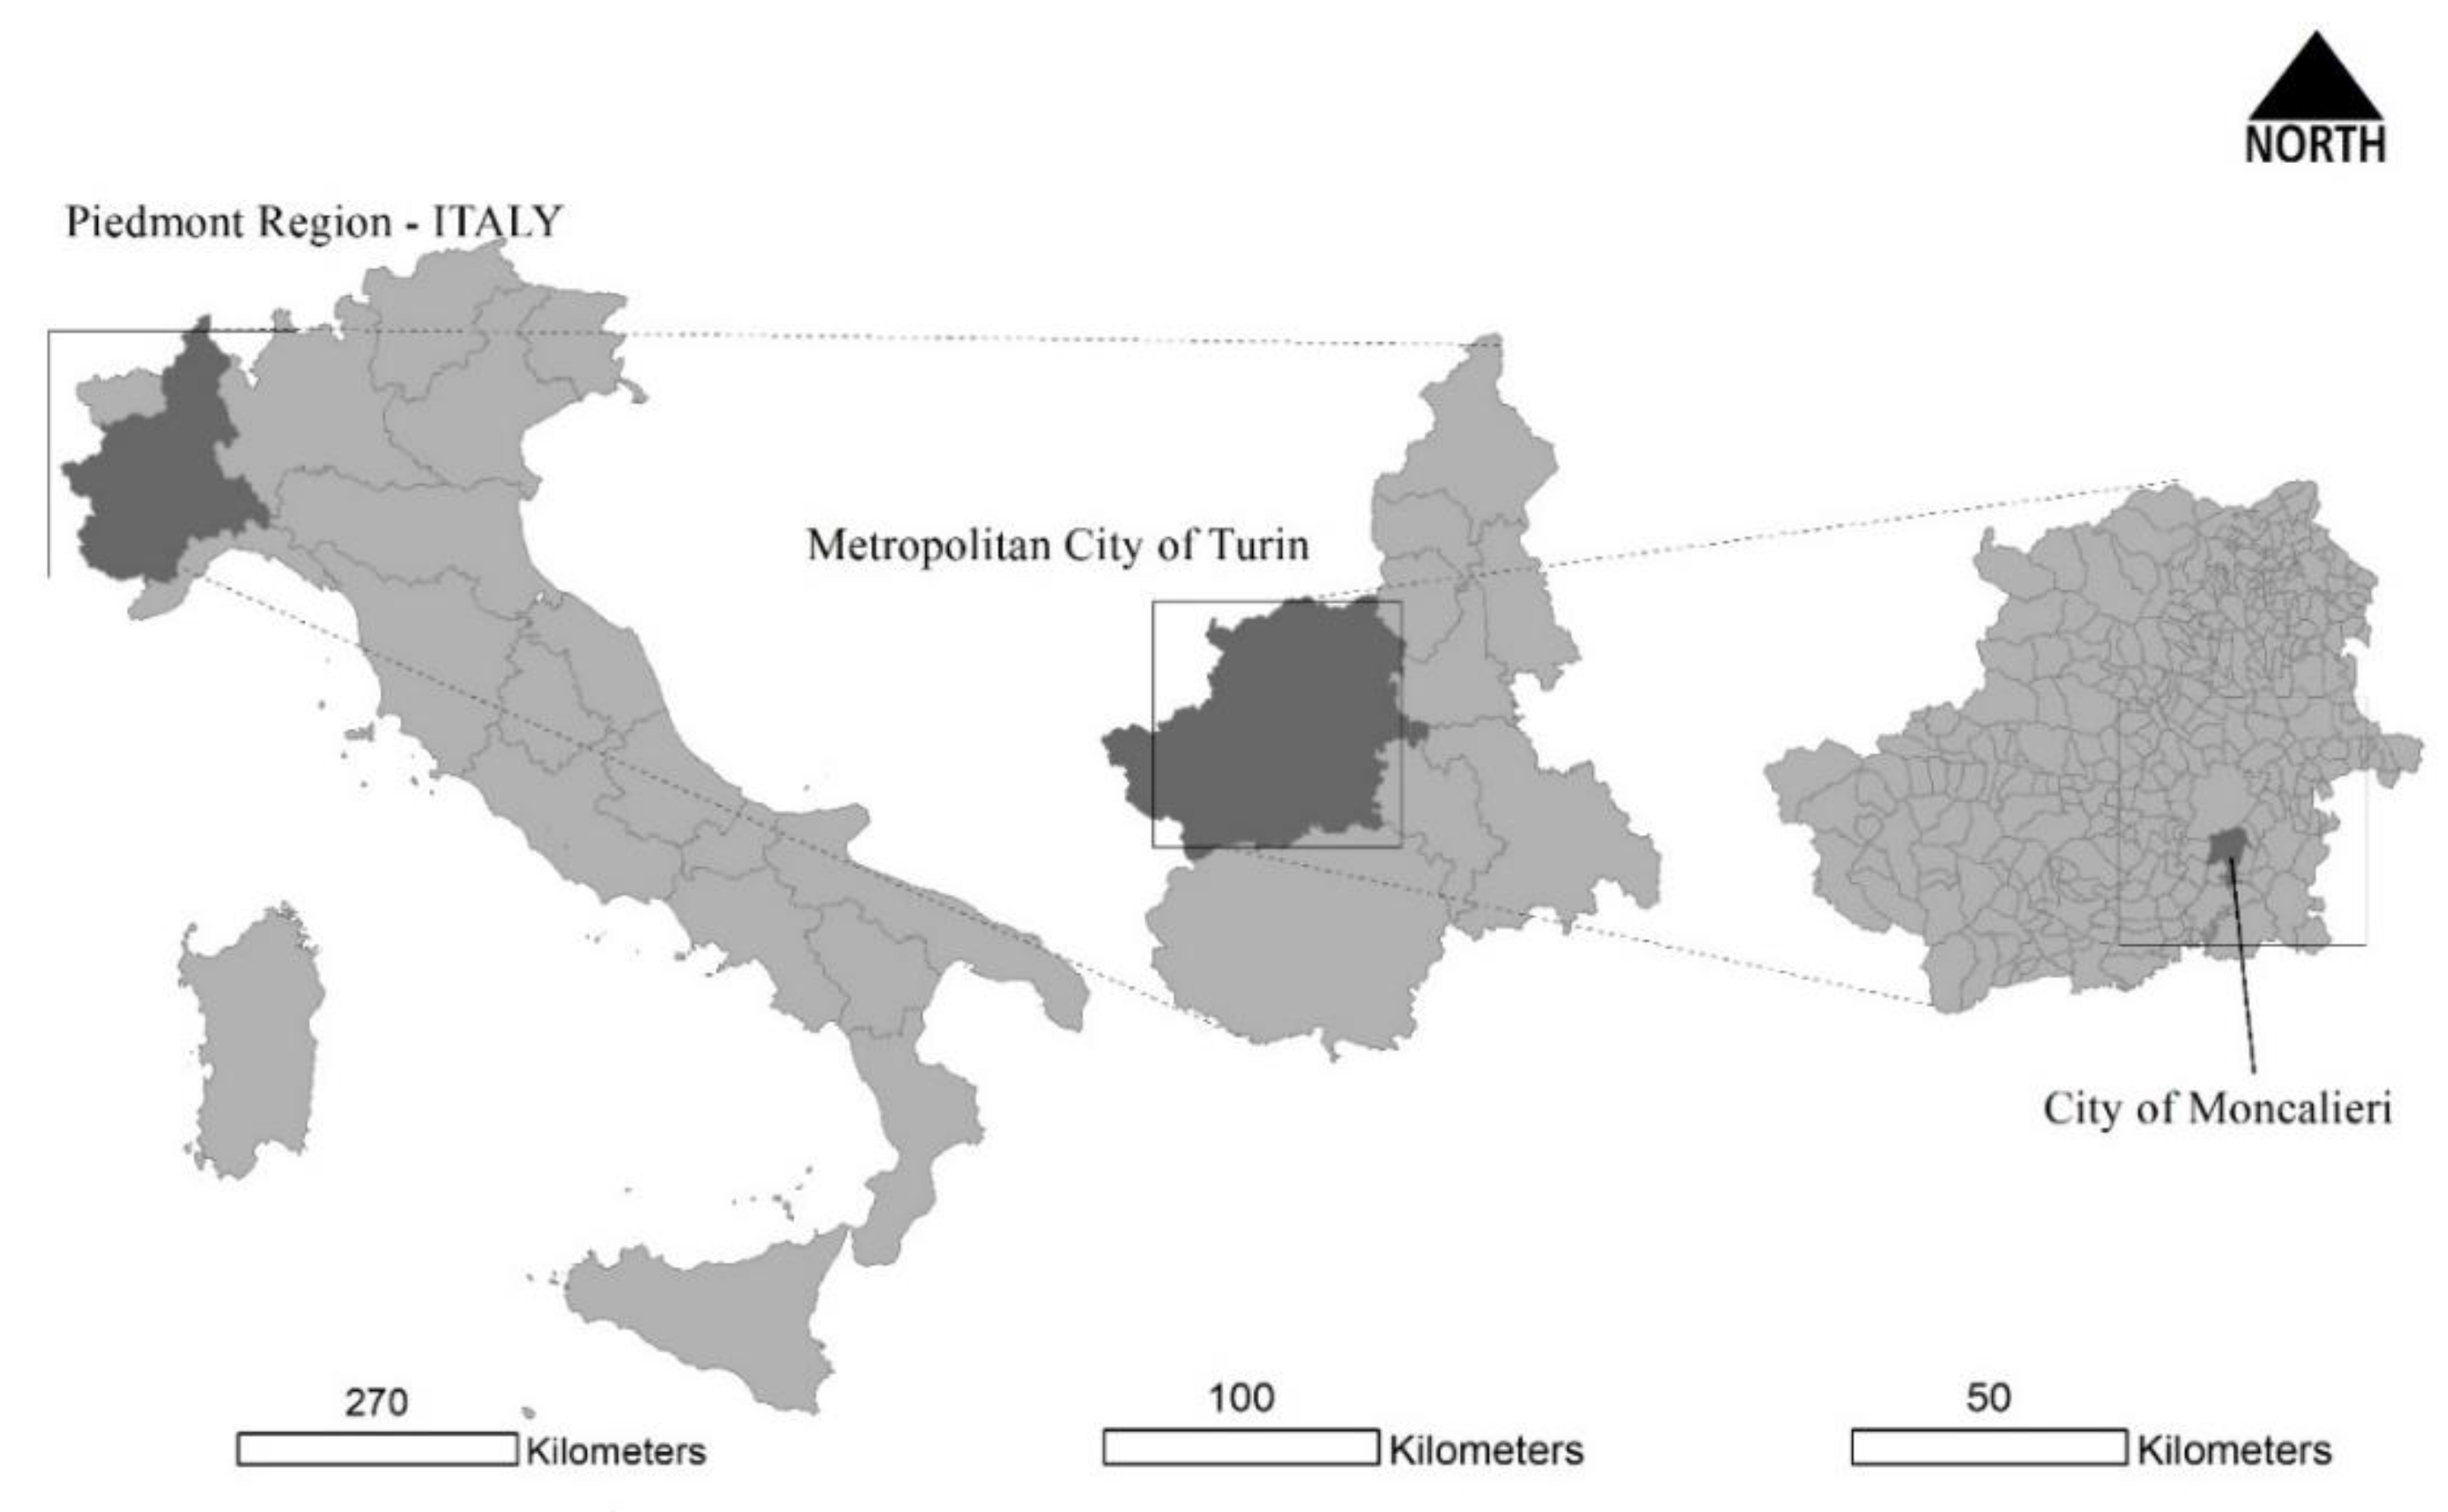
The City of Moncalieri, directly south from Turin, is part of the Metropolitan area of Turin (northwest Italy—See Figure 2). The municipality is located in the south-east axis that from the main town follows the Po river course along both the Turin-Piacenza-Brescia and Liguria directions, in line with Alessandria and Genoa. The town has a population of 57,234 inhabitants (ISTAT, 2017) and consists of about 6200 buildings (as pointed out by the BDTre Digital Topographical Database of Piedmont Region). The city has been chosen for two main reasons: the proximity respect to Turin (which is bordering Moncalieri in the north-west side) which has influenced the development of this district of the metropolitan area that is not an isolated and autonomous system but a dense conurbation of approximately 60 thousand inhabitants, and the topography of the city, which is composed by a heterogeneous hilly topography with particular flat part subject to flooding.
Moncalieri territory has a quite diverse orography and consists of a flat part that develops mainly in the southern and western sectors of the municipal boundaries, and of the Po river basin that from the City of Moncalieri enters in Turin along the Turin hill ridge [42]. The settlement system has developed transversely to the north–south axis of the river, approaching to the hill that contradistinguish the city of Turin. However, Moncalieri has also extensively expanded in the sloping northern part of the municipal territory, where settlements mainly distribute along the main streets that provide access to the Turin hill, also with high-density land uses [43]. This high accessibility and infrastructure level is precisely what determines Moncalieri peculiarity: the city is located at the entrance of the northern-Italian highway system and directly linked to the Turin beltway network. For this reason, the city has historically seen the development of large industrial areas, as the Vadò quarter, one of the largest in the metropolitan area. On the other hand, the Po River has historically represented a limit to the development of settlements. Thus, in summary, the geological, morphological, and hydrographic characteristics of Moncalieri make its municipal territory naturally susceptible to high levels of vulnerability.
The analysis on the macro categories of land use, according to the regional digital topographic database of 2018 (see Table 2), indicates that 34% of the territory consists of the anthropic system (including urban green spaces and urban free spaces), 39% comprises agricultural land, while the woodland occupies 14% of the territory. A remaining part of extra-urban green areas covers the 4% of the territory; the infrastructure system occupies the 6% while bodies of water represent the remaining 3%. The anthropic system, although not representing the majority of land uses, covers a significant ecological and landscape impact. The rate of impermeable soil, calculated with the spatial interpolation of data from the high-resolution database built up area imperviousness (2012), is about 26%, but the comparison with the anthropic system (permeability index of anthropic soil), shows that approximately 78% of urban land is impermeable. This percentage expresses a remarkable critical level considering that in the stock of 1638 hectares of urban land almost the 80% consists of impermeable material and therefore it is exposed to complete soil degradation, the consequent increase in hydrogeological risk and surface run-off, depletion of ecosystem functions, and an increase of heat islands. The current urban plan (approved in 1997 and upgraded with several variations until the 2016 final version) is an instrument that has almost finished its building capacity. As the document review shows, the urban plan still has few zones that need to be completed, either through direct interventions with built-up permissions, or through new built-up expansion zones to design with new masterplans.
3.2. Sensitivity
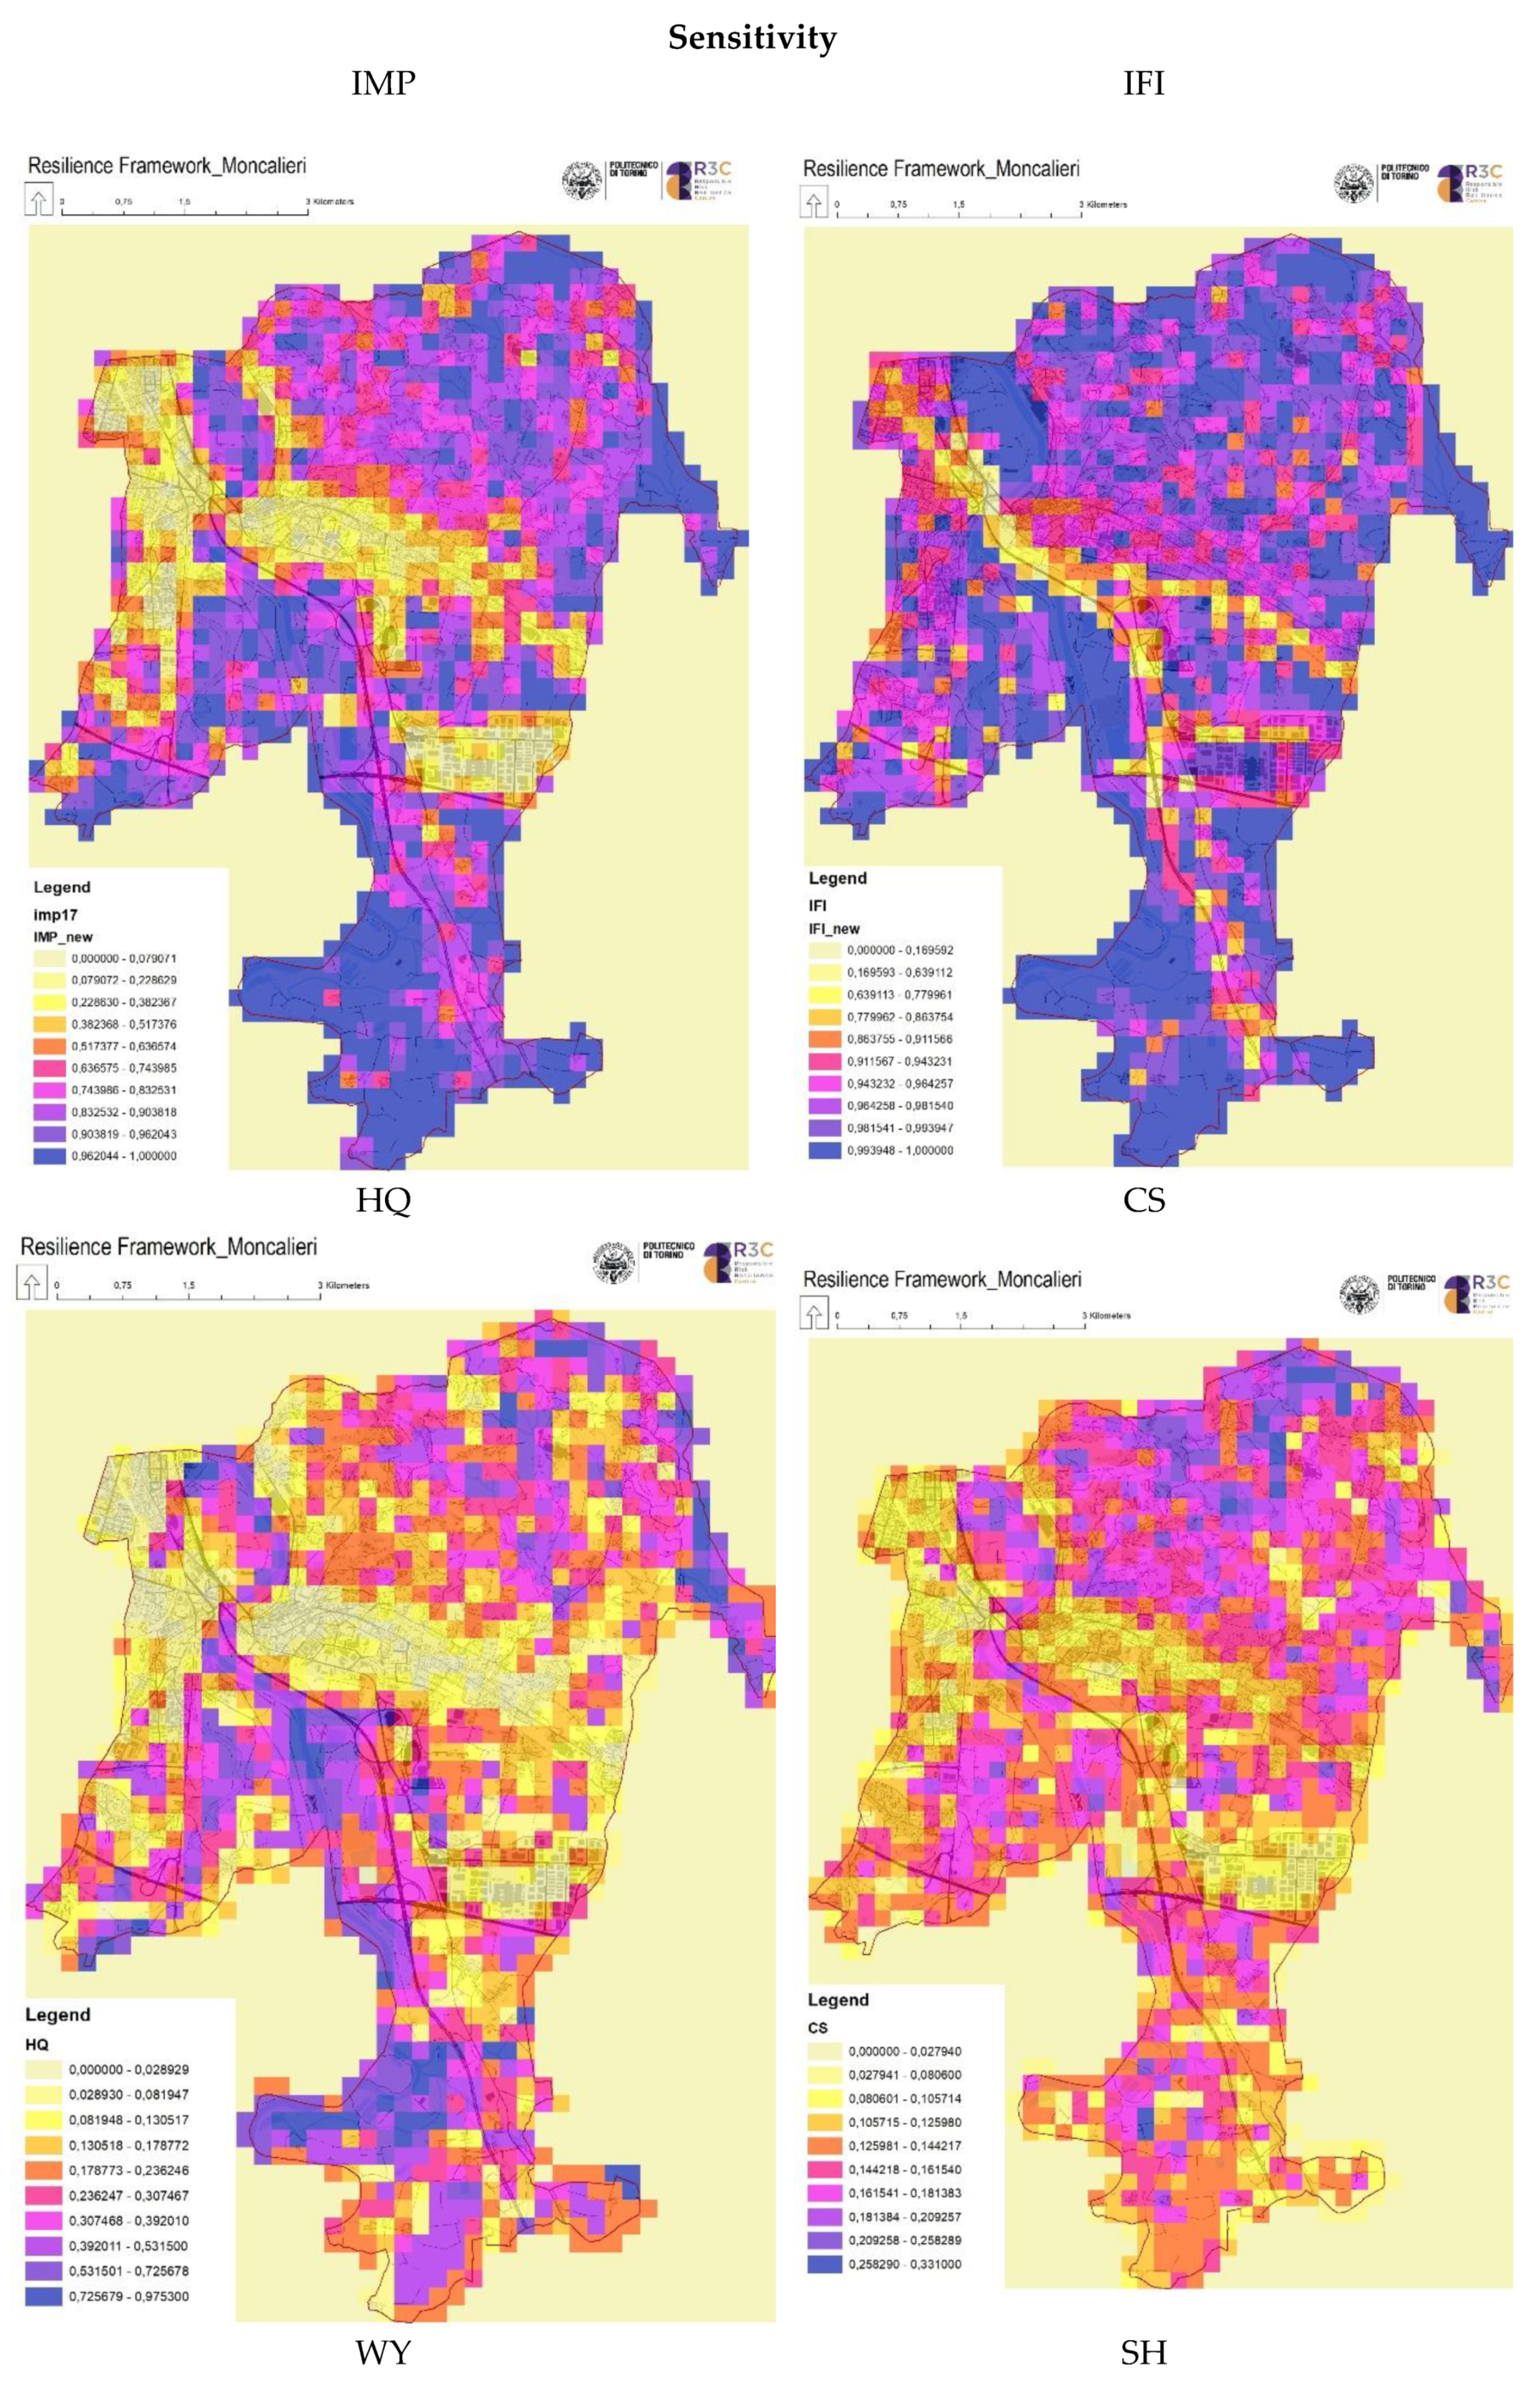
As introduced earlier, sensitivities are made up of indicators that range from the landscape ecology to ecosystem services. Notably, in this work, six different indicators were selected:
- three indicators refer to the landscape ecology approach on environmental planning (IMP, IFI, and SH);
- three indicators refer to ecosystem services dimension (HQ, CS, WY);
Sensitivity here is calculated as the predisposition of environment and ecosystem services to be sensible to events due to intrinsic conditions that lead the inclination to suffer if the available resource will be destroyed. Therefore, values increase where the environment presents a good quality (thus it can be damaged by disturbances and shocks) and its ecosystemic functions are well-provisioned, too (Figure 3).
3.3. Normalization of Variables
Each indicator has been normalized in values that range from 0 to 1 and distributed in a homogeneous spatial unit of a pixel (210 sqm) using the ArcGIS Create Fishnet (Data Management Tool) of the local digital topographic database. Each indicator has been homogenized statistically and stylistically harmonized with the same range of colors form low to a high value.
3.3.1. Environment (IMP, IFI, SH)
IMP—Impermeabilization, that is the permanent sealing of topsoil due by asphalt, concrete, and other non-permeable construction materials, is the most diffuse and degrading effect of the urbanization process [44,45]. The impermeable surface of an urban area does not correspond to its entire dimension since urban areas are not completely sealed, therefore some urban systems are more sustainable of others since the permeability of urban areas can be considered a good proxy for the environmental condition of a built-up system. For this indicator, it has been employed the national sealing map available at www.consumosuolo.isprambiente.it that is the result of Copernicus High-Resolution Layer-Imperviousness Degree (2012) data. The indicator distributes in a pixel area of 5 m the information of land cover, where pixels with 1 value indicates a sealed area, while pixels with 0 value indicates an unsealed area.
IFI—Ecological fragmentation is an important indicator of the healthy condition of the ecological system since the isolation and the creation of patches into the ecological mosaic is one of the prominent threats for the ecological processes that regulate the environment [46]. IFI has been conceived, assuming that there is a spatial well-detailed knowledge of the network system that cuts the landscape continuity interrupting or degrading the potential connectivity. The fragmentation caused by the road network can be weighted according to the magnitude of the road system, generating a spatial index that displays the effective fragmentation of the ecomosaic.
IFI has been calculated as follows
where
Li = length of the infrastructure).
Oi = coefficient of ecosystemic occlusion according to road ranking.
AU = surface unit (pixel surface 210 sqm).
The coefficient Oi has been set according with some national references in the field, giving higher weights to highways and motorways and lower values to local streets:
This coefficient allows to obtain the weighted occlusion of infrastructures.
O1 = 1 Highways, motorways, and railways
O2 = 0.7 national and regional streets
O3 = 0.5 urban streets
O4 = 0.3 local streets
This indicator has been autonomously created by the research group distributing the IFI value in the minimum spatial unit of a pixel and using the two layers 001156_el_str_2016, 001156_el_fer_2016 of the local digital topographic database.
SH—The landscape diversity index reflects how many different kinds of land uses there are in a minimum detected unit (pixel of 220 sqm), providing a distribution of the different components of the landscape where higher values reflect a richer heterogeneity of landscape patches in the observed unit [47,48]. This indicator is heavily used in landscape ecology to assess the species diversity or the ecological diversity in a specific area of investigation. It reflects how the landscape is composed of different patches that correspond to the land use polygons. The assumption here is that a mixed composition of the land uses that includes also anthropic areas helps to increase the quality of the landscape in general.
Land uses where analyzed using the Land Cover Piemonte of 2010, and the pixel calculation of the index has been done using the ArcGiS dissolve function (coverage tool).
3.3.2. Ecosystem Services (HQ, CS, WY)
HQ—The map of habitat quality has been employed as a proxy of biodiversity since high quality of habitats supports the development of all ecological functions [50].
The supporting ES of habitat quality has been produced using InVEST software. Habitat quality combines information on LULC and threats to generate maps that includes the degradations due to sources of habitat disturbances.
The model works assuming three input data:
- the spatial representation of the Land Use Land Cover distribution, that is a GIS raster map which includes the area of analysis, as well as a buffer zone that include potential threats;
- the spatial distribution of intensity of each individual threat in a GIS raster file with values between 0 and 1;
- a .csv table with threats data. This table contains all threats considered in the landscape weighting their impact;
- a .csv table of the sensitivity of LULC to threats. This table contains the specific sensitivity of each habitat to the considered threats.
Concerning the threats, they have been considered as a source of disturbance to the anthropic system, agricultural areas and road network, with a weighting factor for different kinds of streets: principal, secondary, and local.
The output of this model is a relative index (0–1) of the habitat quality in each LULC pixel. This model has been then transformed into a sensitivity map where higher sensitivities correspond to the area where habitat quality is higher and therefore most vulnerable to potential damages.
CS—The carbon sequestration is an ES related to the capacity of the soil of storing in the biomass and dead mass above and below ground to store CO2. Ones that soil is sealed it lost its capacity to store the atmospheric carbon and therefore the storing capacity of soil influences the quantity of carbon that is present in the atmosphere. This ES has been mapped to model carbon storage and sequestration of InVEST that maps carbon storage densities to a different kind of LULC. The model maps the quantity of carbon sequestration that are produced by a csv. table of the four carbon pools: above ground, below ground, necromass, and the litter. Input data were based on the Italian National Inventory of Forests and Carbon Pools (INFC).
The output is a map where each LULC pixel contains the absolute amount of carbon stored per pixel.
WY—The water yield is an ES that refers to the water storing capacity depending on the structure and the physical structure of the ground and the aboveground vegetation. Changes of land use profoundly affect hydrological cycles affecting the evapotranspiration that is a primary function that modifies the water availability and microclimate conditions.
Moreover, the water yield is of primary importance for run-off regulation since this ES influences the capacity of the landscape to retain water from the surface, subsurface, and baseflow, determining the amount of pixel’s run-off calculated as the precipitation less the fraction of the evapontranspired water.
Inputs of this model are:
- Root restricting layer depth: the land capability classification took soil depth data with a scale of representation of 150,000.
- Precipitation: data were collected from the regional department for environmental protection (ARPA Piemonte. http://www.arpa.piemonte.it/rischinaturali/tematismi/clima/confronti-storici/precipitazioni/introduzione.html)
- Plant available water content: data comes from the SPAW Model for Agricultural Field and Pond Hydrologic Simulation. To obtain the specific data required by the SPAW Model the original land capability map was integrated with additional soil texture information provided by The Regional Institute for Plant and Environment (IPLA) at a reference scale of 1:250,000.
- Average annual reference evapotranspiration: values for each watershed were collected from the regional department for the environmental protection (watershed boundary dataset) http://www.scia.isprambiente.it/Documentazione/report2006.pdf Watersheds:
- The biophysical values in the attributes table were taken from references collected in the InVEST user’s guide and supervised by the National Institute for Environmental research and Protection—ISPRA.
The output used in this model is the annual average evapotranspiration per pixel in the landscape.
3.4. Pressures on the System: Disturbances
Disturbances are linear and predictable trends that affects the system gradually altering its condition. Therefore, are areas of the system that are affected by slow modification due to particular processes that affect sensitivities (Figure 4). As to what concerns the component of Environment and Ecosystem Services, the selected disturbances are composed by three indicators:
- Two indicators depend on soil ES: nutrient contamination—NDR that is an output of the model nutrient retention of InVEST; and the Erosion—SDR, that is an output of the model sediment retention of InVEST;
- One indicator refers to the landscape transformation due by the process of urbanization: the land take indicator—CDS represents the areas where the process of urbanization has been concentrated in the last years.
NDR—the nutrient retention model of InVEST calculates the areas where diffuse pollutants flow into streams. The model routes the nutrients path along the environment. Mapping nutrient retention make clear the effects of anthropic activities on water quality [51].
Concerning inputs, this model shares the vast majority of inputs with the nutrient delivery model, plus the following:
- Average annual precipitation was calculated using the regional climate report of ARPA;
- Digital elevation model (DEM) is a raster file provided by Regione Piemonte by aerophoto Ice 2009–2011. The DTM covers the entire regional territory and it has a 25 sqm grid resolution.
SDR—Sediment retention model works towards the interaction of the digital elevation model and the soil characteristics computing the amount of the annual soil loss in each pixel, therefore calculating the soil loss that reaches the stream. This ES is pivotal since its account for one of the most dangerous and pervasive kinds of degradations that affect soils at different scales. This model has been used to map one of the most influent systemic pressures on the system since Moncalieri is partially built-up in the Turin Hill and has experienced in the last years some debris flows events due to intense rainfalls.
This model shares the vast majority of inputs with the nutrient delivery model. The rainfall erosivity index (R) indexes in the attributes table of the software were calculated using the biophysical values computed using the references parameters collected in the InVEST user’s guide [50] and supervised by the National Institute for Environmental research and Protection—ISPRA.
CDS—The land take indicator indicates the amount of new impermeable surfaces due to new urban areas [52,53]. This phenomenon is associated to the loss of the non-renewable resource of soil that is caused by the substitution of agricultural and natural/seminatural land to artificial land. This process generates ne expansion areas in the landscape degrading the landscape and generating several environmental consequences [54,55,56].
The indicator has been autonomously elaborated by the diachronic comparison of different built-up layers in the Municipality of Moncalieri. The addition of new buildings has been monitored from 1990 to 2015, each building has been transformed into a point file, and using the ArcGis kernel density function (Spatial Analyst) (Tool).
3.5. Pressures on the System: Shocks
Shocks are unpredictable and dangerous events that threaten the system occasionally and with high impact for the environment, settlements, and populations. Shocks are intended as the major catastrophic events that the system has to absorb in case of adverse conditions. Shocks are unpredictable since their occurrence is viewed in a long-time period and, moreover, their effect is unpredictable too. To provide a spatial distribution of shocks, auxiliary maps of the public administration were consulted (flooded areas of 2016 and the map of fire risk taken by the civil protection plan) in order to obtain updated information (Figure 5).
Shocks are composed by three indicators:
- An indicator refers to the risk of fire IBO;
- Two indicators ALU and ALA refer to meteo-hydrological related risks. ALU represent the spatial distribution of flooded areas in case of a catastrophic event while ALA represents the areas that are threatened by high run-off processes and therefore are affected by debris flows.
IBO—The spatial distribution of fires risk has been obtained by an autonomous elaboration that has been conducted using the methodological requirements of the Italian Civil Protection that is the selection of areas where buildings are less than 10 m from a forested area. This condition is evaluated as potentially dangerous in case of fire since these buildings are highly exposed to flames. The indicator has been created by ArcGIS Kernel Density (Spatial Analyst Tool) with a degree of risk that increases as much as there is a concentration of exposed buildings.
ALU—This indicator has been calculated using the ancillary map of the flooded areas of the event that occurred in 2016 that has been considered ‘catastrophic’ since the flooding overcomes for large parts the maximum exposed areas that the hydrological plan was originally considering. This event showed that the traditional single risk maps underestimate the potential effect of a natural hazard where the accumulation of causes generates a highly dangerous condition. Flooded areas were mapped by ranking the catastrophic effect of the flooding, thus the indicator maintains the scoring from 0 to 1 of the potential dangerousness in each pixel.
ALA—This indicator differs from the previous since the phenomena of intense rainfall can generate in the medium period a flood peak in the existent streams, but at the same time in the short period, the run-off along sloping areas often causes debris flows where the soil reaches the point of saturation. This is the case of hilly areas, but also the plain areas in low drainage soils that reach the saturation in case of heavy rain. This indicator has been created using the InVEST Nutrient Retention model that generates a preliminary intermediate output where each pixel of the landscape is affected by a run-off index. The upstream areas where selected and evaluated by a 0–1 indicator alongside the run-off streams.
3.6. Mapping the Vulnerability of the System
Once the sensitivities, disturbances, and shocks were mapped with the same parcel units the spatial overlay of each component has been employed to generate a final index of the overall evaluation of variables, where the vulnerability here is intended as the unweighted sum of sensitivities with the disturbances and shocks.
The map is the product of the per-pixel formula that follows
where
Vul = vulnerability of the system
Sen = sensitivity composed by a composite unweighted sum of IMP + IFI + HQ + CS + WY + SH
D = disturbances composed by a composite unweighted sum of NDR + SDR + CDS
S = shocks composed by a composite unweighted sum of IBO + ALU + ALA
The dark violet areas are the ones where the highly sensible pixels interact (are exposed to) linear pressures and unpredictable shocks (see Figure 4). Therefore, it is highly probable that from an environmental and ecosystem perspective, the system is subjected to disruptive effects in that parts, both in case of unpredictable natural hazards or long-time exposures to linear pressures that modify the state of the system. The probability that the environment will be threatened by climate-change-driven consequences in the violet areas is a piece of valuable information since it gives the possibility to comprehend the extent to which this system is vulnerable spatially and to which degree. This represents the first step into the experimental spatial measurement of the resilience of the system whereas the system is considered more resilient when is less vulnerable in a first attempt. In this view, resilience is the product of a combined reduction of vulnerability with and augment of adapting and coping capacity.
It is relevant to state that the Vulnerability is here produced by an unweighted overlay of indicators, meaning that there is no priority between the variables that are summed up to define the vulnerable parts of the system. We acknowledge that this is an essential limitation of this first empirical exercise, but we are opening the debate around this issue that is relevant to the final utilization of this pioneer and partial approach.
4. Discussion and Conclusions
4.1. Designing Adaptation: Where?
As demonstrated in the boxplot distribution of the composite sum of sensitivity, disturbances, and shocks (see Figure 6), values ranging from 0 to 1 (some outliers in shocks and disturbances are present due to unaccounted decimal values during normalization) displays how the average value of sensitivity is a decimal value above the disturbances and more than three decimal values above the shocks. This depends on the fact that disturbances and shock are concentrated in some parts of the municipality while sensitivities are spread in all the system, with lower clustering zones. The system, in that case, is generally sensible by itself without external factors that affect its condition. The dark violet vulnerable areas are the ones where the Vul value overcomes the 1.40 value and therefore a compresence of Sens values over 0.7 overlays D over 0.65 and S over 0.4.
The production of a composite overlaid map of vulnerabilities, as a product of the spatial interpolation of different indicators grouped as sensitivities, disturbances, and shocks, turned out to be significant for the following considerations and their relevance to better design the adaptation/transformation measures increasing the resilience of the system.
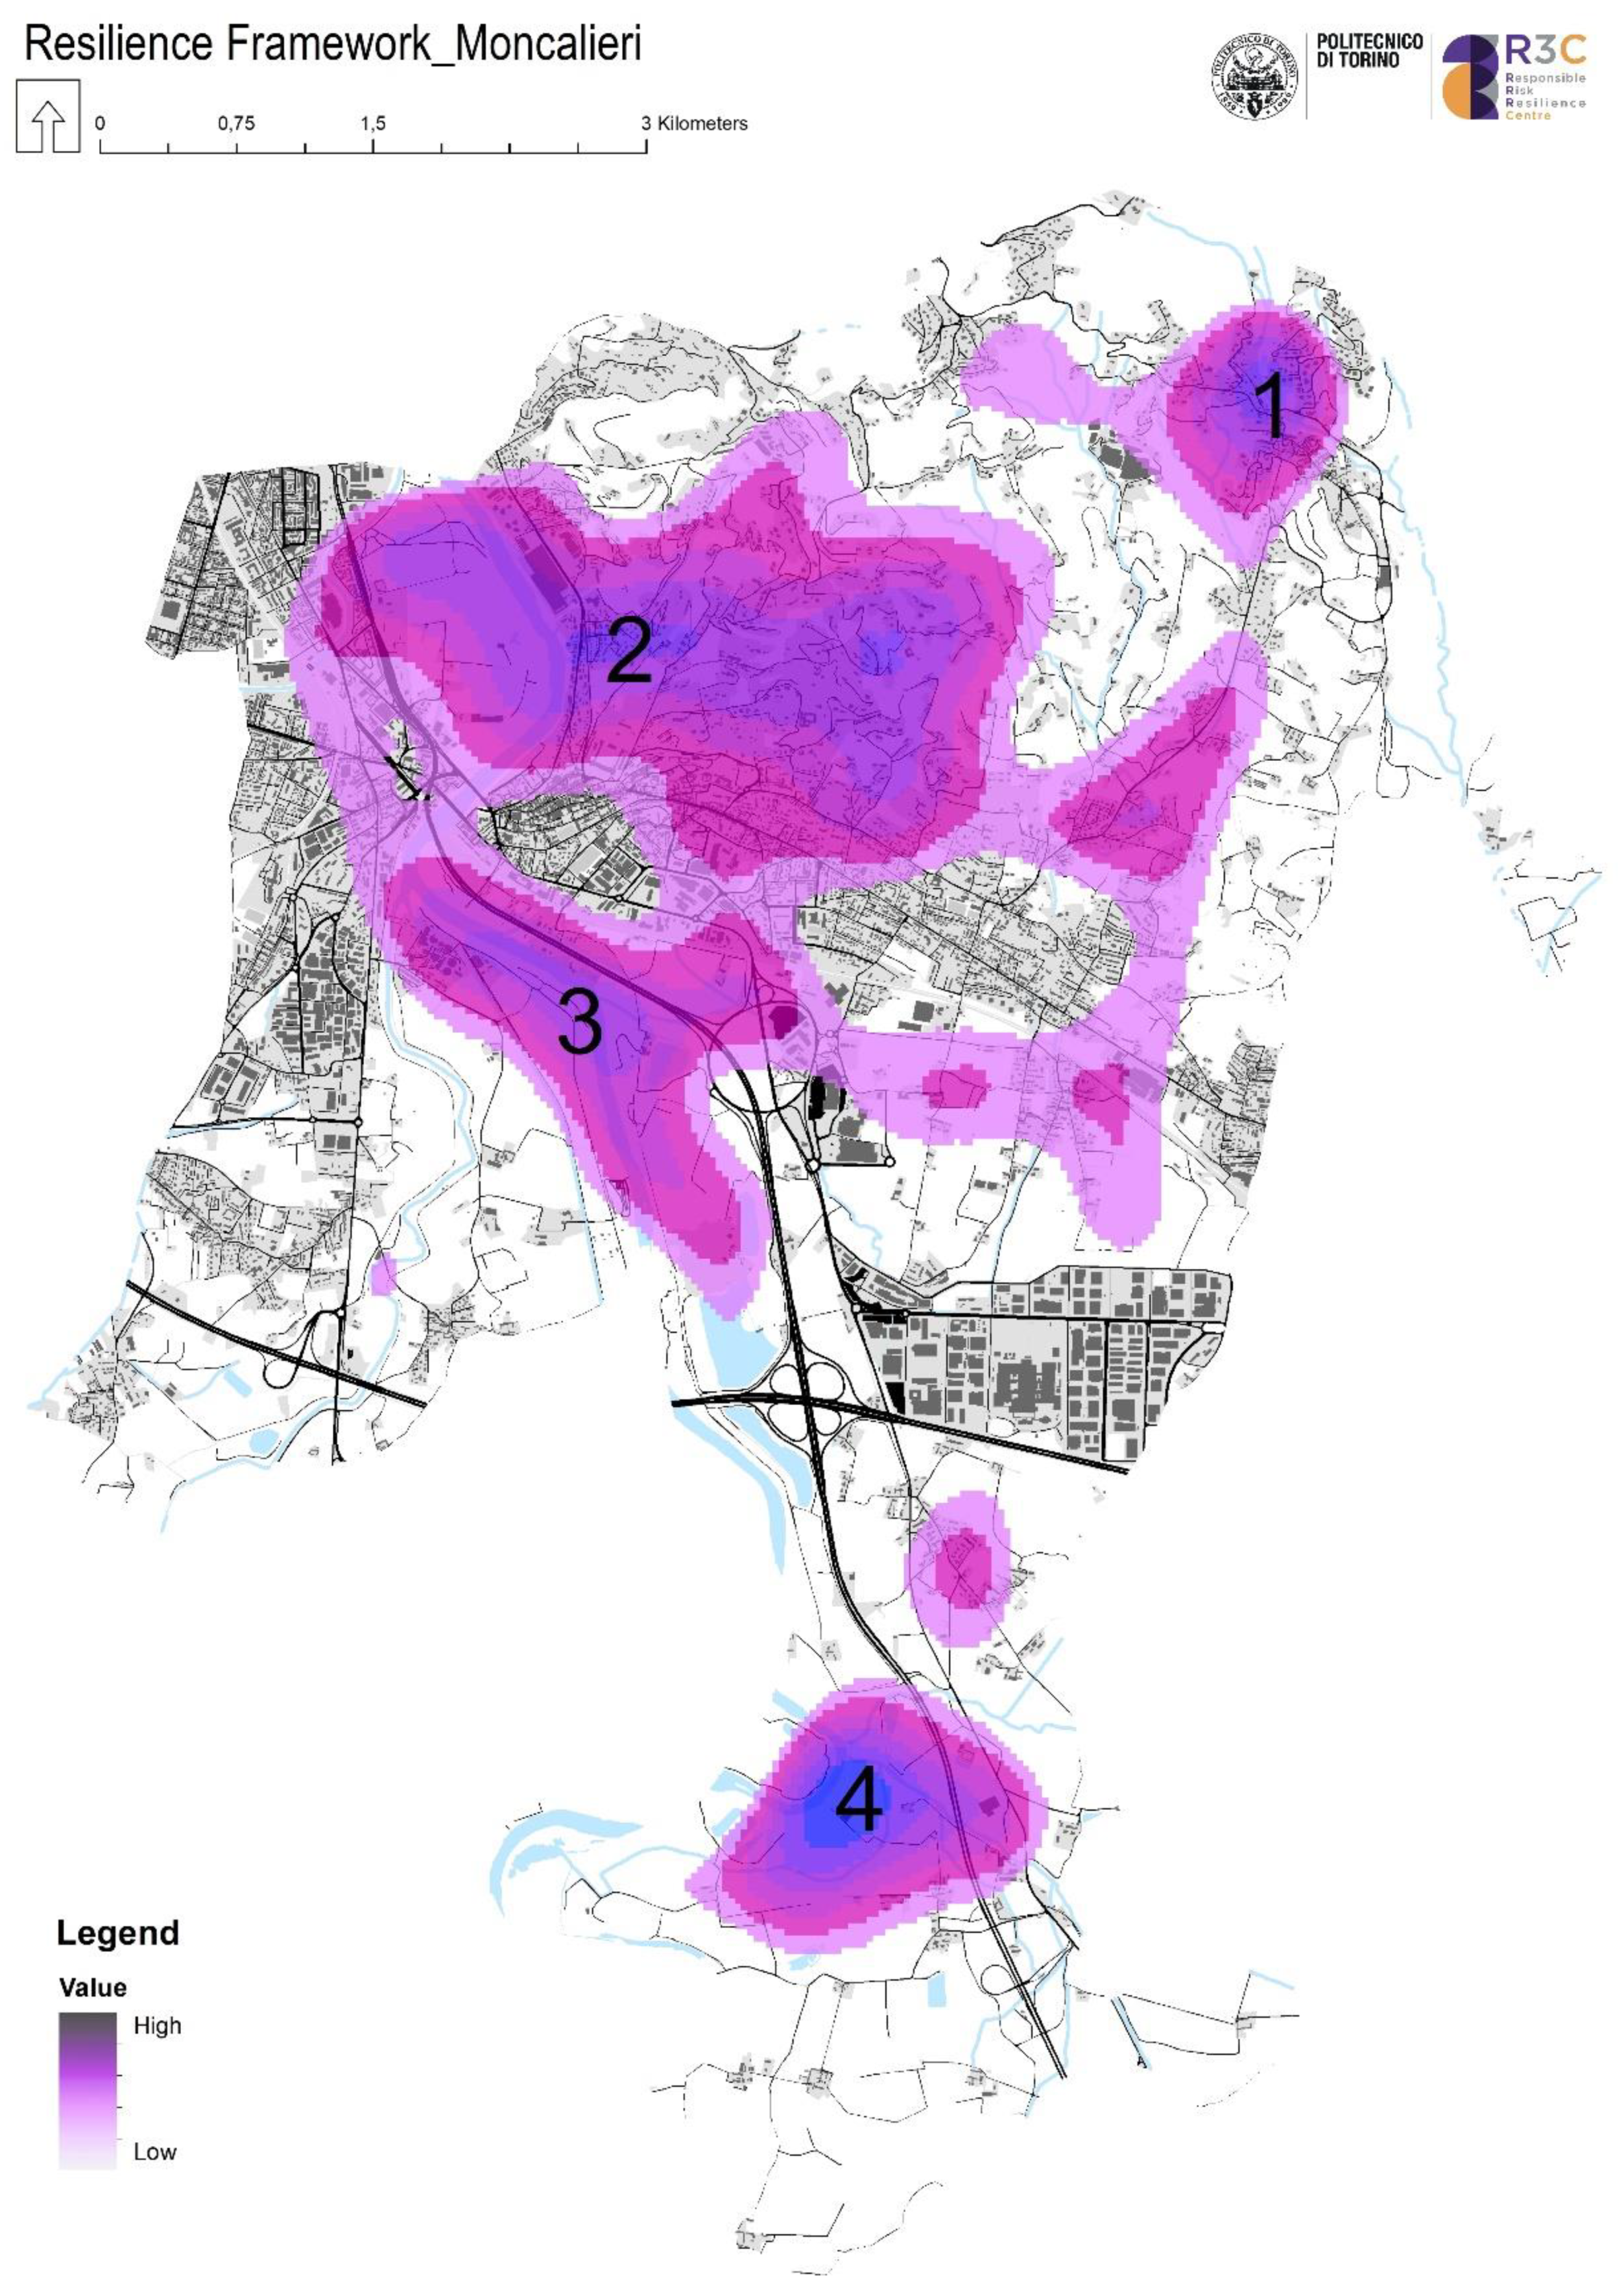
The distribution of dark violet areas is mainly concentrated in four priority areas (Figure 7):
The hilly development of Revigliasco (area 1) which comprises the landscape of natural and seminatural forested areas with the disperse and fragmented settlement system that is developed along the historical track, namely “Strada della Maddalena”. Here, a high vulnerability is particularly due to the probability that an event (fire) occurs destroying the rural and natural environment characterized by the presence of human settlements that are composed by detached and semi-detached houses with a high landscape and scenic quality.
The upper town development (area 2) along the panoramic routes that provides accessibility to the hilly semi-detached development that forms a continuum with the dense and highly developed ancient town center. This part of the system is characterized by high promiscuity between the natural landscape and the built-up system made up by villas and big private gardens and parks. In these areas, the development of the real-estate market for upper-class development of the city has been historically polarized and the vulnerability is characterized by the predominance of the land take disturbance over these areas;
The rural Po riverbed (areas 3 and 4) that is constrained between the A6 Highway Torino-Savona, the national ancient street that connects Torino (Nichelino) and Carignano, the railway, and the national road to Carmagnola. This part of the landscape preserves the character of a humid ecosystem only along the stripped riverbanks because it has historically subjected to a high process of urbanization and hydraulic regulation. The landscape comprises intensive seminative fields with dispersed settlements on the west side with orchards and some formerly productive sites. Here, the vulnerability is mainly due to shocks (flooding) that compromises the environmental and ecosystem integrity of the system and to highly sensitive parts of these areas that are sensitive to hydrological regimes.
The clustering analysis is a first attempt to define where specific actions to develop mitigation and compensation measure to pursue the adaptation of the system should be planned.
4.2. Designing Adaptation: What?
Resilient approaches rose to attention and became pivotal to introduce the vulnerable dimension of the system during the land use planning process. Nonetheless, they remain a weak approach if there is not an operational integration of the vast quantity of information that frames the assessment to support effective land use planning [57,58,59].
The above-presented spatial measurement of vulnerability of the system in a selected case-of-study area represents a first tentative to prioritize area of intervention to implement the transformation and the adaptation of the system.
The spatial measure of the vulnerability wants to overcome the analytical approaches that aim to define lists of city-performance indicators, thus becoming a tool that indicates where the system is vulnerable to potential hazards. The implication of this finding is that this measure should be implemented in the local analysis as a step towards the implementation of resilience, whereas resilience is further characterized by an additional capacity to cope with hazards by innovative governance solutions, adaptive and learning capacity, and adaptation.
The utilization of the map is crucial to define the kind (what) of interventions in urban areas that are necessary to lower the vulnerability of the system. Intervention ranges from the most commonly used ‘green’ nature-based solutions [60] to infrastructural ‘grey’ interventions. The bullet point that follows results from a first recognition of interventions categories that spans across a multitude of potential possible measures.
To what concern Moncalieri, some actions should be developed in vulnerable areas. In areas 3 and 4, preferable actions range from different measures to achieve flow regulation:
- planting green roofs or green walls to intercept rainfall;
- creating rain gardens/plaza reducing run-off;
- create underground water storage that increase the absorption capacity of urban areas;
- urban catchment forestry to retrofit sustainable urban tree cover to reduce flood risk;
- floodable parks to absorb flood peaks.
While the hill (areas 1 and 2) should pursue a de-sealing process with a rational regulation of the interconnection between natural areas and the built-up system.
- creating landscape connections with urban green space—trees, alleys, hedges, riparian vegetation;
- increase biodiversity within green areas, paying particular attention to the distance between forested areas and settlements to cope with fire risk;
- urban catchment forestry to retrofit sustainable urban tree cover to improve water supply;
- natural wastewater treatment to reduce drinking water consumption for irrigation.
These measures are just some of the solutions provided by the national guidelines to define the Adaptation to Climate Change—according to the Italian National Plan of Adaptation to Climate Change (PNCC, 2016)—that we purpose here as an operational methodology that links the assessment of vulnerability to the definition of a selected target of transformative measures. The selection mainly depends on two factors: the location of the vulnerability respect to the system and the kind of vulnerability that affects the system (see Section 4.1). Grey interventions, suggested in the plan, should be developed where technological, civil, and architectural projects are designed to retrofit, refresh, substitute, or re-develop the built-up system achieving a more efficient, sustainable, and resilient anthropic environment. Here, the National Adaptation Plan suggests implementing structural solutions in highly sealed contexts referring to the capacity of using the available technology to increase the ability of the built-up system to be more efficient in terms of energy consumption also absorbing the potential effects of common natural hazards such as flooding, heat islands, or earthquakes. Grey measures also include public interventions concerning sewage, electrical, and telecommunication systems, in order to augment the capacity of absorbing shocks providing an adequate communication system even in case of profound damages on buildings. On the other side, nature-based solutions are recommendable in peri-urban, rural, and hilly parts of the system where the greening and de-sealing are necessary actions to provide a higher regulative capacity of ecosystems to regenerate the environmental functions. Both green and grey interventions range from mitigative to long term adaptive solutions that transform the system to reach a measurable resilient condition.
5. Conclusions
The first step to achieve resilience is to reduce the vulnerability. In this study, a parcel-based analysis of the vulnerability has been spatially mapped in GIS environment using ArcGis ver.10.6 as the output of a spatial overlay interaction between many variables.
The design of a parcel-level composite index [61] introduces a significate step forward to developing urban policies aimed at incorporating the measure of vulnerability increasing the resilience of the system [62,63,64]. Composite indexes support the spatial development of sustainable policies, achieving a long-term benefit for people by connecting environmental values with socio-cultural and economic values [63,65,66]. Nonetheless, communicability of technical maps during the decision-making process remains a critical issue and if planners are not able to represent their information in a spatial and simplistic way [59,67,68,69] the utilization of the scientific assessment is weak.
This empirical study demonstrated that measuring the vulnerability of the system helped in the preliminary definition of a normative list of priorities in the urban agenda of the Public Administration of Moncalieri. The acknowledgment of the vulnerable dimension in the system provides a keen awareness that citizens are exposed to potential damages in the next years if some adaptations and transformation measures are not considered. Within the study, a first attempt to provide a scientific background in the definition of public interventions to increase the resilience of the system has been obtained. We are aware that this is a preliminary study and that the adaptation of the system includes measures of preparedness and response capacity that are not included in the list of actions here proposed. Nonetheless, we aim at integrating this study including the ‘soft’ measures that are the ones which are not referred to the physical transformation of the territory but depends on the innovation, governance, and self-adaptation of society to the vulnerable dimensions. Regarding this point, the first draft of action was considered to augment the resilience of the environment and ecosystem services:
- as regards the governance system, introducing local prescriptions that lead to propose natural parks and environmental protection zones in high habitat quality areas should be considered. Moreover, the re-design of the ecological network should consider much more the connections between primary ecological zones and the built-up environment. Strategic environmental assessment for plans and projects should include the evaluation of ecosystem services and the efficiency of buildings and infrastructures introducing a monitoring system that provide an ongoing adaptation of policies and environmental strategies;
- regarding associations, fire vulnerability sheds light on the need to consider the activation of an inter-municipal consortium of forested areas that also includes active associations and citizens to promote conservation, monitoring, and emergency coordination in case of dangerous events;
- regarding the population, awareness, learning capacity, and innovation, the need to increase the perception of natural capital is an asset to develop and promote a diffuse preparation and the spread of initiatives aimed at improving the value of the territory and the needs to understand the vulnerability of the system. Teaching classes in primary schools while providing evening courses for workers and seniors are, among others, channels to promote knowledge of the territory that is fundamental to increasing the social resilience and the capacity of adaptability to dangerous events.
The experience here presented shows how to provide a first attempt to achieve the resilience of the system by increasing the knowledge of the spatial distribution of vulnerabilities. Such an approach includes the visualization of a final multilayered indicator [70,71,72,73] that is the product of a geostatistical procedure made by GIS analysis. Maps of sensitivities, disturbances, and shocks were used to overlay every single value and generate a spatial representation of vulnerabilities at parcel-level scale. The methodology has been conceived to be replicated in another context in the future since it has been structured by grouping different indicators in different components of the system. This means that, independently from the utilization of the same indicators (which depends on availability of data and the practicability of measures), the relation between sensitivities, pressures, and shocks measured in a GIS-spatial-gridded environment with an unweighted overlay procedure can produce a spatial representation of the vulnerable dimension of the system, aiding decision-making for applying resilience measures.
Author Contributions
Conceptualization, methodology, writing—review and editing, G.B. and S.S.
Funding
This research received no external funding.
Acknowledgments
This manuscript is a product of the project “Measuring Resilience” of the Responsible Risk Resilience Centre (R3C) of Politecnico di Torino (see http://www.r3c.polito.it/). R3C is the first Italian research centre with specific goals of promoting adaptive and resilient strategies to address natural- and human-related risks, ensuring the safety of territorial and cultural heritage.
Conflicts of Interest
The authors declare no conflict of interest.
References
- Brand, F.S.; Jax, K. Focusing the meaning(s) of resilience: Resilience as a descriptive concept and a boundary object. Ecol. Soc. 2007, 12. [Google Scholar] [CrossRef]
- White, I.; O’Hare, P. From rhetoric to reality: Which resilience, why resilience, and whose resilience in spatial planning? Environ. Plan. C Gov. Policy 2014, 32, 934–950. [Google Scholar] [CrossRef]
- Pickett, S.T.A.; Cadenasso, M.L.; Grove, J.M. Resilient cities: Meaning, models, and metaphor for integrating the ecological, socio-economic, and planning realms. Landsc. Urban Plan. 2004, 69, 369–384. [Google Scholar] [CrossRef]
- Folke, C. Resilience: The emergence of a perspective for social-ecological systems analyses. Glob. Environ. Chang. 2006, 16, 253–267. [Google Scholar] [CrossRef]
- Davoudi, S.; Shaw, K.; Haider, L.J.; Quinlan, A.E.; Peterson, G.D.; Wilkinson, C.; Fünfgeld, H.; McEvoy, D.; Porter, L. Resilience: A Bridging Concept or a Dead End? “Reframing” Resilience: Challenges for Planning Theory and Practice Interacting Traps: Resilience Assessment of a Pasture Management System in Northern Afghanistan Urban Resilience: What Does it Mean in Planni. Plan. Theory Pract. 2012, 13, 299–333. [Google Scholar] [CrossRef]
- Starzomski, B.M. Book Review: Navigating Social-Ecological Systems: Building Resilience for Complexity and Change; Cambridge University Press: Cambridge, UK, 2004; Volume 9. [Google Scholar]
- Berkes, F.; Ross, H. Community Resilience: Toward an Integrated Approach. Soc. Nat. Resour. 2013, 26, 5–20. [Google Scholar] [CrossRef]
- Folke, C.; Carpenter, S.R.; Walker, B.; Scheffer, M.; Chapin, T.; Rockström, J. Resilience Thinking: Integrating Resilience, Adaptability and Transformability. Ecol. Soc. 2010, 15. [Google Scholar] [CrossRef] [Green Version]
- Holling, C.S. Understanding the Complexity of Economic, Ecological, and Social Systems. Hum. Ecol. Rev. 2001, 4, 390–405. [Google Scholar] [CrossRef] [Green Version]
- Portugali, J. Self-Organization and the City; Springer: New York, NY, USA, 2000; ISBN 978-3-662-04099-7. [Google Scholar]
- Schwarz, A.M.; Béné, C.; Bennett, G.; Boso, D.; Hilly, Z.; Paul, C.; Posala, R.; Sibiti, S.; Andrew, N. Vulnerability and resilience of remote rural communities to shocks and global changes: Empirical analysis from Solomon Islands. Glob. Environ. Chang. 2011, 21, 1128–1140. [Google Scholar] [CrossRef]
- Brunetta, G.; Caldarice, O. Spatial Resilience in Planning: Meanings, Challenges, and Perspectives for Urban Transition. In Sustainable Cities and Communities; Leal Filho, W., Azul, A.M., Brandli, L., Özuyar, P.G., Wall, T., Eds.; Springer International Publishing: Cham, Switzerland, 2019; pp. 1–12. ISBN 978-3-319-71061-7. [Google Scholar]
- Wilkinson, C.; Porter, L.; Colding, J. Metropolitan Planning and Resilience Thinking: A Practitioner’s Perspective. Crit. Plan. 2010, 17, 24–45. [Google Scholar]
- Proag, V. Assessing and Measuring Resilience. Procedia Econ. Financ. 2014, 18, 222–229. [Google Scholar] [CrossRef] [Green Version]
- Quinlan, A.E.; Berbés-Blázquez, M.; Haider, L.J.; Peterson, G.D. Measuring and assessing resilience: Broadening understanding through multiple disciplinary perspectives. J. Appl. Ecol. 2016, 53, 677–687. [Google Scholar] [CrossRef]
- Markolf, S.A.; Chester, M.V.; Eisenberg, D.A.; Iwaniec, D.M.; Davidson, C.I.; Zimmerman, R.; Miller, T.R.; Ruddell, B.L.; Chang, H. Interdependent Infrastructure as Linked Social, Ecological, and Technological Systems (SETSs) to Address Lock-in and Enhance Resilience. Earth’s Future 2018, 6, 1638–1659. [Google Scholar] [CrossRef]
- Krumme, K. Sustainable Development and Social-Ecological-Technological Systems Sustainable Development and Social-Ecological-Technological Systems (SETS): Resilience as a Guiding Principle in the Urban-Industrial Nexus. J. Renew. Energy Sustain. Dev. 2016, 2, 70–90. [Google Scholar] [CrossRef]
- Mcphearson, T.; Pickett, T.A.S.; Nancy, B.G.; Niemelä, J.; Alberti, M.; Elmqvist, T.; Weber, C.; Haase, D.; Breuste, J.; Qureshi, S. Advancing Urban Ecology toward a Science of Cities. Bioscience 2016, 66, 198–212. [Google Scholar] [CrossRef] [Green Version]
- Pizzo, B. Problematizing resilience: Implications for planning theory and practice. Cities 2015, 43, 133–140. [Google Scholar] [CrossRef]
- UNFCCC/LED. National Adaptation Plans: Technical Guidelines for the National Adaptation Plan Process; UNDP: Washington, DC, USA, 2012; Volume 152. [Google Scholar]
- Attolico, A. Building Resilience Through Territorial Planning: The Experience of Province of Potenza. Procedia Econ. Financ. 2014, 18, 528–535. [Google Scholar] [CrossRef] [Green Version]
- Allen, C.R.; Angeler, D.G.; Garmestani, A.S.; Gunderson, L.H.; Holling, C.S. Panarchy: Theory and Application. Ecosystems 2014, 17, 578–589. [Google Scholar] [CrossRef] [Green Version]
- Carpignano, A.; Golia, E.; Di Mauro, C.; Bouchon, S.; Nordvik, J.P. A methodological approach for the definition of multi-risk maps at regional level: First application. J. Risk Res. 2009, 12, 513–534. [Google Scholar] [CrossRef]
- Di Mauro, C.; Bouchon, S.; Carpignano, A.; Golia, E.; Peressin, S. Definition of Multi-Risk Maps at Regional Level as Management Tool: Experience Gained by Civil Protection Authorities of Piemonte Region; University of Pisa: Pisa, Italy, 2006. [Google Scholar]
- United Nations. Sendai Framework for Disaster Risk Reduction 2015–2030. In Proceedings of the Third UN World Conference on Disaster Risk Reduction, Sendai, Japan, 18 March 2015. [Google Scholar]
- United Nations. UNISDR Terminology on Disaster Risk Reduction; UNISDR: Geneva, Switzerland, 2009. [Google Scholar]
- Bollettino, V.; Alcayna, T.; Dy, P.; Vinck, P. Introduction to Socio-Ecological Resilience. Oxford Res. Encycl. Nat. Hazard Sci. 2017, 4. [Google Scholar] [CrossRef]
- Vale, L.J. The politics of resilient cities: Whose resilience and whose city? Build. Res. Inf. 2014, 42, 191–201. [Google Scholar] [CrossRef]
- Mehmood, A. Of resilient places: Planning for urban resilience. Eur. Plan. Stud. 2016, 24, 407–419. [Google Scholar] [CrossRef]
- Adger, W.N. Social and ecological resilience: Are they related? Prog. Hum. Geogr. 2000, 24, 347–364. [Google Scholar] [CrossRef]
- Shin, S.; Lee, S.; Judi, D.R.; Parvania, M.; Goharian, E.; McPherson, T.; Burian, S.J. A systematic review of quantitative resilience measures for water infrastructure systems. Water 2018, 10, 164. [Google Scholar] [CrossRef]
- Béné, C. Towards a Quantifiable Measure of Resilience. IDS Work. Pap. 2013, 2013, 1–27. [Google Scholar] [CrossRef] [Green Version]
- Allen, C.R.; Angeler, D.G.; Cumming, G.S.; Folke, C.; Twidwell, D.; Uden, D.R. Quantifying spatial resilience. J. Appl. Ecol. 2016, 53, 625–635. [Google Scholar] [CrossRef]
- Meerow, S.; Newell, J.P.; Stults, M. Defining urban resilience: A review. Landsc. Urban Plan. 2016, 147, 38–49. [Google Scholar] [CrossRef]
- Desouza, K.C.; Flanery, T.H. Designing, planning, and managing resilient cities: A conceptual framework. Cities 2013, 35, 89–99. [Google Scholar] [CrossRef]
- Rizzi, P.; Graziano, P.; Dallara, A. A capacity approach to territorial resilience: The case of European regions. Ann. Reg. Sci. 2018, 60, 285–328. [Google Scholar] [CrossRef]
- Sala, S.; Ciuffo, B.; Nijkamp, P. A systemic framework for sustainability assessment. Ecol. Econ. 2015, 119, 314–325. [Google Scholar] [CrossRef] [Green Version]
- Sharifi, A. A critical review of selected tools for assessing community resilience. Ecol. Indic. 2016, 69, 629–647. [Google Scholar] [CrossRef] [Green Version]
- Maes, J.; Liquete, C.; Teller, A.; Erhard, M.; Paracchini, M.L.; Barredo, J.I.; Grizzetti, B.; Cardoso, A.; Somma, F.; Petersen, J.E.; et al. An indicator framework for assessing ecosystem services in support of the EU Biodiversity Strategy to 2020. Ecosyst. Serv. 2016, 17, 14–23. [Google Scholar] [CrossRef] [Green Version]
- McPhearson, T.; Andersson, E.; Elmqvist, T.; Frantzeskaki, N. Resilience of and through urban ecosystem services. Ecosyst. Serv. 2015, 12, 152–156. [Google Scholar] [CrossRef]
- McPhearson, T.; Hamstead, Z.A.; Kremer, P. Urban Ecosystem Services for Resilience Planning and Management in New York City. Ambio 2014, 43, 502–515. [Google Scholar] [CrossRef] [PubMed] [Green Version]
- Borgogno-Mondino, E.; Fabietti, G.; Ajmone-Marsan, F. Soil quality and landscape metrics as driving factors in a multi-criteria GIS procedure for peri-urban land use planning. Urban For. Urban Green. 2015, 14, 743–750. [Google Scholar] [CrossRef]
- Cassatella, C. The ‘Corona Verde’ Strategic Plan: An integrated vision for protecting and enhancing the natural and cultural heritage. Urban Res. Pract. 2013, 6, 219–228. [Google Scholar] [CrossRef]
- European Commission. Guidelines on Best Practice to Limit, Mitigate or Compensate Soil Sealing; European Commission: Brussels, Belgium, 2012; ISBN 9789279262104. [Google Scholar]
- Artmann, M. Assessment of soil sealing management responses, strategies, and targets toward ecologically sustainable urban land use management. Ambio 2014, 43, 530–541. [Google Scholar] [CrossRef]
- Bennett, G.; Mulongoy, K.J. Review of Experience with Ecological Networks, Corridors and Buffer Zones; The Secretariat of the Convention on Biological Diversity: Montreal, QC, Canada, 2006; Volume 23, ISBN 9292250426. [Google Scholar]
- Benini, L.; Bandini, V.; Marazza, D.; Contin, A. Assessment of land use changes through an indicator-based approach: A case study from the Lamone river basin in Northern Italy. Ecol. Indic. 2010, 10, 4–14. [Google Scholar] [CrossRef]
- Mosammam, H.M.; Nia, J.T.; Khani, H.; Teymouri, A.; Kazemi, M. Monitoring land use change and measuring urban sprawl based on its spatial forms: The case of Qom city. Egypt. J. Remote Sens. Space Sci. 2016. [Google Scholar] [CrossRef]
- Haines-Young, R.; Potschin, M. Common International Classification of Ecosystem Services (CICES) Consultation on Version 4; School of Geography, University of Nottingham Nottingham: Nottingham, UK, 2013; pp. 1–17. [Google Scholar]
- Nelson, E.; Ennaanay, D.; Wolny, S.; Olwero, N.; Pennington, D.; Mendoza, G.; Aukema, J.; Foster, J.; Forrest, J.; Cameron, D.; et al. InVEST 2.0 Beta User’s Guide: Integrated Valuation of Ecosystem Services and Tradeoffs; Woods Institute for the Environment, Stanford University: California, CA, USA, 2011; Available online: http://data.naturalcapitalproject.org/nightly-build/invest-users-guide/html/ (accessed on 1 April 2019).
- Salata, S.; Garnero, G.; Barbieri, C.; Giaimo, C. The Integration of Ecosystem Services in Planning: An Evaluation of the Nutrient Retention Model Using InVEST Software. Land 2017, 6, 48. [Google Scholar] [CrossRef]
- Salvati, L.; Munafo, M.; Morelli, V.G.; Sabbi, A. Low-density settlements and land use changes in a Mediterranean urban region. Landsc. Urban Plan. 2012, 105, 43–52. [Google Scholar] [CrossRef]
- Gardi, C.; Panagos, P.; Van Liedekerke, M.; Bosco, C.; De Brogniez, D. Land take and food security: Assessment of land take on the agricultural production in Europe. J. Environ. Plan. Manag. 2015, 58, 898–912. [Google Scholar] [CrossRef]
- Salata, S. Land take in the Italian Alps: Assessment and proposals for further development. Manag. Environ. Qual. 2014, 25. [Google Scholar] [CrossRef]
- Salata, S. Land take effects on airborne fluxes: A proposal for future research development. Manag. Environ. Qual. 2017, 28. [Google Scholar] [CrossRef]
- Pileri, P. Learning and interpreting land cover and its changes. In Land Cover Changes in Lombardy over the Last 50 Years; ERSAF: Regione Lombardia, Italy, 2012; pp. 185–204. [Google Scholar]
- Cortinovis, C.; Geneletti, D. Ecosystem services in urban plans: What is there, and what is still needed for better decisions. Land Use Policy 2018, 70, 298–312. [Google Scholar] [CrossRef]
- Salata, S.; Ronchi, S.; Ghirardelli, F. Ecosystem services supporting landscape planning|I servizi ecosistemici a supporto della pianificazione paesaggistica. Territorio 2016, 77, 45–52. [Google Scholar] [CrossRef]
- Meerow, S.; Newell, J.P. Spatial planning for multifunctional green infrastructure: Growing resilience in Detroit. Landsc. Urban Plan. 2017, 159, 62–75. [Google Scholar] [CrossRef]
- Raymond, C.M.; Frantzeskaki, N.; Kabisch, N.; Berry, P.; Breil, M.; Nita, M.R.; Geneletti, D.; Calfapietra, C. A framework for assessing and implementing the co-benefits of nature-based solutions in urban areas. Environ. Sci. Policy 2017, 77. [Google Scholar] [CrossRef]
- Dizdaroglu, D.; Yigitcanlar, T. Integrating urban ecosystem sustainability assessment into policy-making: Insights from the Gold Coast City. J. Environ. Plan. Manag. 2016, 59, 1982–2006. [Google Scholar] [CrossRef]
- Salmond, J.A.; Tadaki, M.; Vardoulakis, S.; Arbuthnott, K.; Coutts, A.; Demuzere, M.; Dirks, K.N.; Heaviside, C.; Lim, S.; Macintyre, H.; et al. Health and climate related ecosystem services provided by street trees in the urban environment. Environ. Heal. 2016, 15, 36. [Google Scholar] [CrossRef]
- Meisner, C.; Gjorgjev, D.; Tozija, F. Estimating health impacts and economic costs of air pollution in the Republic of Macedonia. South East. Eur. J. Public Heal. 2015, 10, 1–8. [Google Scholar] [CrossRef]
- Frumkin, H. Urban sprawl and public health. Public Health Rep. 2002, 117, 201–217. [Google Scholar] [CrossRef]
- Pulighe, G.; Fava, F.; Lupia, F. Insights and opportunities from mapping ecosystem services of urban green spaces and potentials in planning. Ecosyst. Serv. 2016, 22, 1–10. [Google Scholar] [CrossRef]
- Mononen, L.; Auvinen, A.P.; Ahokumpu, A.L.; Rönkä, M.; Aarras, N.; Tolvanen, H.; Kamppinen, M.; Viirret, E.; Kumpula, T.; Vihervaara, P. National ecosystem service indicators: Measures of social-ecological sustainability. Ecol. Indic. 2016, 61. [Google Scholar] [CrossRef]
- Lin, S.; Wu, R.; Yang, F.; Wang, J.; Wu, W. Spatial trade-offs and synergies among ecosystem services within a global biodiversity hotspot. Ecol. Indic. 2018, 84, 371–381. [Google Scholar] [CrossRef]
- Turkelboom, F.; Thoonen, M.; Jacobs, S.; Berry, P. Ecosystem Service Trade-offs and Synergies. Ecol. Soc. 2015, 21, 43. [Google Scholar] [CrossRef]
- Brunetta, G.; Caldarice, O. Urban Resilience for Risk and Adaptation Governance; Brunetta, G., Caldarice, O., Tollin, N., Rosas-Casals, M., Morató, J., Eds.; Springer International Publishing: Cham, Switzerland, 2019; pp. 27–41. ISBN 978-3-319-76943-1. [Google Scholar]
- Arcidiacono, A.; Ronchi, S.; Salata, S. Managing Multiple Ecosystem Services for Landscape Conservation: A Green Infrastructure in Lombardy Region. Procedia Eng. 2016, 161, 2297–2303. [Google Scholar] [CrossRef] [Green Version]
- Bottalico, F.; Chirici, G.; Giannetti, F.; De Marco, A.; Nocentini, S.; Paoletti, E.; Salbitano, F.; Sanesi, G.; Serenelli, C.; Travaglini, D. Air Pollution Removal by Green Infrastructures and Urban Forests in the City of Florence. Agric. Agric. Sci. Procedia 2016, 8, 243–251. [Google Scholar] [CrossRef] [Green Version]
- Lovell, S.T.; Taylor, J.R. Supplying urban ecosystem services through multifunctional green infrastructure in the United States. Landsc. Ecol. 2013, 28, 1447–1463. [Google Scholar] [CrossRef]
- European Environment Agency. Spatial Analysis of Green Infrastructure in Europe; European Environment Agency: Copenhagen, Denmark, 2014. [Google Scholar]
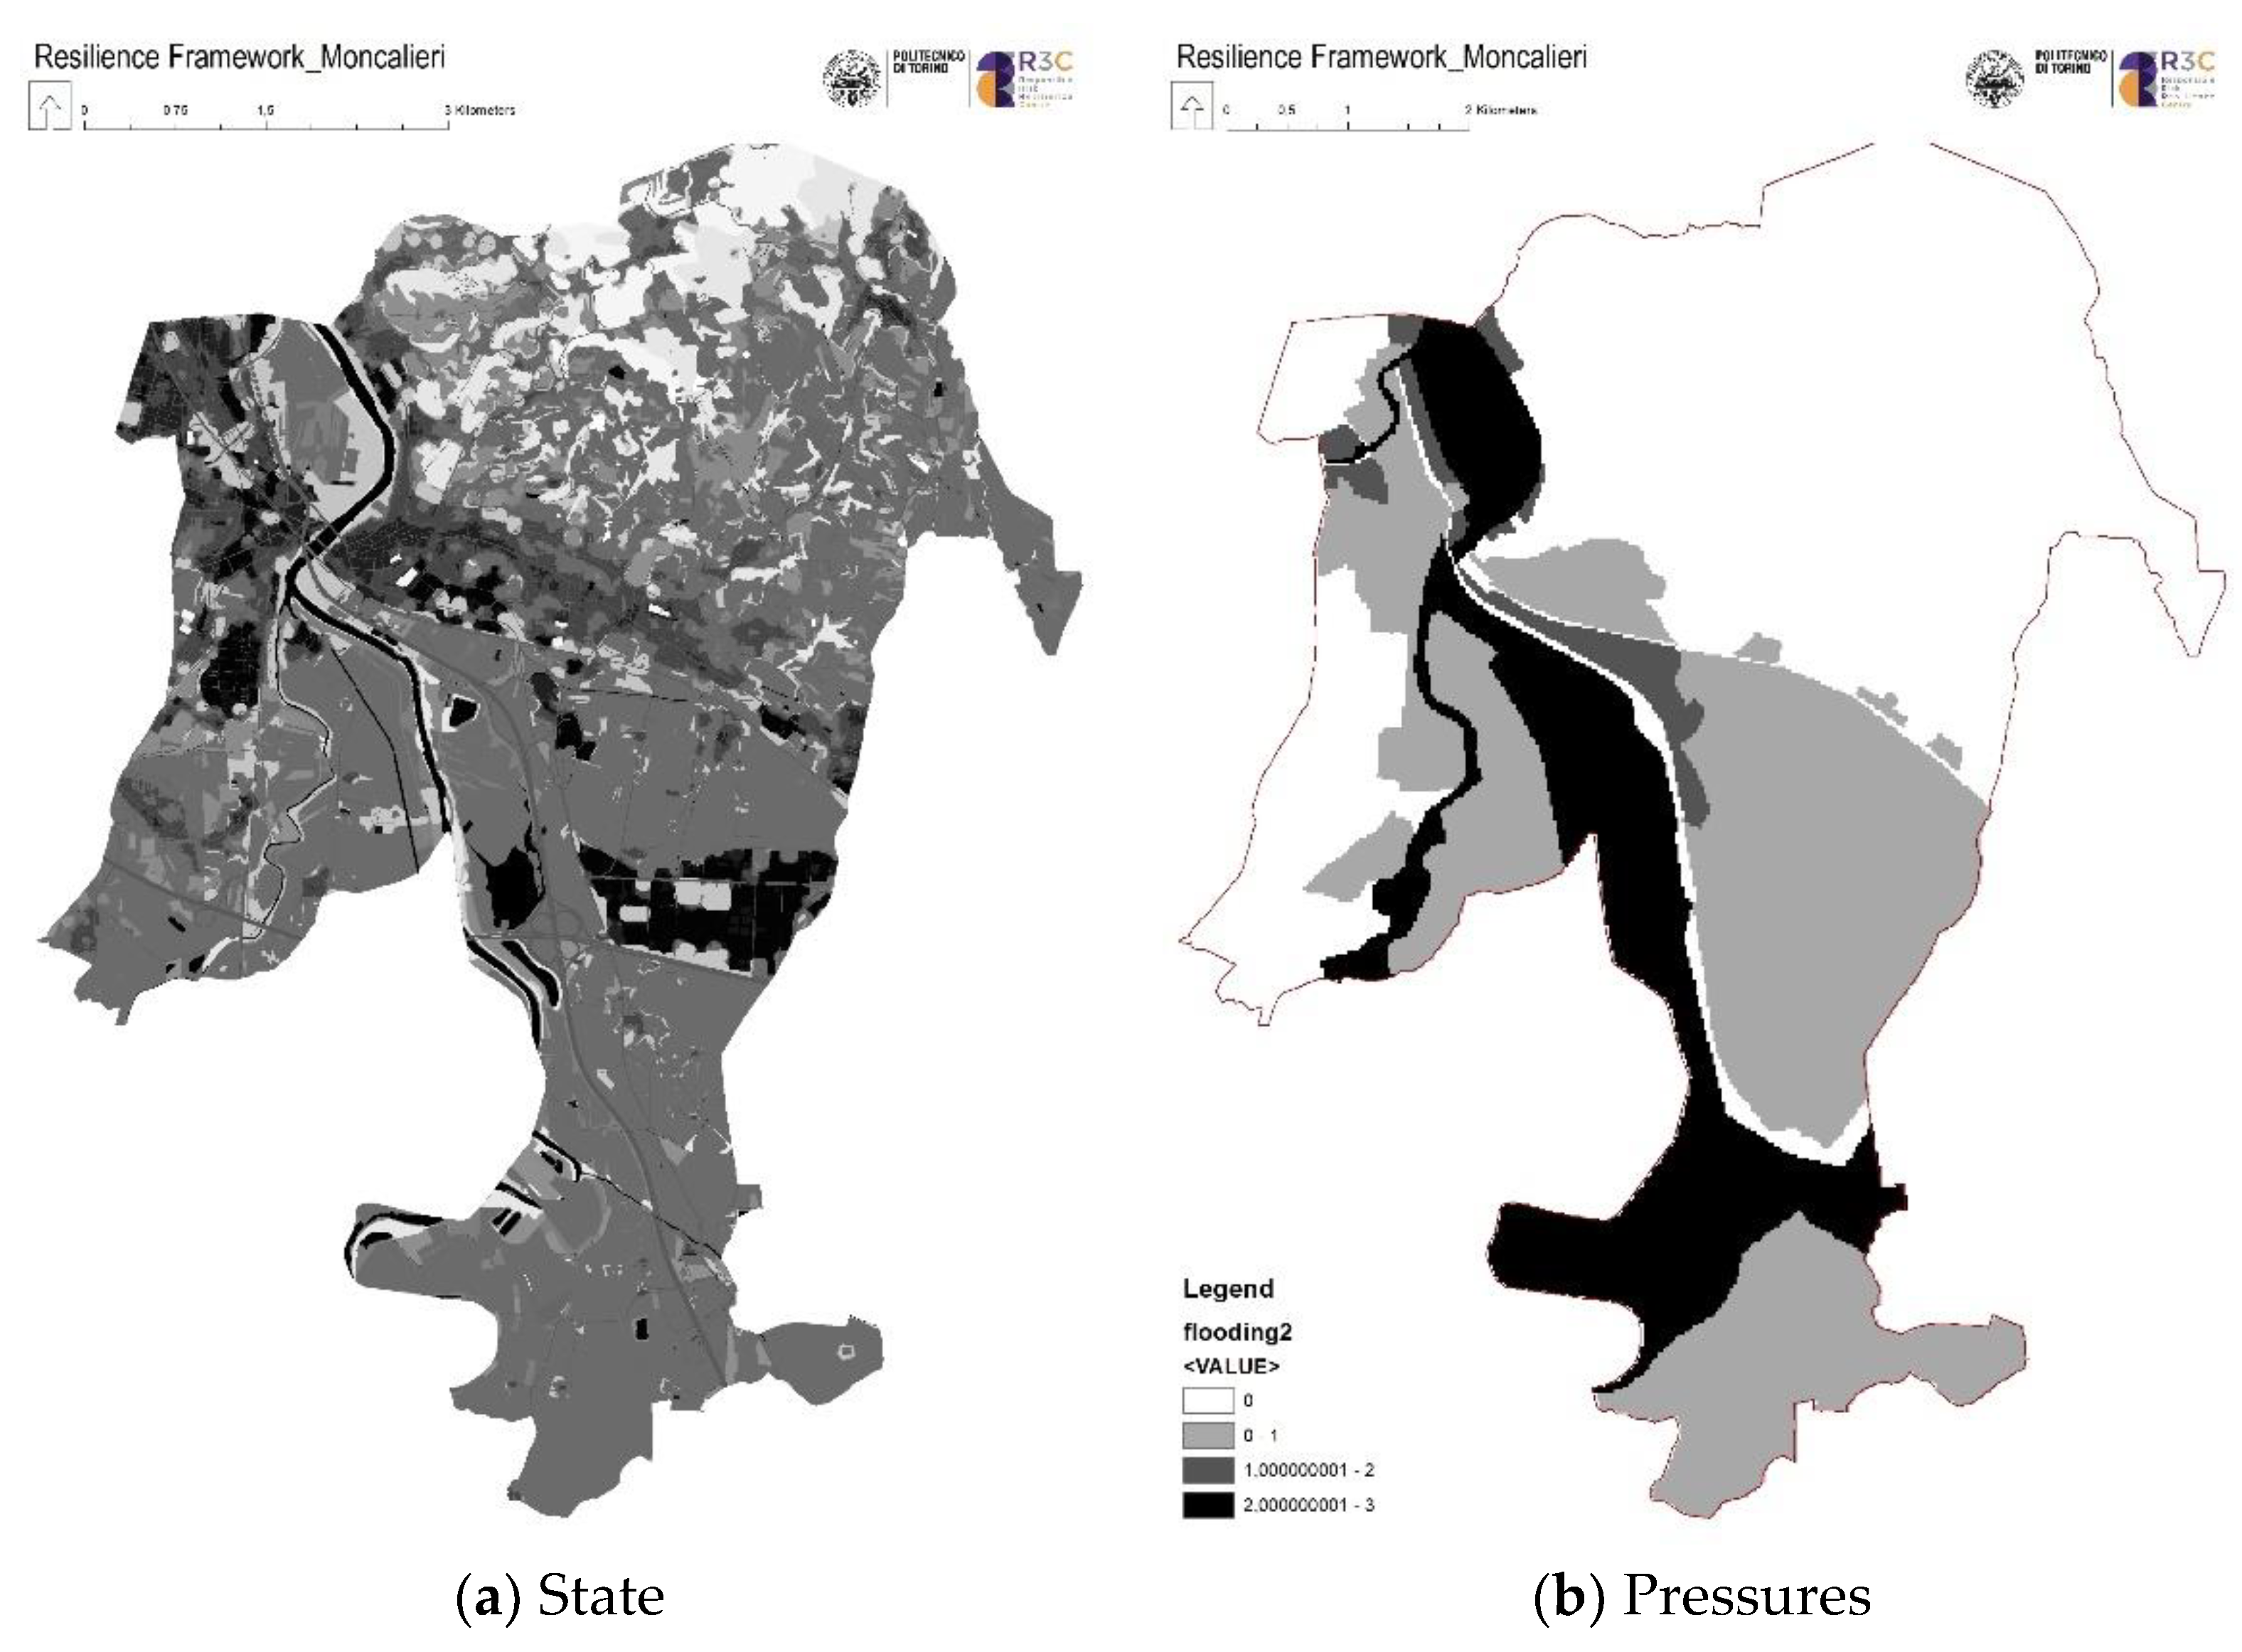
Figure 1.
Visualization of the cartographic representation of spatial indicators: (a) State indicator covers all the system indicating existing sensitivities (municipality); (b) Pressure indicators are distributes where the system is subjected to hazards, in that case from light grey to black there are the areas subjected to flooding events.

Figure 2.
Location of the context of study.

Figure 3.
Spatial per-pixel representation of each indicator of sensitivities.

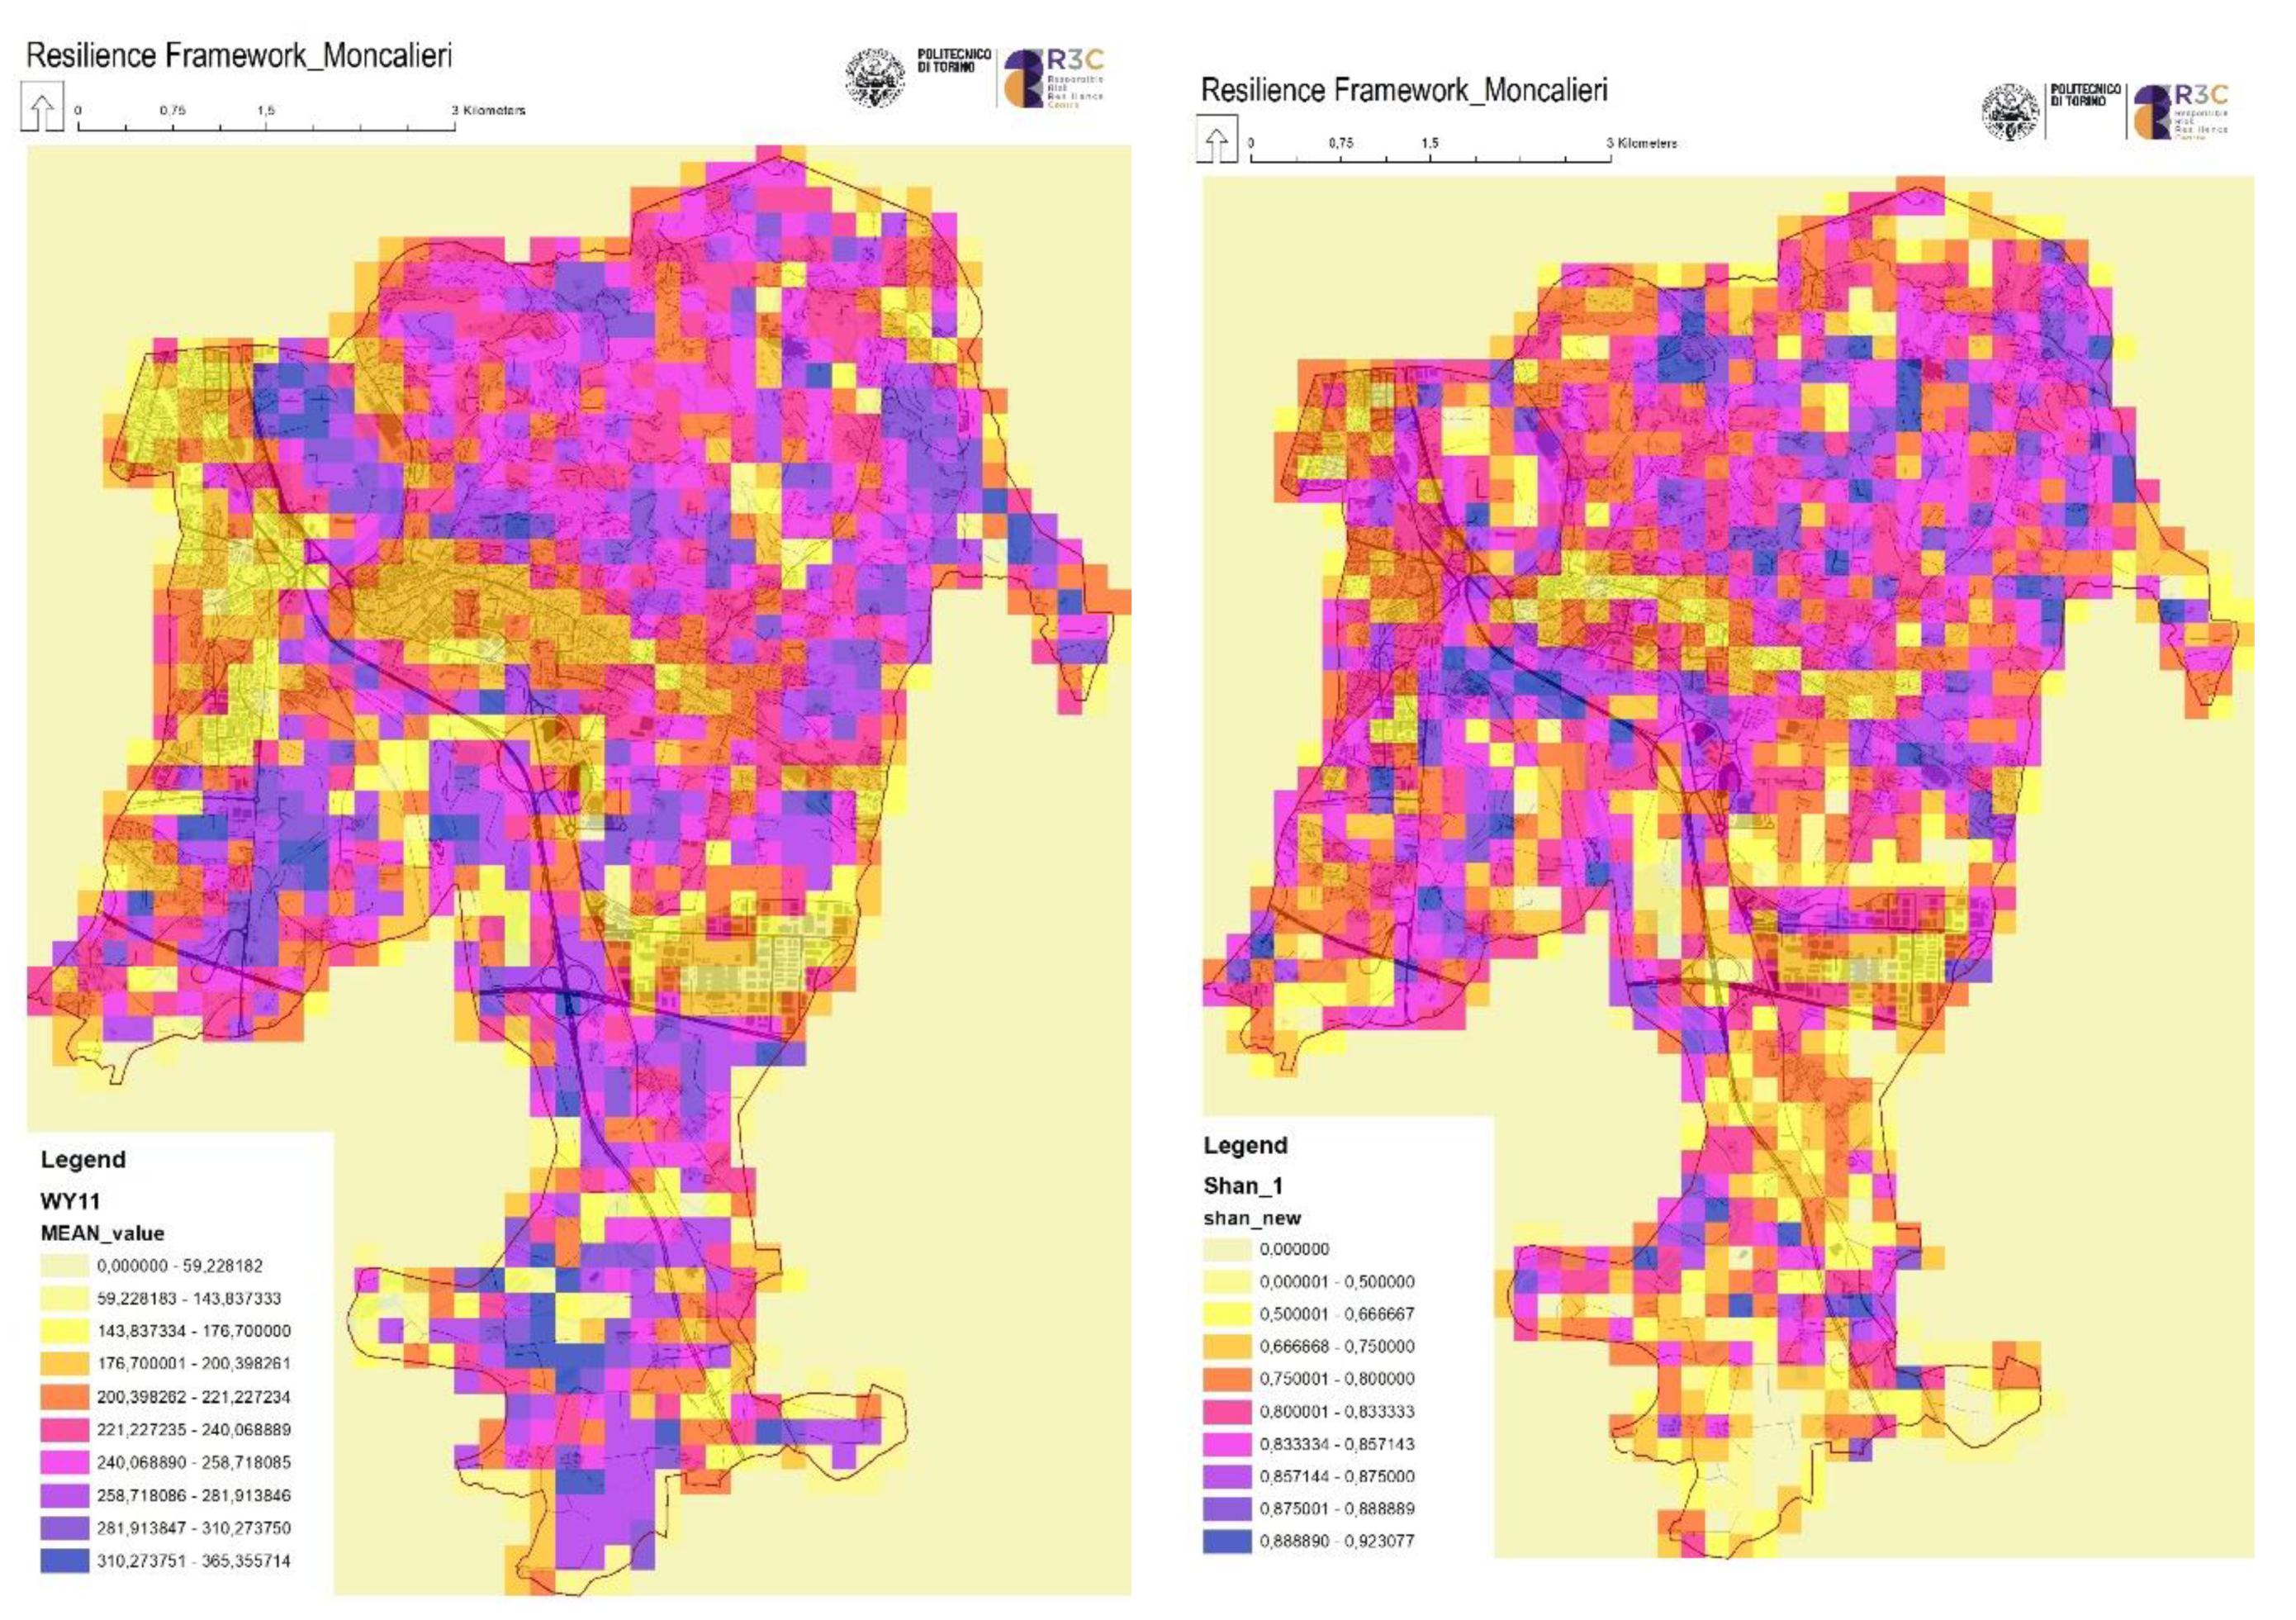
Figure 4.
Spatial per-pixel representation of each indicator of disturbances.
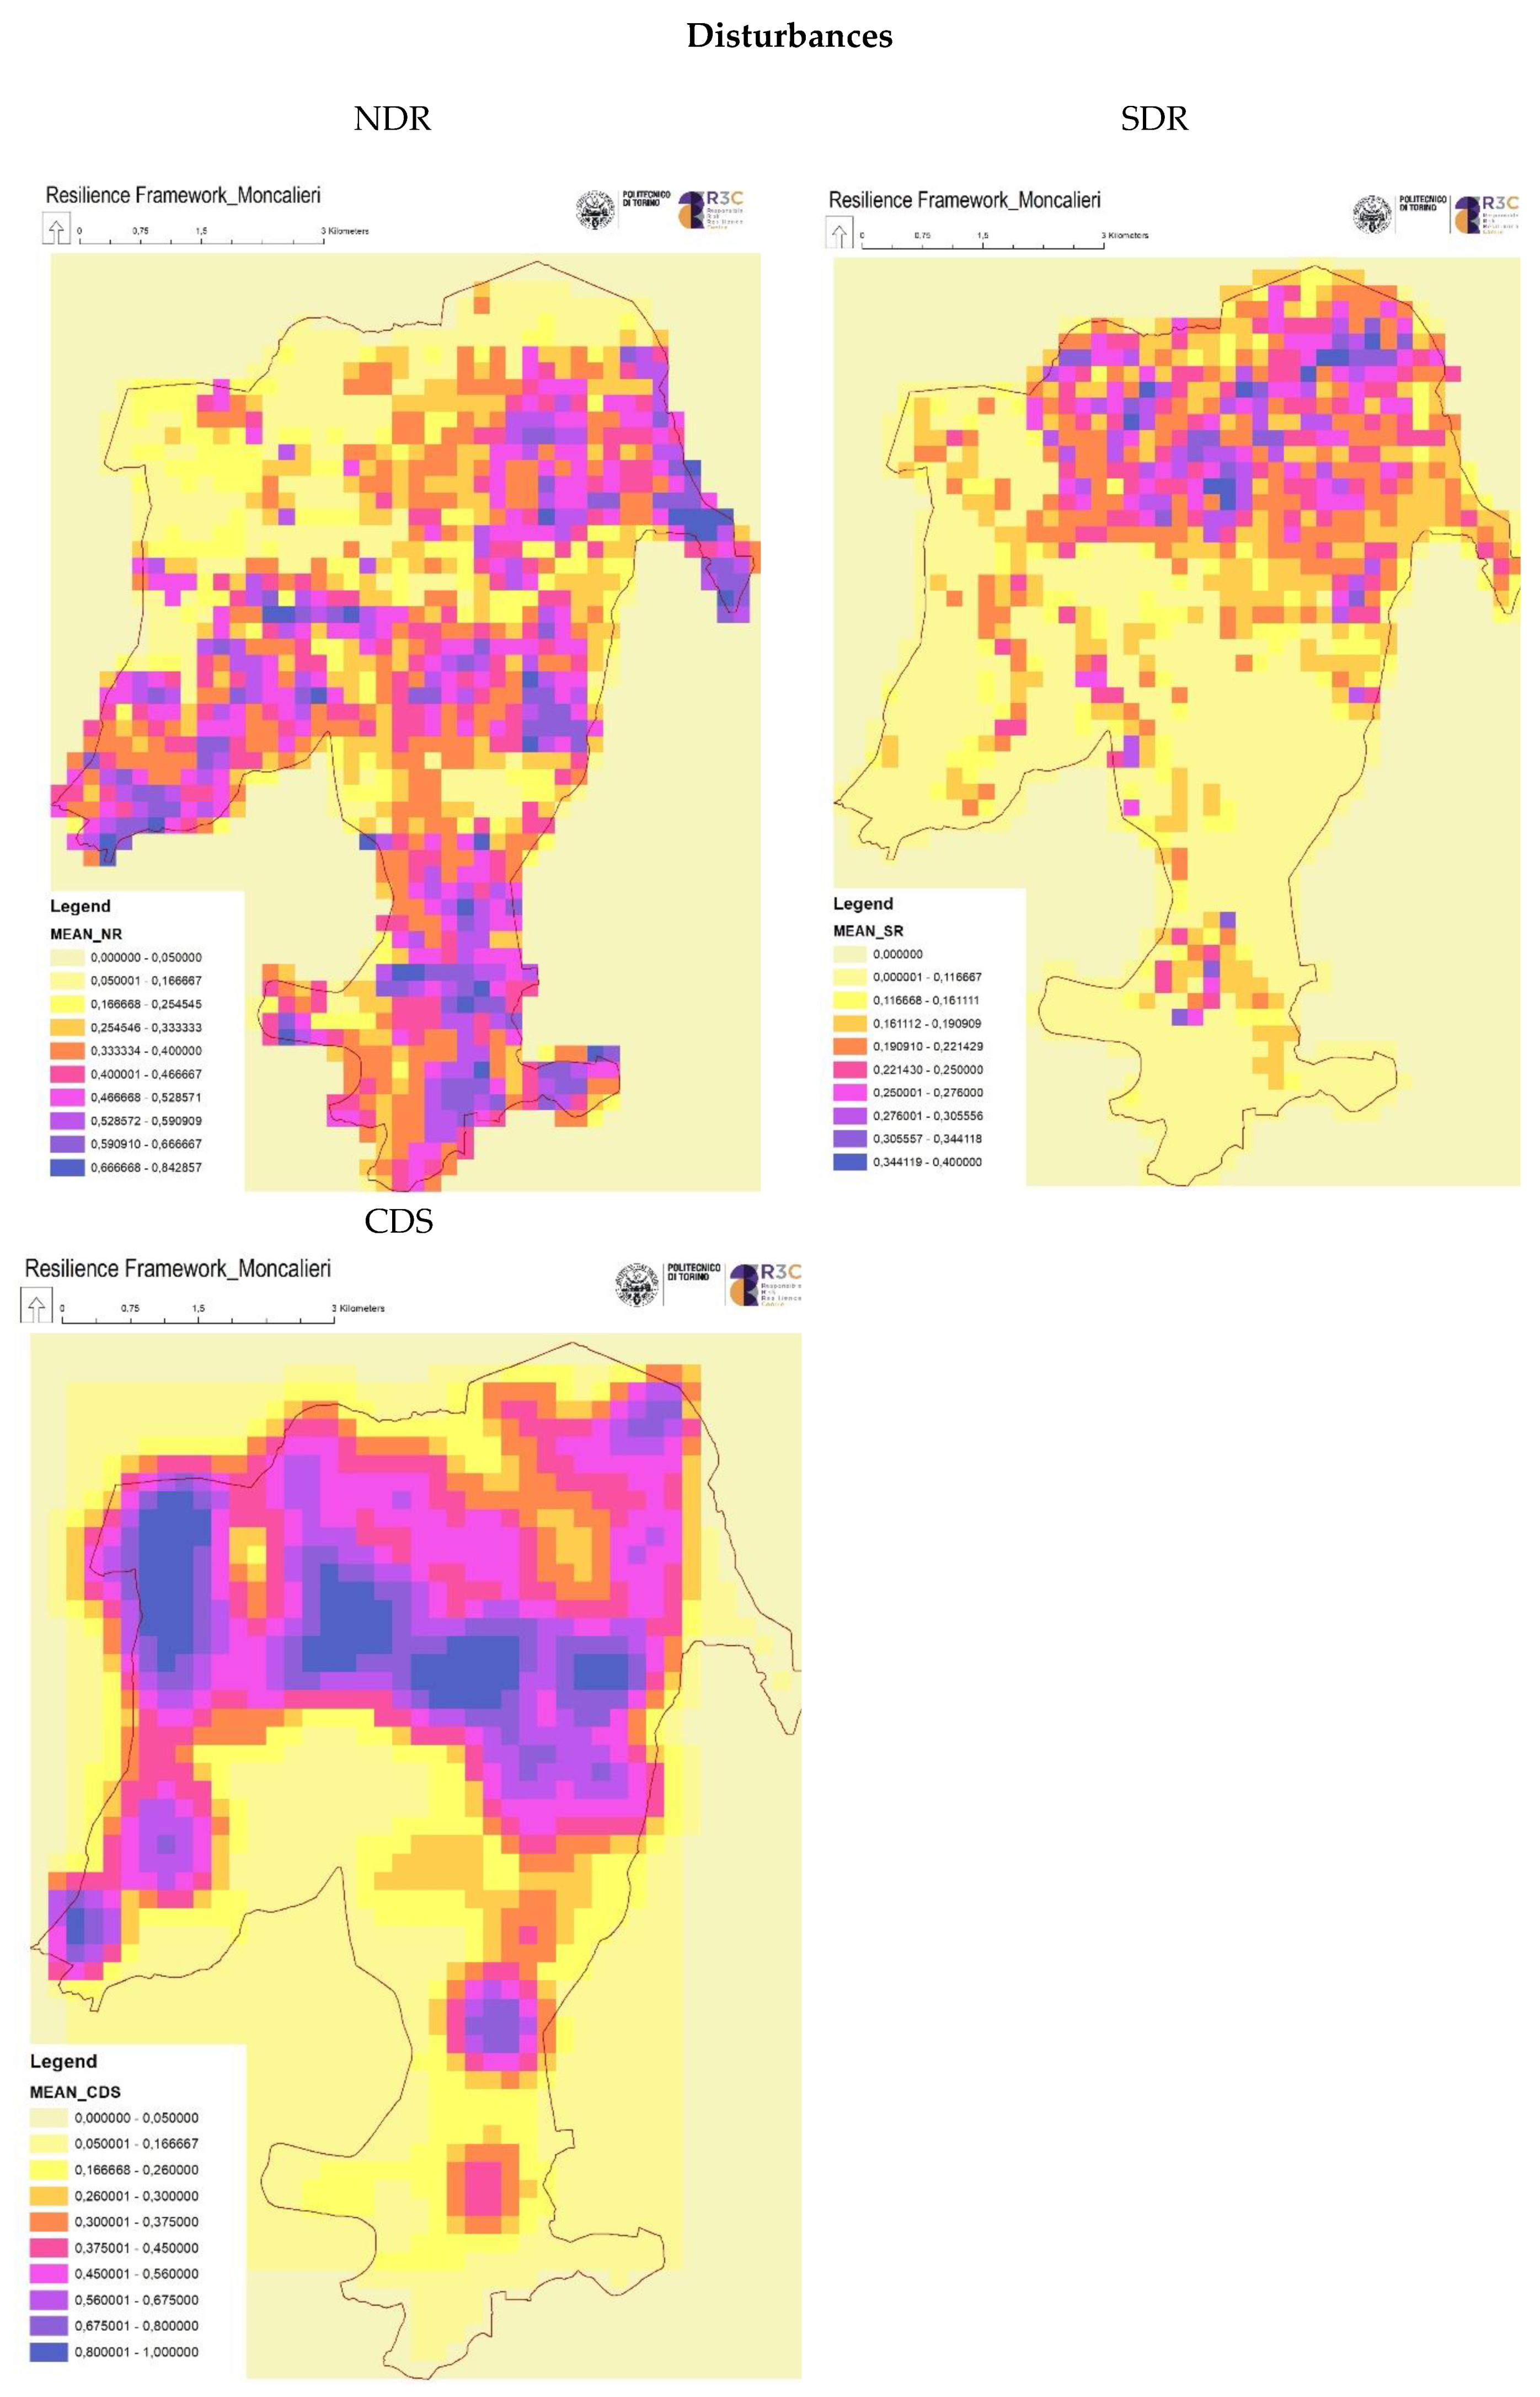
Figure 5.
Spatial per-pixel representation of each indicator of shocks.
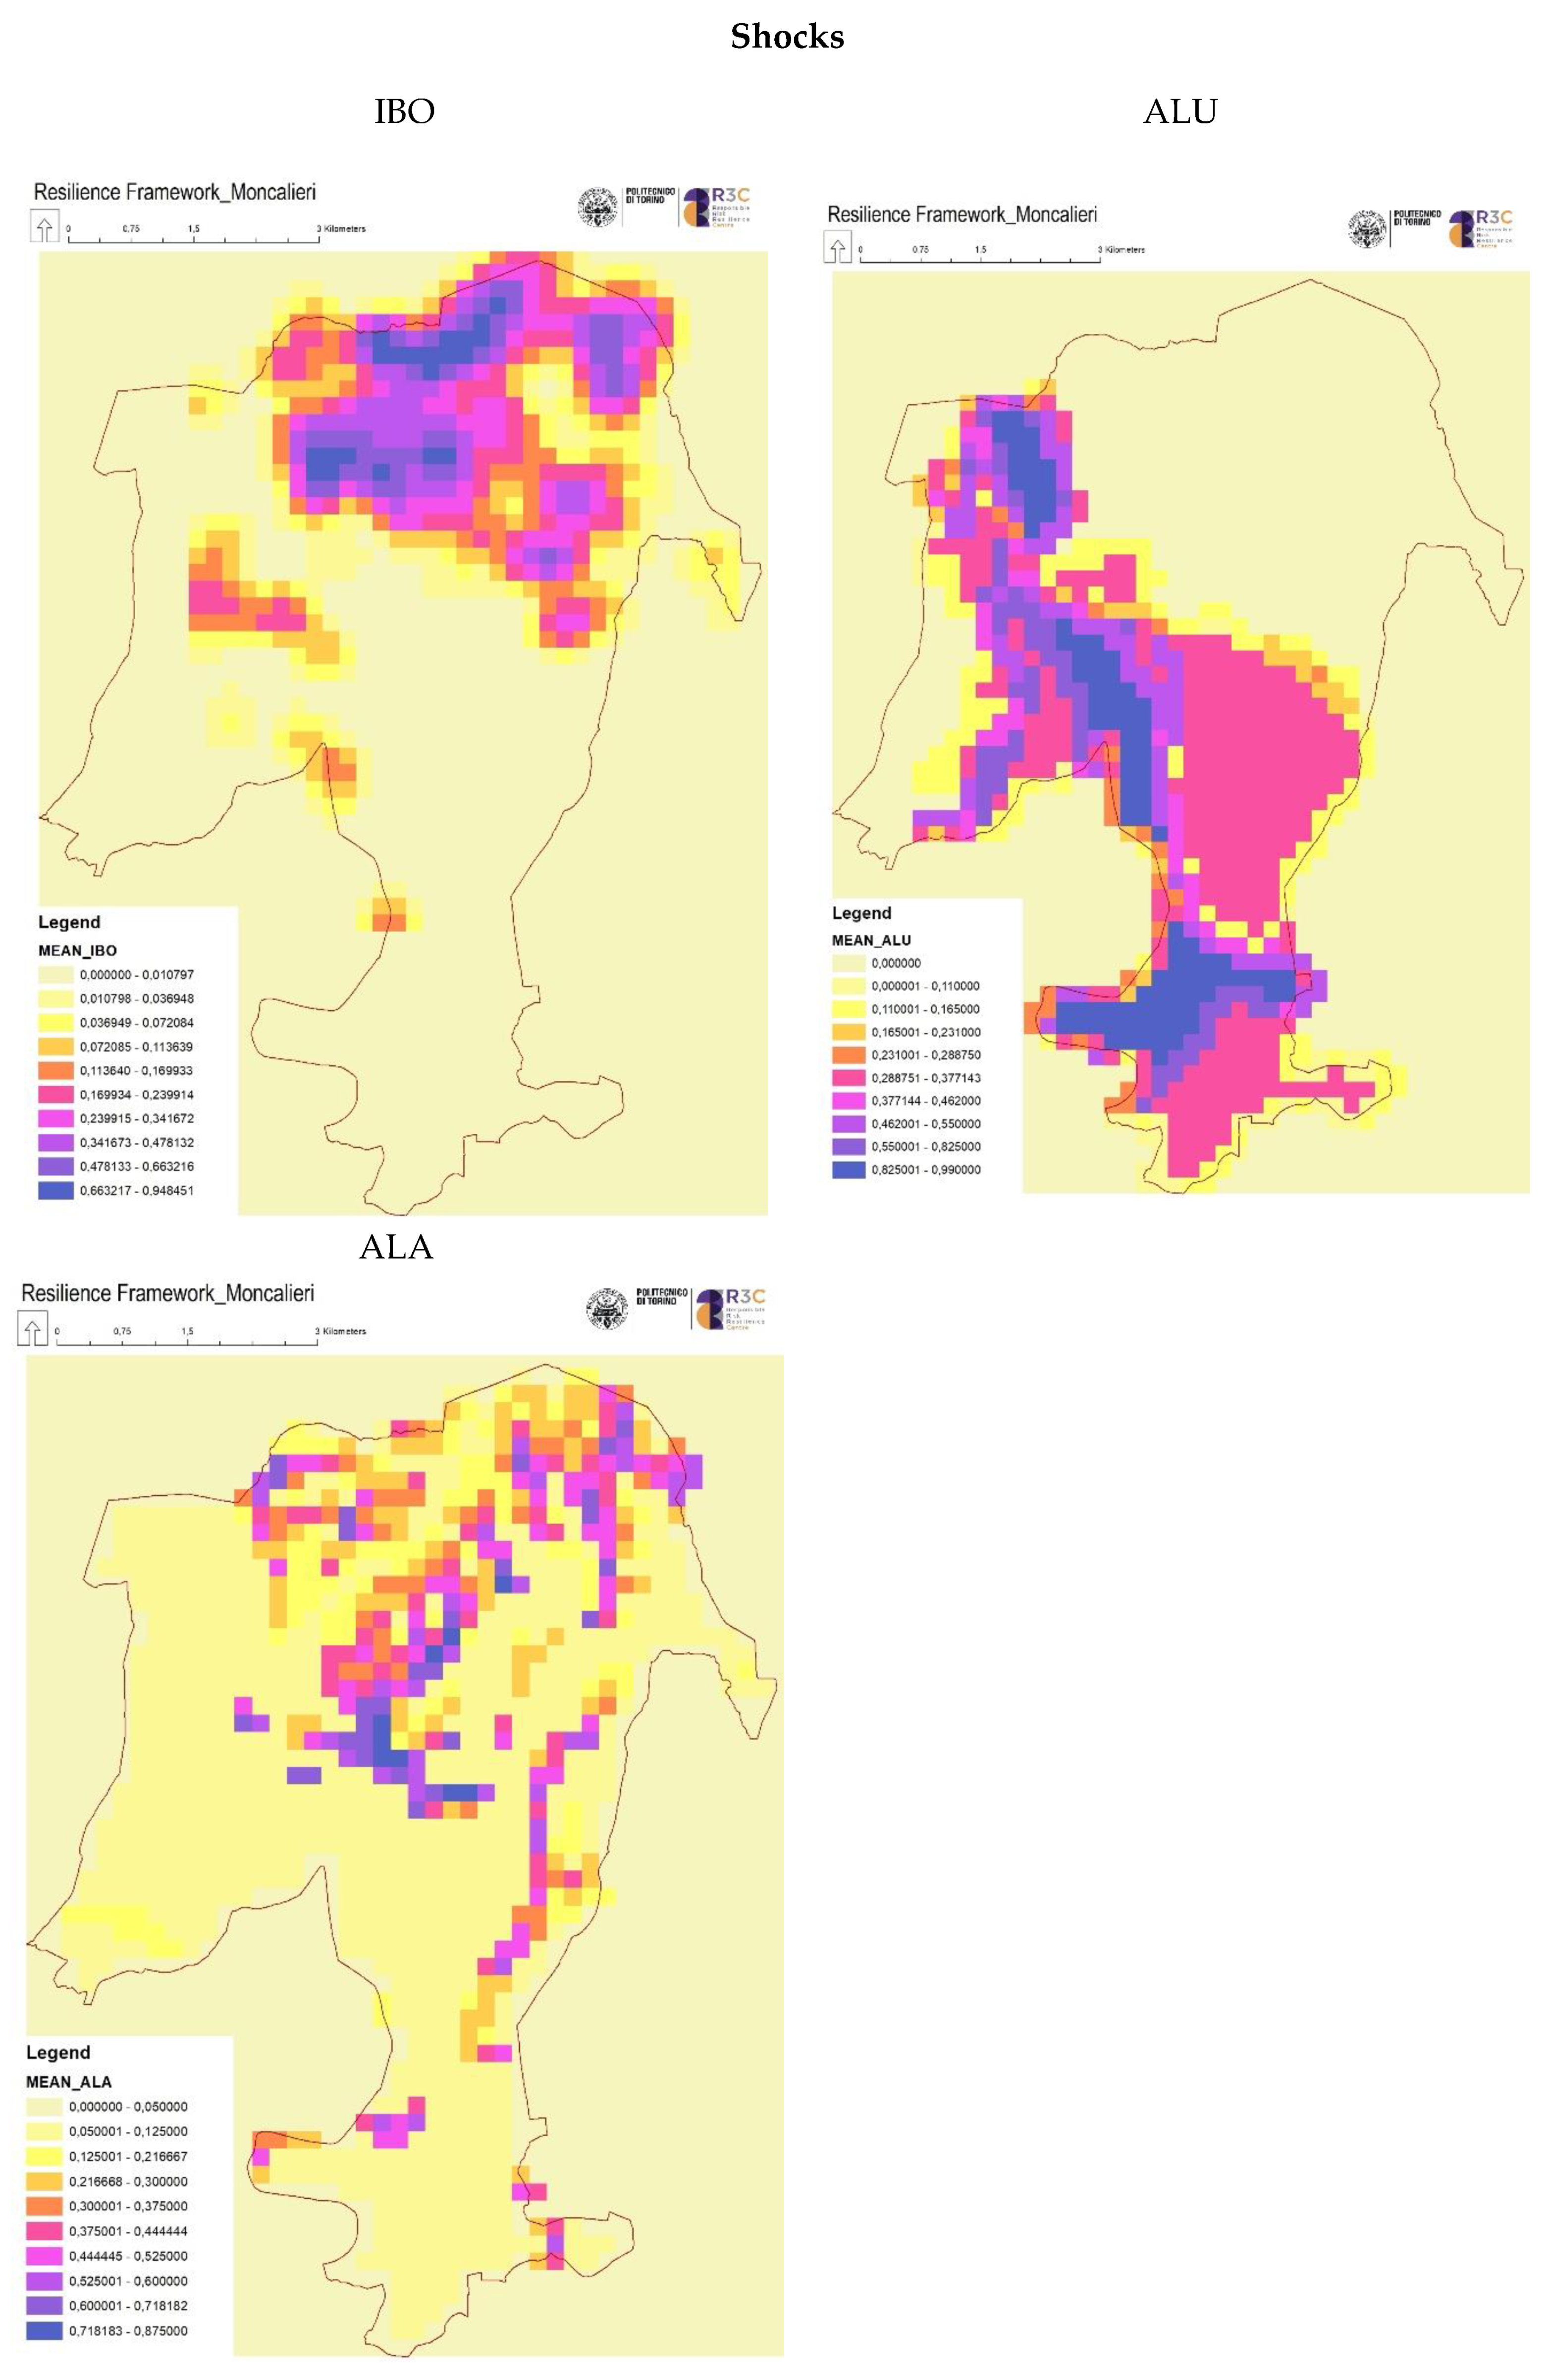
Figure 6.
Boxplot of sensitivities, disturbances, and shocks.
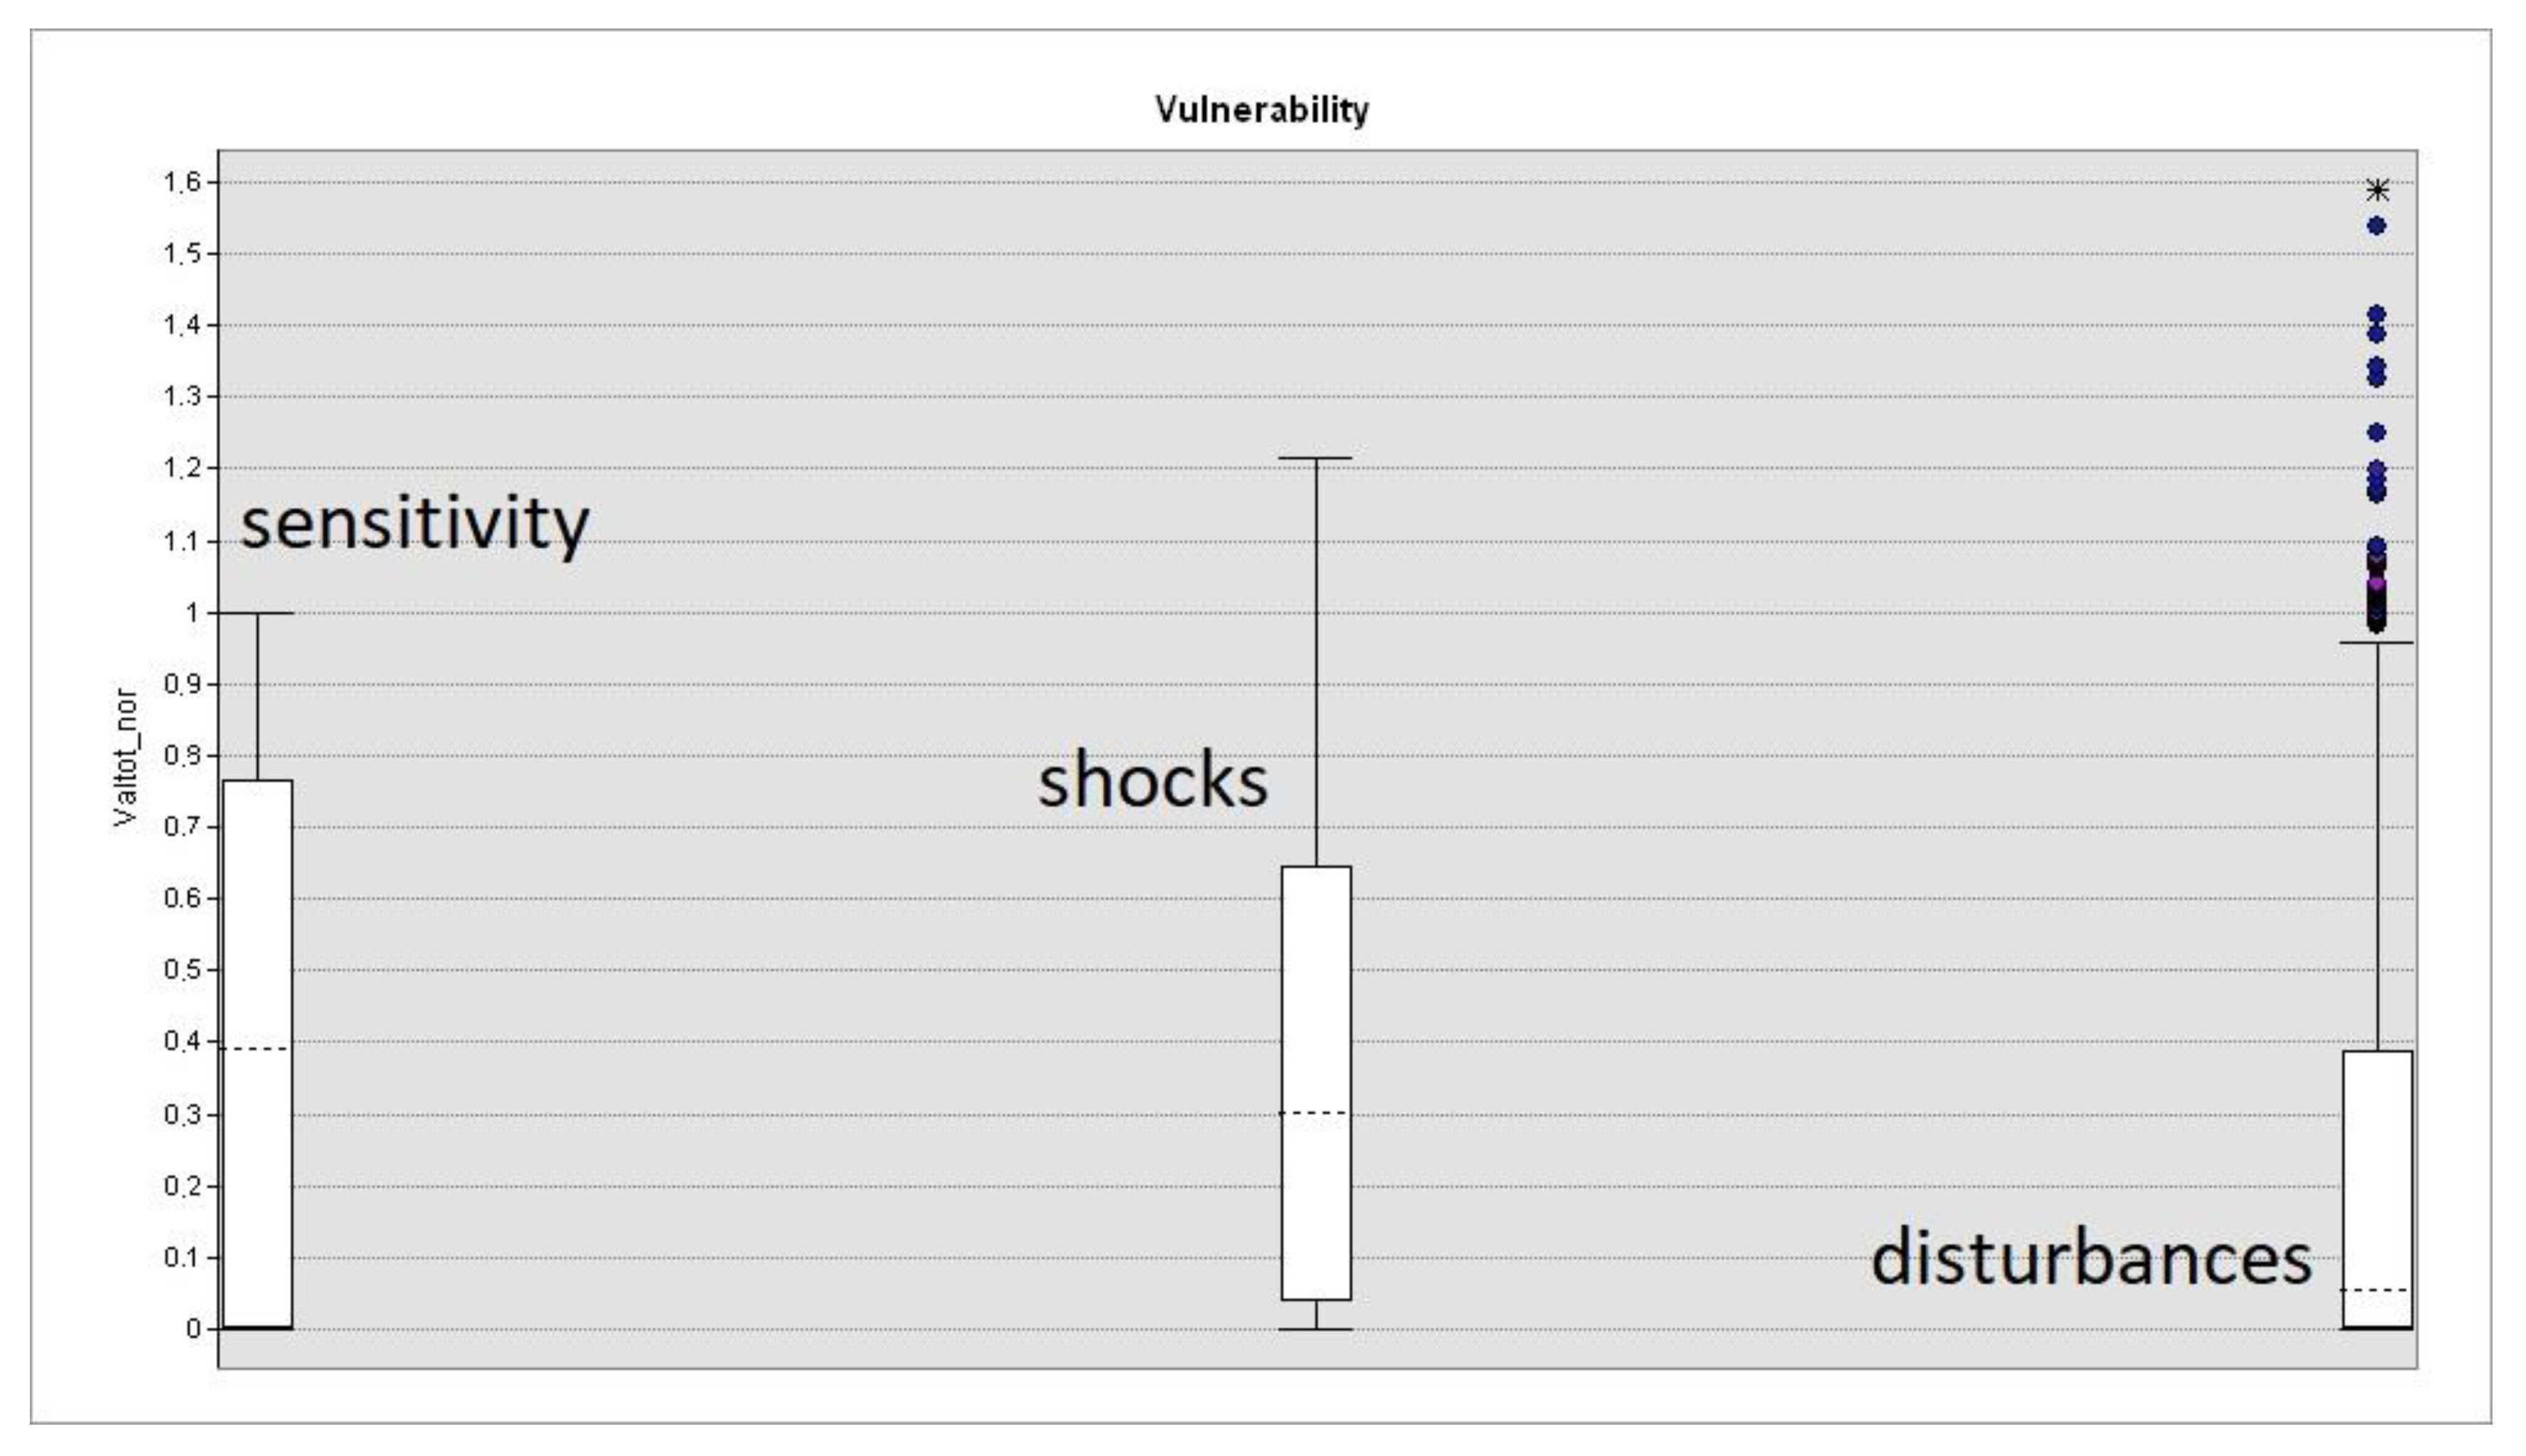
Figure 7.
Vulnerable areas.


Table 1.
List of indicators of vulnerability.
| State of the System | |||||
| Sensitivity | |||||
| Indicator | Structure | Source | Year | Unit | |
| IMP | Imperviousness | Impermeable surface/pixel | Existent | 2012 | % |
| IFI | Ecological Fragmentation | Infrastructure length * weight/pixel | R3C | 2016 | % |
| HQ | Habitat Quality | Value habitat/pixel | (InVEST) | 2010 | % |
| CS | Carbon Sequestration | Tons C02/pixel | (InVEST) | 2010 | num |
| WY | Water Yield | Mm * year/pixel | (InVEST) | 2010 | num |
| SH | Landscape Diversity | n.patches * area/pixel | R3C | 2010 | % |
| Pressures on the System | |||||
| Disturbances | |||||
| NDR | Nutrient Contamination | Kg nutrients * pixel/year | (InVEST) | 2010 | num converted in % |
| SDR | Erosion | Tons eroded * pixel/year | (InVEST) | 2010 | num converted in % |
| CDS | Land Take | Built up areas between 1990 and 2016 | R3C | 2016 | % |
| Shocks | |||||
| IBO | Fires | Buildings near forested areas/pixel | R3C | 2010 | % |
| ALU | Flooding | Flooding risk/pixel | R3C | 2006 | % |
| ALA | Flows | Run-off/pixel | (InVEST) | 2010 | % |
Table 2.
Land use composition in Moncalieri
| Land Use | Land Use/Cover Type | Surface (ha) | Land Use Index (%) |
| Antropic | 1638.87 | 34.48% | |
| Agricultural | 1838.60 | 38.68% | |
| Natural and Seminatural | 654.44 | 13.77% | |
| Other (green) | 173.21 | 3.64% | |
| Infrastructures | 294.33 | 6.19% | |
| Water | 153.54 | 3.23% | |
| 4752.99 | 100.00% | ||
| Land cover | Impermeable | 1276.94 | 26.87% |
| Permeable | 3476.05 | 73.13% | |
| 4752.99 | 100.00% |
© 2019 by the authors. Licensee MDPI, Basel, Switzerland. This article is an open access article distributed under the terms and conditions of the Creative Commons Attribution (CC BY) license (http://creativecommons.org/licenses/by/4.0/).
Share and Cite
MDPI and ACS Style
Brunetta, G.; Salata, S. Mapping Urban Resilience for Spatial Planning—A First Attempt to Measure the Vulnerability of the System. Sustainability 2019, 11, 2331. https://doi.org/10.3390/su11082331
AMA Style
Brunetta G, Salata S. Mapping Urban Resilience for Spatial Planning—A First Attempt to Measure the Vulnerability of the System. Sustainability. 2019; 11(8):2331. https://doi.org/10.3390/su11082331
Chicago/Turabian StyleBrunetta, Grazia, and Stefano Salata. 2019. "Mapping Urban Resilience for Spatial Planning—A First Attempt to Measure the Vulnerability of the System" Sustainability 11, no. 8: 2331. https://doi.org/10.3390/su11082331
Note that from the first issue of 2016, this journal uses article numbers instead of page numbers. See further details here.