Using Decision Tree to Predict Response Rates of Consumer Satisfaction, Attitude, and Loyalty Surveys

1
Department of Psychology and Behavioral Sciences, Zhejiang University, Hangzhou 310028, China
2
Department of Psychological Science, University of California, Irvine, CA 92697, USA
3
Zhejiang Big Data Exchange Center, Jiaxing 314501, China
*
Authors to whom correspondence should be addressed.
Sustainability 2019, 11(8), 2306; https://doi.org/10.3390/su11082306
Submission received: 21 March 2019
/
Revised: 12 April 2019
/
Accepted: 15 April 2019
/
Published: 17 April 2019
Abstract
:Response rate has long been a major concern in survey research commonly used in many fields such as marketing, psychology, sociology, and public policy. Based on 244 published survey studies on consumer satisfaction, loyalty, and trust, this study aimed to identify factors that were predictors of response rates. Results showed that response rates were associated with the mode of data collection (face-to-face > mail/telephone > online), type of survey sponsors (government agencies > universities/research institutions > commercial entities), confidentiality (confidential > non-confidential), direct invitation (yes > no), and cultural orientation (individualism > collectivism). A decision tree regression analysis (using classification and regression Tree (C&RT) algorithm on 80% of the studies as the training set and 20% as the test set) revealed that a model with all above-mentioned factors attained a linear correlation coefficient (0.578) between the predicted values and actual values, which was higher than the corresponding coefficient of the traditional linear regression model (0.423). A decision tree analysis (using C5.0 algorithm on 80% of the studies as the training set and 20% as the test set) revealed that a model with all above-mentioned factors attained an overall accuracy of 78.26% in predicting whether a survey had a high (>50%) or low (<50%) response rate. Direct invitation was the most important factor in all three models and had a consistent trend in predicting response rate.
1. Introduction
A high response rate is essential to the success of survey research in many fields such as marketing, sociology, psychology, public policy, and public health [1]. A low response rate is likely to introduce nonresponse bias and hence lower the external validity or generalizability of the survey results, because respondents and nonrespondents typically differ in the variables of interest [2]. The importance of high response rates is especially salient for consumer and marketing survey research because service organizations and firms need to gauge accurately customers’ attitudes toward services or products (e.g., satisfaction, loyalty, and trust). These attitudes play an important role in determining long-term customer behavior and subsequently the success of firms and service organizations in terms of customer retention and market share [3,4]. Attracting new customers is considerably more expensive than retaining old customers [5]. Firms and service providers need valid survey results in order to make decisions about their efforts at increasing customer retention. Unfortunately, past decades have witnessed declining response rates in all forms of business and academic research [6,7], so it is imperative to understand factors that influence response rates.
Response rates in survey research can be influenced by many factors, including societal factors, individual participants’ characteristics, and attributes of the survey design [8]. Societal factors include cultural values (e.g., individualism and collectivism) [9], social cohesion [8], and survey fatigue due to extensive survey research [10]. Individual characteristics include sociodemographic factors (e.g., age, gender, income, health status, race) [8,11,12,13,14], past experience with a given product or service, past experience with surveys in general [15], personal interest in the survey topic [16,17,18,19], and personality characteristics [20,21,22,23]. Survey attributes include mode of data collection (e.g., online survey, telephone interview, face-to-face interview, etc.) [8,24,25,26,27,28], prenotification [29,30,31,32], timing of the invitation [33,34], survey sponsor [35,36,37], incentives [13,16,38,39,40,41,42,43,44], and questionnaire design (e.g., layout, length, and content) [16,45,46,47].
Some of the above studies were experimental studies that investigated whether one or more factors were effective in raising response rates [38,48,49], whereas other studies were either quantitative or qualitative analysis of response rates of existing studies as a function of factors such as mode of data collection as mentioned earlier [14,16,24,39,50,51,52,53]. Some researchers [24,39] have also integrated previous findings and constructed regression models to predict response rates. Although there has been much research on the influence of various factors on response rates, Helgeson et al. [54] concluded that “any reading of this large body of works leads to the conclusion that few survey design factors have a consistent and significant effect on observed response rates” (p. 305).
In order to improve on previous attempts at understanding the factors influencing response rates, this study used a decision tree approach (with a training set and a test set of studies) to quantitatively analyze the influence of survey attributes on response rates in a large number of published studies. A decision tree approach has several advantages over the traditional logistic regression: Automatic consideration of potential interactive effects among predictors, high tolerance of multicollinearity, intuitive guidance for application of the results in decision making (ranked priority or importance of factors, cutoff point for continuous predictors), and automatic exclusion of unimportant factors. Two main sets of analyses were conducted, with the first treating the dependent variable—response rate—as a continuous variable (the decision tree regression model) and the second treating the response rate as a dichotomized variable (the decision tree classification analysis). These results were further compared to those based on traditional linear and logistic regression analyses.
2. Materials and Methods
2.1. Sample of Studies
In this study, we focused on previous survey studies of consumer satisfaction, loyalty, and attitudes about particular topics or trust in service organizations. We conducted searches using major electronic reference databases, including ERIC, JSTOR, MEDLINE, PsycARTICLES, PsycINFO, Science Direct, Social Science Abstracts, Sociological Abstracts, and Web of Science (Social Science Citation Index). We used three clusters of key words for the searches: (1) “questionnaire” or “survey”; (2) “response rate”, “return rate”, or “participation rate”; and (3) “satisfaction”, “loyalty”, “attitude”, or “trust”. The search results were examined for their relevance and the selected studies’ lists of references were further investigated for additional potentially relevant studies. The searches yielded 450 studies, covering a wide range of topics in many sectors of the service industry such as restaurants, hotels, hospitals, telecommunications, websites, etc. These studies were closely examined for their reports of survey attributes. Studies with limited information on the survey attributes (see below) were excluded from further analyses, yielding a final sample of 244 studies.
2.2. Coding of Main Variables
The main outcome variable of this study was response rate. Its calculation is deceptively simple—the number of valid surveys returned over the total number of people surveyed. As Groves and Lyberg [55] pointed out, there were actually many ways of calculating response rates because the total number of people surveyed was subject to different interpretations (those who were initially contacted or those who expressed initial interest or those who were followed up with the actual surveys). In this study, we used the minimum response rate, which is the number of completed surveys divided by the number of surveys returned (completed or partially completed) plus the number of nonsurveys (refusals, breakoffs, or noncontacts) plus all cases of unknown eligibility. Although many studies did not report a breakdown of the specific numbers of partially completed surveys, refusals, break-offs, noncontacts, etc., the minimum response rate could be calculated based on the total number of surveys initially sent out and the final number of completed surveys.
We recorded and coded nine survey attributes or features of each survey study: Mode of data collection, type of survey sponsors, incentives, questionnaire length, relevance of the survey topic to the respondents, sensitivity of the topic, confidentiality, direct invitation, and country or region. These features were selected because they have been shown to be important in previous studies [21,56] and because they could be coded in the studies we found. Table 1 describes the coding categories of these survey attributes as well as their descriptive statistics.
Although there are a number of modes of data collection or survey methods including face-to-face interviews, mails, telephone, internet, e-mail, or other social media platforms, previous research has demonstrated that response rates varied from high to low for three modes of data collection: Face-to-face interviews, mail surveys, and telephone or web surveys [57,58,59].We coded our studies into four major categories: Face-to-face interviews, mail surveys, telephone, and online surveys.
The type of survey sponsors was classified into three categories following Reference [31]: Government agencies, universities and other research institutions or non-profit organizations, and companies and other commercial institutions.
Incentives for participation were coded in terms of the amount of money offered to the respondents.
Questionnaire length was coded based on the number of questions or items included in the surveys reported in the studies.
Whether the survey topic was of relevance to the respondents was determined according to whether potential respondents had direct experience with the particular services or products covered by the surveys. Goyder [60] showed that such past experience increased survey participation.
The surveys were coded for whether they covered sensitive topics. Albaum and Smith [59] defined sensitive topics as those that possess a substantial threat to the survey participants either because they are intrusive to their privacy or because they could raise fears about potential repercussions/consequences of disclosing the information requested, including financial assets, sexual behaviors, illegal drug use, etc. Singer [61,62] has argued that privacy-related sensitive topics would seem intrusive to potential respondents and thus lower participation rates.
Confidentiality was coded based on whether the survey was confidential (or anonymous) or not confidential.
Direct invitation for surveys meant that researchers invited participants via face-to-face contact or telephone, whereas indirect invitation was via mail or e-mail, following the definition used by Bowling [57]. In an earlier, study, Groves and Couper [8] found that direct invitation led to higher participation rates.
Finally, we coded the country or region based on where the surveys were conducted. Most of the studies were conducted in USA (31.89%), followed by China (11.89%), Taiwan/China (10.81%), and Korea (9.73%), with the remaining studies conducted in other countries or regions. Previous research has focused mainly on the influence of individualism/collectivism on response rates [9,21]. These studies simply classified European countries and America as individualistic countries, and Asian countries (e.g., China) as collectivistic countries. In this study, we used specific values of the Hofstede’s individualism/collectivism dimension [63] for each country.
2.3. Methods
We first analyzed the influence of each survey attributes on response rates by performing ANOVA in SPSS 22.0. Then, we constructed a decision tree regression model by applying the classification and regression tree (C&RT) algorithm and a linear regression model with the response rate as the dependent variable and all attributes as predictors in IBM SPSS Modeler 18.0. Finally, we used 50% as the cutoff point to divide our sample studies into those with ‘high’ response rates and those with ‘low’ response rates, and the decision tree classification model was constructed with all useful attributes as predictors by applying the C5.0 algorithm. The cutoff of 50% was selected because it was near the mean response rate in our study (also see Reference [64]). C5.0 is one of the classic decision tree algorithms. It can learn to predict discrete outputs based on the values of the inputs it receives. Whether the inputs are linear data or nonlinear data, and even with missing values, C5.0 could perform robustly. C5.0 splits the sample based on the field of the maximum information gain (entropy) brought by the input variable. Information entropy reflects the degree of information clutter, and the more impure the information is, the larger the information entropy is. Finally, C5.0 generates a decision tree or rule set with very straightforward explanations.
3. Results
After coding the data, two survey attributes were found to lack information or variations. Only 37 of the 244 studies provided information about incentives, and very few studies (2.87%) covered sensitive topics such as financial assets, sexual behaviors, and illegal drug use (see Table 1). These two variables were not used in subsequent analyses.
We performed ANOVA by using SPSS 22.0 and found that five of the remaining seven factors showed significant associations with response rates in the expected direction (Figure 1, Figure 2, Figure 3, Figure 4 and Figure 5). First, the mode of data collection was a significant factor, F(3, 238) = 60.460, p < 0.001, with highest response rates for face-to-face interviews (M = 77.81%), followed by mail surveys (M = 56.19%) and telephone surveys (M = 55.77%), and lowest response rates for online surveys (M = 24.20%) (Figure 1). Post hoc comparisons (all Bonferroni corrected) showed that the difference in response rates between telephone surveys and mail surveys was not significant (p = 0.128), but the differences between other modes of data collection were significant, p ≤ 0.001. Second, the type of survey sponsors was also a significant factor, F (2, 240) = 9.233, p < 0.001. As shown in Figure 2, the mean response rate of surveys sponsored by government agencies was the highest (M = 93.50%), followed by those sponsored by universities and research institutions (M = 52.05%), and then by those sponsored by commercial institutions (M = 29.79%). Post hoc analysis showed that the three types of sponsors differed significantly from one another, p < 0.05. Third, confidential surveys showed higher response rates (M = 60.33%) than non-confidential surveys (M = 47.44%), F(1, 173) = 4.342, p = 0.039 (Figure 3). Fourth, direct invitation was significantly associated with higher response rates, F(1, 235) = 109.315, p < 0.001. The mean response rate was 65.41% when invitations for participation were through either face-to-face contact or phone, but only 29.65% when they were sent by mail or email (Figure 4). Finally, the individualism and collectivism index of the countries or regions where surveys were conducted was correlated with response rates, r = −0.379, p < 0.001. Greater individualism was linked to lower response rates.
Contrary to our hypothesis, relevance of the topics was associated with lower response rates, F (1, 240) = 4.339, p = 0.038, with a mean response rate of 59.95% for studies on non-relevant topics and 49.43% for studies of relevant topics (Figure 5). Finally, the correlation between the number of items and response rates was not significant, r = 0.046, p = 0.478. We also examined non-linear relations between the two variables and found no significant results.
4. Predicting Response Rates
In the previous section, we examined bivariate relations between survey attributes and response rates and identified significant survey attributes influencing response rates. In this section, we used all attributes to construct a decision tree regression model to predict response rate as a continuous variable. The classification and regression tree (C&RT) algorithm implemented in IBM SPSS Modeler 18.0 was used to construct the prediction model. The data were divided into the training set (80%) and the test set (20%). Results showed that the linear correlation coefficient between the predicted values of decision tree regression model and actual values was 0.722 in the training set and the linear correlation coefficient was 0.578 in the test set.
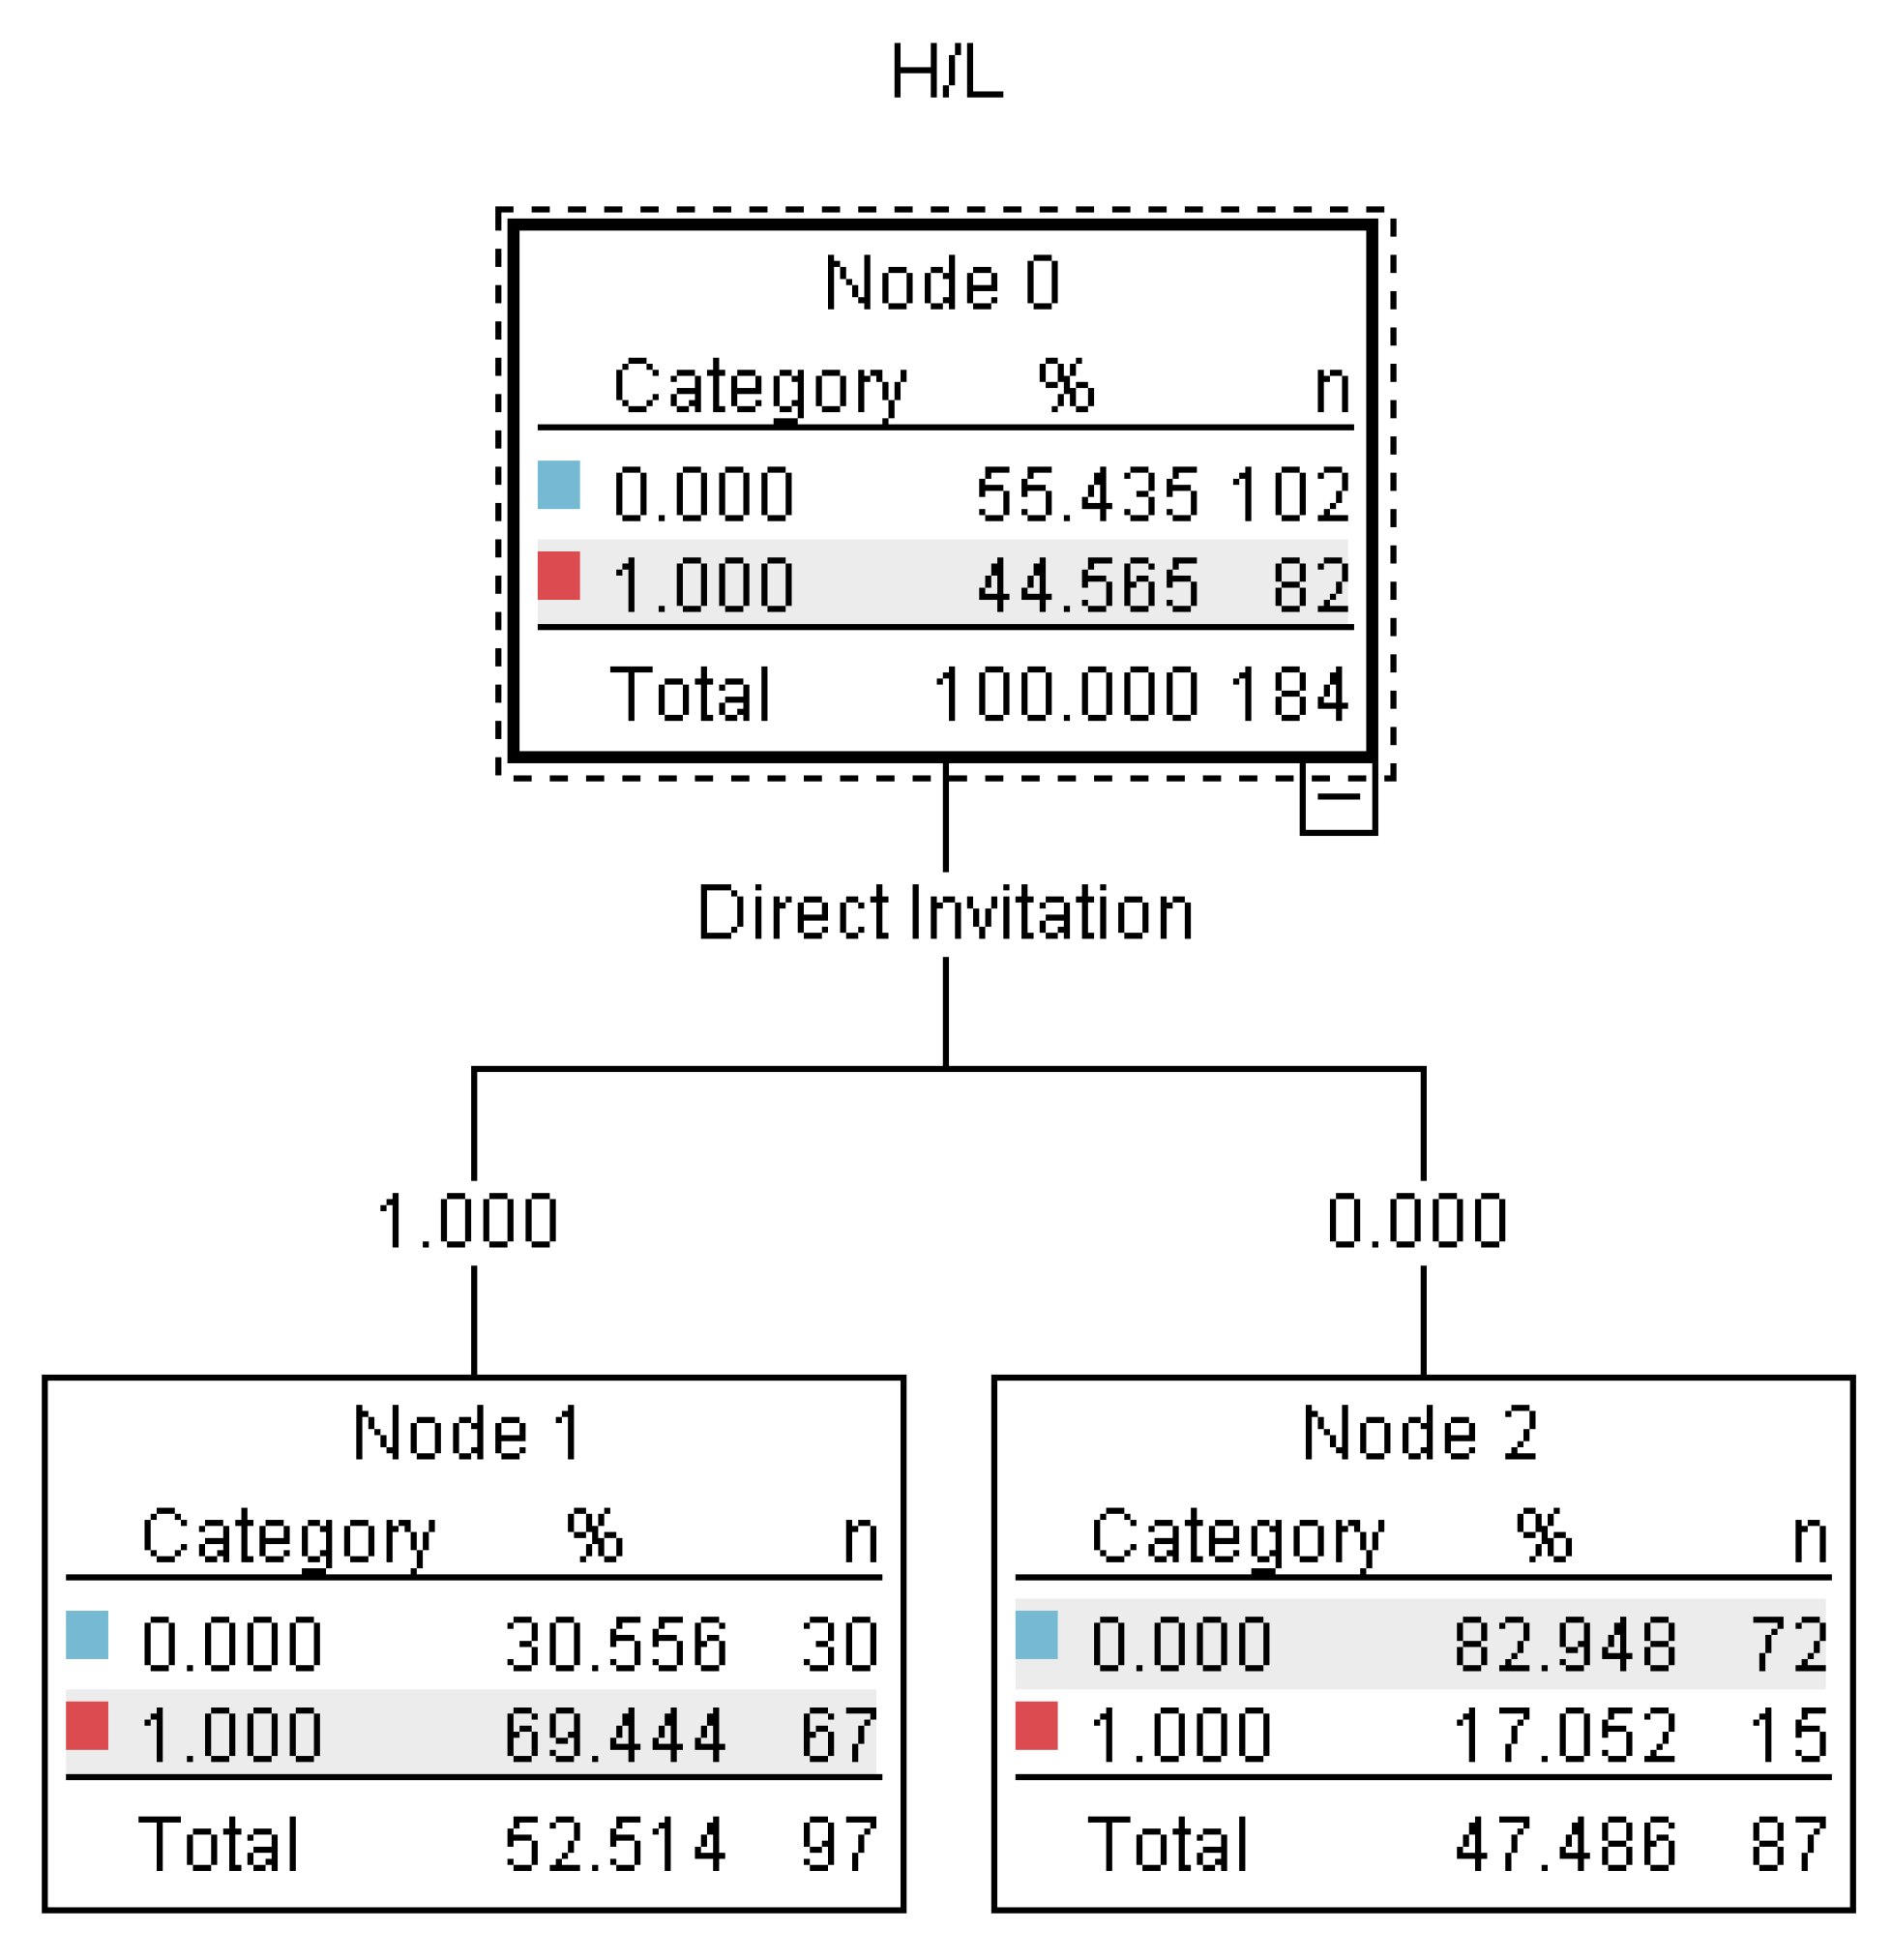
Of all the predictors, direct invitation had by far the highest importance, whereas all other attributes (i.e., mode of data collection, confidentiality, relevance of topics, type of survey sponsors, and questionnaire length) had similarly low levels of importance. After pruning, only direct invitation remained as a significant factor (see Figure 6).
We then compared our decision tree regression model with a prediction model based on traditional linear regression. The results of the traditional linear regression were: F (7,88) = 9.273, p < 0.001, adjusted R2 = 0.379. The correlation coefficient between the predicted values of the traditional linear regression model and actual values was 0.615 in the training set and 0.423 in the test set, both of which were lower than the corresponding coefficients of our regression tree model (see Table 2).
Consistent with the results of the decision tree model, direct invitation had the highest importance (β = 0.498, p < 0.001). But the second most important attribute was confidentiality (β = 0.159, p = 0.058) and the third was mode of data collection (β = −0.154, p = 0.066).
5. Predicting High and Low Response Rates
In the previous section, we used all attributes to construct a decision tree regression model to predict response rates as a continuous variable. Because survey researchers typically aim for a response rate above a threshold [64] and the average response rate of published surveys was 52.7% [64], we used 50% as the cutoff point to divide our studies into those with “high” response rates (i.e., at or above the threshold, n = 110 studies) and those with “low” response rates (i.e., below the threshold, n = 134). C5.0 algorithm implemented in IBM SPSS Modeler 18.0 was used to construct the prediction model. The data were divided into the training set (80%) and the test set (20%).
Results showed that the prediction model’s overall accuracy in the test set was 78.26% with the C5.0 algorithm (Table 3).
Of all the predictors, direct invitation had the highest importance, followed by mode of data collection and individualism. The length of survey was also important. Figure 7 shows the details of the decision tree and Figure 8 was the decision tree after pruning. Results showed that “high” response rates were obtained when using direct invitation (70% with direct invitations vs. 17% without). Of those with direct invitations, face-to-face interview and mail survey led to “high” response rates for 78% and 73% of the studies as compared to 50% and 0% for telephone and online surveys. For telephone surveys, individualism was a key factor, with lower individualism countries (59 or lower scores) leading to “high” response rates (69%), whereas all five surveys conducted in higher individualism countries showed “low” response rates. For face-to-face interviews, the length of survey was a key factor, with shorter surveys (fewer than 39 items) leading to “high” response rates (all seven studies, 100%), whereas all longer surveys (more than 39 items) showed “low” response rates.
Finally, we compared our decision trees model with a prediction model based on traditional logistic regression. Results showed that the overall accuracy with the testing dataset was 73.10%, which was lower than the accuracy of our model (78.26%). Consistent with the results of the decision tree model, direct invitation had the highest importance (β = 2.506, p = 0.002), followed by mode of data collection (p = 0.582), and type of survey sponsors (p = 0.741).
6. Discussion
Previous studies have identified a number of factors influencing participation rates in survey research, including societal factors, individual participants’ characteristics, and surveys’ attributes [8]. The current study aimed to improve on previous research by using a decision tree approach to predict both continuous and dichotomized response rates from surveys’ attributes. After identifying 244 relevant surveys and extracting nine survey attributes from each study, we found seven usable attributes (i.e., mode of data collection, type of survey sponsor, relevance of the topic, confidentiality, direct invitation, length of survey, and collectivism/individualism orientation of the country or region). First, a decision tree regression model was trained with 80% of the data and tested with the remaining 20% of the data to predict response rate. Results showed that the decision tree regression model achieved a higher linear correlation coefficient (0.578) between the predicted values and actual values than a traditional linear regression model, and direct invitation had the highest importance in both models predicting response rate. We further trained a decision tree model with 80% of the data and tested with the remaining 20% of the data to predict high or low response rate with 50% as the cutoff point. Results showed an accuracy of 78.26% on the test dataset. The most important factor was also whether surveys used direct invitation. Within surveys with direct invitations, mode of data collection was also a crucial factor, favoring face-to-face or mail surveys over telephone or online surveys. Within telephone surveys, surveys conducted in low-individualism countries were more likely to obtain high response rates. Within face-to-face interviews, the length of survey became a crucial factor, with 39 items as the cutoff point.
Although the current study did not examine any new factors affecting response rates as compared to previous studies, it used a new approach—the decision tree approach—that has several advantages over previous studies: Automatic consideration of potential interactive effects among predictors, high tolerance of multicollinearity, and intuitive guidance for application of the results in decision making (ranked priority or importance of factors, cutoff point for continuous predictors). Indeed, our results differed from previous studies in several ways. Our models performed better than traditional models. Furthermore, our models are simpler (after pruning). For example, several factors (i.e., mode of data collection, type of survey sponsors, confidentiality, individualism vs. collectivism) showed significant effects at the bivariate level, which was consistent with previous literature [57,58,59], but they were not of importance in our decision tree models.
Our results can be explained by Furse’s [65] extension of the classic cognitive dissonance theory [66] to survey participation. According to the cognitive dissonance theory, when people sense a dissonance in their own cognitive elements (e.g., views, thoughts, opinions, desires, or intentions), they feel an unpleasant state of tension, which would motivate them to change some of the cognitive elements in order to reduce or eliminate the dissonance-induced tension. Although Hackler and Bourgett [67] initially suggested to increase survey participation by creating “a dissonance that could be resolved by returning the questionnaire to the researcher”, Furse [65] provided a detailed description of the role of cognitive dissonance in survey participation as a sequence of decisions. Albaum’s [57] model is able to integrate much of the empirical literature on inducement techniques used in survey research. In terms of our results, the decision process within the potential respondents’ mind was triggered by the invitation for participation, with a direct invitation generating a greater tension (or dissonance with a person’s self-belief of being helpful) than an indirect invitation. After agreeing to the direct invitation, there was a dissonance if the potential participants were thinking of not following through and completing the survey. This dissonance seemed to be greater for face-to-face interviews and mail surveys than for telephone and online surveys, perhaps due to direct and personalized contact for the former. Finally, for face-to-face interviews, the length of the survey was a major factor. Peytchev [47] also found that page and question characteristics (e.g., number of items) had a stronger influence on survey break-off than respondent characteristics. Based on our results, the critical length was 39 items.
Although our study shed new light on important factors influencing survey response rates, two main limitations of this study need to be mentioned to guide future research. First, our study focused on a subarea of survey research (mainly related to consumer satisfaction and product loyalty and trust), so it is not clear whether our findings can be generalized to broader social research, which may involve more sensitive questions, greater compensations or incentives, or longer surveys. Second, we focused on survey attributes because of they are within the control of survey researchers, but other types of factors (e.g., societal and individual participants’ characteristics [8]) may also need to be considered for particular types of surveys.
Author Contributions
Conceptualization, Q.W., J.H., M.F., and S.Y.; methodology, J.H., M.F., and S.Y.; software, J.H.; formal analysis, J.H.; investigation, J.H., M.F., and S.Y.; resources, J.H., M.F., and S.Y.; writing—original draft preparation, J.H.; writing—review and editing, X.Q., C.C., and J.H.; visualization, J.H.; supervision, Q.W. and X.Q.; project administration, J.H., M.F., and S.Y.; funding acquisition, X.Q.
Funding
This work was supported by the Project (No. YB2015100036) from Huawei Technologies Co., Led. Shenzhen, China
Conflicts of Interest
The authors declare no conflict of interest. And the funders had no role in the design of the study; in the collection, analyses, or interpretation of data; in the writing of the manuscript, or in the decision to publish the results.
References
- Hox, J.J.; De Leeuw, E.D. A comparison of nonresponse in mail, telephone, and face-to-face surveys. Qual. Quant. 1994, 28, 329–344. [Google Scholar] [CrossRef] [Green Version]
- Groves, R.M. Nonresponse rates and nonresponse bias in household surveys. Public Opin. Q. 2006, 70, 646–675. [Google Scholar] [CrossRef]
- Tsoukatos, E.; Rand, G.K. Path analysis of perceived service quality, satisfaction and loyalty in Greek insurance. Manag. Serv. Qual. Int. J. 2006, 16, 501–519. [Google Scholar] [CrossRef]
- Luarn, P.; Lin, H.H. A Customer Loyalty Model for E-Service Context. J. Electron. Commer. Res. 2003, 4, 156–167. [Google Scholar]
- Reichheld, F.F.; Schefter, P. E-loyalty: Your secret weapon on the web. Harv. Bus. Rev. 2000, 78, 105–113. [Google Scholar]
- Curtin, R.; Presser, S.; Singer, E. Changes in telephone survey nonresponse over the past quarter century. Public Opin. Q. 2005, 69, 87–98. [Google Scholar] [CrossRef]
- De Leeuw, E.; De Heer, W. Trends in household survey nonresponse: A longitudinal and international comparison. Surv. Nonresponse 2002, 41, 41–54. [Google Scholar]
- Groves, R.M.; Cialdini, R.B.; Couper, M.P. Understanding the decision to participate in a survey. Public Opin. Q. 1992, 56, 475–495. [Google Scholar] [CrossRef]
- Petrova, P.K.; Cialdini, R.B.; Sills, S.J. Consistency-based compliance across cultures. J. Exp. Soc. Psychol. 2007, 43, 104–111. [Google Scholar] [CrossRef]
- Porter, S.R.; Whitcomb, M.E.; Weitzer, W.H. Multiple surveys of students and survey fatigue. New Dir. Inst. Res. 2004, 2004, 63–73. [Google Scholar] [CrossRef]
- Busby, D.M.; Yoshida, K. Challenges with Online Research for Couples and Families: Evaluating Nonrespondents and the Differential Impact of Incentives. J Child Fam Stud. 2015, 24, 505–513. [Google Scholar] [CrossRef]
- Dykema, J.; Stevenson, J.; Klein, L.; Kim, Y.; Day, B. Effects of E-Mailed Versus Mailed Invitations and Incentives on Response Rates, Data Quality, and Costs in a Web Survey of University Faculty. Soc. Sci Comput. Rev. 2013, 31, 359–370. [Google Scholar] [CrossRef]
- Patrick, M.E.; Singer, E.; Boyd, C.J.; Cranford, J.A.; McCabe, S.E. Incentives for college student participation in web-based substance use surveys. Addict. Behav. 2013, 38, 1710–1714. [Google Scholar] [CrossRef] [PubMed]
- Shih, T.H.; Fan, X.T. Comparing response rates from Web and mail surveys: A meta-analysis. Field Methods 2008, 20, 249–271. [Google Scholar] [CrossRef]
- Dillman, D.A. Presidential address: Navigating the rapids of change: Some observations on survey methodology in the early twenty-first century. Public Opin. Q. 2002, 66, 473–494. [Google Scholar] [CrossRef]
- Edwards, P.J.; Roberts, I.; Clarke, M.J.; DiGuiseppi, C.; Wentz, R.; Kwan, I.; Cooper, R.; Felix, L.M.; Pratap, S. Methods to increase response to postal and electronic questionnaires. Cochrane Database Syst. Rev. 2009, 3. [Google Scholar] [CrossRef]
- Haunberger, S. Explaining Unit Nonresponse in Online Panel Surveys: An Application of the Extended Theory of Planned Behavior. J. Appl. Soc. Psychol. 2011, 41, 2999–3025. [Google Scholar] [CrossRef]
- McCambridge, J.; Kalaitzaki, E.; White, I.R.; Khadjesari, Z.; Murray, E.; Linke, S.; Thompson, S.G.; Godfrey, C.; Wallace, P. Impact of length or relevance of questionnaires on attrition in online trials: Randomized controlled trial. J. Med. Internet Res. 2011, 13, e96. [Google Scholar] [CrossRef]
- Zillmann, D.; Schmitz, A.; Skopek, J.; Blossfeld, H.P. Survey topic and unit nonresponse. Qual. Quant. 2014, 48, 2069–2088. [Google Scholar] [CrossRef]
- Bruggen, E.; Dholakia, U.M. Determinants of Participation and Response Effort in Web Panel Surveys. J. Interact. Mark. 2010, 24, 239–250. [Google Scholar] [CrossRef]
- Fan, W.M.; Yan, Z. Factors affecting response rates of the web survey: A systematic review. Comput. Hum. Behav. 2010, 26, 132–139. [Google Scholar] [CrossRef]
- Porter, S.R.; Whitcomb, M.E. Non-response in student surveys: The role of demographics, engagement and personality. Res High. Educ. 2005, 46, 127–152. [Google Scholar] [CrossRef]
- Marcus, B.; Schütz, A. Who are the people reluctant to participate in research? Personality correlates of four different types of nonresponse as inferred from self-and observer ratings. J. Personal. 2005, 73, 959–984. [Google Scholar] [CrossRef] [PubMed]
- Cook, C.; Heath, F.; Thompson, R.L. A meta-analysis of response rates in Web- or internet-based surveys. Educ. Psychol. Meas. 2000, 60, 821–836. [Google Scholar] [CrossRef]
- Couper, M.P. The Future of Modes of Data Collection. Public Opin. Q. 2011, 75, 889–908. [Google Scholar] [CrossRef] [Green Version]
- De Leeuw, D. To mix or not to mix data collection modes in surveys. J. Off. Stat. 2005, 21, 233. [Google Scholar]
- Dillman, D.A.; Phelps, G.; Tortora, R.; Swift, K.; Kohrell, J.; Berck, J.; Messer, B.L. Response rate and measurement differences in mixed-mode surveys using mail, telephone, interactive voice response (IVR) and the Internet. Soc. Sci. Res. 2009, 38, 3–20. [Google Scholar] [CrossRef]
- Kaplowitz, M.D.; Hadlock, T.D.; Levine, R. A comparison of Web and mail survey response rates. Public Opin. Q. 2004, 68, 94–101. [Google Scholar] [CrossRef]
- Bandilla, W.; Couper, M.P.; Kaczmirek, L. The mode of invitation for web surveys. Surv. Pract. 2012, 5, 1–5. [Google Scholar] [CrossRef]
- Beebe, T.J.; Rey, E.; Ziegenfuss, J.Y.; Jenkins, S.; Lackore, K.; Talley, N.J.; Locke, R.G. Shortening a survey and using alternative forms of prenotification: Impact on response rate and quality. BMC Med. Res. Methodol. 2010, 10, 50. [Google Scholar] [CrossRef] [PubMed]
- Bosnjak, M.; Neubarth, W.; Couper, M.P.; Bandilla, W.; Kaczmirek, L. Prenotification in web-based access panel surveys-The influence of mobile text messaging versus e-mail on response rates and sample composition. Soc. Sci. Comput. Rev. 2008, 26, 213–223. [Google Scholar] [CrossRef]
- Keusch, F. How to Increase Response Rates in List-Based Web Survey Samples. Soc. Sci. Comput. Rev. 2012, 30, 380–388. [Google Scholar] [CrossRef]
- Faught, K.S.; Whitten, D.; Green, K.W. Doing survey research on the Internet: Yes, timing does matter. J. Comput. Inf. Syst. 2004, 44, 26–34. [Google Scholar]
- Sauermann, H.; Roach, M. Increasing web survey response rates in innovation research: An experimental study of static and dynamic contact design features. Res. Policy 2013, 42, 273–286. [Google Scholar] [CrossRef]
- Porter, S.R.; Whitcomb, M.E. Mixed-mode contacts in web surveys-Paper is not necessarily better. Public Opin. Q. 2007, 71, 635–648. [Google Scholar] [CrossRef]
- Fang, J.M.; Shao, P.J.; Lan, G. Effects of innovativeness and trust on web survey participation. Comput. Hum. Behav. 2009, 25, 144–152. [Google Scholar] [CrossRef]
- Pan, B.; Woodside, A.G.; Meng, F. How Contextual Cues Impact Response and Conversion Rates of Online Surveys. J. Travel Res. 2014, 53, 58–68. [Google Scholar] [CrossRef]
- Church, A.H. Estimating the effect of incentives on mail survey response rates: A meta-analysis. Public Opin. Q. 1993, 57, 62–79. [Google Scholar] [CrossRef]
- Edwards, P.; Roberts, I.; Clarke, M.; DiGuiseppi, C.; Pratap, S.; Wentz, R.; Kwan, I. Increasing response rates to postal questionnaires: Systematic review. Br. Med. J. 2002, 324, 1183–1185. [Google Scholar] [CrossRef]
- Millar, M.M.; Dillman, D.A. Improving Response to Web and Mixed-Mode Surveys. Public Opin. Q. 2011, 75, 249–269. [Google Scholar] [CrossRef] [Green Version]
- Preece, M.J.; Johanson, G.; Hitchcock, J. Lottery Incentives and Online Survey Response Rates. Surv. Pract. 2013, 3, 3002. [Google Scholar] [CrossRef]
- Rosoff, P.M.; Werner, C.; Clipp, E.C.; Guill, A.B.; Bonner, M.; Dernark-Wahnefried, W. Response rates to a mailed survey targeting childhood cancer survivors: A comparison of conditional versus unconditional incentives. Cancer Epidemiol. Biomark. 2005, 14, 1330–1332. [Google Scholar] [CrossRef] [PubMed]
- Singer, E.; Ye, C. The Use and Effects of Incentives in Surveys. Ann. Am. Acad. Political Soc. Sci. 2013, 645, 112–141. [Google Scholar] [CrossRef]
- Ziegenfuss, J.Y.; Niederhauser, B.D.; Kallmes, D.; Beebe, T.J. An assessment of incentive versus survey length trade-offs in a Web survey of radiologists. J. Med Internet Res. 2013, 15, e49. [Google Scholar] [CrossRef] [PubMed]
- Deutskens, E.; De Ruyter, K.; Wetzels, M.; Oosterveld, P. Response rate and response quality of Internet-based surveys: An experimental study. Mark. Lett. 2004, 15, 21–36. [Google Scholar] [CrossRef]
- Göritz, A.S. Determinants of the starting rate and the completion rate in online panel studies1. Online Panel Res. Data Qual. Perspect. 2014, 154–170. [Google Scholar] [CrossRef]
- Peytchev, A. Survey Breakoff. Public Opin. Q. 2009, 73, 74–97. [Google Scholar] [CrossRef]
- Porter, S.R.; Whitcomb, M.E. The impact of contact type on web survey response rates. Public Opin. Q. 2003, 67, 579–588. [Google Scholar] [CrossRef]
- Tourangeau, R.; Yan, T. Sensitive questions in surveys. Psychol. Bull. 2007, 133, 859–883. [Google Scholar] [CrossRef]
- Cho, Y.I.; Johnson, T.P.; VanGeest, J.B. Enhancing Surveys of Health Care Professionals: A Meta-Analysis of Techniques to Improve Response. Eval. Health Prof. 2013, 36, 382–407. [Google Scholar] [CrossRef]
- Manfreda, K.L.; Bosniak, M.; Berzelak, J.; Haas, I.; Vehovar, V. Web surveys versus other survey modes-A meta-analysis comparing response rates. Int. J. Mark. Res. 2008, 50, 79–104. [Google Scholar] [CrossRef]
- Sheehan, K.B. E-mail survey response rates: A review. J..Comput.-Mediat. Commun. 2001, 6, JCMC621. [Google Scholar] [CrossRef]
- Yarger, J.; James, T.A.; Ashikaga, T.; Hayanga, A.J.; Takyi, V.; Lum, Y.; Kaiser, H.; Mammen, J. Characteristics in response rates for surveys administered to surgery residents. Surgery 2013, 154, 38–45. [Google Scholar] [CrossRef] [PubMed]
- Helgeson, J.G.; Voss, K.E.; Terpening, W.D. Determinants of mail-survey response: Survey design factors and respondent factors. Psychol. Mark. 2002, 19, 303–328. [Google Scholar] [CrossRef]
- Groves, R.M.; Lyberg, L.E. An overview of nonresponse issues in telephone surveys. In Telephone Survey Methodology; John Wiley & Sons, Inc.: New York, NY, USA, 1988; pp. 191–212. [Google Scholar]
- Keusch, F. Why do people participate in Web surveys? Applying survey participation theory to Internet survey data collection. Manag. Rev. Q. 2015, 65, 183–216. [Google Scholar] [CrossRef]
- Bowling, A. Mode of questionnaire administration can have serious effects on data quality. J. Public Health-UK 2005, 27, 281–291. [Google Scholar] [CrossRef] [Green Version]
- Dillman, D.A. Mail and Internet Surveys: The Tailored Design Method; Wiley: New York, NY, USA, 2000. [Google Scholar]
- Albaum, G.; Smith, S.M. Why people agree to participate in surveys. In Handbook of Survey Methodology for the Social Sciences; Springer: New York, NY, USA, 2012; pp. 179–193. [Google Scholar]
- Goyder, J. The Silent Minority: Nonrespondents on Sample Surveys; Westview Press: Boulder, CO, USA, 1987. [Google Scholar]
- Singer, E. Toward a Benefit-Cost Theory of Survey Participation: Evidence, Further Tests, and Implications. J. Off. Stat. 2011, 27, 379–392. [Google Scholar]
- Singer, E. Exploring the Meaning of Consent: Participation in Research and Beliefs about Risks and Benefits. J. Off. Stat. 2003, 19, 273–285. [Google Scholar]
- Hofstede, G. National cultures in four dimensions: A research-based theory of cultural differences among nations. Int. Stud. Manag. Organ. 1983, 13, 46–74. [Google Scholar] [CrossRef]
- Baruch, Y.; Holtom, B.C. Survey response rate levels and trends in organizational research. Hum. Relat. 2008, 61, 1139–1160. [Google Scholar] [CrossRef]
- Furse, D.H.; Stewart, D.W. Manipulating dissonance to improve mail survey response. Psychol. Mark. 1984, 1, 79–94. [Google Scholar] [CrossRef]
- Festinger, L.N.P. Cognitive Dissonance Theory. 1989) Primary Prevention of HIV/AIDS: Psychological Approaches; Sage Publications: Newbury Park, CA, USA, 1957. [Google Scholar]
- Hackler, J.C.; Bourgett, P. Dollars, Dissonance, and Survey Returns. Public Opin. Q. 1973, 37, 276–281. [Google Scholar] [CrossRef]
Figure 1.
Mode of data collection and response rates.

Figure 2.
Type of survey sponsors and response rates.
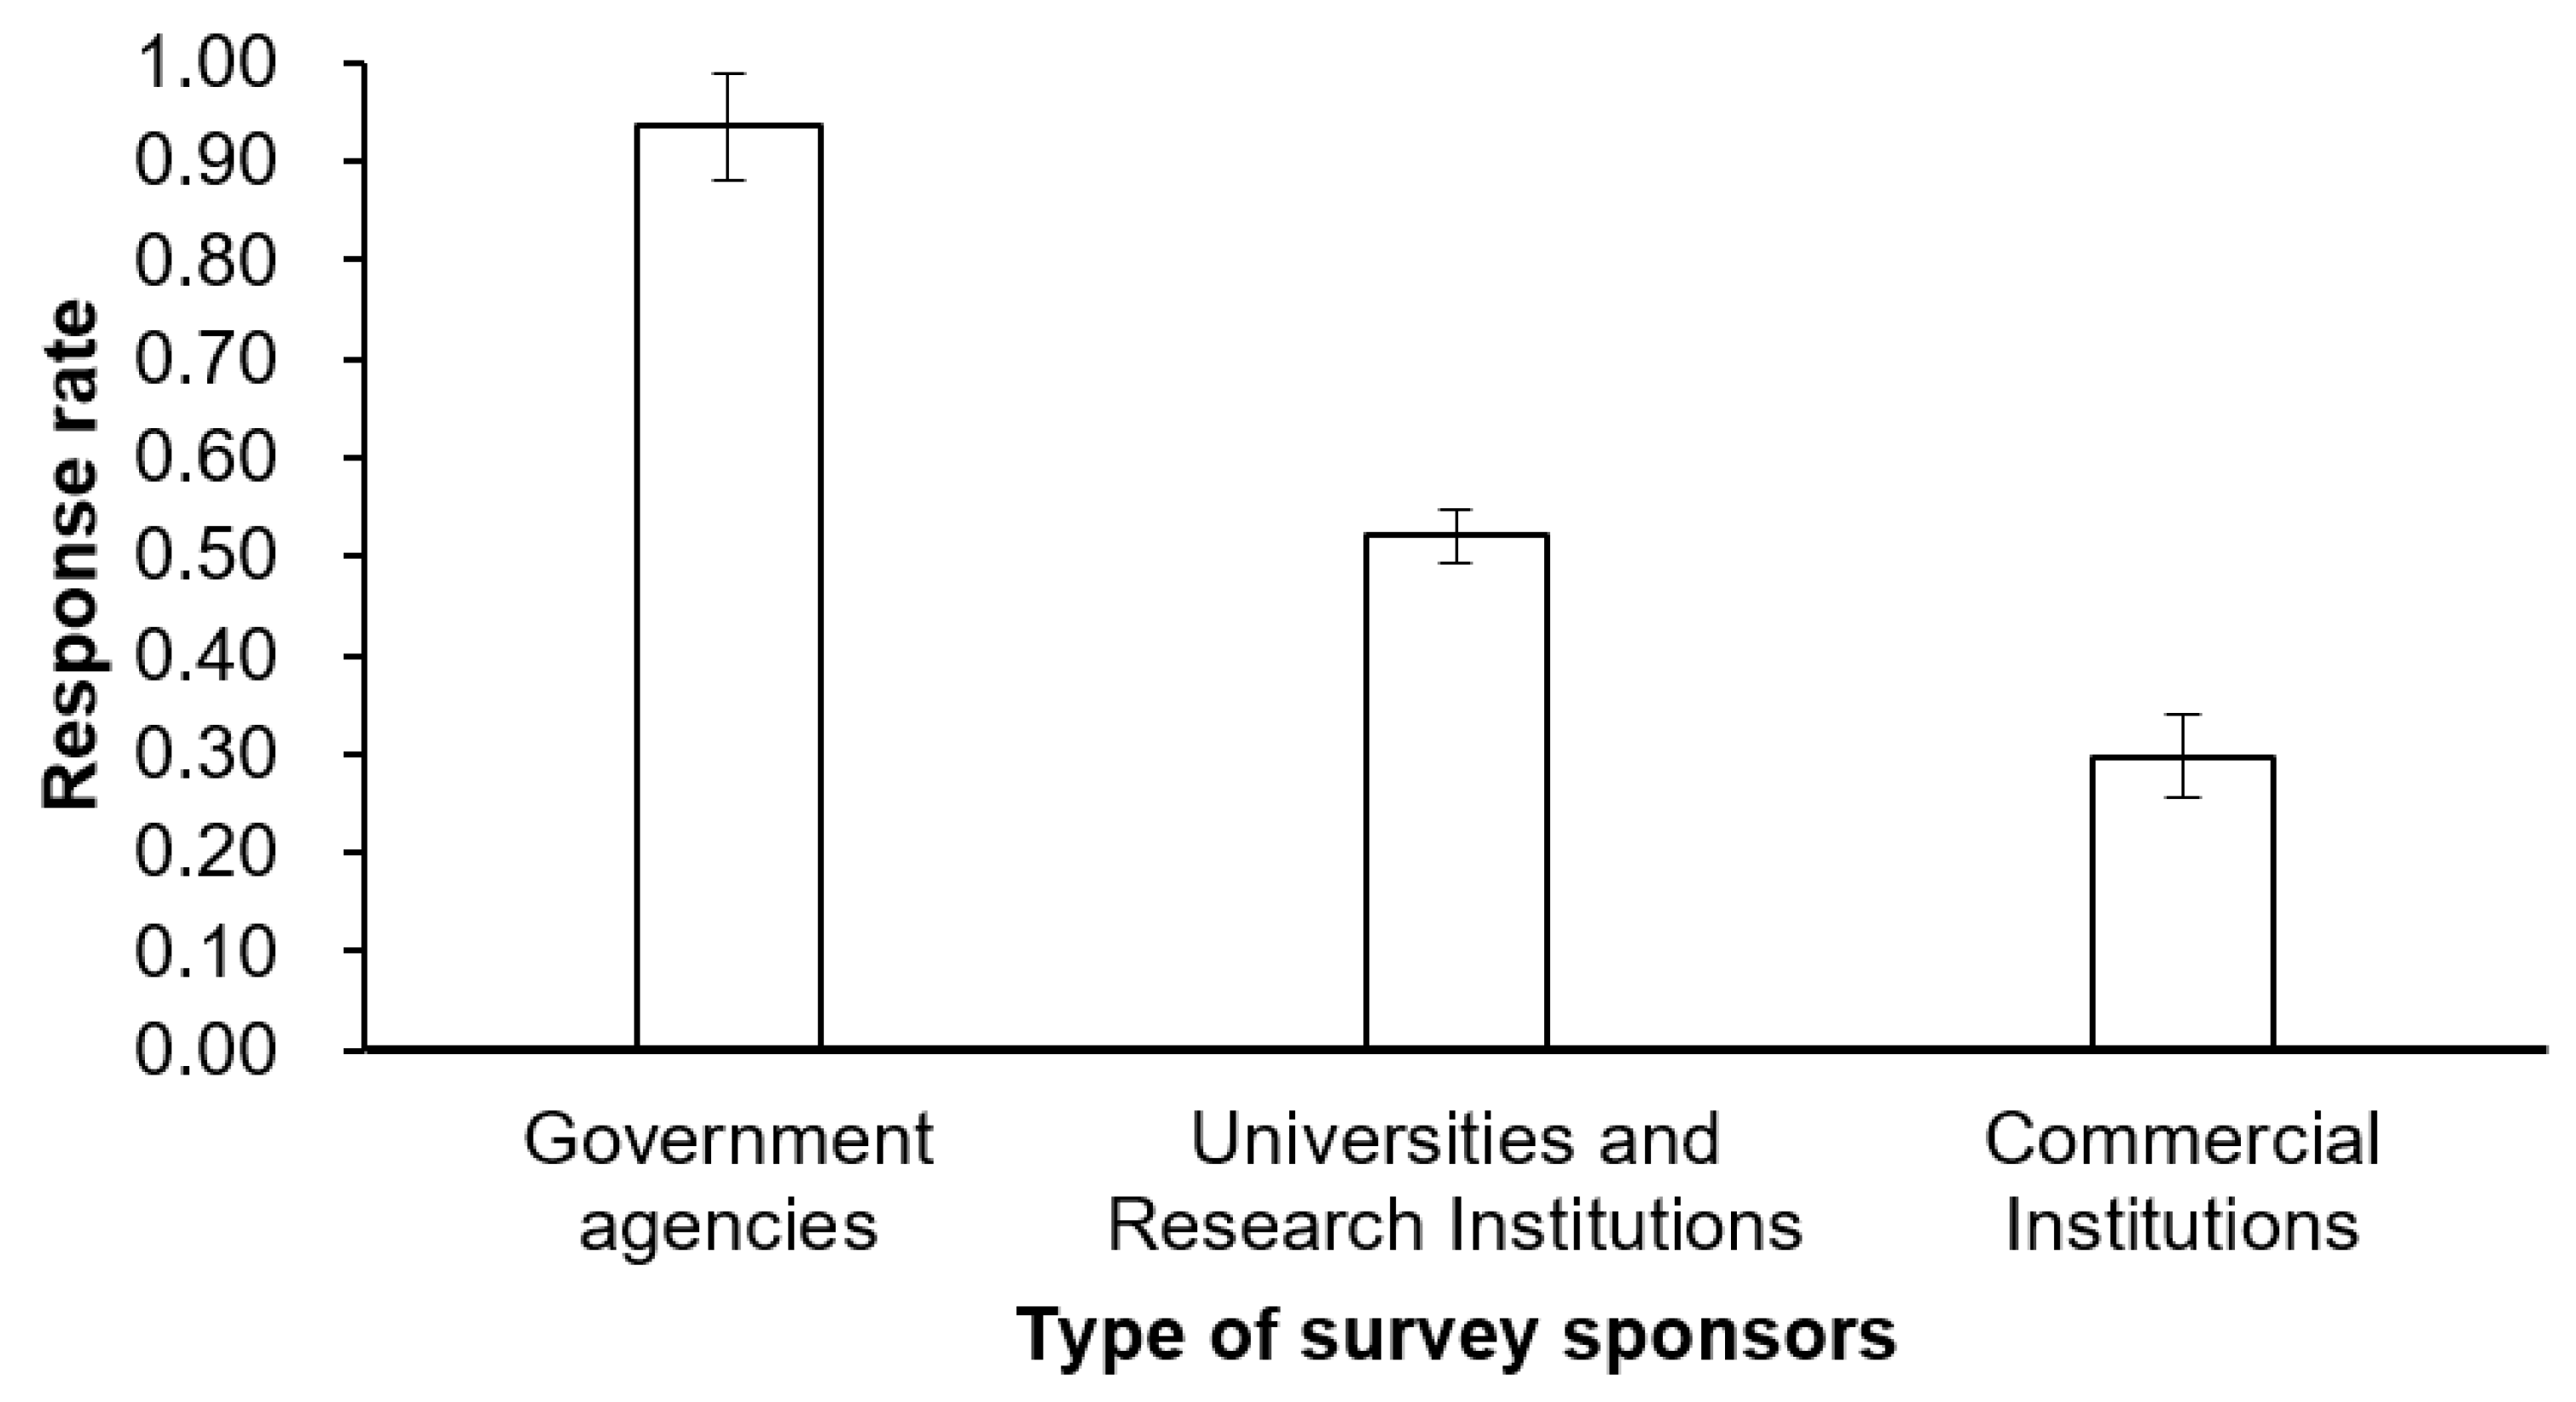
Figure 3.
Confidentiality and response rates.

Figure 4.
Direct invitation and response rates.
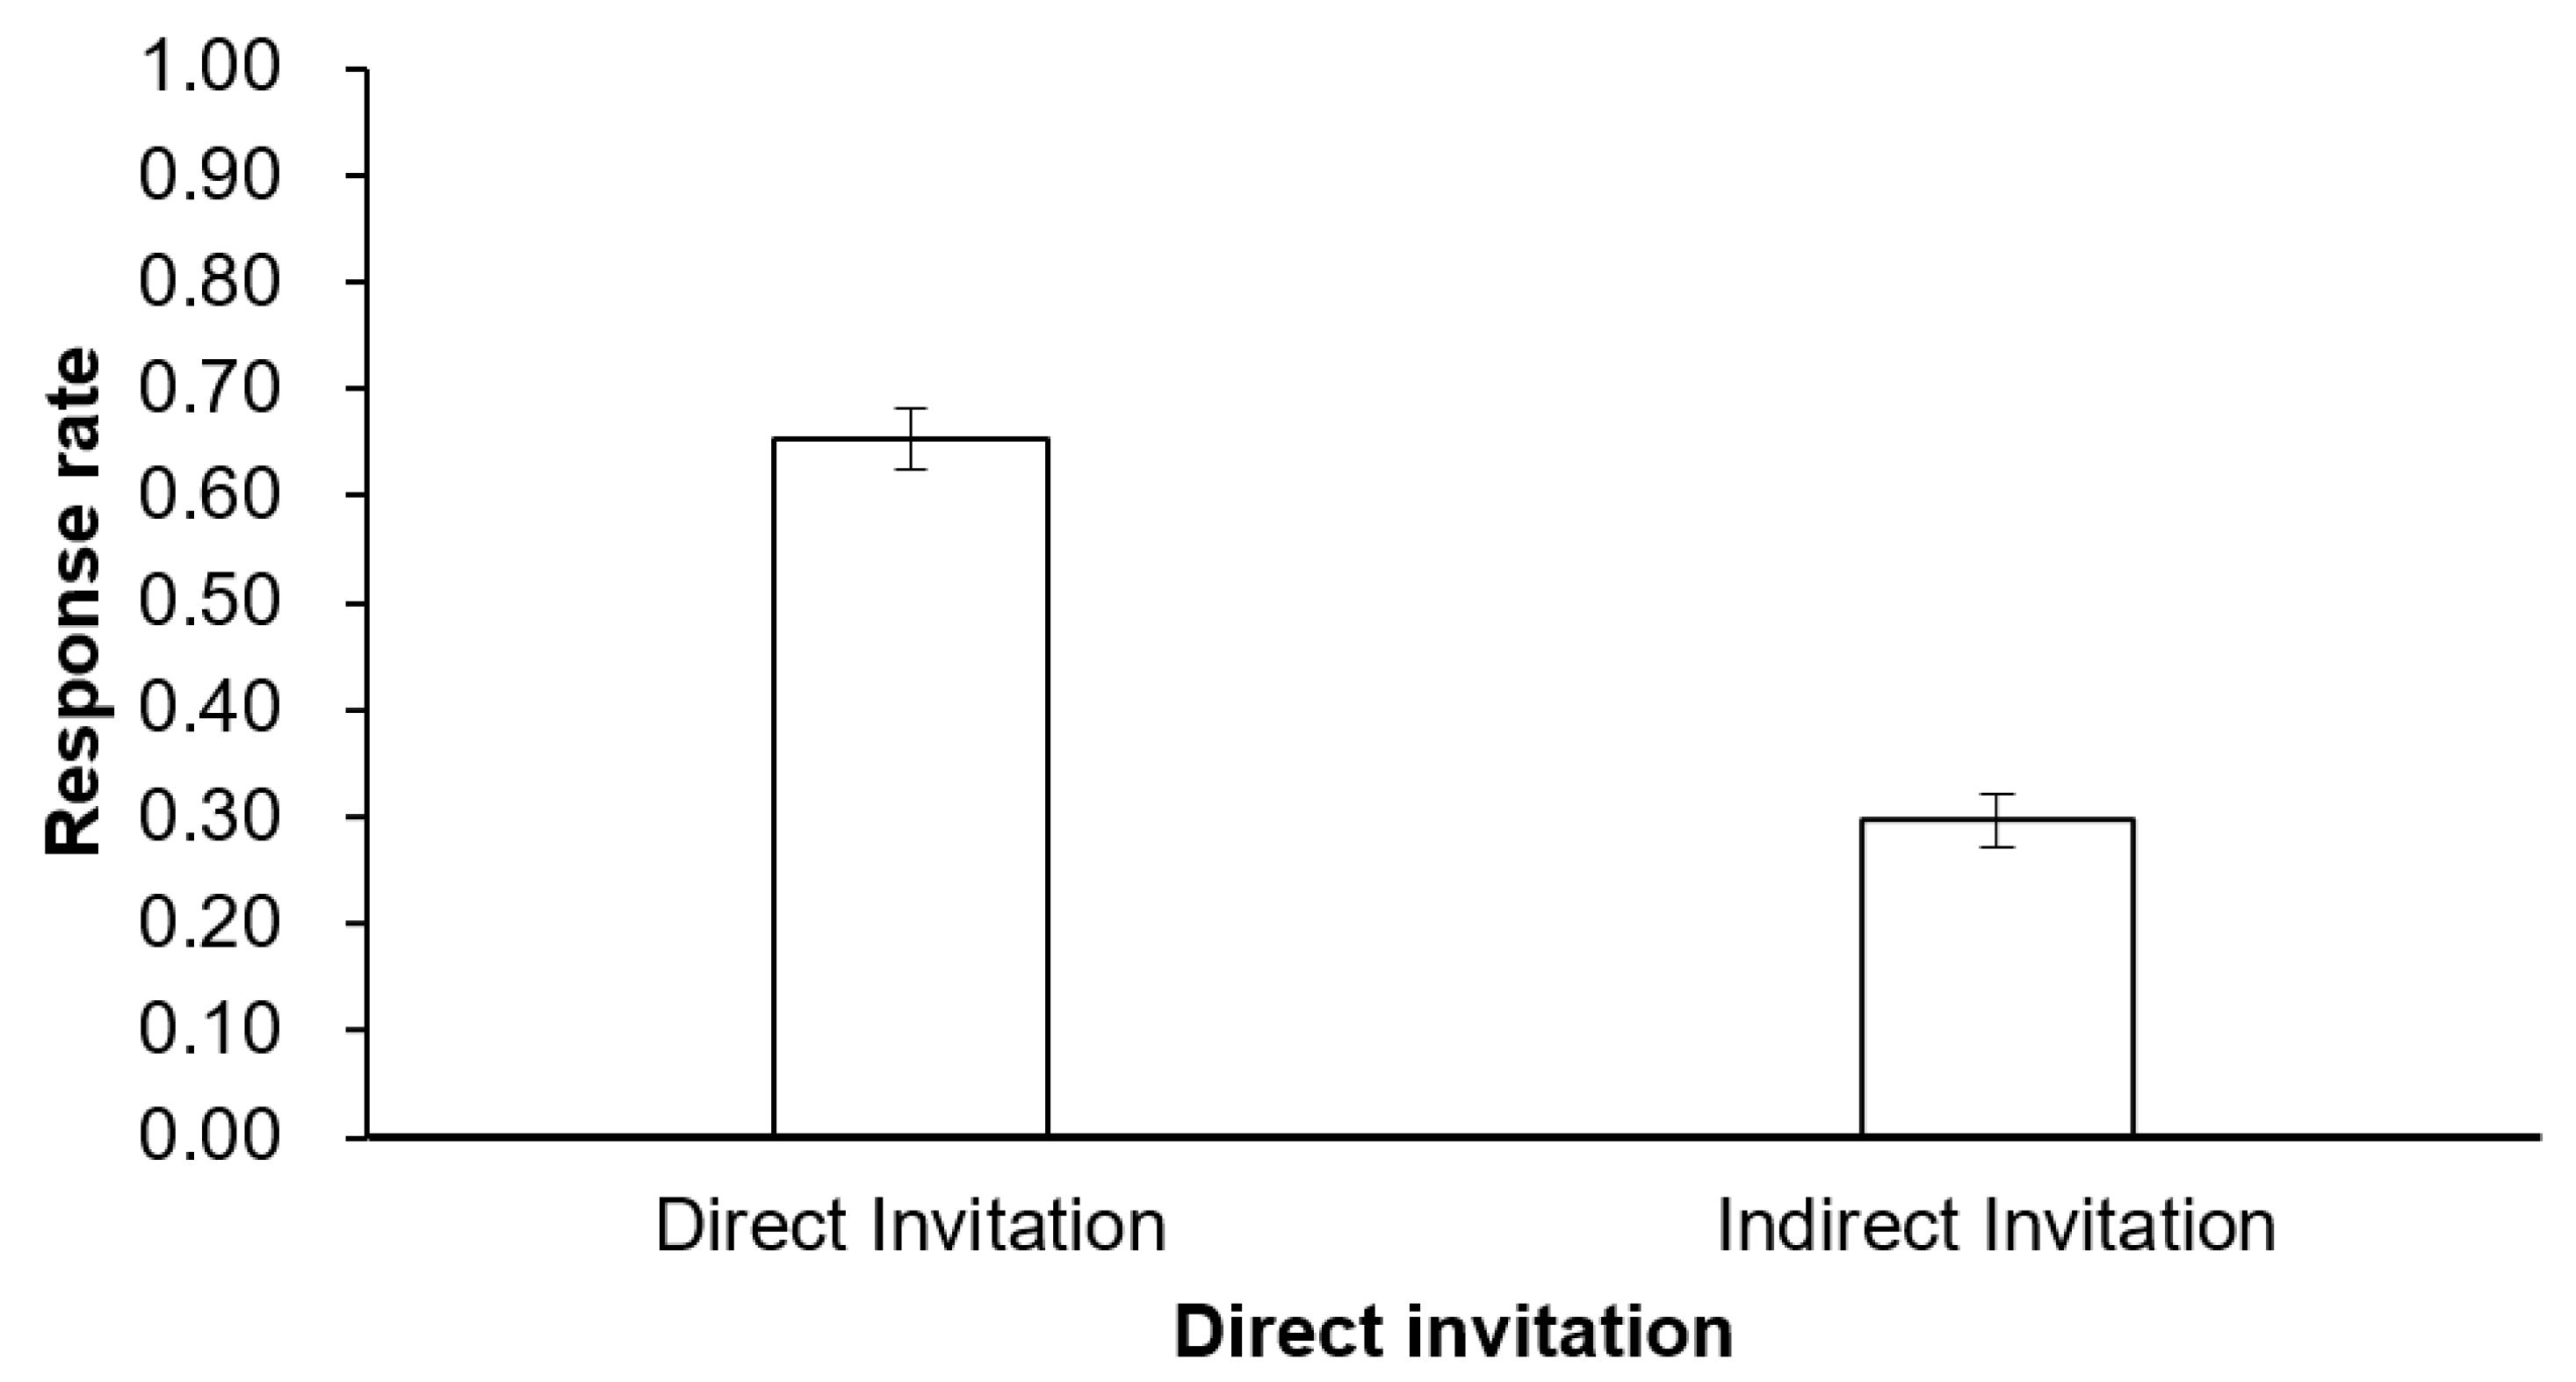
Figure 5.
Relevance of topics and response rates.
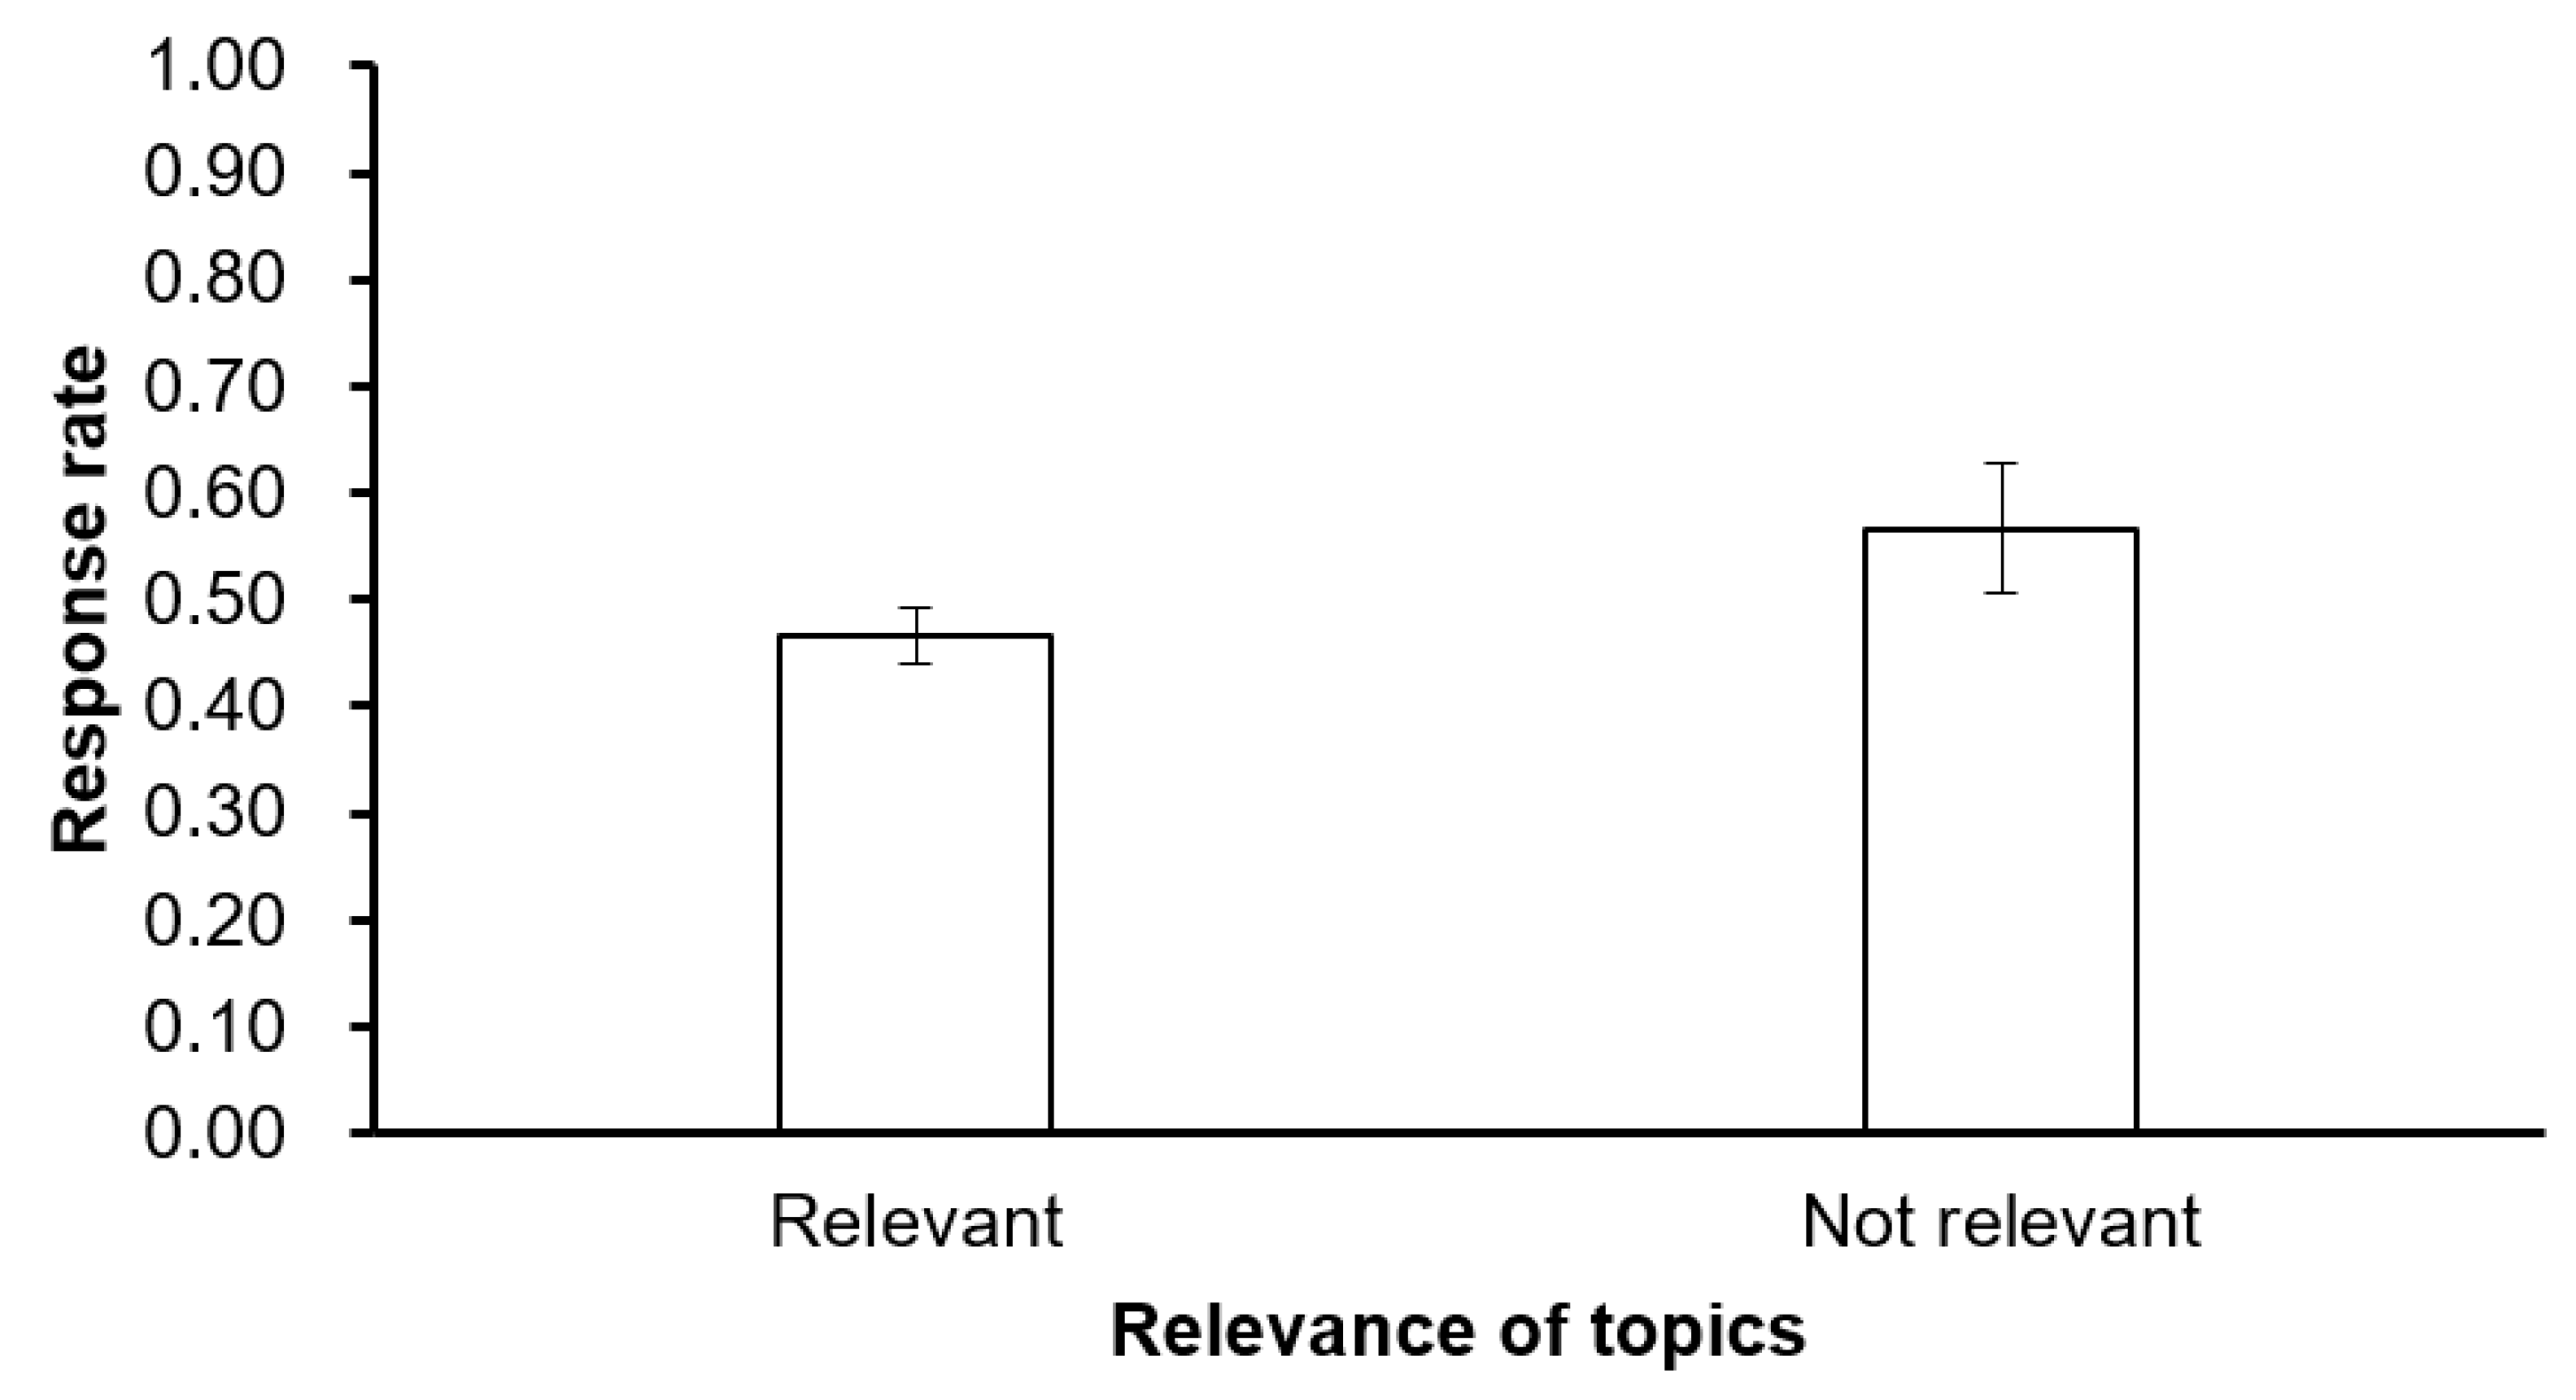
Figure 6.
Decision tree regression model after pruning.
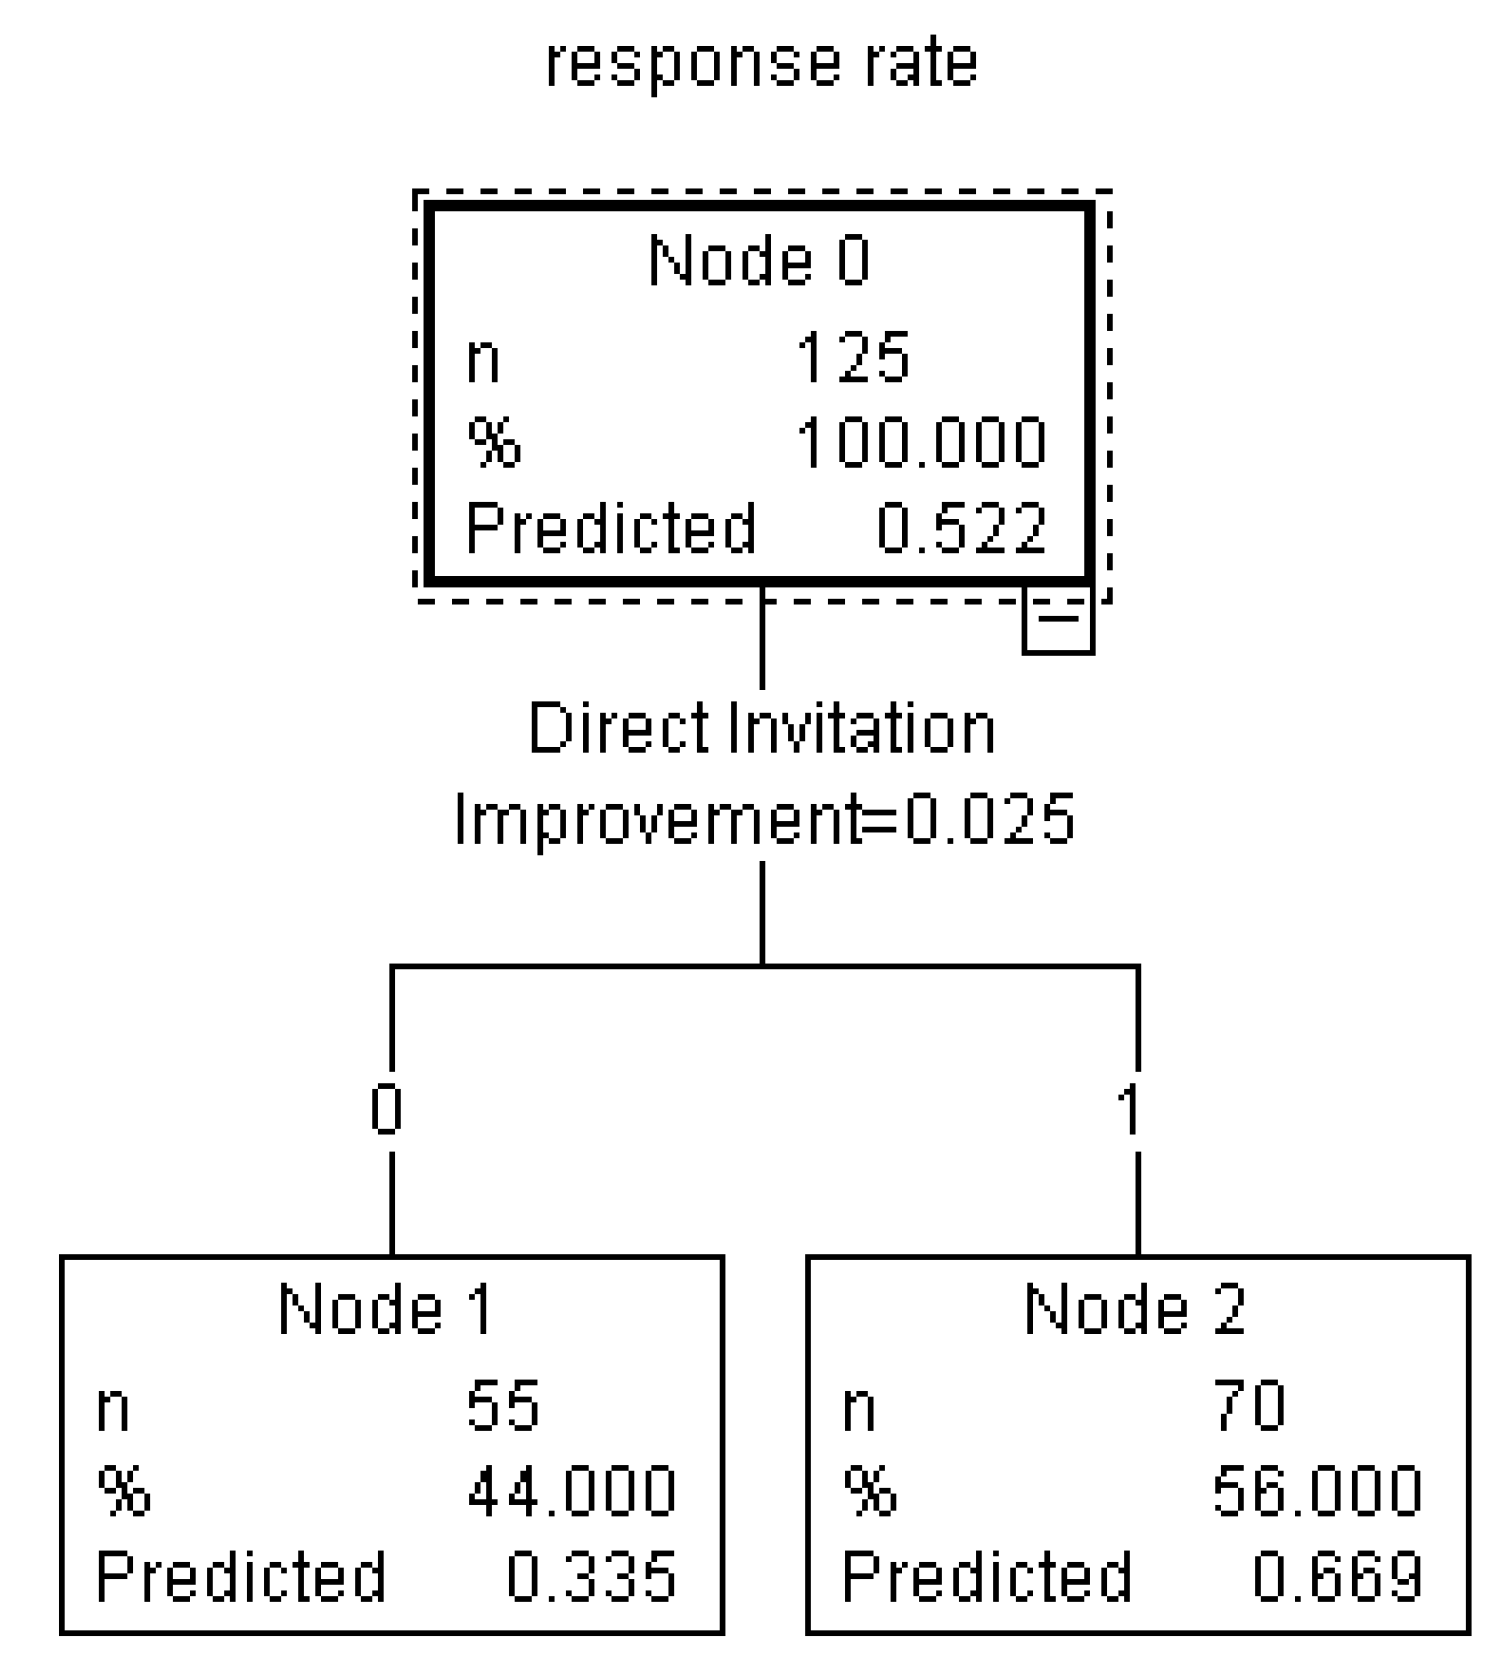
Figure 7.
Decision tree and nodes.

Figure 8.
Decision tree and nodes after pruning.

Table 1.
Survey attributes and their descriptive statistics.
| Survey Attributes | Descriptive Statistics |
|---|---|
| Mode of data collection |
|
| Type of survey sponsors |
|
| Incentives | Amount of money ($) a |
| Questionnaire length | Number of items (M = 28.9, SD = 15, Range: 6 to 133) |
| Relevance of topics |
|
| Sensitivity of topics |
|
| Confidentiality |
|
| Direct Invitation |
|
| Country or region’s cultural value orientation | Individualism and collectivism index c (M = 58.63, SD = 30.55, Range: 14 to 91) |
a Only 37 studies provided incentive/compensation information, so descriptive statistics are not presented and this variable was not used in further analysis. b Because of the small number of studies involving sensitive topics, this variable was not used in further analysis. c For this index, a higher number indicated higher individualism and a lower number indicated higher collectivism.
Table 2.
The linear correlation coefficients in training set and in test set.
| Training Set | Test Set | |
|---|---|---|
| Decision tree regression | 0.722 | 0.578 |
| Traditional linear regression | 0.615 | 0.423 |
Table 3.
Recall and precision of the prediction model.
| Recall Rate a | Precision Rate b | |
|---|---|---|
| High response rates | 78.57% | 78.96% |
| Low response rates | 71.87% | 79.31% |
a Recall rate = TP/(TP + FN). b Precision rate = TP/(TP + FP), where, TP (true positive) is the number of positive samples predicted by the classifier as positive; TN (true negative) is the number of negative samples predicted by the classifier as negative; FP (false positive) is the number of negative samples predicted by the classifier as positive; FN (false negative) is the number of positive samples predicted by the classifier as negative.
© 2019 by the authors. Licensee MDPI, Basel, Switzerland. This article is an open access article distributed under the terms and conditions of the Creative Commons Attribution (CC BY) license (http://creativecommons.org/licenses/by/4.0/).
Share and Cite
MDPI and ACS Style
Han, J.; Fang, M.; Ye, S.; Chen, C.; Wan, Q.; Qian, X. Using Decision Tree to Predict Response Rates of Consumer Satisfaction, Attitude, and Loyalty Surveys. Sustainability 2019, 11, 2306. https://doi.org/10.3390/su11082306
AMA Style
Han J, Fang M, Ye S, Chen C, Wan Q, Qian X. Using Decision Tree to Predict Response Rates of Consumer Satisfaction, Attitude, and Loyalty Surveys. Sustainability. 2019; 11(8):2306. https://doi.org/10.3390/su11082306
Chicago/Turabian StyleHan, Jian, Miaodan Fang, Shenglu Ye, Chuansheng Chen, Qun Wan, and Xiuying Qian. 2019. "Using Decision Tree to Predict Response Rates of Consumer Satisfaction, Attitude, and Loyalty Surveys" Sustainability 11, no. 8: 2306. https://doi.org/10.3390/su11082306
Note that from the first issue of 2016, this journal uses article numbers instead of page numbers. See further details here.