Article

Accelerating Cities in an Unsustainable Landscape: Urban Expansion and Cropland Occupation in China, 1990–2030

1
Laboratory of Geospatial Technology for the Middle and Lower Yellow River Regions, College of Environment and Planning, Henan University, Jinming District, Kaifeng 475004, China
2
Department of Microbiology and Plant Biology, Center for Spatial Analysis, University of Oklahoma, Norman, OK 73019, USA
3
Institute of Geographic Sciences and Natural Resources Research, Chinese Academy of Sciences, Datun Road 11A, Beijing 100101, China
4
College of Plant Science, Jilin University, Xian Road No.5333, Changchun 130062, China
5
College of Environmental and Resource Sciences, Zhejiang University, Yuhangtang Road No.866, Hangzhou 310058, China
*
Author to whom correspondence should be addressed.
Sustainability 2019, 11(8), 2283; https://doi.org/10.3390/su11082283
Submission received: 3 March 2019 / Revised: 23 March 2019 / Accepted: 9 April 2019 / Published: 16 April 2019
(This article belongs to the Special Issue Future Cities: Urban Planning, Infrastructure and Sustainability)

Abstract

:
It is crucial to assess the effects of urban expansion on croplands to allow sustainable urbanization and cropland supply. However, owing to the complexity of land conversion and various land policies in China, it is difficult to quantify the cropland dynamics and implications of urban expansion throughout the whole accelerated stage of urbanization. This study was based on land use data from 1990 to 2015 and urban expansion data from 2000 to 2030, analyzing urban expansion and predicting its impact on croplands. We found that urban area would continue to increase and croplands would contribute more than 70% of the urban expansion area. The urban area in China will likely reach 71.6–87.0 thousand km2 or more by 2030. Although the overall area of croplands may remain at a similar magnitude in future decades, our findings imply that croplands will tend to shift northward, resulting in some potential challenges owing to resource limitations in northern regions. Our study provides a new perspective in terms of assessing future cropland dynamics and the effects of urban expansion and highlights the significance of ensuring a realistic land policy in the future.

1. Introduction

There are close linkages between urbanization and food systems in many areas worldwide [1]. Rapid urbanization directly causes spatial expansion of urban spaces and leads to occupation of former patterns and areas of croplands [2]. As the largest emerging country in the world, China is experiencing rapid urbanization since the implementation of reforms and the “opening up” policy [3,4,5]. Increasing urbanization in China has sharply altered the spatial–temporal patterns of land use and land cover (LULC) [6]. Urban expansion directly affects the croplands surrounding cities and indirectly impacts farmers’ welfare, food systems, and the natural environment [7,8,9,10]. Many studies thus pay special attention to urban expansion and cropland dynamics [10,11].
China may now have entered an accelerated stage of urbanization. According to Northam’s theory of urbanization, urbanization follows an S-shaped logistic equation and can be divided into three phases: the initial stage, accelerated stage, and terminal stage [12]. With respect to China’s urbanization stage, there is at present still no clear statement of its start and end time and the corresponding impacts on land use pattern, although many studies have reported that urban expansion is widespread nationally [5,13]. Many studies, based on historical LULC data, have simulated future land use change and urban expansion. Numerous methods and models such as cellular automata, Markovian chain, and agent-based and CLUE-S models are widely used in the study of urban expansion prediction [14,15]. A generic framework for path-dependent industrial land transition and even commercial software such as Metronamica and Land Use Scanner have also been developed to analyze LULC change [16]. Different simulations based on these studies are always very consistent: that is, urban areas will continue to expand irreversibly in the future. Urban expansion and its impacts on croplands, therefore, continue to attract attention, although many factors can affect the area of croplands [17]. Urbanization is still seen as a threat to food systems, although the proportion of urban conversion to total cropland loss is relatively small in China [10]. Some studies have demonstrated that urban expansion has taken place on some of the most productive croplands and threatens future cropland supply [2,10]. When limited to long-term data related to urban expansion, however, very few studies focus on exploring the spatial-temporal link between croplands and urban expansion during the lengthy, accelerated stage of urbanization in China. Overall, one obvious fact is that the massive urbanization taking place will continue into the foreseeable future, but there is no explicit understanding of the historical and future urban expansion and croplands.
Urbanization and cropland protection are relevant to almost all land policies in China. A correct understanding of the LULC process can provide new policy inspiration, although tracking urban expansion and cropland dynamics on a national scale may be complicated since the situations in each city will differ. Previous studies have focused on the impacts of land policies on LULC but insufficient attention was paid to the impacts of LULC dynamics on current or even future policies [13]. In the 1980s, two basic policies were implemented that greatly affected LULC: one was economic reform and the other was a strict family-planning law [4,18,19]. Land rights in cities and towns were also protected by law, but in the 1990s China passed the “Prime Farmland Protection Regulations”. After this, land and resources gradually began to be allocated by the land market, and the real estate markets in urban areas became increasingly active [20]. At the time, the long-standing thought was that at least 1200 thousand km2 of croplands should be preserved to safeguard food security in China. However, to ensure a stable economy, the government always requires that the land supply for urban construction must not affect the real estate market and economic development. As a whole, China still lacks a framework for incorporating all land use-related policies [21]. Many policies overlap and only provide temporary solutions for specific problems. However, as urban areas and croplands concentrate human activity, it may be useful to continue to track the implications of policies that cross between them.
In view of urban expansion, croplands, and related land policies, urbanization has been considered a threat to food systems in China [2,10]. However, how do we quantify the implications for the conversion of urban expansion and croplands? Further, what is the policy inspiration during an accelerated stage of urbanization? To address these questions, we need to identify cropland dynamics and the effects of urban expansion within the context of multiple policies and, correspondingly, to explore their inspiration on policies.
In this paper, based on the hypothesis that China is in an accelerated stage of urbanization, we used multi-resource data to perform a spatially explicit analysis of changes in croplands and urban expansion in China. In the Materials and Methods section we describe two independent data sources obtained by different methods, the historical LULC and future urban expansion data. In the Results section we track gross changes in four land use types: urban areas, urban expansion areas (non-agricultural), cropland areas, and areas converted from croplands to urban areas between 1990 and 2015. To further assess the impacts of urban expansion on croplands, we also used the data from two independent sources to predict future urban expansion and cropland dynamics in 2030. The Discussion section presents an interpretation of the area differences between spatial data and statistical data, and offers perspectives and inspirations for future land policy in China. The Conclusion section summarizes the key study results.

2. Materials and Methods

2.1. Land Use and Land Cover Data from 1990 to 2015

LULC data with a spatial resolution of 1 km were used to identify multi-year trends in cropland and urban areas. In China, nationwide LULC data with a spatial resolution of 30 m have been produced since the 1990s by more than 100 scientists from the Chinese Academy of Sciences [13]. The latest version of LULC data with 1 km spatial resolution can be obtained from the Natural Resources and Environment Center, Chinese Academy of Sciences (http://www.resdc.cn/Default.aspx). The method for spatial upscaling from 30 m to 1 km is Resample and the aggregating rule is Nearest, which is suitable for dealing with land use classification data (https://resources.arcgis.com/en/help/main/10.1/index.html). In this study, given the study area and data resolution, we used 1 km data to analyze the national land use change. A hierarchical classification system of six LULC classes was applied to the data. Among these classes, “cropland” means land cultivated for crops, and includes mature cultivated land, newly cultivated land, fallow, shifting cultivated land, intercropping land (such as crop-fruit, crop-mulberry, and crop-forest land in which a crop is the dominant species), bottomland and beach that has been cultivated for at least three years; “urban area” means a built-up area in large, medium, and small cities [13].
The country is partitioned into six geographical regions: East China (EC), North China (NC), Northeast China (NEC), Northwest China (NWC), South Central China (SCC), and Southwest China (SWC). These regions have been used to analyze various aspects of regional characteristics, including land use change and its impacts [22]. In this study, to focus on our study object, only pixels depicting croplands and urban areas in the years 1990, 1995, 2000, 2005, 2010, and 2015 were selected (Figure 1).

2.2. Urban Expansion Data

Global urban expansion data with a spatial resolution of 5 km were downloaded from the Seto lab at Yale University (http://urban.yale.edu/data). The urban expansion data for 2000 were constructed from original urban impervious data, which were initially based on the Land Cover Product from the National Aeronautics and Space Administration’s Moderate Resolution Imaging Spectroradiometer [23,24]. For forecasting urban expansion, four sources of data were also used: urban population projections to 2030 from the United Nations, population projection uncertainty ranges from the US National Research Council, population density estimates from the Global Rural-Urban Mapping Project, and country-level gross domestic product (GDP) projections by the Intergovernmental Panel on Climate Change Special Reports on Emissions Scenarios. First, the regional aggregate amount of urban expansion was generated from the corresponding probability density functions of projected GDP and urban populations. Second, the spatial distribution of aggregate amount was simulated by a spatially explicit grid-based land change model, which used slope, distance to roads, population density, and land cover as the primary drivers of land change [25,26].
The grid values of the data indicated the probability of a certain grid being converted from another LULC type to an urban area [25,26]. The percentage probability ranged from 0% to 100%. This study used 75% as the threshold and assumed that the urban grids above this threshold are likely to be urbanized by 2030. We also considered the probability difference and then selected four percentage (100%, 95%, 90%, and 75%). Finally, the corresponding grid areas of the four percentages were used as the future urban areas in 2030. Given that a spatial resolution of 5 km will contain more mixed pixels than a 1 km resolution (which might exaggerate croplands and urban areas) we divided the spatial data from 2000 by the LULC data in 2000 to eliminate the value differences of the two-urban areas’ data in the six geographical regions in 2000. We took the quotients as a conversion index to extrapolate the urban expansion areas to 2030.

2.3. Markovian Chain Model and Spatial Analysis

The Markovian chain model has been widely used to analyze temporal change in LULC and is a useful method to depict future proportions of each LULC type. This study was based on a Markovian chain model and predicted the possible proportion of each LULC type in China, finally obtaining cropland and urban areas in the year 2030. It should be noted that the model is a mathematical method that only can be used to analyze the data itself and does not consider the impacts of other factors on cropland and urban distribution, such as cropland suitability, topography, and other environmental factors. In this study, two accuracy analyses were performed to evaluate the error in the future cropland and urban areas: (i) LULC data in 1990 and 2000 to predict LULC data in 2010; and (ii) LULC data in 1995 and 2005 to predict LULC data in 2015. We then compared the predicted areas with the actual areas in 2010 and 2015 to assess the accuracy of the Markovian chain model and determine which two years of historical LULC data were used for further simulation.
Spatial statistics. We used the Zonal Statistics tool in ArcGIS version 10.1 to calculate the attribute values of grid cells (croplands and urban areas types) within the six geographical regions. Given the spatial resolution of LULC and the urban expansion data, the 1 km scale was used to analyze cropland and urban area, and the 1 km resolution was also reasonable to compare with the 5 km urban expansion data.

3. Results

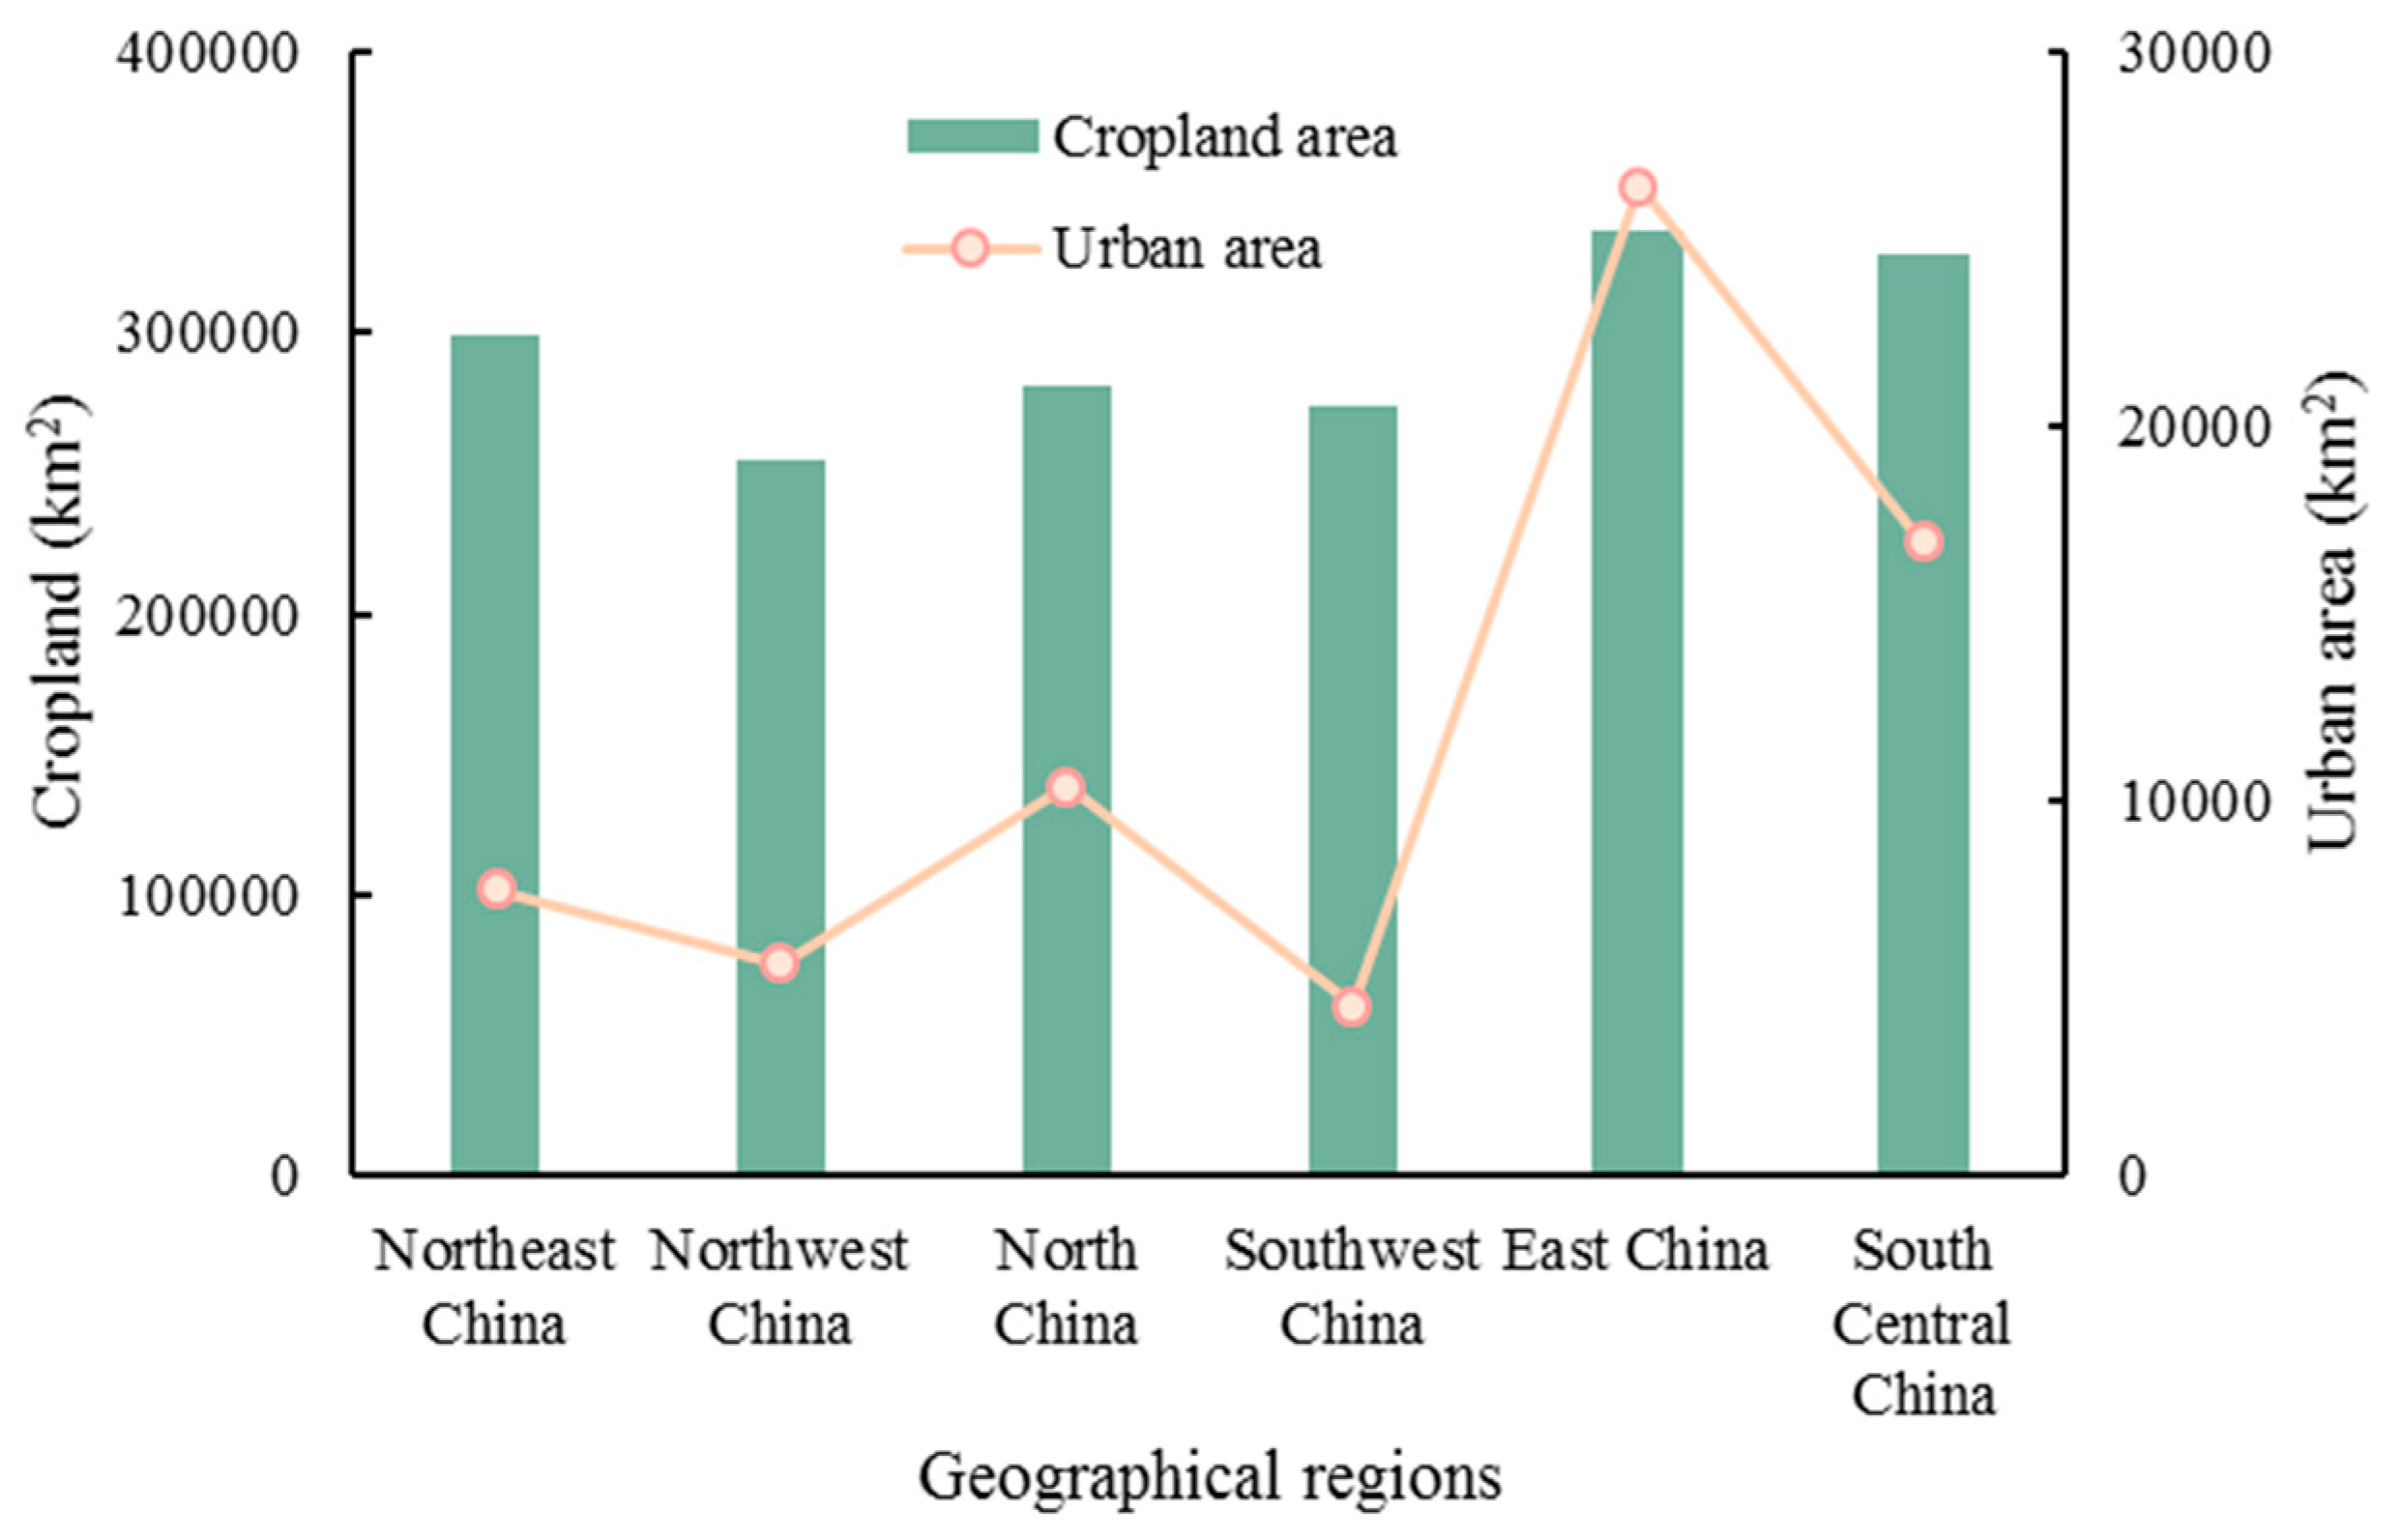
3.1. Variations in Urban Expansion and Cropland Areas from 1990 to 2015

The area of croplands showed an obvious characteristic of northward shifting from 1990 to 2015, although it fluctuated slightly during the study period (Figure 2). In particular, with the latitude of N38o as the dividing line, the area of croplands increased northward, while the area decreased southward. From 1990 to 2000, cropland area increased continually: the total area in 1990 was 1772 thousand km2 and in 2000 was 1800 thousand km2. From 2000 to 2015, cropland area decreased slightly: the total area in 2015 was 1786.0 thousand km2. Correspondingly, from 1990 to 2015, the urban area increased rapidly: comprising 25.0 thousand km2 in 1990 and 52.1 thousand km2 in 2015. Overall, the total cropland area remained basically stable, while the total urban area increased dramatically, with an increased rate of more than 109.0% from 1990 to 2015.
The two maximum regions were NWC and SWC, with area proportions of 30.9% and 25.4%, respectively. The two minimum regions were EC and NEC, with area proportions of 9.0% and 7.9%, respectively (Figure 1). Because the original areas and geographical conditions are different in the six regions, the cropland area over the study period followed the order (from greatest to least): EC > SCC > NEC > NC > SWC > NWC, but the maximum amounts of variation in cropland area appeared in NEC (Figure 3). The croplands increased in NEC, NC, and NWC but decreased in EC, SCC, and SWC. The variation trends in urban and cropland areas differed among the six regions, but, overall, urban areas in the six regions all tended to increase from 1990 to 2015. The amount of urban area over the study period followed the order (from greatest to least): EC > SCC > NC > NEC > NWC > SWC, and the order of variation amount in urban areas was similar, indicating that regions with higher urban area retained the advantage of urbanization. Among the six regions, EC and SCC demonstrated more dramatic increases than the other regions, with average annual increases in urban areas of 429.0 and 284.8 km2 year−1, respectively. As detailed above, against the backdrop of urban expansion, increases in croplands in the three northern regions (NEC, NC, and NWC) resulted in a weak increase in the area of croplands in China from 1990 to 2015, even though the cropland decreased in the other three regions (SCC, EC, and SWC) (Figure 2 and Figure 3). Furthermore, these regions are facing rapid increases in urban areas.

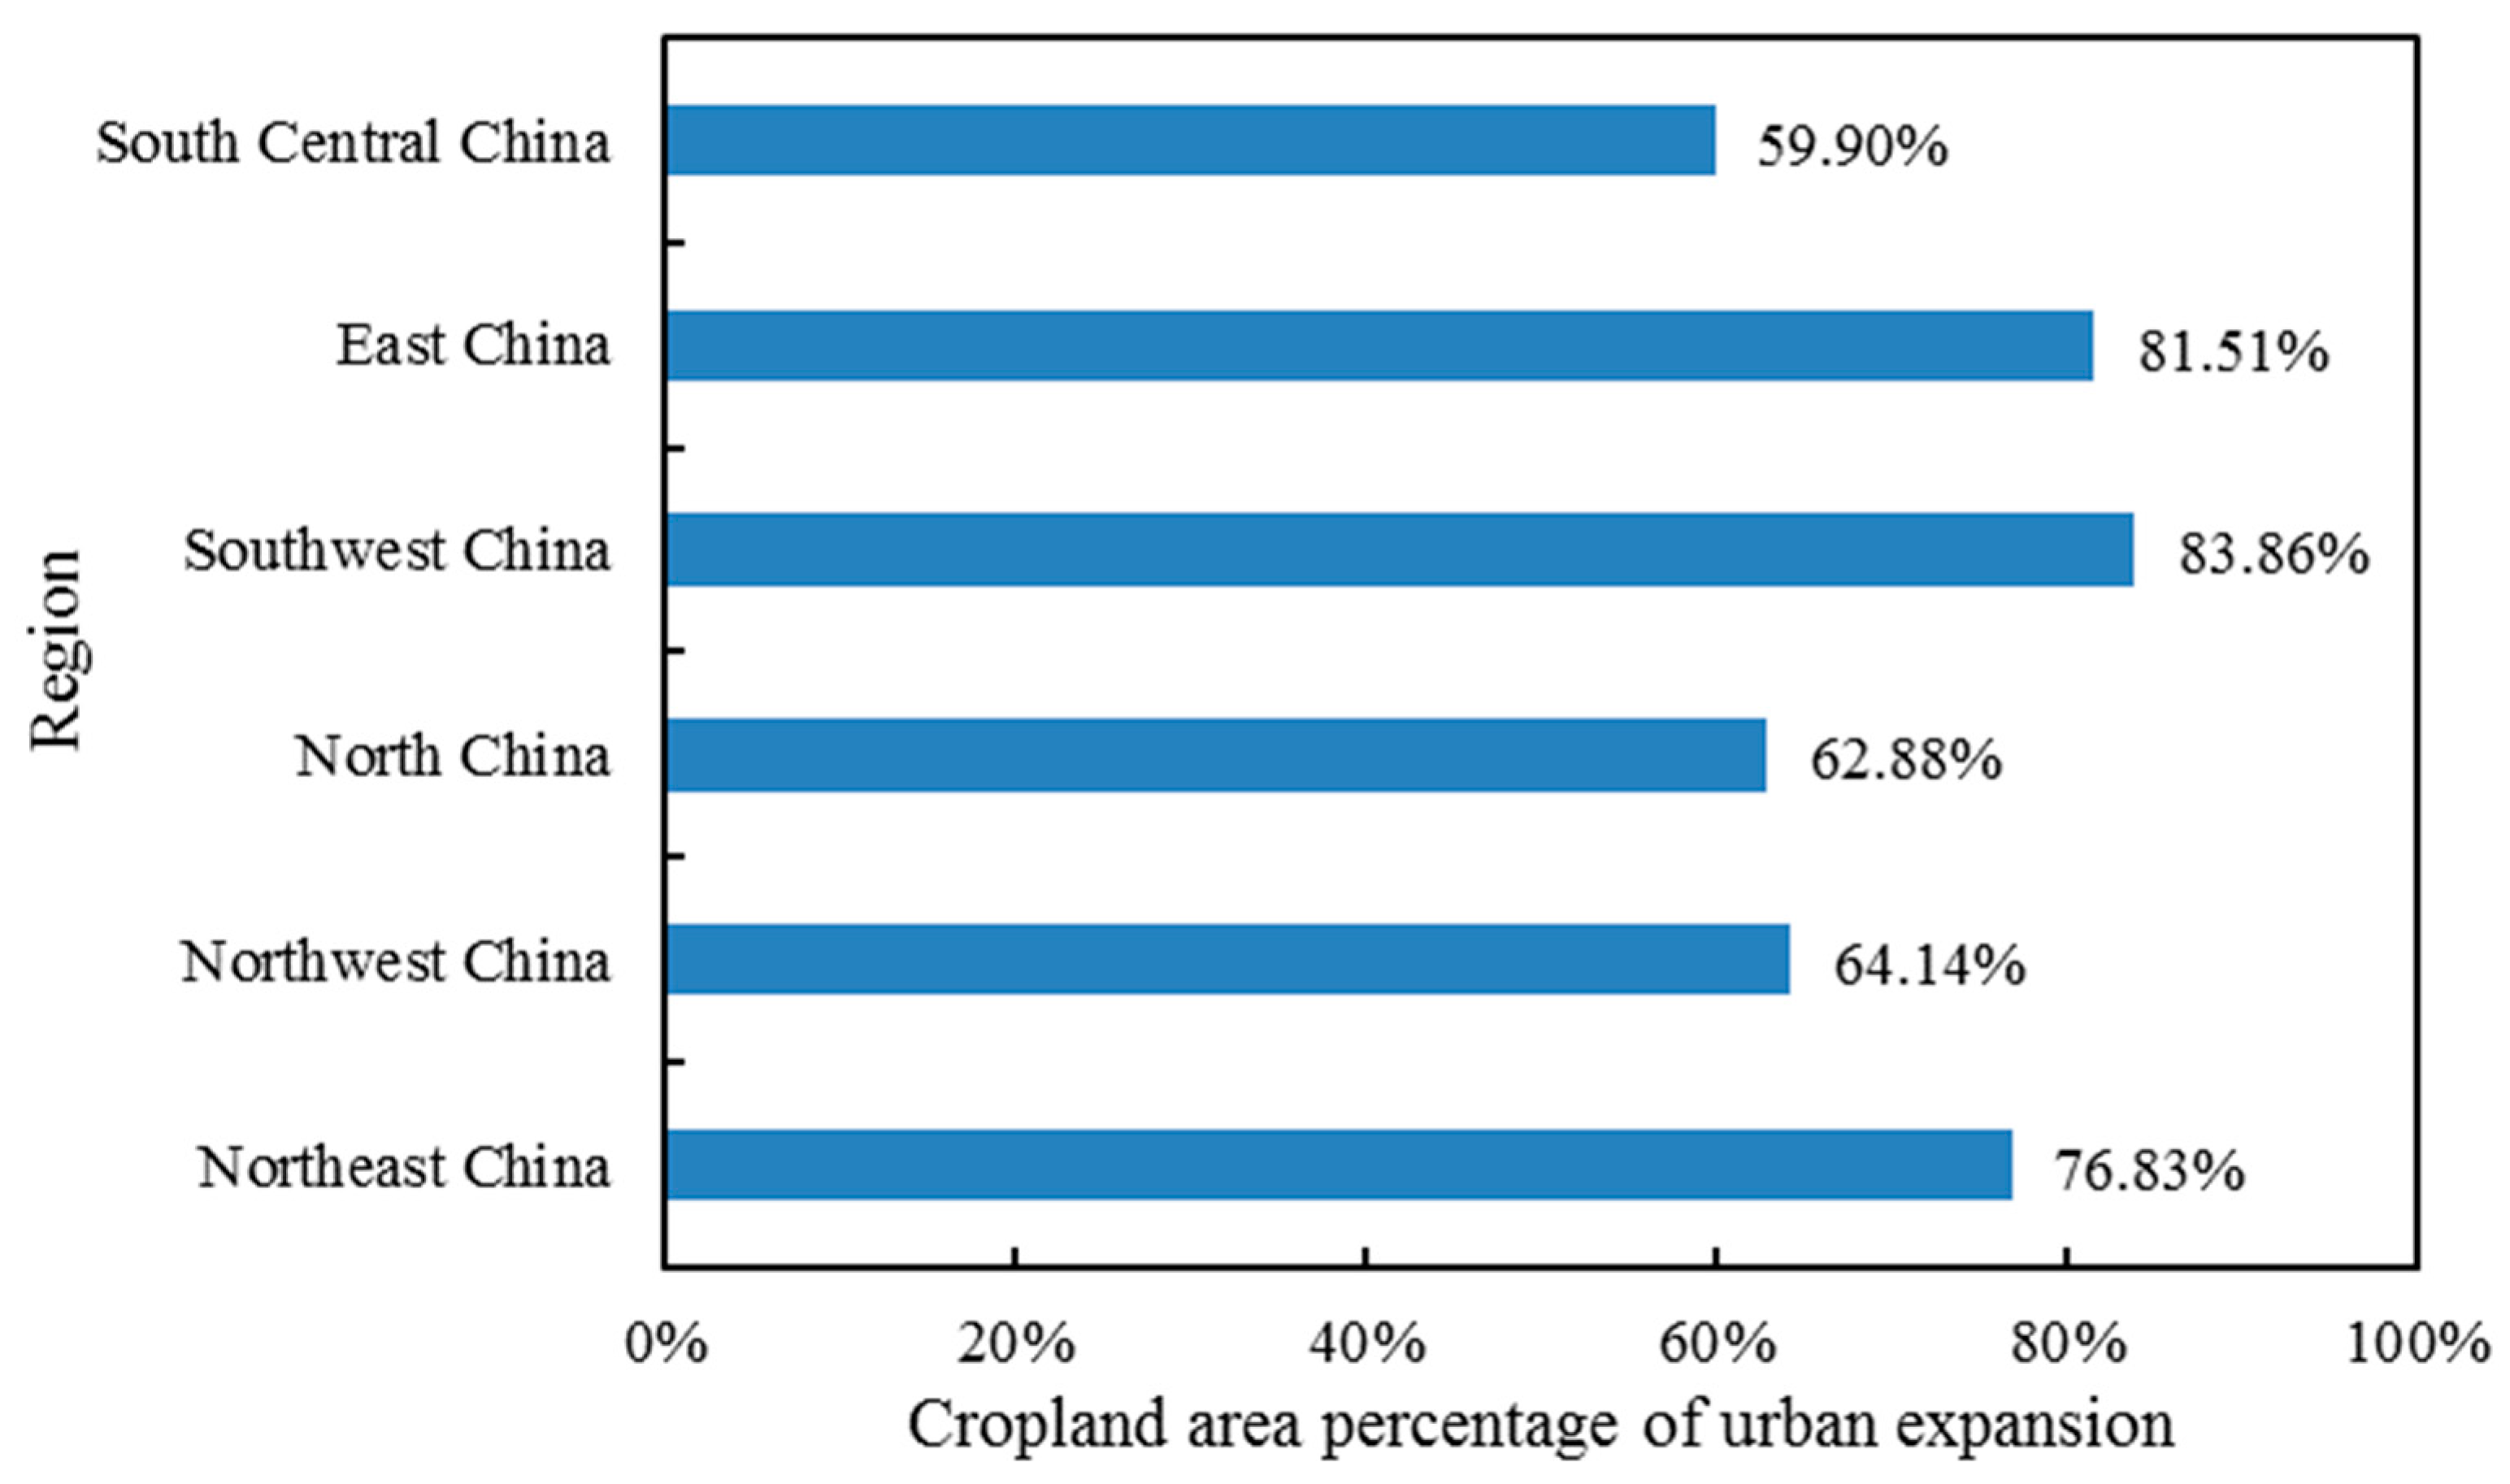
3.2. Contribution of Croplands to Urban Expansion Areas

There are always extensive croplands around urban areas in China. We selected one major city in each region and examined changes in land use type in greater detail. Figure 4 shows the basic spatial distributions of urban expansion and the surrounding croplands from 1990 to 2015. Clearly, most of the areas surrounding cities were covered by croplands. Therefore, croplands were easily occupied by urban expansion. Most major cities, such as Zhengzhou and Beijing, showed several-fold increases in their spatial area during the past two decades, though the urban expansion ratio varied in different cities. However, the area of urban expansion in some cities increased only slightly, such as in Shenyang and Xi’an (Figure 4). The overall rate of urban expansion from 2000 to 2015 was 57.8% and the rate from 1990 to 2000 was 32.4%, indicating that urban expansion has been increasing more quickly since 2000.
The contributions of croplands to urban expansion become visible through the occupancy contribution proportion, which represents the share of newly added urban areas that used to be croplands (i.e., the amount of area directly converted from croplands to urban areas). Here, we averaged the multi-year contribution proportion of each region (Figure 5) and found that the contribution proportion for all of China was 72.2%. This means that most new urban areas in China are directly converted from croplands. Moreover, the unique characteristics and differences among the six regions were clear. Specifically, SWC had the greatest contribution (83.9%), while SCC had the lowest contribution (59.9%). Many reasons resulted in the regional contribution difference. From the perspective of LULC, the greatest contribution in SWC means that the cities or urban areas in the region are expanding towards the extensive areas of cultivated land that surround them. Conversely, many other LULC classes—and not only croplands—are distributed around the cities in SCC. The deeper reason for the difference may be in the distribution pattern of LULC and corresponding resource endowment, environmental conditions, or land policy.

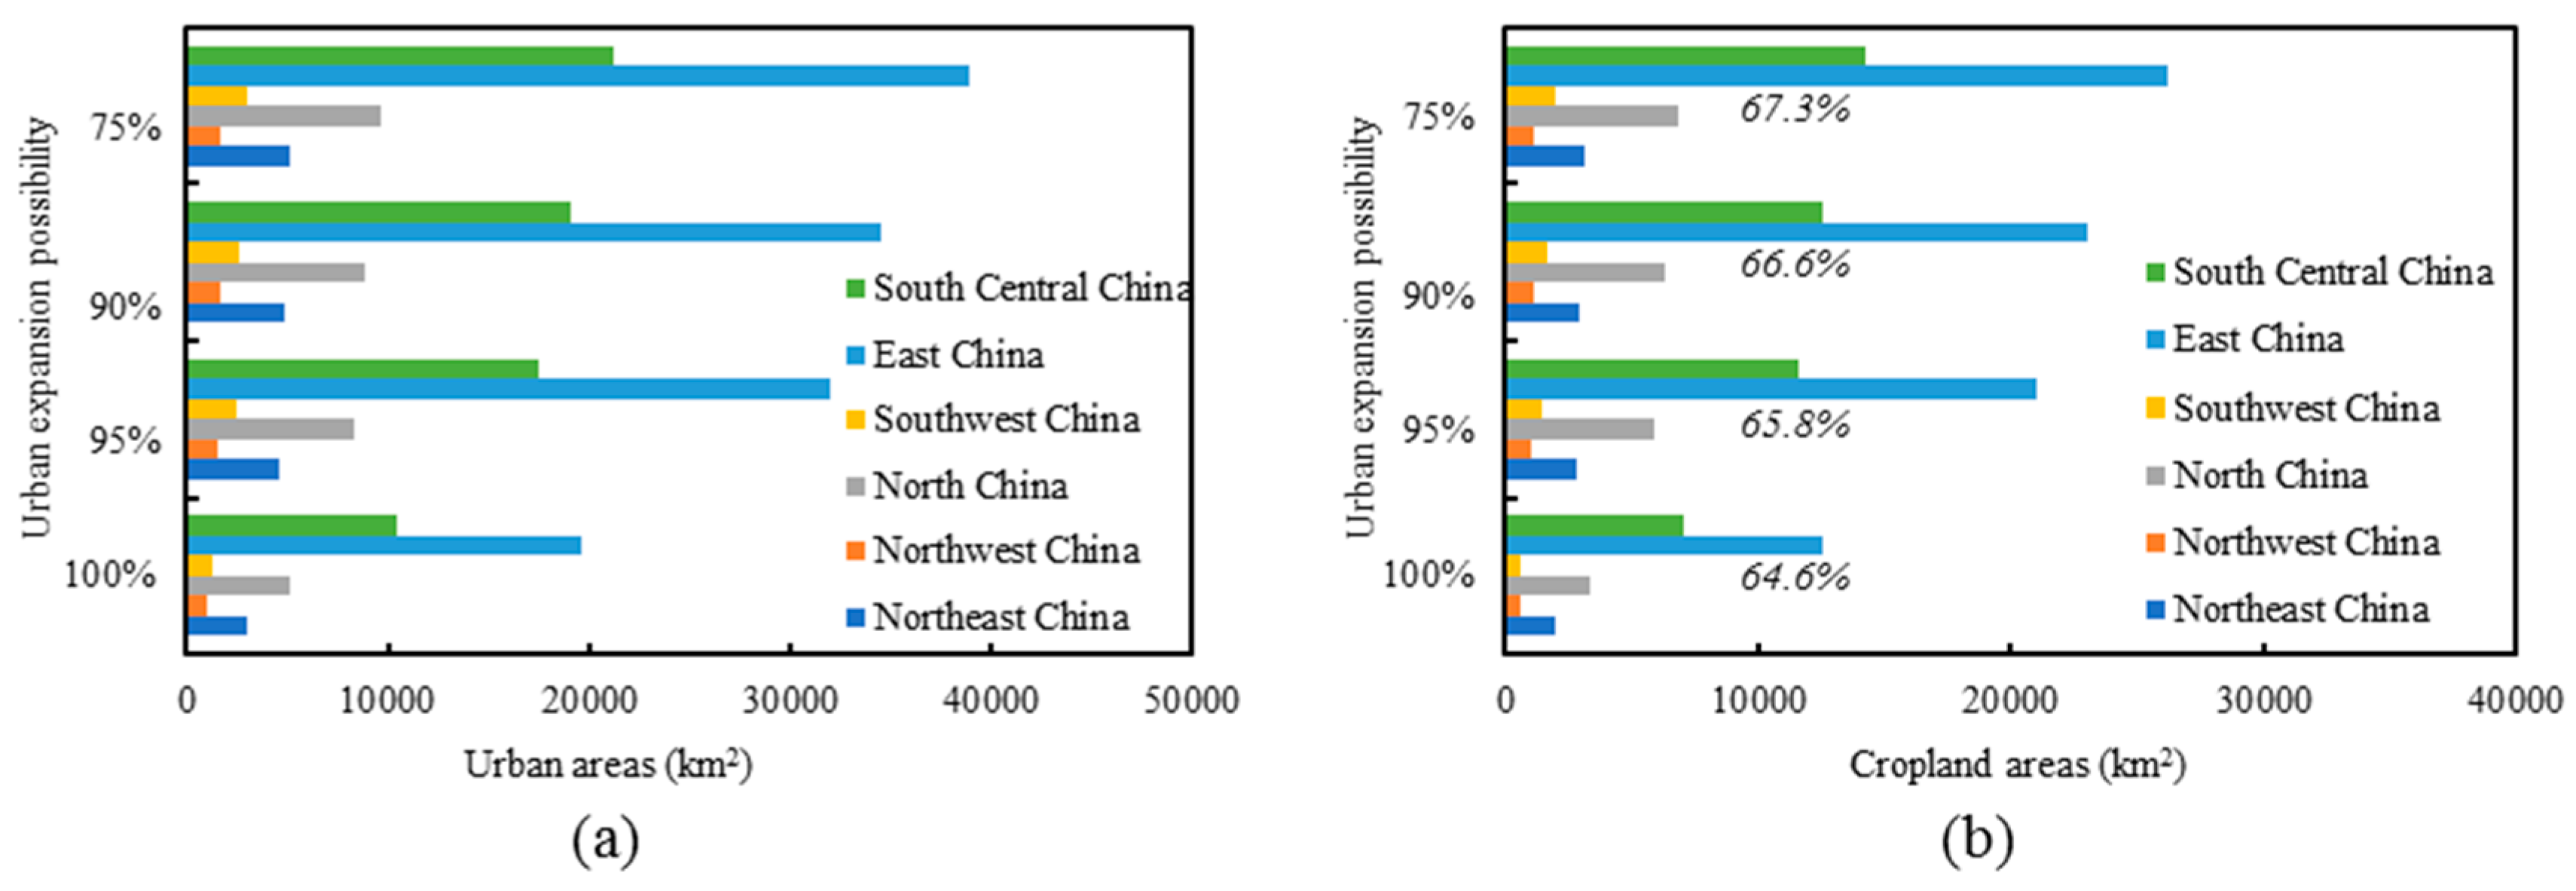
3.3. Predicted Impacts of Urban Expansion on Croplands from 2015 to 2030

Urban expansion will continue to affect croplands. There are two possible results for the situation in 2030 according to multi-year LULC data and spatial urban expansion data. Using the multi-year LULC data, we are able to calculate basic information about urban expansion (LUA) and its direct impact on cropland areas (LUCA).
The results of accuracy analyses showed that the accuracy of the Markovian chain model was relatively stable between two accuracy analyses (details are shown in Section 2.3 Markovian chain model and spatial analysis). It was clear that croplands occupied a large area but had a small error, while the urban area had a small area but large error. The estimated errors for croplands were −0.2% and 2.2%, for the Markovian method and LULC data, respectively, while the errors of urban area reached −9.1% and −9.4%, respectively (Table 1). We assume that, as the years pass, greater impact is experienced as 2030 is approached. In addition, to avoid using simulated data for predictions, it is necessary to predict future LULC data with historical LULC data on one occasion. We selected the LULC data in 2000 and 2015, therefore, to directly predict future LULC data in 2030.
We used the historical LULC data and estimated that the area of croplands will reach 1771.9 thousand km2 in 2030 (Table 1). From 2015 to 2030, we predict that there will be a reduction of 14.1 thousand km2 in croplands. However, NWC will contribute 16.4 thousand km2 of new croplands, the only increase among the six regions. The other five regions will experience smaller area changes in croplands in 2030 than in 2015. EC, which has the most rapidly increasing trend of urban expansion, will see the greatest decrease in cropland area. In 2030, the cropland area in EC will reduce to 336.2 thousand km2, compared with 350.1 thousand km2 in 2015. Correspondingly, the urban area in EC in 2030 will likely be around 26.4 thousand km2 (Figure 6). From 1990 to 2015, the urban area in China increased 2.09-fold, and the urban area is expected to increase 1.37-fold over the next 15 years. In 2030, new urban areas will probably comprise 19.4 thousand km2. All six regions are predicted to experience increasing urban expansion. EC, SCC, and NC will see increases in most urban areas, while NEC and NWC will expand most rapidly. In particular, EC and SCC will have 7.13 and 4.34 thousand km2 of new urban areas; and NEC and NWC will expand by 54.8% and 44.9%, respectively, in terms of new urban areas. The LUCA occupied by urban expansion in 2030 will be 19.4 thousand km2 greater than in 2015, according to the contribution proportion data.
The urban areas in 2030 can be directly extracted by the urban expansion data. The cropland areas occupied by urban expansion in 2030 can be estimated according to the spatial cropland data in 2015. We use the terms “SUA” and “SUCA” (corresponding to “LUA” and “LUCA”, respectively) to describe the urban expansion areas and cropland areas occupied by urban expansion according to the spatial urban expansion data. Because the spatial data allow us to set different probabilities of expansion, we chose four possibilities (100%, 95%, 90%, and 75%) to analyze the SUA and SUCA. Both SUA and SUCA will be larger than LUA and LUCA in 2030 (Figure 7). The future contribution proportion of croplands will be 64.6% (100% probability of urban expansion), 65.8% (95% probability of urban expansion), 66.6% (90% probability of urban expansion), and 67.3% (75% probability of urban expansion). Based on the four urban expansion possibilities, the SUA values are 87.0, 113.0, 118.1, and 126.2 thousand km2, respectively (Table 1). The corresponding SUCA values are 26.2, 43.8, 47.7, and 53.9 thousand km2, respectively. EC and SCC will experience a greater expansion of urban area than the four other regions (Figure 7a), and these two regions will occupy more former croplands than the other regions (Figure 7b). Overall, results for SUA and SUCA for the different regions are similar to the results of LUA and LUCA, although the exact values are different.

4. Discussion

4.1. Mixed Pixel and Non-cultivated Land Coefficient

Analyses of remote sensing-derived data face the problem of mixed pixels, which limits the accuracy of results. Using remote sensing data, spatial areas are sometimes exaggerated as a result of the spatial resolution and mixed pixels. Because urban areas are always relatively concentrated, the effect of mixed pixels at a scale of 1 km in urban areas is less than the effect on mixed pixels depicting cropland areas. Additionally, using rough resolution data entails mixed pixels, but data with fine spatial resolution will bring a series of new problems, such as fragmented grids and noise points. In fact, even with the 30 m data, it is still hard to effectively eliminate the interference of mixed pixels like boundaries, roads, and farming infrastructure within cropland fields. Given the study region and the data resolution matching between LULC data and urban expansion data, we thus unified the data analysis on a 1 km scale.
The impacts of mixed pixels on predicting cropland area are obvious because croplands tend to be fragmented in China, especially in EC and SCC. To quantify the impacts of non-croplands within a pixel, we can use the concept of “non-cultivated land coefficient” [27]. The non-cultivated land coefficient refers to the spatial ratio of non-croplands within cropland pixels; thus, the coefficient can reflect the exact proportions of croplands and non-croplands. Furthermore, the coefficient is based on spatial resolution or analysis scale. Indeed, data are not the only limit considered by the non-cultivated land coefficient; many other factors affect the coefficient, such as original patch fragmentation and the density of rivers and road networks. According to the 30 m resolution Landsat image data, the maximum non-cultivated land coefficient is nearly 0.2 in arid regions with large areas of continuous croplands [28]. The coefficients in the EC and SCC regions will potentially be greater than in the other regions.
Based on our results, the cropland areas were 1793.0 and 1787.6 thousand km2 in 2005 and 2010, respectively, while the cropland areas were 1217.0 and 1354.0 thousand km2 in 2006 and 2009, respectively, according to the results of a national survey [29,30]. Although our data include croplands in Taiwan, Hong Kong, and Macao, the survey data are still far smaller than our results. We believe that the survey data provide the exact cropland areas, and thus the non-cultivated land coefficient should be approximately 0.28 at a resolution of 1 km. Although it is difficult to determine differences in the non-cultivated land coefficients among the six regions, in this study we did not convert the actual cropland areas using the non-cultivated land coefficients. Rather, we used the original statistical data to analyze the cropland areas.

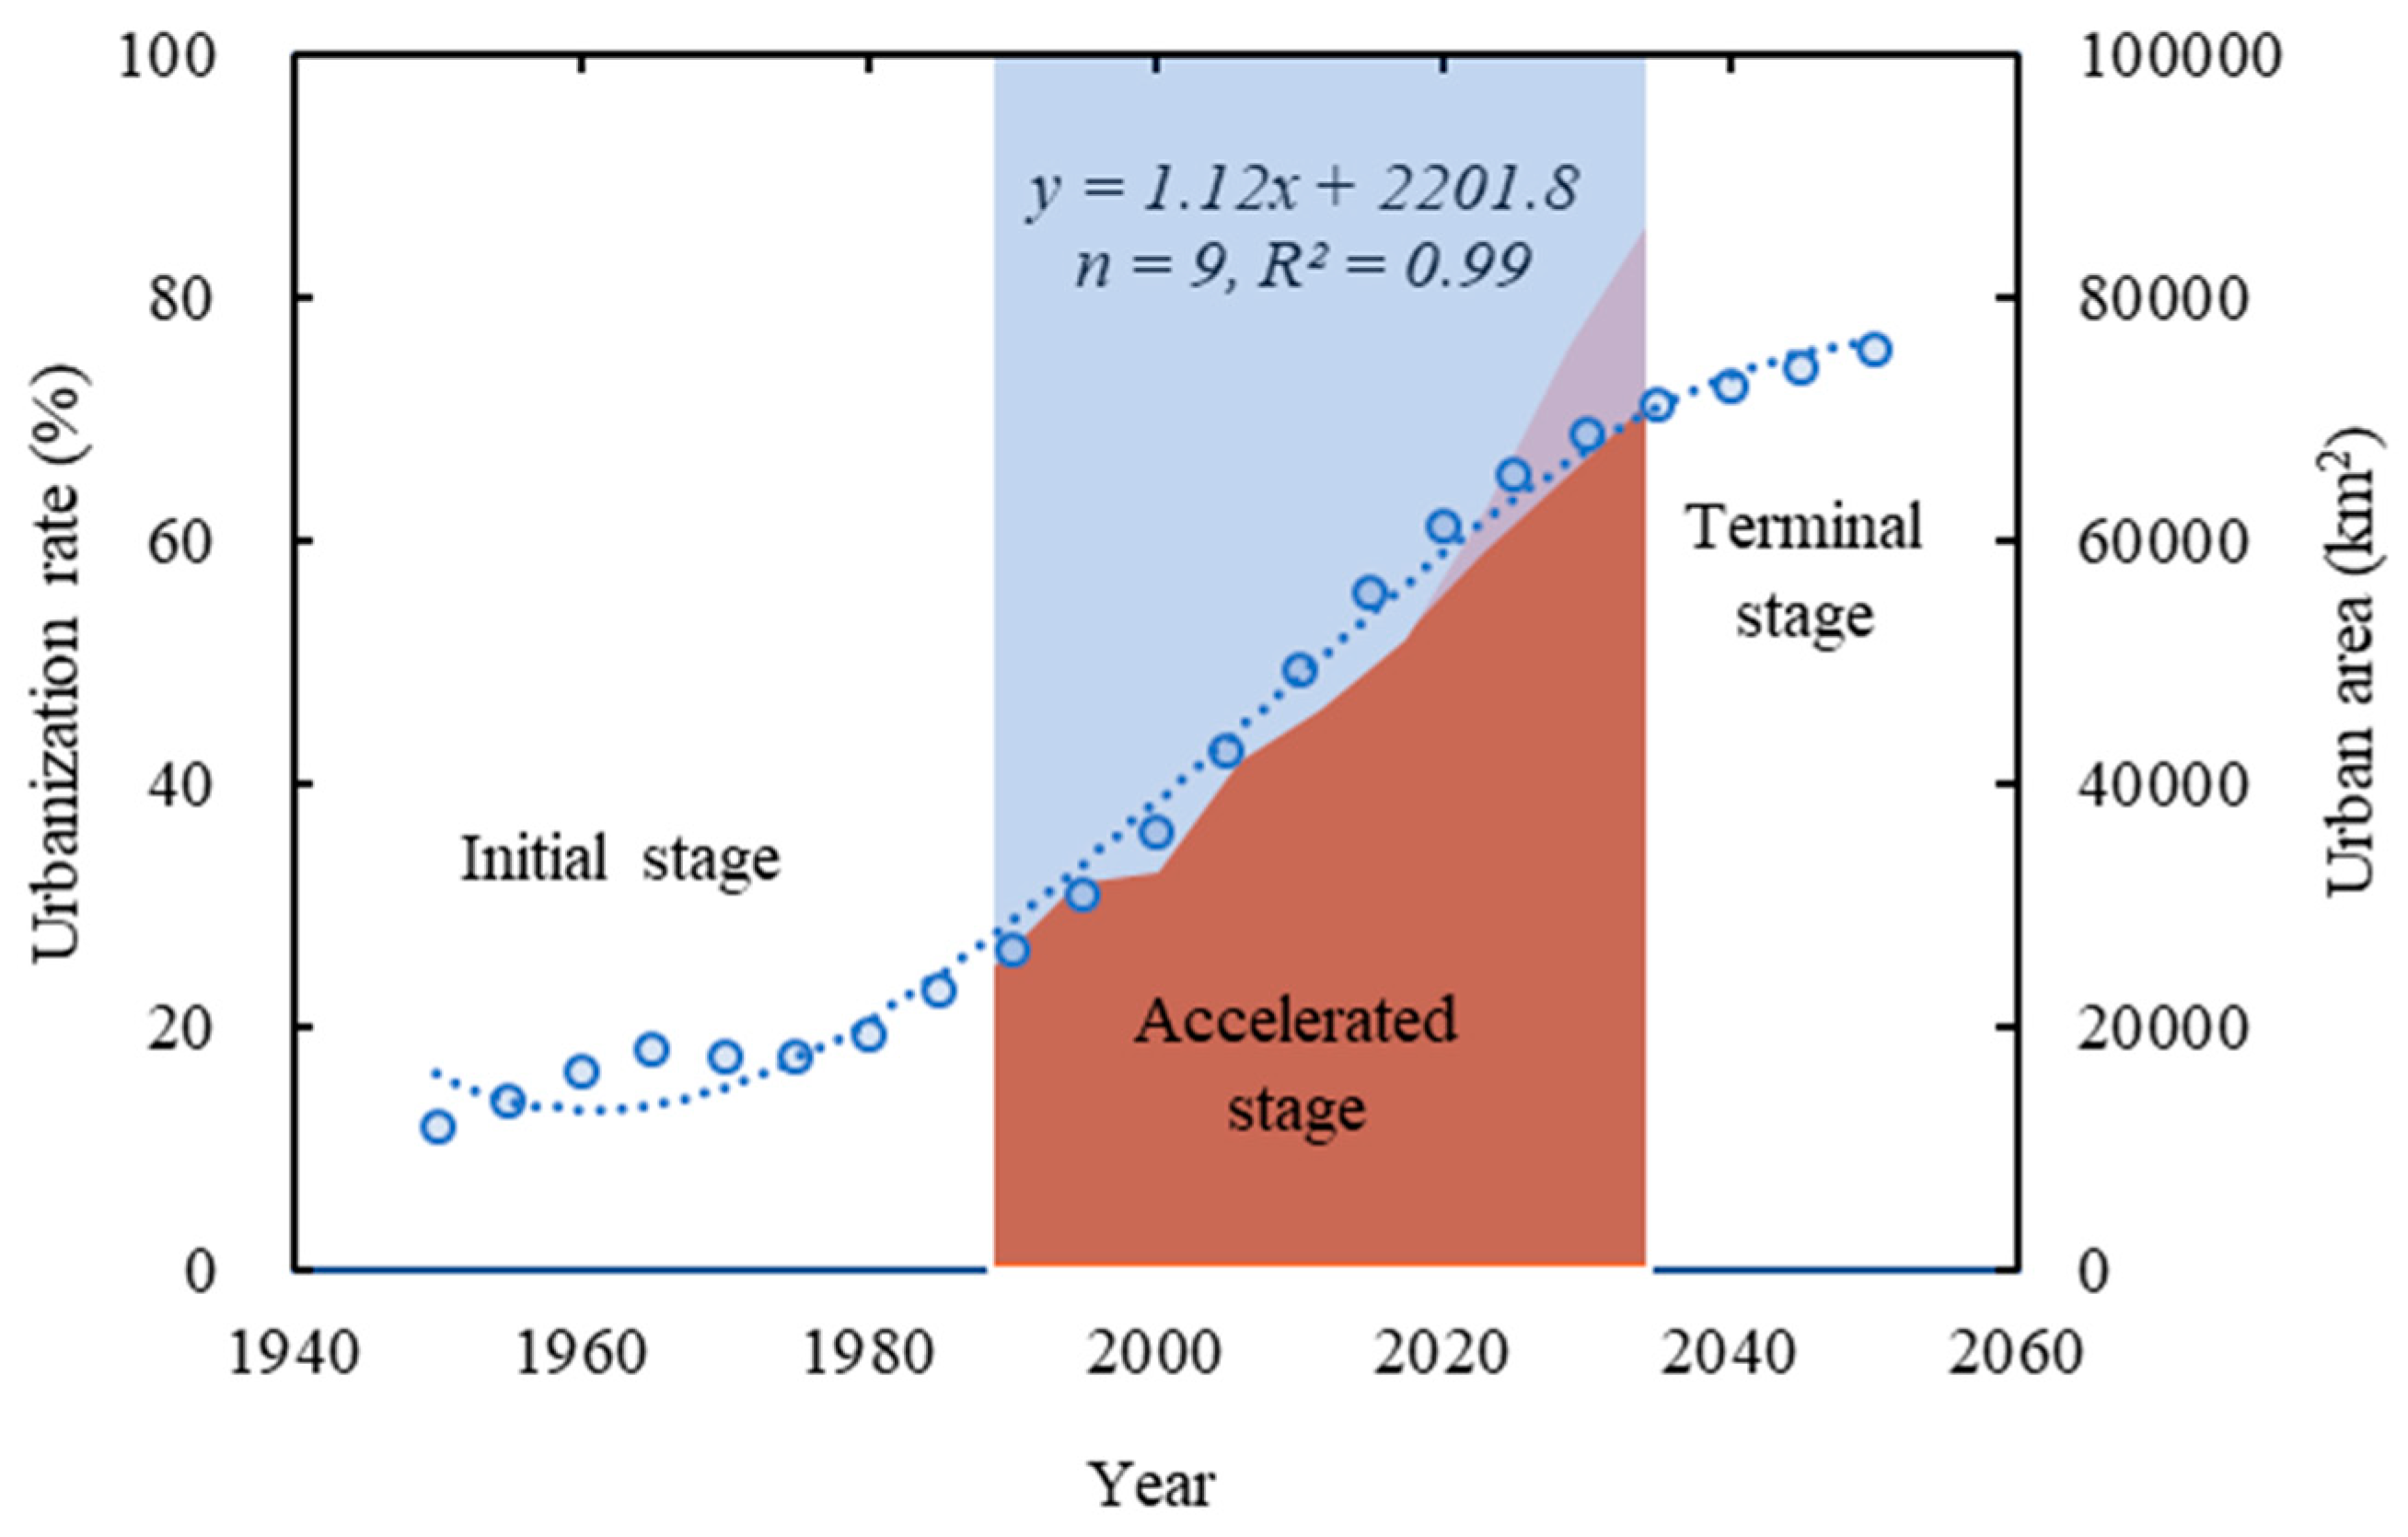
4.2. Urbanization and Its Impacts on Croplands

Based on research in the field of projections of future land use change, it is estimated that urbanization in China will continue to increase over the next few decades. China’s urbanization was in its initial stages before 1990 and may reach the terminal stage after 2030 (Figure 8). The urban population in China was less than 30% in 1990 and earlier, while it accounted for 56.6% in 2015 [31]. According to a United Nations forecast, the proportion of the Chinese population living in urban areas will reach 70% around 2030 [31]. The fitting analysis showed that urbanization from 1990 to 2030 will have a significant linear increase in China (R2 = 0.99); the urban area also shows an obvious expansion. All this clearly confirms our hypothesis that our study period is within the accelerated stage of urbanization [12]. Although the current proportion of urban areas in China (0.54% in 2015) is similar to the global urban areas average, no more than 60% of the Chinese population lives in urban areas and urbanization is predicted to continue rising [31,32,33]. Therefore, it is very likely that urban areas will increase by the amount of the current estimate (71.6–87.0 thousand km2 or more). As for the issue of the accuracy of future data, the relatively consistent results obtained by two datasets not only actually indicate the credibility of our study, but can also be used to compare and confirm each other. Additionally, although the Markovian chain model cannot consider the impacts of suitability for farming or construction, the two accuracy analyses show that the errors for future cropland and urban areas are stable to some extent.
The urbanization process inevitably causes loss of croplands. In China, the contribution of croplands to new urban expansion areas is greater than that of other land use classes. From the perspective of cropland supply, the higher contribution proportion means more negative impacts on food security in the region. However, our results indicate that cropland areas may not suffer a sharp decrease in the future. Actually, the results imply another hypothesis that the occupation proportion of future urban expansion on croplands maintains the contribution proportion of croplands in the historical period during the whole acceleration stage. The spatial distribution of cropland and urban areas is complex, however, our hypothesis does not account for some potential factors such as the spatial limitation of the geographical environment or the increasing densification of urban expansion and croplands as the land price rises. However, there is a huge area of croplands in China, and so the proportion of croplands occupied by urban expansion is theoretically insufficient to markedly affect the size of future croplands. However, it should be also noted that, along with the impacts of urban expansion on croplands, the spatial distribution of croplands occupied by urban expansion and newly cultivated arable lands also have potential impacts on food systems [1,34,35,36]. Our results show the northward cropland shifts, perhaps because of global warming, modern agricultural technology, or reclamation of reserved cultivated lands in northern regions [17,37]. The increased croplands in northern regions will need more light, temperature, water and fertilizer resources. This will subsequently result in various environmental and sustainability issues for food systems in the future [38,39,40].

4.3. Further Policy Inspirations

In considering the impacts of urban expansion on croplands in China, we further suggest that future policies should pay more attention to the urban-rural gap in economic growth and resource sharing [41,42]. The urban-rural gap in China is serious, and behind the prosperity of urban areas, vast rural areas are in continuous decline. The rural population is decreasing sharply during this accelerated stage of urbanization. Since the 1990s, rapid urbanization has been accompanied by a massive transfer of the rural population to urban areas under the market-led economy. Thus, empty villages and abandoned croplands have been increasing in rural areas in recent years [43]. Many croplands are only cultivated by older residents, because agriculture provides a low income. At the same time, the pressure to preserve prime croplands, and to ensure a self-sufficient supply of croplands and food security in China has always existed and may increase further. According to data from the National Bureau of Statistics (http://www.stats.gov.cn/), the area planted with grain in 2017 was 1.12 million km2, a figure that had decreased by 0.7% from 2016. However, the import and export data from the General Administration of Customs (http://www.customs.gov.cn/) showed that China’s total grain imports in 2017 reached 130.62 million tonnes, an increase of 13.9% over the previous year. Increasing requirement for land needed to protect ecology, and decreasing reserves of cultivated land, are also practical problems resulting from “projects of returning croplands to forests and grasslands” in China. The supply of land for urban areas can directly impact land and real estate prices and result in some economic problems at different urbanization stages. Perhaps importing food and making full use of extraterritorial food resources will benefit China and reduce the pressure on its environment; that is also of strong strategic significance for ensuring food supplies, and appears to be an effective policy present. In the long run, if China can maintain the stability of its food imports until the terminal stage of urbanization is entered, using the income from urban land to support the purchasing power for food imports is a policy that can be used for reference by other countries or regions. Throughout the study period, however, we found that dangers to food security owing to declining rural areas and elderly peasants will always exist. Therefore, urban construction lands will always be restrictive resources in China. In general, under the tide of urbanization, the development vitality of rural areas urgently needs support with resources and policies to allow its restoration. To sustain cropland supply, the Chinese Government clearly stipulates a “requisition-compensation balance”, but it is very unlikely that the new croplands will have the same crop yields as the previous ones [2,37]. Therefore, it may not be advisable to simply emphasize the “requisition-compensation balance” in the present and future.
The perspective of environmental sustainability and the geographical area of food supply for local residents must be considered. As food systems become more regional or even global, discussion on urban expansion and food systems is even more necessary, because the global or regional supply of food or food imports always masks the basic judgement that food security or a food crisis itself is always a local or regional issue [44]. Furthermore, urbanization is irreversible, and urban land cannot be cultivated effectively. In view of the above, some studies evaluate capacity and geographical boundaries to localize food supply so as to formulate urban-rural plans and strategies for improving local sustainability [45]. The geographical area of food supply required for a city often far exceeds the city itself and its suburban areas [44]. The United States Department of Agriculture even defines the local boundary of food supply as 644 km [46]. As far as China is concerned, although our study does not cover this topic, it is necessary to regulate inevitable and scattered urban expansion and cropland reclamation through well-considered urban-rural planning and appropriate allocation of resources.
Overall, during this developmental stage in China, the problems related to urban expansion and croplands are very complicated. On the one hand, we should clarify that cultivated lands are facing pressures of loss and potential resource and environmental issues; on the other hand, we should also be aware of the enormous economic value of urban areas relative to croplands and realize that urbanization is an irreversible trend. In light of our findings, when formulating policies, we should consider them comprehensively.

5. Conclusions

Urbanization in China has led to dramatic increases in urban areas and unavoidable occupation of croplands. Our results document that urban areas will continue to increase rapidly through to 2030. We found that former croplands contributed more than 70% of new urban areas. However, our results show that the overall area of croplands in 2030 may reduce compared to 2015, but maintain a similar size compared to 1990. Moreover, the croplands tended to increase toward northern regions between 1990 and 2015. Our findings imply that cropland loss caused by urban expansion is not the only challenge facing future development. Given the dual needs for cropland supply and sustainable urbanization, active changes and adjustments in national land policies in different periods are also needed.

Author Contributions

Conceptualization, X.X., J.L. and Y.C.; methodology, Y.C. and J.D.; software, Y.C.; formal analysis, Y.C., N.L., Y.F., S.L., H.X. and B.S.; writing—original draft preparation, Y.C. and X.X.; writing—review and editing, Y.C. and X.Xiao; supervision, X.Xiao; funding acquisition, Y.C.

Funding

This research was funded by Natural Science Foundation of China (41671425 and 41401504), Chinese National Key Basic Research Program (2014CB954302), HENU-CPGIS International Collaborative Fund (JOF201701), Scientific Research Start-up Funding of Special Talent Zone in Henan University (Feng), and Key Research Program of Frontier Sciences by the Chinese Academy of Sciences (QYZDB-SSW-DQC005).

Acknowledgments

The authors acknowledge the Natural Resources and Environment Center, Chinese Academy of Sciences and Seto’s Lab at Yale University for providing land use data and urban expansion data. We thank John D. Stuart and the Writing Center at the University of Oklahoma and Elaine Monaghan, BSc (Econ), from Liwen Bianji, Edanz Editing China (www.liwenbianji.cn/ac), for editing the English text of this manuscript.

Conflicts of Interest

The authors declare no conflict of interest. The funders had no role in the design of the study; in the collection, analyses, or interpretation of data; in the writing of the manuscript, or in the decision to publish the results.

References

  1. Seto, K.C.; Ramankutty, N. Hidden linkages between urbanization and food systems. Science 2016, 352, 943–945. [Google Scholar] [CrossRef] [PubMed]
  2. D’Amour, C.B.; Reitsma, F.; Baiocchi, G.; Barthel, S.; Güneralp, B.; Erb, K.; Haberl, H.; Creutzig, F.; Seto, K.C. Future urban land expansion and implications for global croplands. Proc. Natl. Acad. Sci. 2016, 114, 8939. [Google Scholar] [CrossRef] [PubMed]
  3. Chan, K.W. Fundamentals of China’s urbanization and policy. China Rev. 2010, 10, 63–93. [Google Scholar]
  4. Huang, L.; Yan, L.J.; Wu, J.G. Assessing urban sustainability of Chinese megacities: 35 years after the economic reform and open-door policy. Landsc. Urban. Plan. 2015, 145, 57–70. [Google Scholar] [CrossRef]
  5. Wang, L.; Li, C.C.; Ying, Q.; Xiao, C.; Wang, X.Y.; Li, X.Y.; Hu, L.Y.; Lu, L.; Huang, H.B. China’s urban expansion from 1990 to 2010 determined with satellite remote sensing. Chin. Sci. Bull. 2012, 57, 2802–2812. [Google Scholar] [CrossRef] [Green Version]
  6. Deng, X.Z.; Huang, J.K.; Rozelle, S.; Uchida, E. Economic growth and the expansion of urban land in China. Urban. Stud. 2010, 47, 813–843. [Google Scholar] [CrossRef]
  7. Guo, L.Y.; Yang, R.; Wang, D.L. A study on the spatial difference of farmland nitrogen nutrient budget in the Bohai Rim region, China. J. Geogr. Sci. 2012, 22, 761–768. [Google Scholar] [CrossRef]
  8. Long, H.L. Land use policy in China: Introduction. Land Use Policy 2014, 40, 1–5. [Google Scholar] [CrossRef]
  9. Zhou, Y.L.; Xing, B.L.; Ju, W.M. Assessing the impact of urban sprawl on net primary productivity of terrestrial ecosystems using a process-based model—a case study in Nanjing, China. IEEE J. Sel. Top. Appl. Earth Obs. Remote Sens. 2015, 8, 2318–2331. [Google Scholar] [CrossRef]
  10. Chen, J. Rapid urbanization in China: A real challenge to soil protection and food security. Catena 2007, 69, 1–15. [Google Scholar] [CrossRef]
  11. Foley, J.A.; DeFries, R.; Asner, G.P.; Barford, C.; Bonan, G.B.; Carpenter, S.R.; Chapin, S.; Coe, M.T.; Daily, G.C.; Gibbs, H.K.; et al. Global consequences of land use. Science 2005, 309, 570–574. [Google Scholar] [CrossRef]
  12. Northam, R.M. Urban Geography; John Wiley & Sons: New York, NY, USA, 1975. [Google Scholar]
  13. Liu, J.Y.; Liu, M.L.; Tian, H.Q.; Zhuang, D.F.; Zhang, Z.X.; Zhang, W.; Tang, X.M.; Deng, X.Z. Spatial and temporal patterns of China’s cropland during 1990–2000: An analysis based on Landsat TM data. Remote Sens. Environ. 2005, 98, 442–456. [Google Scholar] [CrossRef]
  14. Liu, Y.; Hu, Y.; Long, S.; Liu, L.; Liu, X. Analysis of the effectiveness of urban land-use-change models based on the measurement of spatio-temporal, dynamic urban growth: A cellular automata case study. Sustainability 2007, 9, 796. [Google Scholar] [CrossRef]
  15. Hou, H.; Wang, R.; Murayama, Y. Scenario-based modelling for urban sustainability focusing on changes in cropland under rapid urbanization: A case study of Hangzhou from 1990 to 2035. Sci.Total Environ. 2019, 65, 422–431. [Google Scholar] [CrossRef]
  16. Wang, T.; Kazak, J.; Han, Q.; de Vries, B. A framework for path-dependent industrial land transition analysis using vector data. Eur. Plan. Stud. 2019, 1–22. [Google Scholar] [CrossRef]
  17. Dong, J.; Xiao, X.; Zhang, G.; Menarguez, M.A.; Choi, C.Y.; Qin, Y.; Luo, P.; Zhang, Y.; Moose, B. Northward expansion of paddy rice in northeastern Asia during 2000–2014. Geophys. Res. Lett. 2016, 43, 3754–3761. [Google Scholar] [CrossRef] [Green Version]
  18. Wang, F.; Zhao, L.Q.; Zhao, Z. China’s family planning policies and their labor market consequences. J. Popul. Econ. 2016, 30, 31–68. [Google Scholar] [CrossRef] [Green Version]
  19. Zhang, L.; LeGates, R.; Zhao, M. Understanding China’s Urbanization: The Great Demographic, Spatial, Economic, and Social Transformation; Edward Elgar Publishing: Cheltenham, UK, 2016. [Google Scholar]
  20. Wu, J.; Gyourko, J.; Deng, Y.H. Real estate collateral value and investment: The case of China. J. Urban. Econ. 2015, 86, 43–53. [Google Scholar] [CrossRef] [Green Version]
  21. Liu, Y.S.; Fang, F.; Li, Y.H. Key issues of land use in China and implications for policy making. Land Use Policy 2014, 40, 6–12. [Google Scholar] [CrossRef]
  22. Zhao, G.S.; Liu, J.Y.; Kuang, W.H.; Ouyang, Z.Y.; Xie, Z.L. Disturbance impacts of land use change on biodiversity conservation priority areas across China: 1990–2010. J. Geogr. Sci. 2015, 5, 515–529. [Google Scholar] [CrossRef]
  23. Friedl, M.A.; Sulla-Menashe, D.; Tan, B.; Schneider, A.; Ramankutty, N.; Sibley, A.; Huang, X.M. MODIS Collection 5 global land cover: Algorithm refinements and characterization of new datasets. Remote Sens. Environ. 2010, 114, 168–182. [Google Scholar] [CrossRef]
  24. Schneider, A.; Friedl, M.A.; Potere, D. A new map of global urban extent from MODIS satellite data. Environ. Res. Lett. 2009, 4, 44003–44011. [Google Scholar] [CrossRef]
  25. Seto, K.C.; Michail, F.; Burak, G.; Reilly, M.K. A meta-analysis of global urban land expansion. PLoS ONE 2011, 6, 23777. [Google Scholar] [CrossRef] [PubMed]
  26. Seto, K.C.; Burak, G.; Hutyra, L.R. Global forecasts of urban expansion to 2030 and direct impacts on biodiversity and carbon pools. PNAS 2012, 109, 16083–16088. [Google Scholar] [CrossRef] [Green Version]
  27. Liu, J.Y.; Yu, Z.Q. The study and practice on the application of colour infrared aerial remote sensing technique to non-cultivation coefficient calculation in Tibet. Remote Sens. Environ. 1990, 5, 27–37. [Google Scholar]
  28. Guan, Y.; Feng, X.L.; Gong, Y.L.; Wang, Y.B. Study on non-cultivated land coefficient based on multi-scale RS image data. Sci. Surv. Mapp. 2011, 36, 192–194. [Google Scholar]
  29. Communiqué on the Primary Data of the Second National Land Survey; Ministry of Land and Resources and National Bureau of Statistics of China: Beijing, China, 2013.
  30. Second National Agricultural Census Main Data Bulletin (No. 6); National Bureau of Statistics of China: Beijing, China, 2008.
  31. United Nations, World Urbanization Prospects: The 2014 Revision. (Highlights (ST/ESA/SER.A/352)); Department of Economic and Social Affairs: New York, NY, USA, 2014.
  32. Cui, Y.P.; Xu, X.L.; Dong, J.W.; Qin, Y.C. Influence of urbanization factors on surface urban heat island intensity: A comparison of countries at different developmental phases. Sustainability 2016, 8, 706. [Google Scholar] [CrossRef]
  33. Liu, Z.F.; He, C.Y.; Zhou, Y.Y.; Wu, J.G. How much of the world’s land has been urbanized, really? A hierarchical framework for avoiding confusion. Landsc. Ecol. 2014, 9, 3–771. [Google Scholar] [CrossRef]
  34. Bruins, H.J.; Bu, F.X. Food security in china and contingency planning: The significance of grain reserves. J. Contingencies Crisis Manag. 2010, 14, 114–124. [Google Scholar] [CrossRef]
  35. Qin, Y.W.; Liu, J.Y.; Shi, W.J.; Tao, F.L.; Yan, H.M. Spatial-temporal changes of cropland and climate potential productivity;in northern China during 1990–2010. Food Secur. 2013, 5, 499–512. [Google Scholar] [CrossRef]
  36. Vliet, J.V.; Eitelberg, D.A.; Verburg, P.H. A global analysis of land take in cropland areas and production displacement from urbanization. Glob. Environ. Chang. 2017, 43, 107–115. [Google Scholar] [CrossRef]
  37. Song, W.; Liu, M.L. Farmland conversion decreases regional and national land quality in China. Land Degrad. Dev. 2016, 28, 459–471. [Google Scholar] [CrossRef]
  38. Cui, Y.P.; Ning, X.J.; Qin, Y.C.; Li, X.; Chen, Y.M. Spatio-temporal changes in agricultural hydrothermal conditions in China from 1951 to 2010. J. Geogr. Sci. 2016, 26, 643–657. [Google Scholar] [CrossRef]
  39. Carole, D.L.; Naota, H.; Qiu, H.G.; Mauzerall, D.L.; Ignocia, R.I. Water resources transfers through Chinese interprovincial and foreign food trade. PNAS 2014, 111, 9774–9779. [Google Scholar] [Green Version]
  40. Liu, C.M.; Yu, J.J.; Kendy, E. Groundwater Exploitation and Its Impact on the Environment in the North China Plain. Water Int. 2001, 26, 265–272. [Google Scholar]
  41. Bai, X.M.; Shi, P.J.; Liu, Y.S. Society: Realizing China’s urban dream. Nature 2014, 509, 158–160. [Google Scholar] [CrossRef]
  42. Liu, Y.S.; Li, Y.H. Revitalize the world’s countryside. Nature 2017, 548, 275–277. [Google Scholar] [CrossRef] [Green Version]
  43. Liu, Y.C.; Chen, Y.F.; Hong, H.L. The process and driving forces of rural hollowing in China under rapid urbanization. J. Geogr. Sci. 2010, 20, 876–888. [Google Scholar] [CrossRef]
  44. Świąder, M.; Szewrański, S.; Kazak, J. Foodshed as an example of preliminary research for conducting environmental carrying capacity analysis. Sustainability 2018, 10, 882. [Google Scholar]
  45. Peters, C.J.; Bills, N.L.; Lembo, A.J.; Wilkins, J.L.; Fick, G.W. Mapping potential foodsheds in New York State: A spatial model for evaluating the capacity to localize food production. Renew. Agric. Food Syst. 2009, 24, 72–84. [Google Scholar] [CrossRef]
  46. Chen, S. Civic Agriculture: Towards a local food web for sustainable urban development. APCBEE Procedia 2012, 1, 169–176. [Google Scholar] [CrossRef]
Figure 1. A map of the six geographical regions: East China (EC), North China (NC), Northeast China (NEC), Northwest China (NWC), South Central China (SCC), and Southwest China (SWC). The map represents the spatial distribution pattern of nationwide cropland and urban area in China in 2015. The cropland and urban data were provided by Natural Resources and Environment Center, Chinese Academy of Sciences (http://www.resdc.cn/Default.aspx).
Sustainability 11 02283 g001
Figure 2. Changes of cropland along latitude in China from 1990 to 2015.
Sustainability 11 02283 g002
Figure 3. Trends in cropland and urban area in the six geographical regions from 1990 to 2015. Orange rhombuses represent the amount of urban area and blue dots represent the amount of cropland area (km2). The orange and blue dotted lines represent the corresponding fitted regression lines for variations in urban and cropland areas. Here, yu and xu reflect urban area and yc and xc indicate cropland area. These figures are generated using the multi-year land use and land cover (LULC) data.
Sustainability 11 02283 g003
Figure 4. Urban expansion in six typical cities in China from 1990 to 2015. We selected six major cities located in the six Chinese regions: Zhengzhou (SCC), Shanghai (EC), Chengdu (SWC), Beijing (NC), Xi’an (NWC), and Shenyang (NEC). The red pixels represent urban areas and the light green pixels represent croplands. These figures are generated using the multi-year LULC data.
Sustainability 11 02283 g004
Figure 5. Contribution proportion of cropland to urban expansion in the six regions. The figure is generated using the LULC data from 2000 to 2015.
Sustainability 11 02283 g005
Figure 6. Urban areas and croplands in 2030. The figure is generated using the multi-year LULC data.
Sustainability 11 02283 g006
Figure 7. New urban expansion areas (SUA) from 2015 to 2030 (a), and cropland areas occupied by urban expansion (SUCA) from 2010 to 2030 (b). The numbers with italic style indicate the future contribution proportions of cropland to urban expansion. The figure is generated using the spatial urban expansion data.
Sustainability 11 02283 g007
Figure 8. The stages of urbanization according to the urban population in China from 1950 to 2050 and urban area changes from 1990 to 2030. Our study period from 1990 to 2030 (blue highlighted area) is within the accelerated stage of urbanization. The orange and light red areas represent the urban areas from 1990 to 2030 (future urban areas are obtained by LULC and urban expansion data, respectively). The urban population data is derived from the World Urbanization Prospects: The 2014 Revision (United Nations 2014).
Sustainability 11 02283 g008
Table 1. Comparison of future cropland and urban areas (2030) between the two independent datasets and methods.
NameData and MethodCropland AreaName
Statistical analysis dataHistorical spatial LULC data from 2000 to 2015, Markovian chain model1771.9 (−0.2% to 2.2%) *71.6 (fixed value, −9.1 to −9.3%) *
Spatial urban expansion data (Seto et al. 2011)Spatial urban data in 2000, meta-analysis--87.0 (100% probability)
113.0 (95% probability)
118.0 (90% probability)
126.0 (75% probability)
Note: * based on the LULC data in 1990 and 2000, the estimated errors of cropland and urban area in 2010 by Markovian chain model were 2.2% and −9.37%, while based on the LULC data in 1995 and 2005, the estimated errors of that in 2015 were −0.2% and −9.1%, respectively.

