Impacts of Inter-Basin Water Transfer Projects on Optimal Water Resources Allocation in the Hanjiang River Basin, China


1
State Key Laboratory of Water Resources and Hydropower Engineering Science, Wuhan University, Wuhan 430072, China
2
Changjiang Institute of Survey, Planning, Design and Research, Wuhan 430010, China
*
Authors to whom correspondence should be addressed.
Sustainability 2019, 11(7), 2044; https://doi.org/10.3390/su11072044
Submission received: 7 February 2019
/
Revised: 19 March 2019
/
Accepted: 3 April 2019
/
Published: 6 April 2019
(This article belongs to the Special Issue Large-scale Water Projects, Socio-economic Development, and Environmental Sustainability)
Abstract
:Inter-basin water transfer project is an effective engineering countermeasure to alleviate the pressure of water supply in water-deficient areas and balance the uneven distribution of water resources. To assess the impacts of inter-basin water transfer projects on optimal water resources allocation, an integrated water resources management framework is proposed, and is applied to the middle and lower reaches of the Hanjiang River Basin in China. Firstly, future water demands are analyzed as inputs. Then, a multi-objective water resources allocation model is formulated mitigating the negative impacts of water transfer projects on downstream water quantity and quality by using the non-dominated sorting genetic algorithm-II (NSGA-II). Finally, the indicators of water supply reliability, vulnerability and resilience are evaluated under different scenarios of inter-basin water transfer projects. The results indicate that: (1) the reliability and resilience of the water donor system will be gradually reduced while the vulnerability will be increased with the expansion of water transfer projects and the increase of water demand, (2) water supply risk is likely to increase in all zones (because zones at the boundary cannot obtain sufficient water due to limitations of local inflow and reservoir operation, while the amount of water available in the zones along the mainstream river is directly decreased by the water transfer projects), (3) more water supply measures and compensation measures will need to be implemented in the water donor areas. The framework proposed in this study to evaluate the comprehensive impact of inter-basin water transfer projects is conducive to water resources management.
1. Introduction
Due to the uneven spatial and temporal distribution of water resources, fresh water is an increasingly scarce natural resource in water-deficient areas [1]. What is more, human demand for water resources has increased dramatically because of the growth of population and the rapid expansion of industry and agriculture [2]. All of which have created conflicts between water supply and demand, and competition among different water use sectors has become increasingly serious in water resources management [3,4]. This has led to increased pressure on water resources, and increased risks to the water supply. The growing threat of unsatisfactory water demand and the need for sustainable economic social development of water-deficient areas present challenges to water resources managers [5].
Implementation of water transfer projects could be an effective engineering countermeasure, improving the water resources guarantee ability by artificially re-allocating water and thus mitigating the uneven distribution of water resources and balancing the inter-basin water resource development [6,7]. Many large-scale inter-basin water transfer projects have been implemented and planned in China, transferring part of the water from water-abundant basins to water-deficient basins, such as the Yellow River Project [8] and the East, Middle and West Route for the South-to-North Water Transfer Project [9,10,11]. The implementation of these water transfer projects involves complex water diversion works, long tunnel construction, large-scale water pumping, and reservoir operation. Their impacts on socio-economic and environmental systems are so great that they cause widespread concern in society. As well as playing an important supporting and safeguarding role in promoting economic and social development in the water receiving areas, any inter-basin water transfer system can also have complex physical, chemical, hydrological and biological implications for both the donor and receiving areas [12,13]. Undoubtedly, it is very important to thoroughly assess the potential impacts of the proposed water transfer projects.
Substantial studies have assessed the impacts of inter-basin water transfer projects implemented across the world [14]. However, most of these studies emphasize the impacts on biodiversity conservation [15,16,17] or the impacts on the water quality in the water receiving system [13,18,19]. Few of them assess the quantitative impacts of large-scale inter-basin water transfer projects on the water donor system, especially on the downstream of the intake after water diversion in the upstream [10]. In addition, water resources systems depend on various independent aspects, such as economic, social, and natural factors [20]. Thus, water resources allocation must take into account multiple objectives involving social, economic, environmental and political tasks, along with the improvement of living standards and the expansion of industrial water use [21,22]. Most studies only focus on a single goal when optimizing the allocation of water resources after a great quantity of water is transferred out of the water donor area, such as the minimization of water shortages [10] or maximizing the ratio of water supply [23], ignoring the other possible impacts. Therefore, a quantitative assessment of inter-basin water transfer projects based on a multi-objective optimal allocation of water resources in water donor areas is required and will allow the implementation of measures to alleviate the negative impacts on the water donor system.
This study proposes a multi-objective optimal water resources allocation model in the water donor areas to assess the impacts of inter-basin water transfer projects on water resources allocation. Water demand for each water user sector is analyzed to provide the inputs to the water resources allocation model. Then the multi-objective optimal water resources allocation model is built, which considers water shortages and the amounts of organic pollutants in water in the middle and lower reaches of the Hanjiang River basin. Lastly, the impacts of water transfer projects are analyzed by evaluating the performance indexes of the water donor system under different water transfer scenarios.
The remainder of this paper is organized as follows. Section 2 introduces the water transfer projects and water donor areas in the Hanjiang River basin. Section 3 describes the methodology used in this study. Section 4 presents the water resources allocation results using NSGA-II, and discusses the impacts of inter-basin water transfer projects on water resources allocation in the middle and lower reaches of the Hanjiang River basin, followed by Section 5 where conclusions are drawn.
2. Study Area and Data
2.1. Water Transfer Projects in the Hanjiang River Basin
The Hanjiang River is the largest tributary in the middle reach of the Yangtze River and serves as a water source for the middle route of China’s South-to-North Water Transfer Project. The whole basin is divided into the upper and the mid-lower reaches by the Danjiangkou Reservoir. Despite its relative abundance of water, with mean annual precipitation ranging from 700 to 1800 mm, the sub-tropical monsoon climate and the varying topography result in dramatic spatial–temporal diversity of water resources distribution. The Hanjiang River basin has long suffered from extremely uneven distribution of annual rainfall and runoff. The total trends of mean annual precipitation and runoff all decrease from southeast to the northwest.
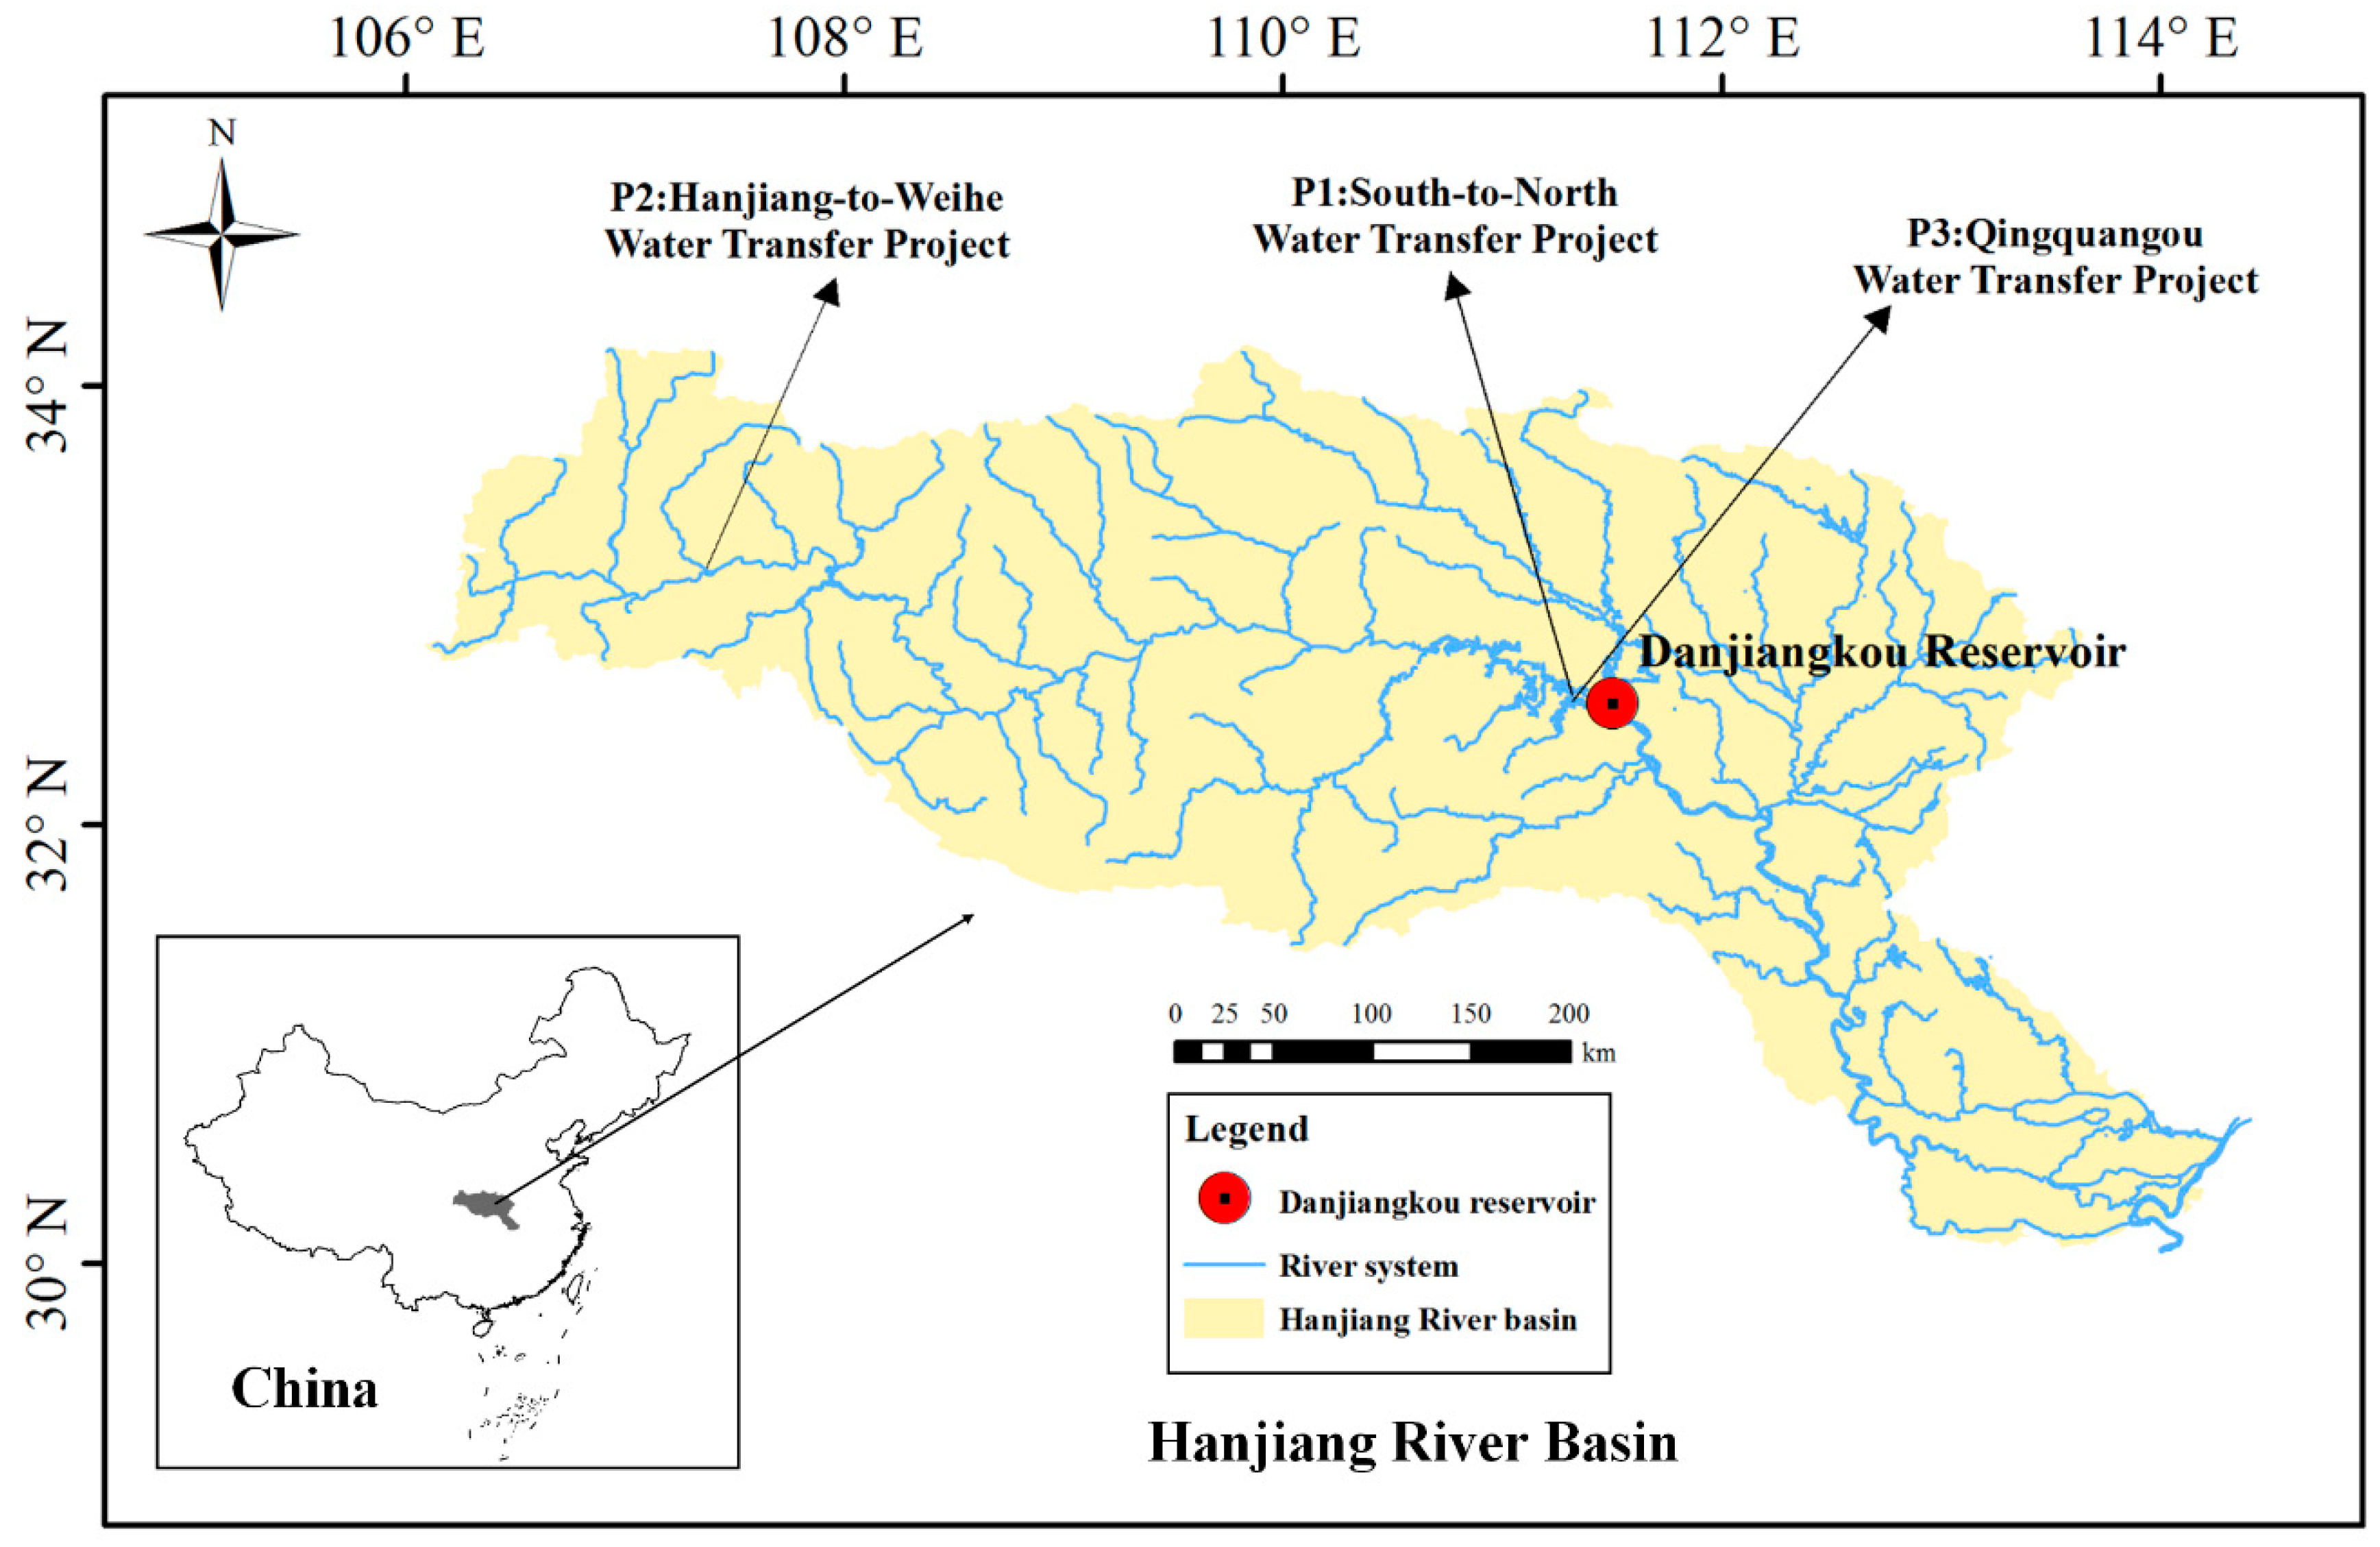
As an important engineering measure to alleviate the uneven distribution of water resources, inter-basin water transfer project has long been used to solve the problem of water shortages in water-deficient areas. There are three water transfer projects implemented in the Hanjiang River basin as shown in Figure 1. The South-to-North Water Transfer Project (P1), which delivers water from the Danjiangkou Reservoir to Beijing and Tianjin metropolitans, the Hanjiang-to-Weihe Water Transfer Project (P2) and the Qingquangou Water Transfer Project (P3). A brief description of these water transfer projects and their projected annual mean water transfers are shown in Table 1, which is based on the Integrated Water Resources Planning of Hanjiang River Basin.
According to Table 1, water diverted through the South-to-North Water Transfer Project and the Hanjiang-to-Weihe Water Transfer Project in 2020 will be 9.5 and 1.0 billion m3, of which about 8.5 and 1.0 billion m3 will be transferred outside the Hanjiang River basin, respectively. Meanwhile, water diverted through the Qingquangou Water Transfer Project will be 0.628 billion m3. Longer-term, in 2030, annual water transfer demands of the three water transfer projects (from P1 to P3) will become 13.13, 1.5 and 1.398 billion m3, respectively. And of which about 12.05, 1.5 and 0.291 billion m3 water will be transferred outside the Hanjiang River basin, respectively. All of these water transfer projects will directly decrease the amount of water available in the water donor area, which may increase the water supply risk in the middle and lower reaches of the Hanjiang River basin.
2.2. Study Area
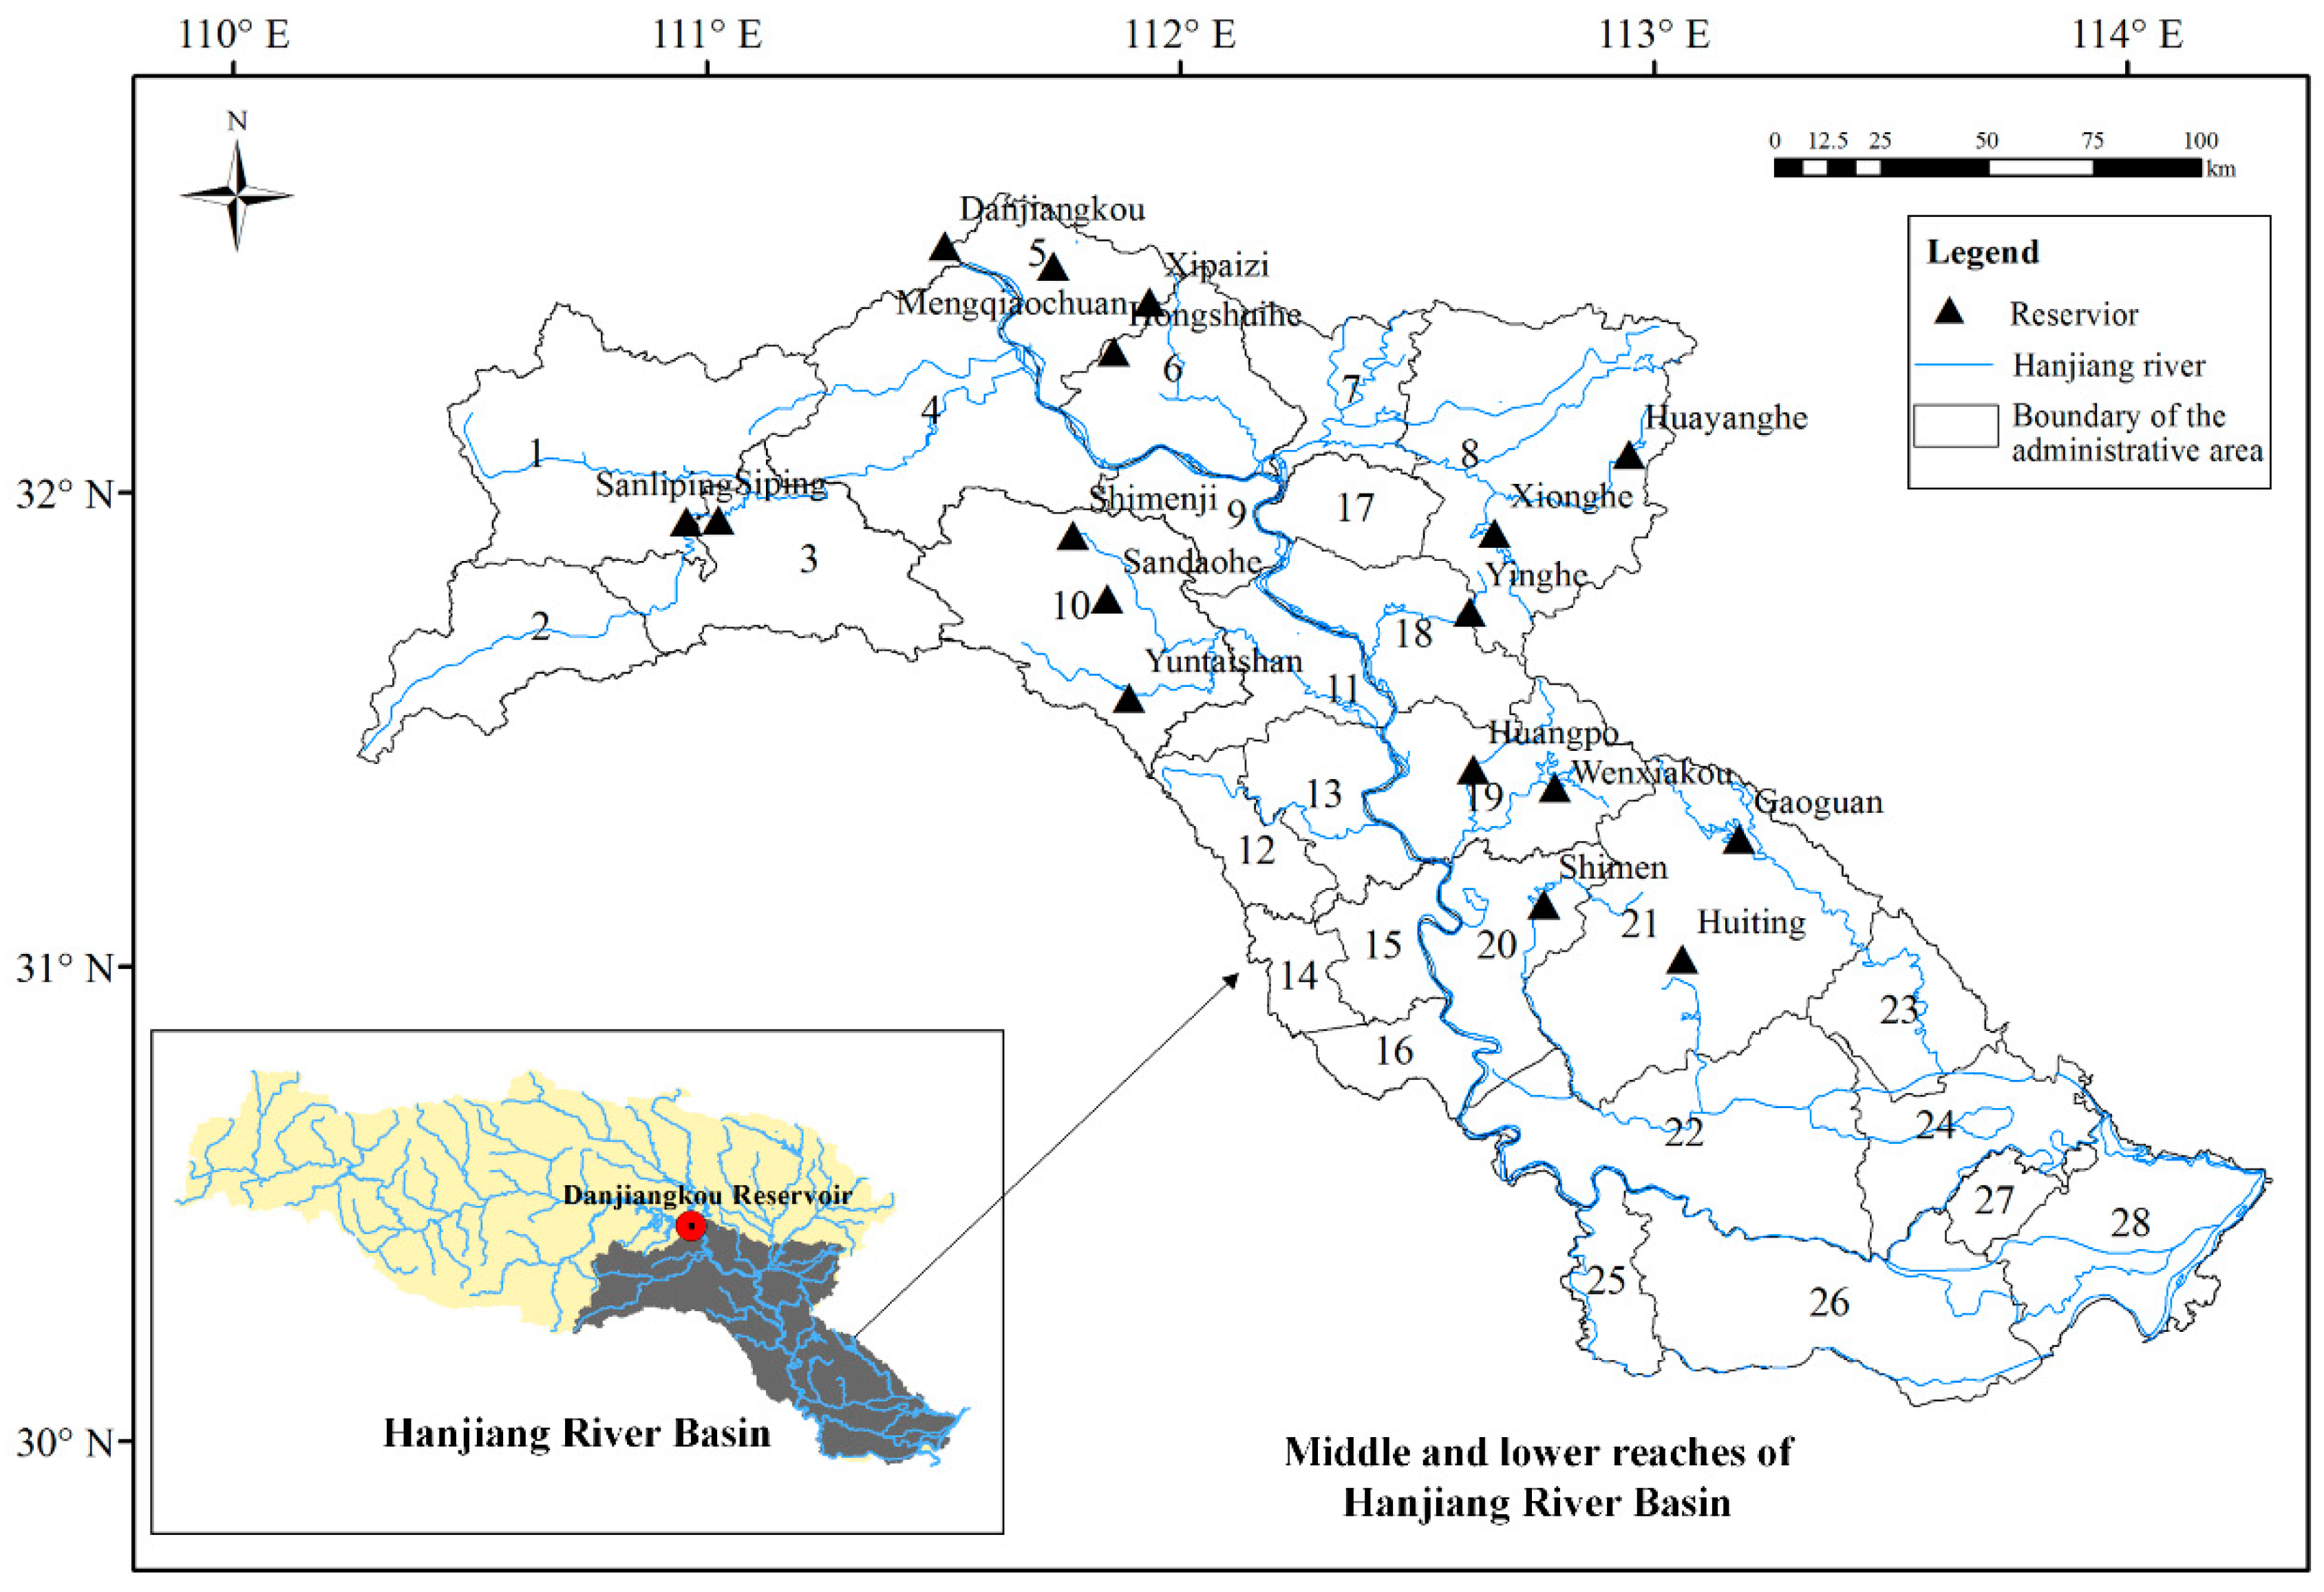
Danjiangkou Reservoir is the boundary of the upper and mid-lower reaches of the Hanjiang River basin, and the water is fed directly to the middle route of the South-to-North Water Transfer Project [24]. As the outflow of the upper region is the inflow of Danjiangkou Reservoir, the water availability in the middle and lower reaches of the Hanjiang River basin is directly impacted by the transfer projects and the reservoir’s operation. Therefore, the middle and lower reaches of the Hanjiang River basin is a very useful case study to help assess the impact of inter-basin water transfer projects. This area is located between 110°E–114°E and 30°N–34°N, with a drainage area of 63,800km2, including the cities of Shennongjia, Shiyan, Xiangyang, Jingmen, Xiaogan, Tianmen, Xiantao, Qianjiang, and Wuhan, and the districts under their jurisdictions. The spatial distribution of land use/cover types in the middle and lower reaches of the Hanjiang River basin has obvious topography and regional differences. The main types of land use are forest, farmland, and grassland, followed by the construction land, water body and bare land.
According to the intersections of watersheds, administrative county regions, reservoirs and hydrological stations, the middle and lower reaches of the Hanjiang River basin is further divided into 28 operational zones to construct the optimal water resources allocation model of water resources, as shown in Figure 2. Besides, 17 large or medium-sized reservoirs distributed along the mainstream of the Hanjiang River are taken into account in this study. The spatial distribution of the zones and the reservoirs is shown in Figure 2.
2.3. Data
Three sets of data are used in this study: hydrological data, water demand data series, and the basic characteristics and operation rules of the reservoirs.
(1) Hydrological data
Hydrological data is used to identify available water resources. The historical runoff data series of each operation zone and the inflows of reservoirs from 1956 to 2010 are collected from the hydrological almanacs compiled by the Bureau of Hydrology, Changjiang Water Resources Commission in China [25]. It should be noted that the closest meteorological station to an operation zone is chosen to represent the natural water resources abundance of that zone for each year.
(2) Water demand series
In this study, four types of water user sectors (domestic, industry, agriculture, and in-stream ecology) are considered. The priority of water supply in the four water user sectors is: in-stream ecology, domesticity, industry and then agriculture. It should be noted that the off-stream ecological water demand is contained in the domestic water demand.
Water demand scenarios, water consumption ratios, and social-economic development projections for each zone are collected from the report on the comprehensive management plan on water resources for the Hanjiang River basin [25], which was compiled by the Changjiang Water Resources Commission and approved by the local authorities.
(3) Information on reservoirs
There are 17 large or medium-sized reservoirs in the study area. Their basic characteristics (Table 2), operation rules and downstream river ecological demands are extracted from the Dispatching Schedules of Hubei Provincial Large Reservoirs, compiled by the Hubei Provincial Department of Water Resources [26].
3. Methodology
In this study, we propose a comprehensive water resources management model to evaluate the impacts of the inter-basin water transfer projects on the water donor areas. The proposed methodology consists of four parts: (1) analyzing water demands in different years, (2) using NSGA-II to optimize the water supply to different sectors in the multi-objective water resources allocation model, and (3) evaluating the optimal solutions to the water resources allocation model and the performance indexes under various water transfer project scenarios in Hanjiang River basin. The framework of the proposed methodology for assessing the impacts of inter-basin water transfer projects is shown in Figure 3.
3.1. Description of Scenarios
In order to explore the impacts of inter-basin water transfer projects on optimal water resources allocation, four scenarios are designed in Table 3, based on the different water transfer projects and projected annual water demands in the years 2020 and 2030, respectively. S1 is the base scenario without considering inter-basin water transfer project.
3.2. Water Demand Projection Module
Water demands for the four water user sectors within each year are calculated as follows.
3.2.1. Water Demand of the Socio-Economic Sectors
For each planning year, the quota method [27] is applied to estimate the annual water demand for the socio-economic sectors (domestic, industrial and agricultural sectors) by integrating water quotas and water activity levels:
where is the water demand of the jth sector in the ith operational zone at the tth month. is the water quota per unit of each water demand sector (the water quota unit is per capita water consumption in the domestic sector, water consumption per ten thousand Yuan in the industrial sector, and the net irrigation water requirement per unit area in the agricultural sector), which is estimated based on projected future economic development and local water management policies. is the water use per activity level (the water activity level is the projected population in the domestic sector, the projected GDP in the industrial sector, and the irrigated area in the agricultural sector). is the loss rate of the jth sector in the ith operational zone at the tth month.
3.2.2. Water Demand of the In-Stream Ecological Sector
The in-stream ecological water demand refers to the minimum water requirement to maintain the ecological and environmental functions of the river, to support the survival of aquatic wildlife and eco-environmental construction. The Tennant method [28] is used to estimate the in-stream ecological flow for each zone (shown in Equation (2)) by taking the product of the annual average runoff for the operational zone and the minimum required proportion of runoff in the flood season or non-flood season, respectively.
where is the in-stream ecological water demand of a river system in the ith operational zone at the tth month. is the average annual runoff for the ith operational zone, and is the proportional coefficient of minimum eco-environmental water demand for the ith operational zone.
3.3. Optimization of the Water Resources Allocation Model
3.3.1. Objective Functions
After the implementation of the water transfer projects, the amount of water available downstream of the water donor areas will have decreased. Therefore, one objective of the optimal water resources allocation model is to minimize the water shortages to the different sectors (social-economic sectors and in-stream ecological flow). Meanwhile, with the decrease of runoff in the water donor area, the dilution capacity of the water in the middle and lower reaches of the Hanjiang River will become increasingly weaker. If the sewage discharge remains unchanged, the water quality in the river will deteriorate further. Therefore, the other objective of the water resources allocation model is to minimize the amount of organic pollutants. The two objective functions are described as follows:
(1) Minimization of the water shortage
where is the water demand of the jth sector in the ith operational zone at the tth month, is the decision variable which means the water allocated to the jth sector in the ith operational zone at the tth month, T is the number of months, M is the number of operational zones, and N is the number of sectors.
(2) Minimization of the amount of COD
The total amount of organic pollutants in the water (represented by the chemical oxygen demand, COD) is given by
where di,j is the COD per unit of wastewater from the jth sector in the ith zone, pi,j is the wastewater discharge coefficient of the water supplied from the jth sector in the ith zone.
3.3.2. System Constraints
(1) Water balance equation of operation zones
where is the outlet discharge of the ith operational zone at the tth month, is the discharge from the nth upstream zone that has hydraulic connection with the ith zone, αn,i is a coefficient that takes values of zero or one depending on whether the nth upstream zone is interrelated with the ith zone, is the sum of the local water yield produced in the ith zone, is the release from the kth reservoir, βk,i is the hydraulic connection between the ith operational zone and the kth reservoir, which can be determined by the ratio of water diversion of the rivers between the ith operational zone and the kth reservoir, 0 ≤ βk,i ≤ 1, is the return flow coefficient of the jth sector in the ith operational zone, 0 ≤ ≤ 1. βk,i and are provided by the Changjiang Water Resources Commission in China. It should be noted that βk,i is constant within the same zone and the same reservoir, and is also constant for the same sector of the same zone in this model. is the amount of water loss including evaporation, seepage loss, and conveyances loss. is the amount of water transferred out of the basin.
(2) In-stream ecological water constraint
Some water should be retained in the rivers to maintain a healthy environment, which can support the survival of aquatic life and satisfy other ecological uses.
(3) Water balance equation of reservoir
where and are the volume of the kth reservoir at the tth and (t + 1)th month, respectively. is the inflow to the kth reservoir at the tth month and is the outflow discharge of the kth reservoir based on the operation rules. is the water loss of the kth reservoir at the tth month.
(4) Reservoir volume constraint
where and are the lower bound (the dead storage) and upper bound (storage below the flood-limited water level of the kth reservoir in the flood season, storage below the normal water level in the non-flood season) of the tth month, respectively.
(5) Water demand constraint
where is the water demand of the jth sector in the ith operational zone at the tth month.
(6) Water availability constraint
where is the available water in the ith operational zone at the tth month.
(7) Non-negativity constraint
3.3.3. Optimization Algorithm
The non-dominated sorting genetic algorithm-II (NSGA-II) was formulated by Deb et al. [29] as a fast and very efficient multiple-objective evolutionary algorithm, which incorporates the features of elitist archive and a rule for adaptation assignment that takes into account both the rank and the distance of each solution regarding others [30,31]. The algorithm consists of five operators: initialization, fast non-dominated sorting, crossover, mutation, and the elitist crowded comparison operator. It can be used to present the optimal trade-off between objectives and has been one of the most efficient and popular multi-objective optimization evolutionary algorithms [32,33].
The NSGA-II simulates the problem of water resources allocation as a biological evolution problem. The water supply allocated to each zone is taken as a decision variable. At first, the decision variables are coded and a feasible solution set is formed. The fitted degree of the objective function is judged to eliminate bad solutions and to select the optimal solutions. Then a new generation of a feasible solution set is generated. Finally, the water resources allocation is accomplished by repeated iterations. Because of its convenience and effectiveness, the NSGA-II has been widely used in the optimization of water resource systems. In this study, the proposed multi-objective allocation model is solved by using NSGA-II to search the solutions that comprise the Pareto-optimal frontier.
3.4. Evaluation Criteria
In order to quantitatively evaluate the impacts of inter-basin water transfer projects on the middle and lower reaches of the Hanjiang River basin from different aspects, a set of evaluation criteria are adopted to describe the water donor system [34,35]. These include the reliability, vulnerability, and resilience of the water supply. The first two criteria indicate the degree and magnitude of water supply failure, respectively. The resilience represents the rate of recovery from a failure of the water supply system. The specific meaning and calculation method of each index are given as below.
3.4.1. Reliability of Water Supply
The reliability of the water supply can be described by the probability that a water supply system remains in a satisfactory state [36]:
where is the reliability of the water supply in the ith operational zone, is the number of time steps with shortages in the ith operational zone. and are the total water supply and the total water demand in the ith operational zone at the tth month, respectively.
3.4.2. Vulnerability of Water Supply
The vulnerability of the water supply describes the characteristics of the severity of water deficits if a failure occurs [37]. There are a number of metrics of vulnerability in previous studies: (1) the mean deficit of each failure period over the operation horizon [38], (2) the maximum deficit over the operation horizon [39], (3) probability of exceeding a certain deficit threshold [40], (4) the return period of a certain level of cumulative deficit and [41], and (5) the median of all the deficits over the operation horizon [41]. The first two metrics are the most popular and can describe not only the cumulative deficit but also the extreme failures [37]. In this study, we chose the second metric to measure vulnerability, and it is defined as follows:
where is the vulnerability of the water supply in the ith operational zone. The other variables are as defined above.
3.4.3. Resilience of Water Supply
The resilience of the water supply describes the rapidity with which the water supply system returns to a satisfactory state after a failure [42]. By this definition, the higher the probability of recovery, the higher the resilience.
where is the resilience of the water supply in the ith operational zone and is the number of time steps that the water supply system is likely to take to recover from a water shortage in the ith operational zone at the tth month.
4. Results and Discussion
4.1. Water Demand in 2020 and 2030
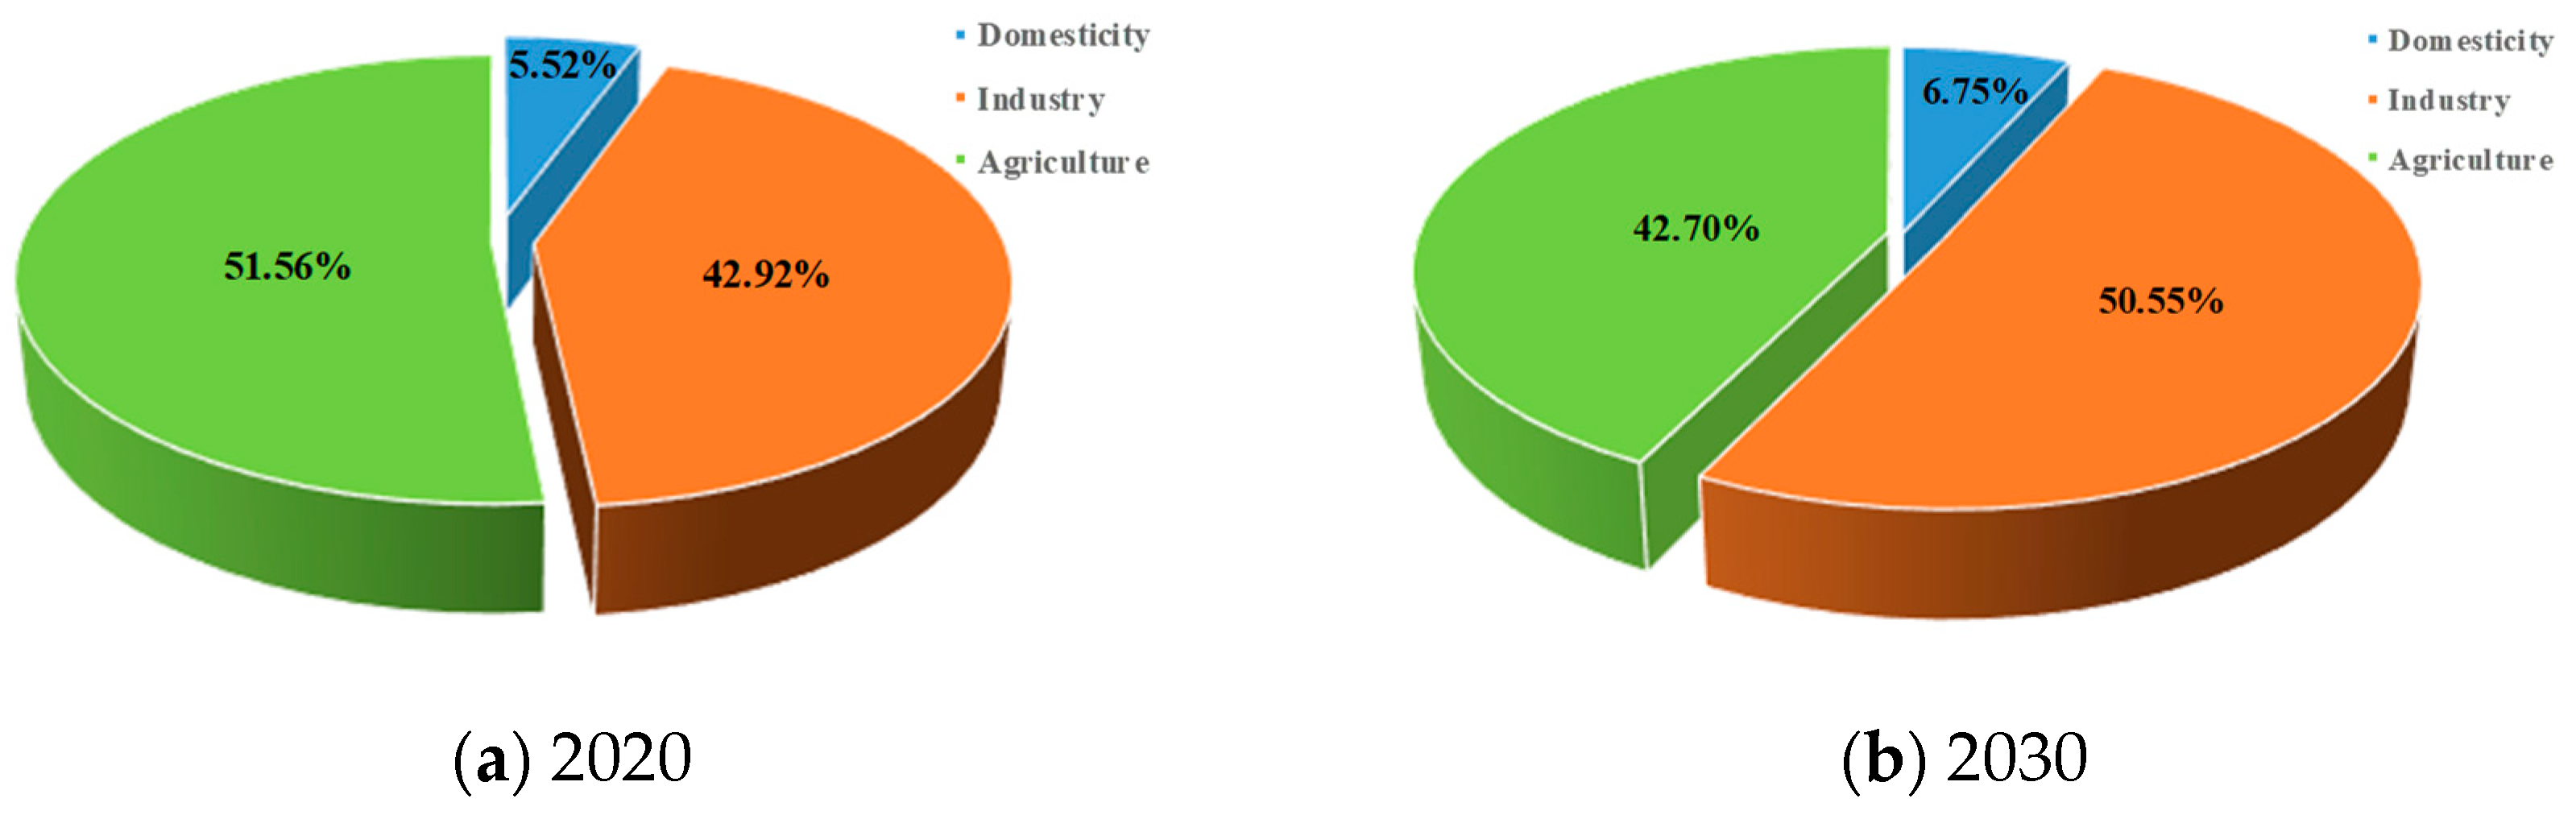
Based on the quota method and the Tennant method in the water demand projection module and the Integrated Water Resources Planning of Hanjiang River basin, the water demand of the different sectors is estimated for each zone in both 2020 and 2030. The annual water demand of three off-stream water user sectors is summed across all zones and shown in Table 4. Figure 4 shows the proportion of average water demands with respect to the socioeconomic sectors in the middle and lower reaches of the Hanjiang River basin.
According to Table 4 and Figure 4, it is obvious that the total off-stream water demand in the middle and lower reaches of the Hanjiang River basin is projected to increase with the extension of the planning period. Under the four frequencies of 50%, 75%, 90%, and 95%, the off-stream water demand will be gradually increasing, ranging from 11.32 to 13.20 billion m3 in 2020, and from 12.53 to 14.18 billion m3 in 2030, respectively. From the perspective of the water user sector, the domestic water demand is projected to increase from 2020 to 2030, because of the population growth and the improvement of life standard (e.g., washing machine, heater, and flush toilet). Meanwhile, the industrial water demand is also projected to increase from 2020 to 2030, as a result of the socio-economic development. Domestic water demand increases slightly (from 5.52% to 6.75%), while it increases substantially for industry (from 42.92% to 50.55%). Conversely, the agricultural water demand is projected to reduce slowly by 2030 compared with the results for 2020 under the same water demand frequency. In 2020, the agricultural water demand is the largest (51.56%) among all the sectors and increases as the frequency of water demand increases. While in 2030, the water demand of industry is the largest among all the sectors (50.55%).
China’s socio-economic development is taken into account when the demands of different water users are estimated in the middle and lower reaches of the Hanjiang River basin. There is a so-called strictest water resources control system for water resources management policy, which is composed of “three red lines” (red line of water resources development and utilization control, red line of water use efficiency control and red line of water function zone restriction) of water resources management. As the Hanjiang River basin is chosen as a pilot area, the water consumption index, such as the amount of water consumed in the industrial sector per ten thousand Yuan of GDP (Gross Domestic Product) and the effective utilization coefficient of agricultural irrigation are both controlled by the red line of water use efficiency control policy. The relevant alternatives concerning water saving include irrigation styles and reducing the leakage rate of water supply infrastructure in the agricultural sector, using water saving technologies in the industry, such as recycled water, which will also be considered in the future water demand. Hence, the agricultural water demand is reduced slowly resulting from the promotion of water saving consciousness and the improvement of water use efficiency. Although recent results showed the water quota unit in the industrial sector was reduced with developing industrial water-saving technologies, the activity level which denotes the industrial output value in Chinese Yuan will increase rapidly due to dramatic socio-economic development. Therefore, industrial water demand is projected to increase by integrating water quotas and activity levels. And with the rising living standard and increasing population improvement, the domestic water demand shows a slight increase. In general, with the increase of the total off-stream water demand, the water supply in the middle and lower reaches of the Hanjiang River basin will face challenges.
4.2. Impacts of Inter-Basin Water Transfer Projects on the Optimal Water Resources Allocation
4.2.1. Impacts of Inter-Basin Water Transfer Projects on the Results of Optimal Water Resources Allocation
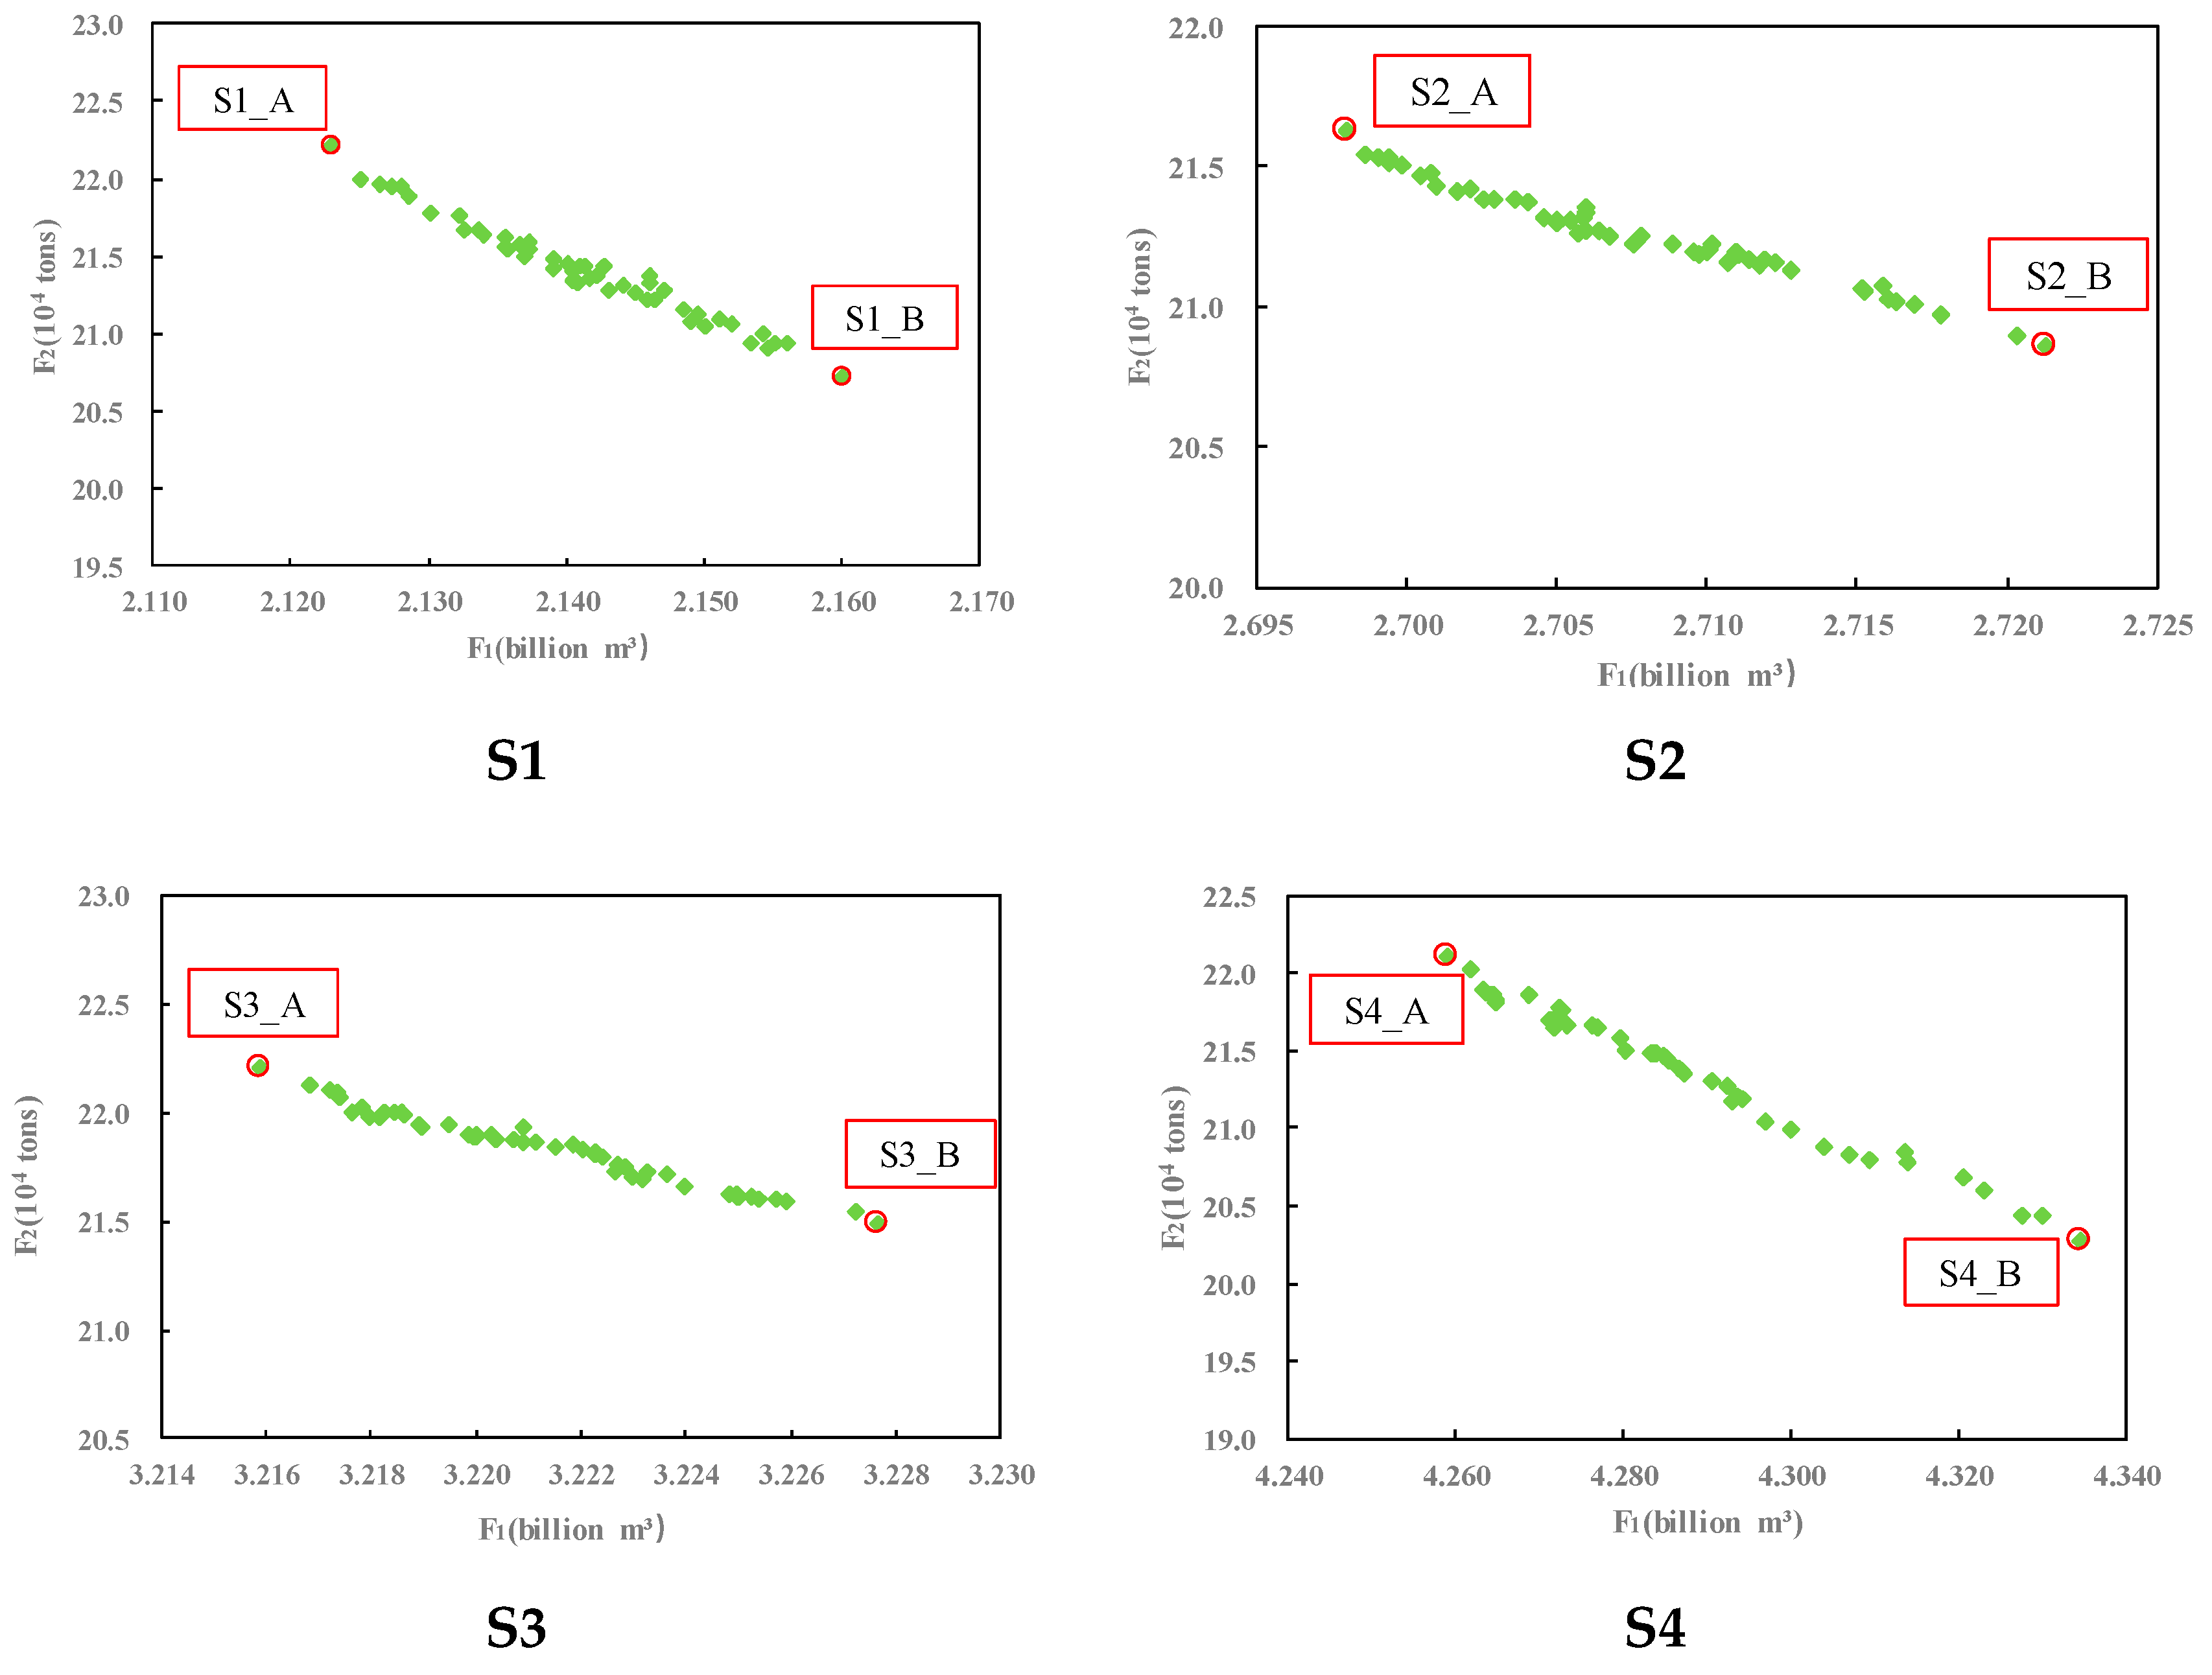
Historical hydrological and climatic data, reservoir inflows, water demand and water transfer projects are all input to the optimal water resources allocation model, which runs according to the reservoir operation rules and water resources allocation rules. By optimizing the water allocated to various water user sectors in different operation zones, the results of two objective functions in the water resources allocation model are calculated. Figure 5 shows the trade-off curves between the average annual values of water shortage (OF1) and the amount of COD (OF2) in the middle and lower reaches of the Hanjiang River basin under Scenarios S1–S4, which are obtained from the multi-objective water resources allocation model. The Pareto frontier populated with 50 Pareto optimal solutions under each water transfer scenario is obtained after 500 generations.
It can be seen from Figure 5 that the relation between the water shortage and the amount of COD is negative. The two objectives are interrelated and conflict with each other. Under the same water transfer scenario, the less the water shortage is (which means that the water supplied for the middle and lower reaches of the Hanjiang River basin will be greater through the optimization of the algorithm), the greater amount of COD will be. The reason for this is that the amount of COD is affected by the water supply. When the water supply is reduced, the amount of COD in the wastewater produced by the domestic and industrial sectors will be also reduced in the same quantities. Under four scenarios, the points at which the maximum and minimum values of the objective functions are marked with a circle in the red line. It should be noted that each point on the Pareto frontier corresponds to a scheme of water supply. The scheme corresponding to the minimum value of OF1 is named A, while the scheme corresponding to the minimum value of OF2 is named B. These are all marked in the red rectangle in Figure 5. When comparing the results of Scenario 2 with Scenario 1, or Scenario 4 with Scenario 3, it can easily be seen that the value of the water shortage will get larger and the amount of COD will get smaller, with the implementation of the inter-basin water transfer projects.
To further compare the results under different scenarios, the maximum or minimum value on the Pareto frontier of two objectives under each scenario are listed in Table 5. Taking the results of Scenario S1 as an example, the minimum water shortage was approximately 2.123 billion m3 when the amount of COD was 22.216 × 10⁴ tons (Scheme A), while the minimum amount of COD was 20.721 × 10⁴ tons when the water shortage value was approximately 2.160 billion m3 (Scheme B). As can be seen in Table 5, the values of Scheme A are 2.123, 2.698, 3.216, and 4.259 billion m3 under Scenarios S1–S4, respectively. This indicates that: (1) the unmet water demands mainly result from the implementation of water transfer projects (comparing S2 with S1), (2) the increase of the water demand would lead to greater water shortages (comparing S3 with S2), and (3) with the expansion of the water transfer projects, the water shortages will increase (comparing S4 with S3). However, the change in the amount of COD is not as dramatic as the water shortage. The reason might be that in the calculation of pollutant discharge, the value of the amount of COD is equal to the product of the wastewater discharge coefficient pi,j, the coefficient of COD content di,j and the water supply (Equation (2)). The two coefficients are both taken to be less than one in this study, which significantly weakens the change caused by the difference in the water supply.
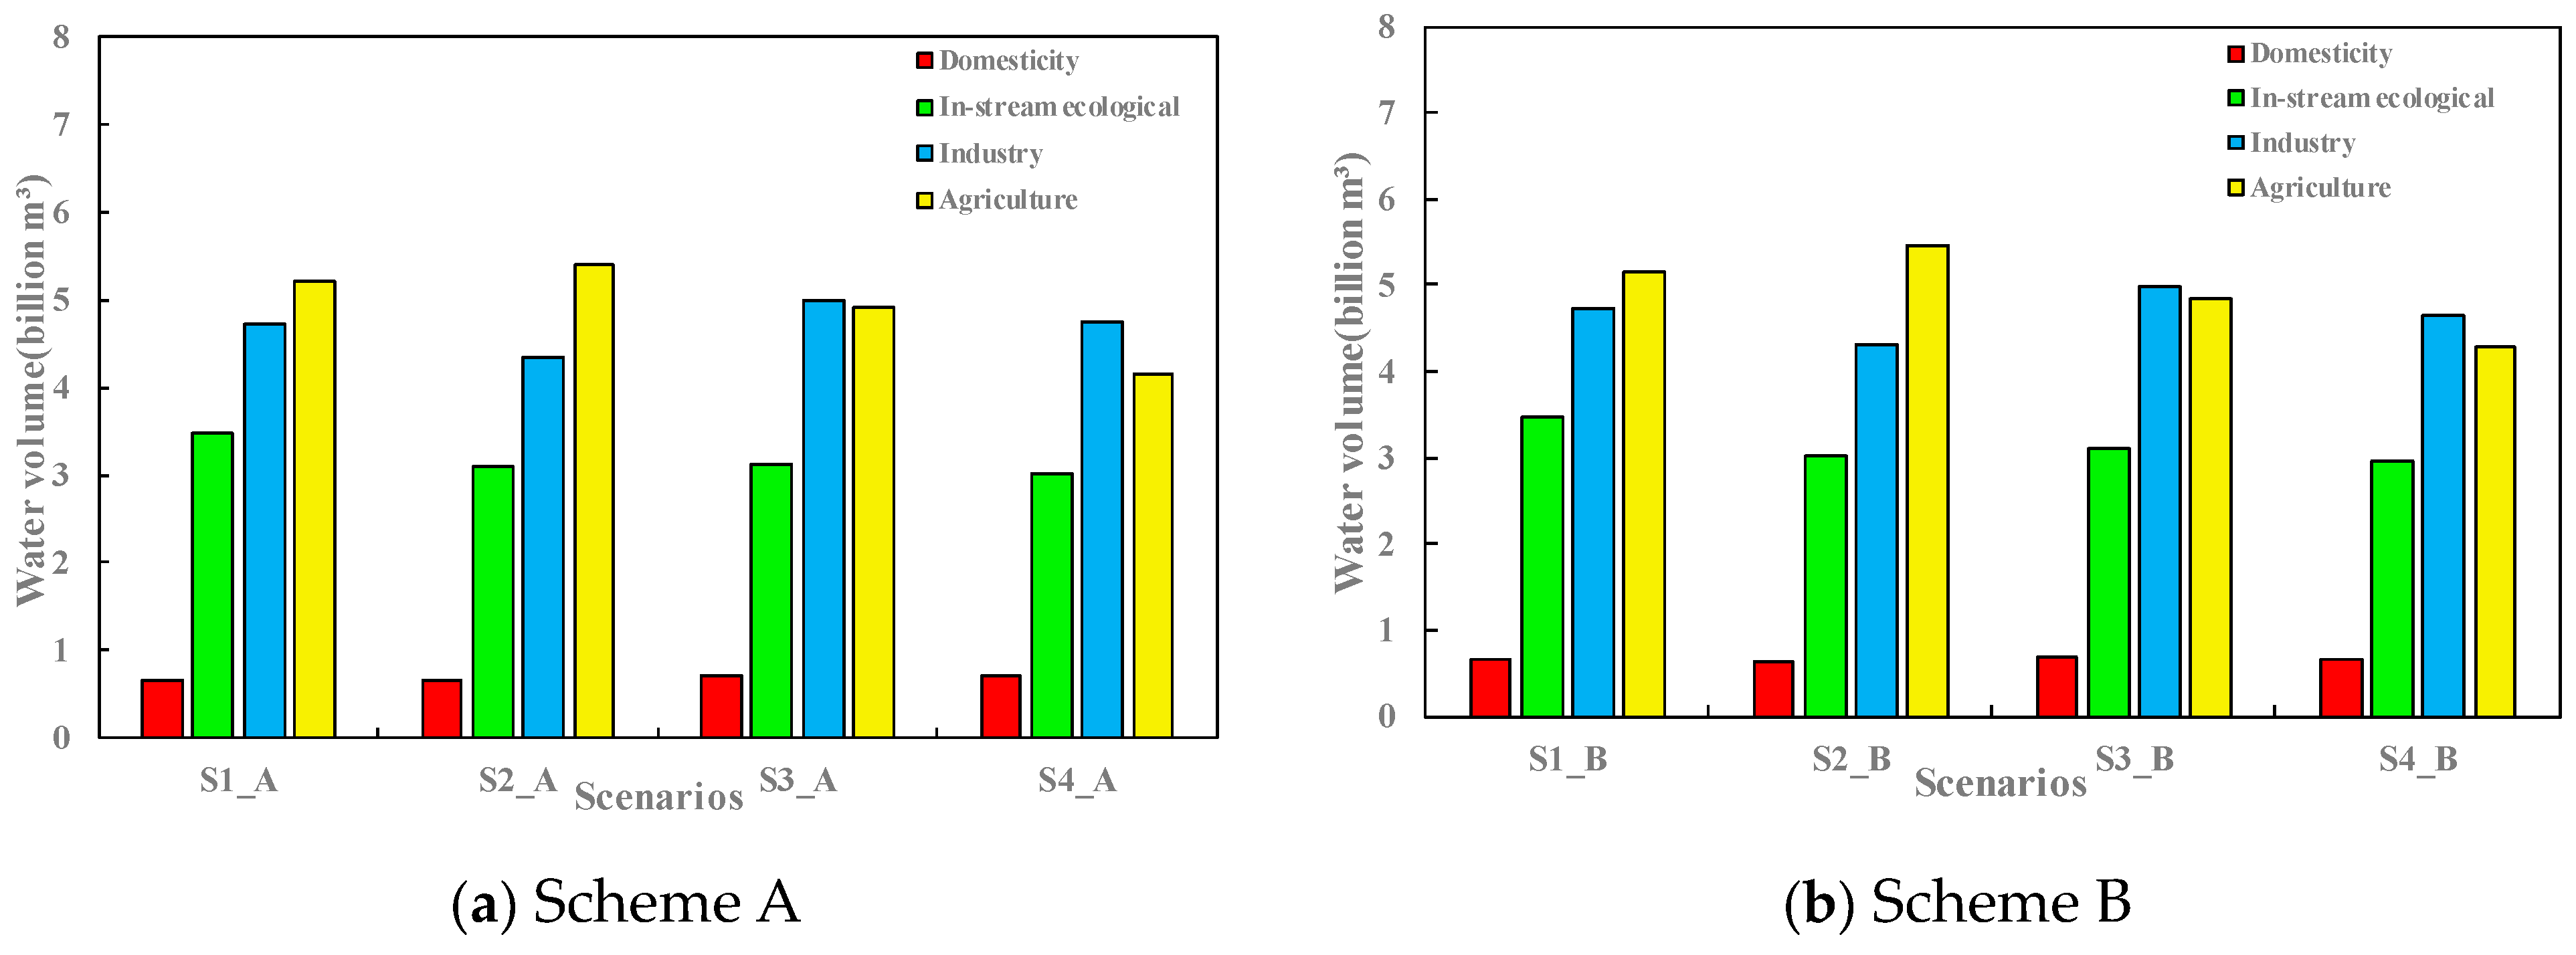
Figure 6 presents the optimization results of the water supply to different water user sectors in the middle and lower reaches of the Hanjiang River basin under Scenarios S1–S4. The results of Scheme A and B are shown in Figure 6a,b, respectively. For the results under the same scenario in Figure 6a, we can see the difference in water supply among the four sectors. Taking Scheme A under Scenario 1 as an example, the amounts of water supplied to domesticity, in-stream ecology, industry, and agriculture are 0.654, 3.473, 4.733, and 5.198 billion m3, respectively. Since the agricultural water demand is the greatest among all the sectors, the amount of water supplied to agriculture is the greatest, but the water shortage of agriculture sector is also the largest as a result of it having the lowest priority among all the sectors.
The difference in results is also very obvious with different scenarios. The inflows and the water demand of each zone in Scenario 2 are the same as in Scenario 1. However, the water supplies to industry and agriculture in Scenario 2 decreases significantly compared with Scenario 1, due to the implementation of inter-basin water transfer projects. Because the projects transfer water from the upper and midstream zones of the Hanjiang River to other basins, they can directly decrease the water flow in the upstream part of the Hanjiang River, which in turn leads to the reduction of water supply to the water user sectors. While the water supplies to the in-stream ecological and domestic sectors are unaffected, the reason is that both these two sectors have higher water priorities than the other sectors. When we focus on the results of Scenario 2 and Scenario 3, it is obvious that the amounts of water allocated to domesticity, in-stream ecology and industry under Scenario 3 are all larger than in Scenario 2. However, the amount of water allocated to agriculture is smaller than in Scenario 2. This can be attributed primarily to the effect of water demand. As the inflows and the water transfer projects are the same, Scenario 3 requires more water than Scenario 2. Due to the constraint of water demand in the model (Equation (9)), the amount of water allocated to each water user sector cannot be higher than the amount of water demand. According to the results of Scenario 3 and Scenario 4, the increase of water transfer projects would lead to a larger unmet demand. Therefore, the amounts of water supplied to the domestic and industrial sectors are greater under Scenario 3 than under the other three scenarios.
Through analyzing the optimal results of Scheme B (Figure 6b), we notice that the results of this scheme are similar to those of Scheme A under Scenarios S1–S4. From the comparison of the water supply between schemes B and A under the same scenario, we find that Scheme B can decrease the average annual water supply by 0.037, 0.023, 0.102, and 0.076 billion m3 under Scenarios S1–S4, respectively. This means that there is a trade-off between water supply and ecology, and if water managers favor one, the other will suffer.
4.2.2. Performance of Evaluation Criteria from the Inter-Basin Water Transfer Projects
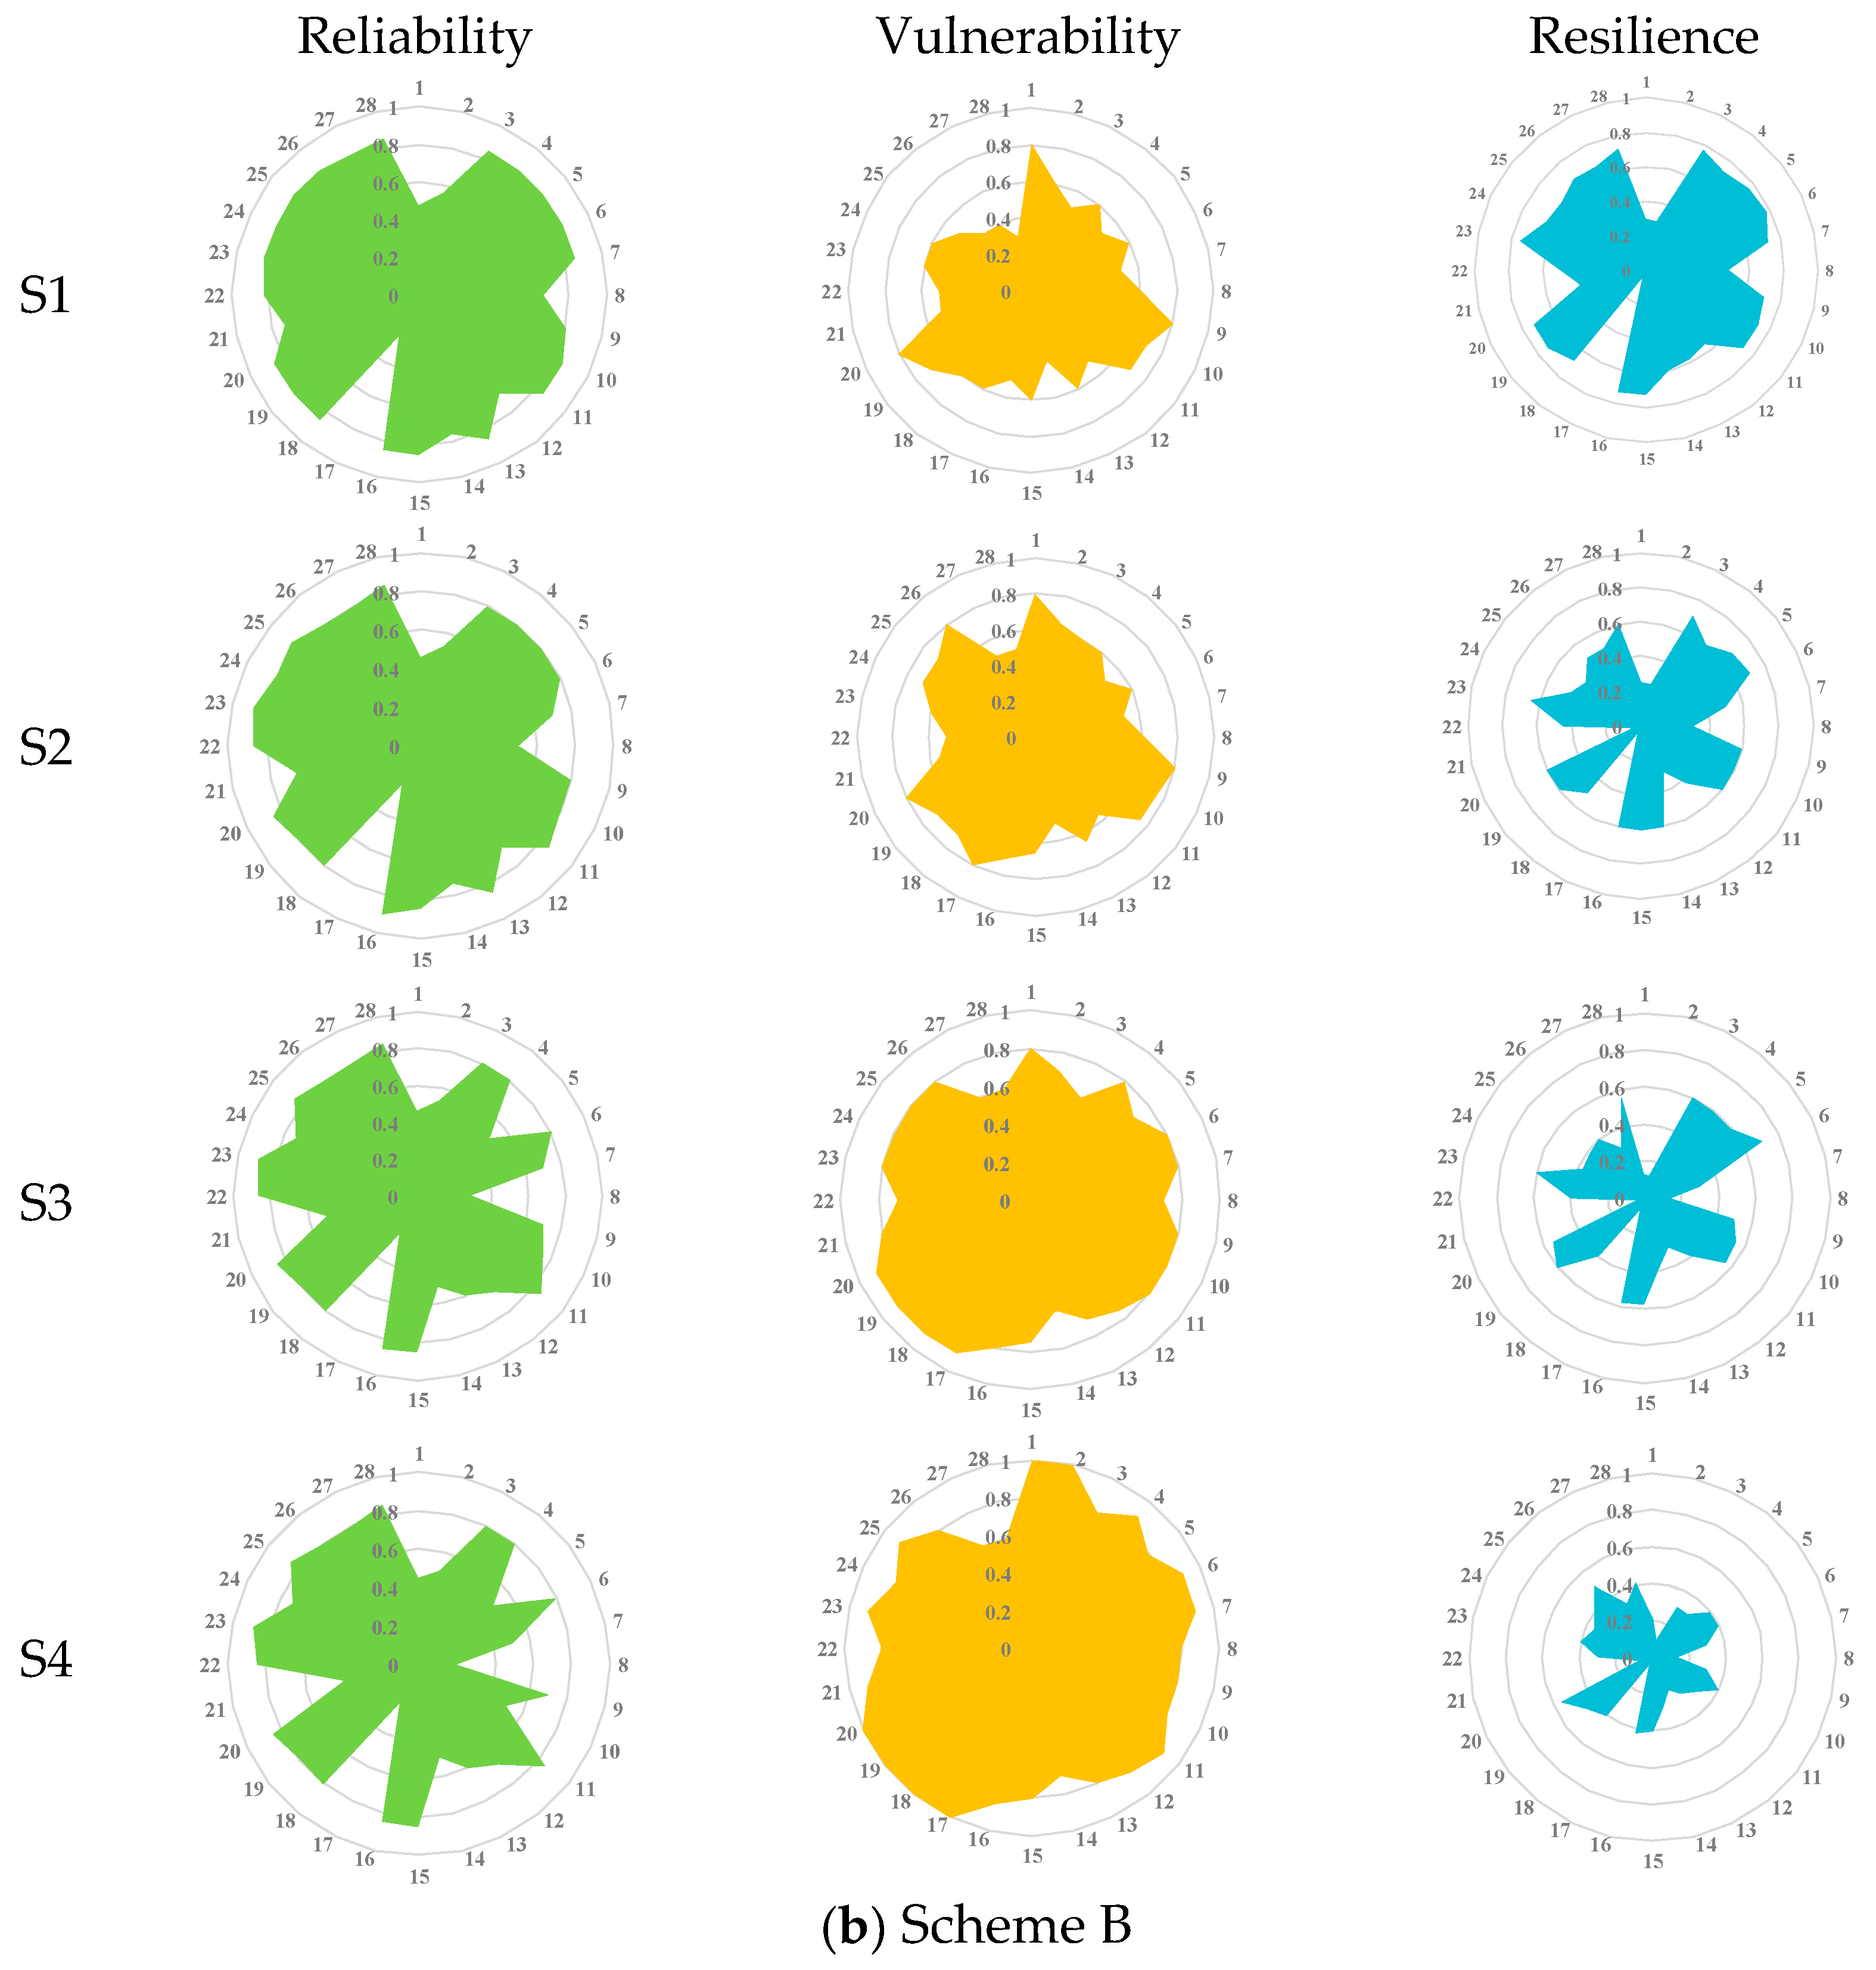
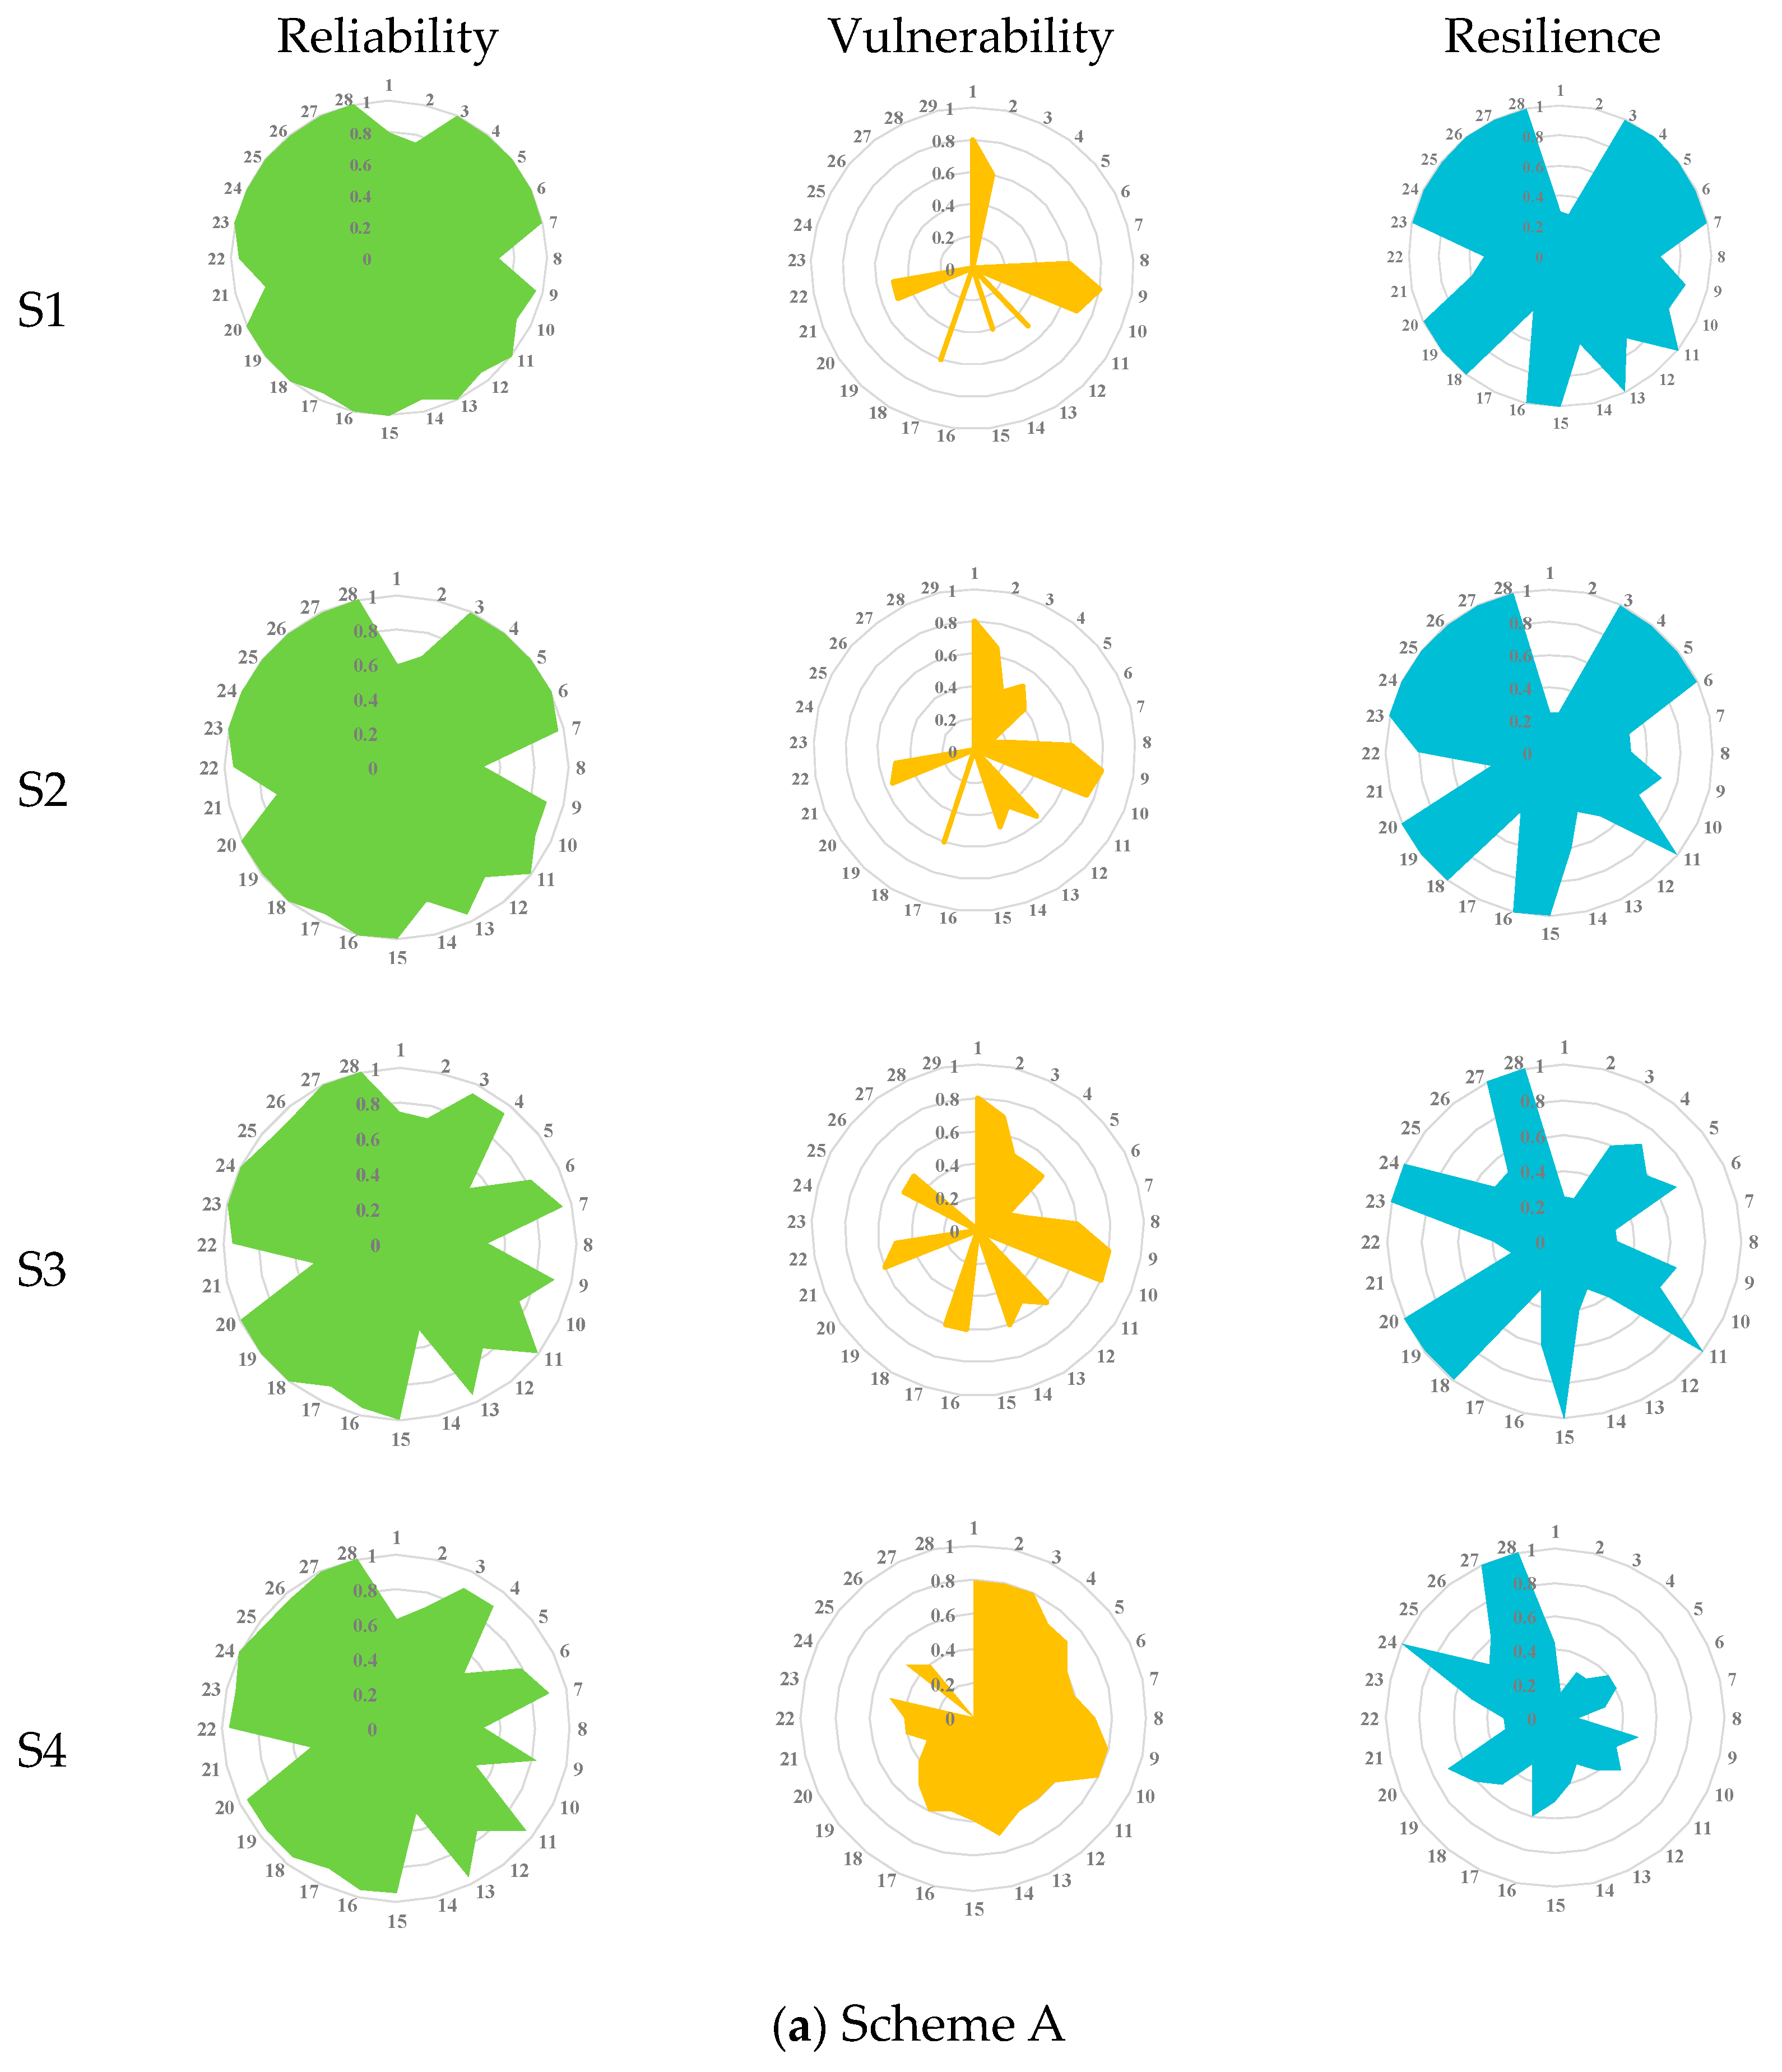
In order to further quantitatively evaluate the impacts of inter-basin water transfer projects on optimal water resources allocation, we analyzed three criteria (reliability, vulnerability, and resilience of water supply) for each zone in the middle and lower reaches of the Hanjiang River basin under Scenarios S1–S4. The results for the three evaluation criteria of each zone under different scenarios at Scheme A and B are shown in Figure 7a,b, respectively.
In Figure 7a, it is obvious that the value of water supply reliability is higher than 0.7 in all zones, and the values of both reliability and resilience almost reach one under Scenario 1 in most of the zones located along the mainstream of the Hanjiang River, with the exceptions of those zones (such as #1, #8, #14, and #21) that are located at the boundary of the basin. However, the water supply vulnerabilities of the zones located away from the mainstream are higher than for other zones. Under Scenario 2, the reliability and resilience of the water supply in some zones will all be reduced when about 9.5 billion m3 water are transferred outside the Hanjiang River basin from the upstream of the Danjiangkou Reservoir. For example, the reliability in zone #8 will change from 0.7 to 0.5, and the resilience will change from 0.67 to 0.52. Due to the obvious increase of water demand, the reliability and resilience of the water supply under Scenario 3 will be reduced significantly compared with the results under Scenario 2 (such as #25, #26). For Scenario 4, the amount of water transferred from the upstream part of the Hanjiang River basin will increase to 13.841 billion m3, which further decreases the reliability of the water supply (e.g., in zones #9,#10) and increases its vulnerability (e.g., in zones #3–#8).
In Figure 7b, the trends of the three criteria under the four scenarios are similar to those in Figure 7a. Specifically, the reliability and resilience of the water supply will be gradually reduced while the vulnerability will be increased with the scenario changing from 1–4. However, there is a great difference between Scheme B and Scheme A in the same scenario. The results of Scheme B show that the reliability of the water supply in most zones declines by 0.1–0.3 compared with Scheme A under the same scenario, while the vulnerability increases significantly in most zones (such as zones #3–#7 and #18–#20). This means that all zones are all likely to face water supply risks, even those located along the mainstream of the Hanjiang River basin. The reason is that the amount of COD(OF2) is affected by the water supply. When the water resources allocation model gives preference to the OF2, the water supply to all zones will be reduced. Therefore, the reliability of the water supply will be reduced and the vulnerability will be increased.
The results indicate that: (1) the expanding inter-basin water transfer projects will not only greatly reduce the reliability of the water donor system, but also significantly reduce the resilience of the water supply (compare Scenario 2 with Scenario 1, and Scenario 4 with Scenario 3). The reason for this is that three inter-basin water transfer projects all convey water from the upstream of the Hanjiang River basin to other basins, and the downstream water supply is greatly reduced, (2) the increase of water demand will reduce the water supply reliability and resilience, but increase the vulnerability (compare Scenario 3 with Scenario 2). (3) all zones in the case study are more likely to face water supply risk in the future. The reason for this is that zones located at the boundary of the basin are so far away from the mainstream that they cannot extract water from it. In addition, the regulatory capacity of the reservoirs in these zones is limited, so these boundary zones cannot get enough water. Zones along the mainstream of Hanjiang River are mainly affected by the water transfer projects which directly reduce the flow in the mainstream river. (4) compared with Scheme A, the reliability and resilience of the water supply under Scheme B decrease obviously, but the vulnerability of water supply increases greatly in most zones and (5) if the reliability of the water supply is equal to one, the vulnerability of the water supply will be equal to zero, while the resilience will be equal to one.
According to the results of the indicators, the increasing water demand and the expansion of inter-basin water transfer projects challenge the water supply reliability and resilience of the operation zones in the middle and lower reaches of the Hanjiang River basin. Despite the large available capacity of Danjiangkou Reservoir, the planned expansion of inter-basin water transfer capacity may adversely affect water availability in the operation zones along the mainstream. Therefore, more water supply measures should be taken to improve water supply capacity in the water donor areas, and more compensation measures will be needed in the mainstream of water donor areas in the future. In addition, it is expected that the diversion works in the outer basin will transport water to the middle and lower reaches of the Hanjiang River basin. The proposed assessment framework of inter-basin water transfer projects on optimal water resources allocation could provide a beneficial reference for similar water resources management in severely affected areas by water transfer projects.
5. Conclusions
To quantitatively assess the impacts of inter-basin water transfer projects on optimal water resources allocation in the water donor area, a comprehensive water resources management model that fully incorporates water demand projection, multi-objective water resources allocation model and evaluation criteria was proposed in this study. The middle and lower reaches of Hanjiang River basin was selected as a case study. The main conclusions are summarized below:
(1) Water shortages will gradually increase across the whole study area from Scenario 1 to Scenario 4. Water shortages are greatest for agriculture under all four scenarios, as a result of it having the lowest priority among all water user sectors.
(2) The reliability and resilience of the water supply will be gradually reduced, while the vulnerability will be increased, with the expansion of water transfer projects and the increase of water demand.
(3) The water supply risks in all zones in the Hanjiang River basin are likely to increase. The reason for this is that zones in the boundary are restricted by natural inflow and reservoir regulation, while the water availability in zones along the mainstream is directly decreased by the water transfer projects.
(4) The ever-expanding water transfer projects and ever-growing water demand present a challenge to water supply management in the middle and lower reaches of the Hanjiang River basin. Therefore, further measures will need to be taken to increase the water supply capacity, and additional compensation measures will be needed in the water donor areas in the future.
Our study is helpful for local water resources management under the inter-basin water transfer projects, and conducive to international water resources management. The research results can quantitatively assess the impacts of large-scale inter-basin water transfer projects on the water donor system, and thus make a contribution to mitigating the negative impacts and establishing ecological assessment and compensation mechanism in the similar water donor areas.
Due to nonstationary in water supply and demand, historical observation data are insufficient to support robust decision-making of long-term water resources management. In addition, sustained climate change will further expand this uncertainty, thus confusing future water resources management. It is of great importance to develop integrated water resources management models that fully combine the hydrological model with climate change assessment in the future. The proposed framework of assessing the impacts of inter-basin water transfer projects on water donor area still offer useful guidelines towards long-term water resources planning (e.g., the water transfer routes, the amount of the water transfer project) by replacing the inputs of the model. Thus, it can provide an adaptive assessment of optimal water resources allocation under varied water availability conditions.
Author Contributions
J.T. and D.L. proposed the methodology of this study; X.H. collected the data; Z.P. analyzed the data; J.T. wrote the paper; D.L. and S.G revised the paper.
Funding
This research was funded by the National Natural Science Foundation of China (Grant Nos. 91647106, 51539009 and 51879194), the Open Research Fund Program of State Key Laboratory of Water Resources and Hydropower Engineering Science (Grant No. 2018SWG03).
Acknowledgments
Great thanks to the editor and anonymous reviewers for their comments and suggestions that helped improve the quality of the paper.
Conflicts of Interest
The authors declare no conflict of interest.
References
- Gupta, J.; Zaag, P.V.D. Interbasin water transfers and integrated water resources management: Where engineering, science and politics interlock. Phys. Chem. Earth 2008, 33, 28–40. [Google Scholar] [CrossRef]
- Cosgrove, W.J.; Loucks, D.P. Water management: Current and future challenges and research directions. Water Resour. Res. 2015, 51, 4823–4839. [Google Scholar] [CrossRef] [Green Version]
- Kerachian, R.; Karamouz, M. A stochastic conflict resolution model for water quality management in reservoir–river systems. Adv. Water Resour. 2007, 30, 2866–2882. [Google Scholar] [CrossRef]
- Eliasson, J. The rising pressure of global water shortages. Nature 2015, 517, 6. [Google Scholar] [CrossRef] [PubMed]
- Sheffield, J.; Wood, E.F. Projected changes in drought occurrence under future global warming from multi-model, multi-scenario, IPCC AR4 simulations. Clim. Dyn. 2008, 31, 79–105. [Google Scholar] [CrossRef]
- Feng, S.; Li, L.X.; Duan, Z.G.; Zhang, J.L. Assessing the impacts of south-to-north water transfer project with decision support systems. Decis. Support Syst. 2007, 42, 1989–2003. [Google Scholar] [CrossRef]
- Yong, P.; Jinggang, C.; Anbang, P.; Huicheng, Z. Optimization operation model coupled with improving water-transfer rules and hedging rules for inter-basin water transfer-supply systems. Water Resour. Manag. 2015, 29, 3787–3806. [Google Scholar]
- Shang, Y.; Xue, J.; Wang, S.; Yang, Z.; Yang, J. A case history of Tunnel Boring Machine jamming in an inter-layer shear zone at the Yellow River Diversion Project in China. Eng. Geol. 2004, 71, 199–211. [Google Scholar] [CrossRef]
- Gu, W.; Shao, D.; Jiang, Y. Risk evaluation of water shortage in source area of middle route project for south-to-north water transfer in China. Water Resour. Manag. 2012, 26, 3479–3493. [Google Scholar] [CrossRef]
- Hong, X.J.; Guo, S.L.; Wang, L.; Yang, G.; Liu, D.D.; Guo, H.J.; Wang, J. Evaluating water supply risk in the middle and lower reaches of Hanjiang River basin based on an integrated optimal water resources allocation model. Water 2016, 8, 364. [Google Scholar] [CrossRef]
- Zhang, Q.F.; Xu, Z.F.; Shen, Z.H.; Li, S.Y.; Wang, S.S. The Han river watershed management initiative for the south-to-north water transfer project (middle route) of China. Environ. Monit. Assess. 2009, 148, 369–377. [Google Scholar] [CrossRef] [PubMed]
- Davies, B.R.; Thoms, M.; Meador, M. An assessment of the ecological impacts of inter-basin water transfers, and their threats to river basin integrity and conservation. Aquat. Conserv. Mar. Freshwat. Ecosyst. 1992, 2, 325–349. [Google Scholar] [CrossRef]
- Zeng, Q.; Qin, L.; Li, X. The potential impact of an interk-basin water transfer project on nutrients (nitrogen and phosphorous) and chlorophyll a of the receiving water system. Sci. Total Environ. 2015, 536, 675–686. [Google Scholar] [CrossRef] [PubMed]
- Slabbert, N. The Potential Impact of an Inter-Basin Water Transfer on the Modder and Caledon River Systems. Ph.D. Thesis, University of the Free State, Bloemfontein, South Africa, 2007. [Google Scholar]
- Drinkwater, K.F.; Frank, K.T. Effects of river regulation and diversion on marine fish and invertebrates. Aquat. Conserv. Mar. Freshwat. Ecosyst. 1994, 4, 135–151. [Google Scholar] [CrossRef] [Green Version]
- Gibbins, C.N.; Soulsby, C.; Jeffries, M.; Acornley, R. Developing ecologically acceptable river flow regimes: A case study of Kielder reservoir and the Kielder water transfer system. Fish. Manag. Ecol. 2001, 8, 463–485. [Google Scholar] [CrossRef]
- Snaddon, C.; Davies, B. A preliminary assessment of the effects of a small South African inter-basin water transfer on discharge and invertebrate community structure. Regul. Rivers Res. Manag. 1998, 14, 421–441. [Google Scholar] [CrossRef]
- Day, J.; Bridger, K.; Peet, S.; Friesen, B. Northwestern Ontario River Dimensions; Wiley: Hoboken, NJ, USA, 1982. [Google Scholar]
- Zhai, S.; Hu, W.; Zhu, Z. Ecological impacts of water transfers on Lake Taihu from the Yangtze River, China. Ecol. Eng. 2010, 36, 406–420. [Google Scholar] [CrossRef]
- Li, M.; Fu, Q.; Singh, V.P.; Liu, D. An interval multi-objective programming model for irrigation water allocation under uncertainty. Agrc. Water. Manag. 2018, 196, 24–36. [Google Scholar] [CrossRef]
- Liu, D.D.; Chen, X.H.; Lou, Z.H. A model for the optimal allocation of water resources in a saltwater intrusion area: A case study in Pearl River Delta in China. Water Resour. Manag. 2010, 24, 63–81. [Google Scholar] [CrossRef]
- Hu, Z.; Wei, C.; Yao, L.; Li, C.; Zeng, Z. Integrating equality and stability to resolve water allocation issues with a multiobjective bilevel programming model. J. Water Resour. Plan. Manag. 2016, 142, 04016013. [Google Scholar] [CrossRef]
- Zhou, Y.L.; Guo, S.L.; Hong, X.J.; Chang, F.J. Systematic impact assessment on inter-basin water transfer projects of the Hanjiang River Basin in China. J. Hydrol. 2017, 553, 584–595. [Google Scholar] [CrossRef]
- Liu, D.D.; Guo, S.L.; Shao, Q.X.; Liu, P.; Xiong, L.H.; Wang, L.; Hong, X.J.; Xu, Y.; Wang, Z.L. Assessing the effects of adaptation measures on optimal water resources allocation under varied water availability conditions. J. Hydrol. 2018, 556, 759–774. [Google Scholar] [CrossRef]
- Changjiang Water Resources Commission. Report on the Comprehensive Management Plan on Water Resources for Hanjiang River Basin, China; Changjiang Water Resources Commission: Wuhan, China, 2011. (in Chinese) [Google Scholar]
- Hubei Provincial Department of Water Resources. Dispatching Schedules of Hubei Provincial Large Reservoirs; Hubei Provincial Department of Water Resources: Wuhan, China, 2014. (in Chinese) [Google Scholar]
- Brekke, L.; Larsen, M.D.; Ausburn, M.; Takaichi, L. Suburban water demand modeling using stepwise regression. J. Am. Water Works Assoc. 2002, 94, 65–95. [Google Scholar] [CrossRef]
- Tennant, D.L. Instream flow regimens for fish, wildlife, recreation and related environmental resources. Fisheries 1976, 1, 6–10. [Google Scholar] [CrossRef]
- Deb, K. A fast and elitist multiobjective genetic algorithm: NSGA-II. IEEE Trans. Evol. Comput. 2002, 6, 182–197. [Google Scholar] [CrossRef] [Green Version]
- Salazar, D.; Rocco, C.M.; Blas, J. Galván. Optimization of constrained multiple-objective reliability problems using evolutionary algorithms. Reliab. Eng. Syst. Saf. 2006, 91, 1057–1070. [Google Scholar] [CrossRef]
- Lotfan, S.; Ghiasi, R.A.; Fallah, M.; Sadeghi, M.H. ANN-based modeling and reducing dual-fuel engine’s challenging emissions by multi-objective evolutionary algorithm NSGA-II. Appl. Energy 2016, 175, 91–99. [Google Scholar] [CrossRef]
- Tabari, M.M.R.; Yazdi, A. Conjunctive use of surface and groundwater with inter-basin transfer approach: Case study Piranshahr. Water Resour. Manag. 2014, 28, 1887–1906. [Google Scholar] [CrossRef]
- Paul, A.K.; Shill, P.C. New automatic fuzzy relational clustering algorithms using multi-objective NSGA-II. Inf. Sci. 2018, 448, 112–133. [Google Scholar] [CrossRef]
- Cañón, J.; González, J.; Valdés, J. Reservoir operation and water allocation to mitigate drought effects in crops: A multilevel optimization using the drought frequency index. J. Water Resour. Plan. Manag. 2009, 135, 458–465. [Google Scholar] [CrossRef]
- Milano, M.; Ruelland, D.; Dezetter, A.; Fabre, J.; Ardoin-Bardin, S.; Servat, E. Modeling the current and future capacity of water resources to meet water demands in the Ebro basin. J. Hydrol. 2013, 500, 114–126. [Google Scholar] [CrossRef]
- Asefa, T.; Clayton, J.; Adams, A.; Anderson, D. Performance evaluation of a water resources system under varying climatic conditions: reliability, resilience, vulnerability and beyond. J. Hydrol. 2014, 508, 53–65. [Google Scholar] [CrossRef]
- Zhang, C.; Xu, B.; Li, Y.; Fu, G.T. Exploring the relationships among reliability, resilience, and vulnerability of water supply using many-objective analysis. J. Water Resour. Plan. Manag. 2017, 143, 04017044. [Google Scholar] [CrossRef]
- Chanda, K.; Maity, R.; Sharma, A.; Mehrotra, R. Spatiotemporal variation of long-term drought propensity through reliability-resilience-vulnerability based drought management index. Water Resour. Res. 2014, 50, 7662–7676. [Google Scholar] [CrossRef]
- Ajami, N.K.; Hornberger, G.M.; Sunding, D.L. Sustainable water resource management under hydrological uncertainty. Water Resour. Res. 2008, 44, 2276–2283. [Google Scholar] [CrossRef]
- Mendoza, V.M.; Villanueva, E.E.; Adem, J. Vulnerability of basins and watersheds in Mexico to global climate change. Clim. Res. 1997, 9, 139–145. [Google Scholar] [CrossRef] [Green Version]
- Asefa, T.; Wanakule, N.; Adams, A.; Shelby, J.; Clayton, J. On the use of system performance metrics for assessing the value of incremental water-use permits. J. Water Resour. Plan. Manag. 2014, 140, 04014012. [Google Scholar] [CrossRef]
- Hashimoto, T.; Loucks, D.P.; Stedinger, J.R. Reliability, resiliency, robustness, and vulnerability criteria for water resource systems. Water Resour. Res. 1982, 18, 14–20. [Google Scholar] [CrossRef]
Figure 1.
Water transfer projects in the Hanjiang River basin.

Figure 2.
Location of the study area and 28 operational zones.

Figure 3.
Framework for assessing the impacts of inter-basin water transfer projects on water donor area.
Figure 3.
Framework for assessing the impacts of inter-basin water transfer projects on water donor area.
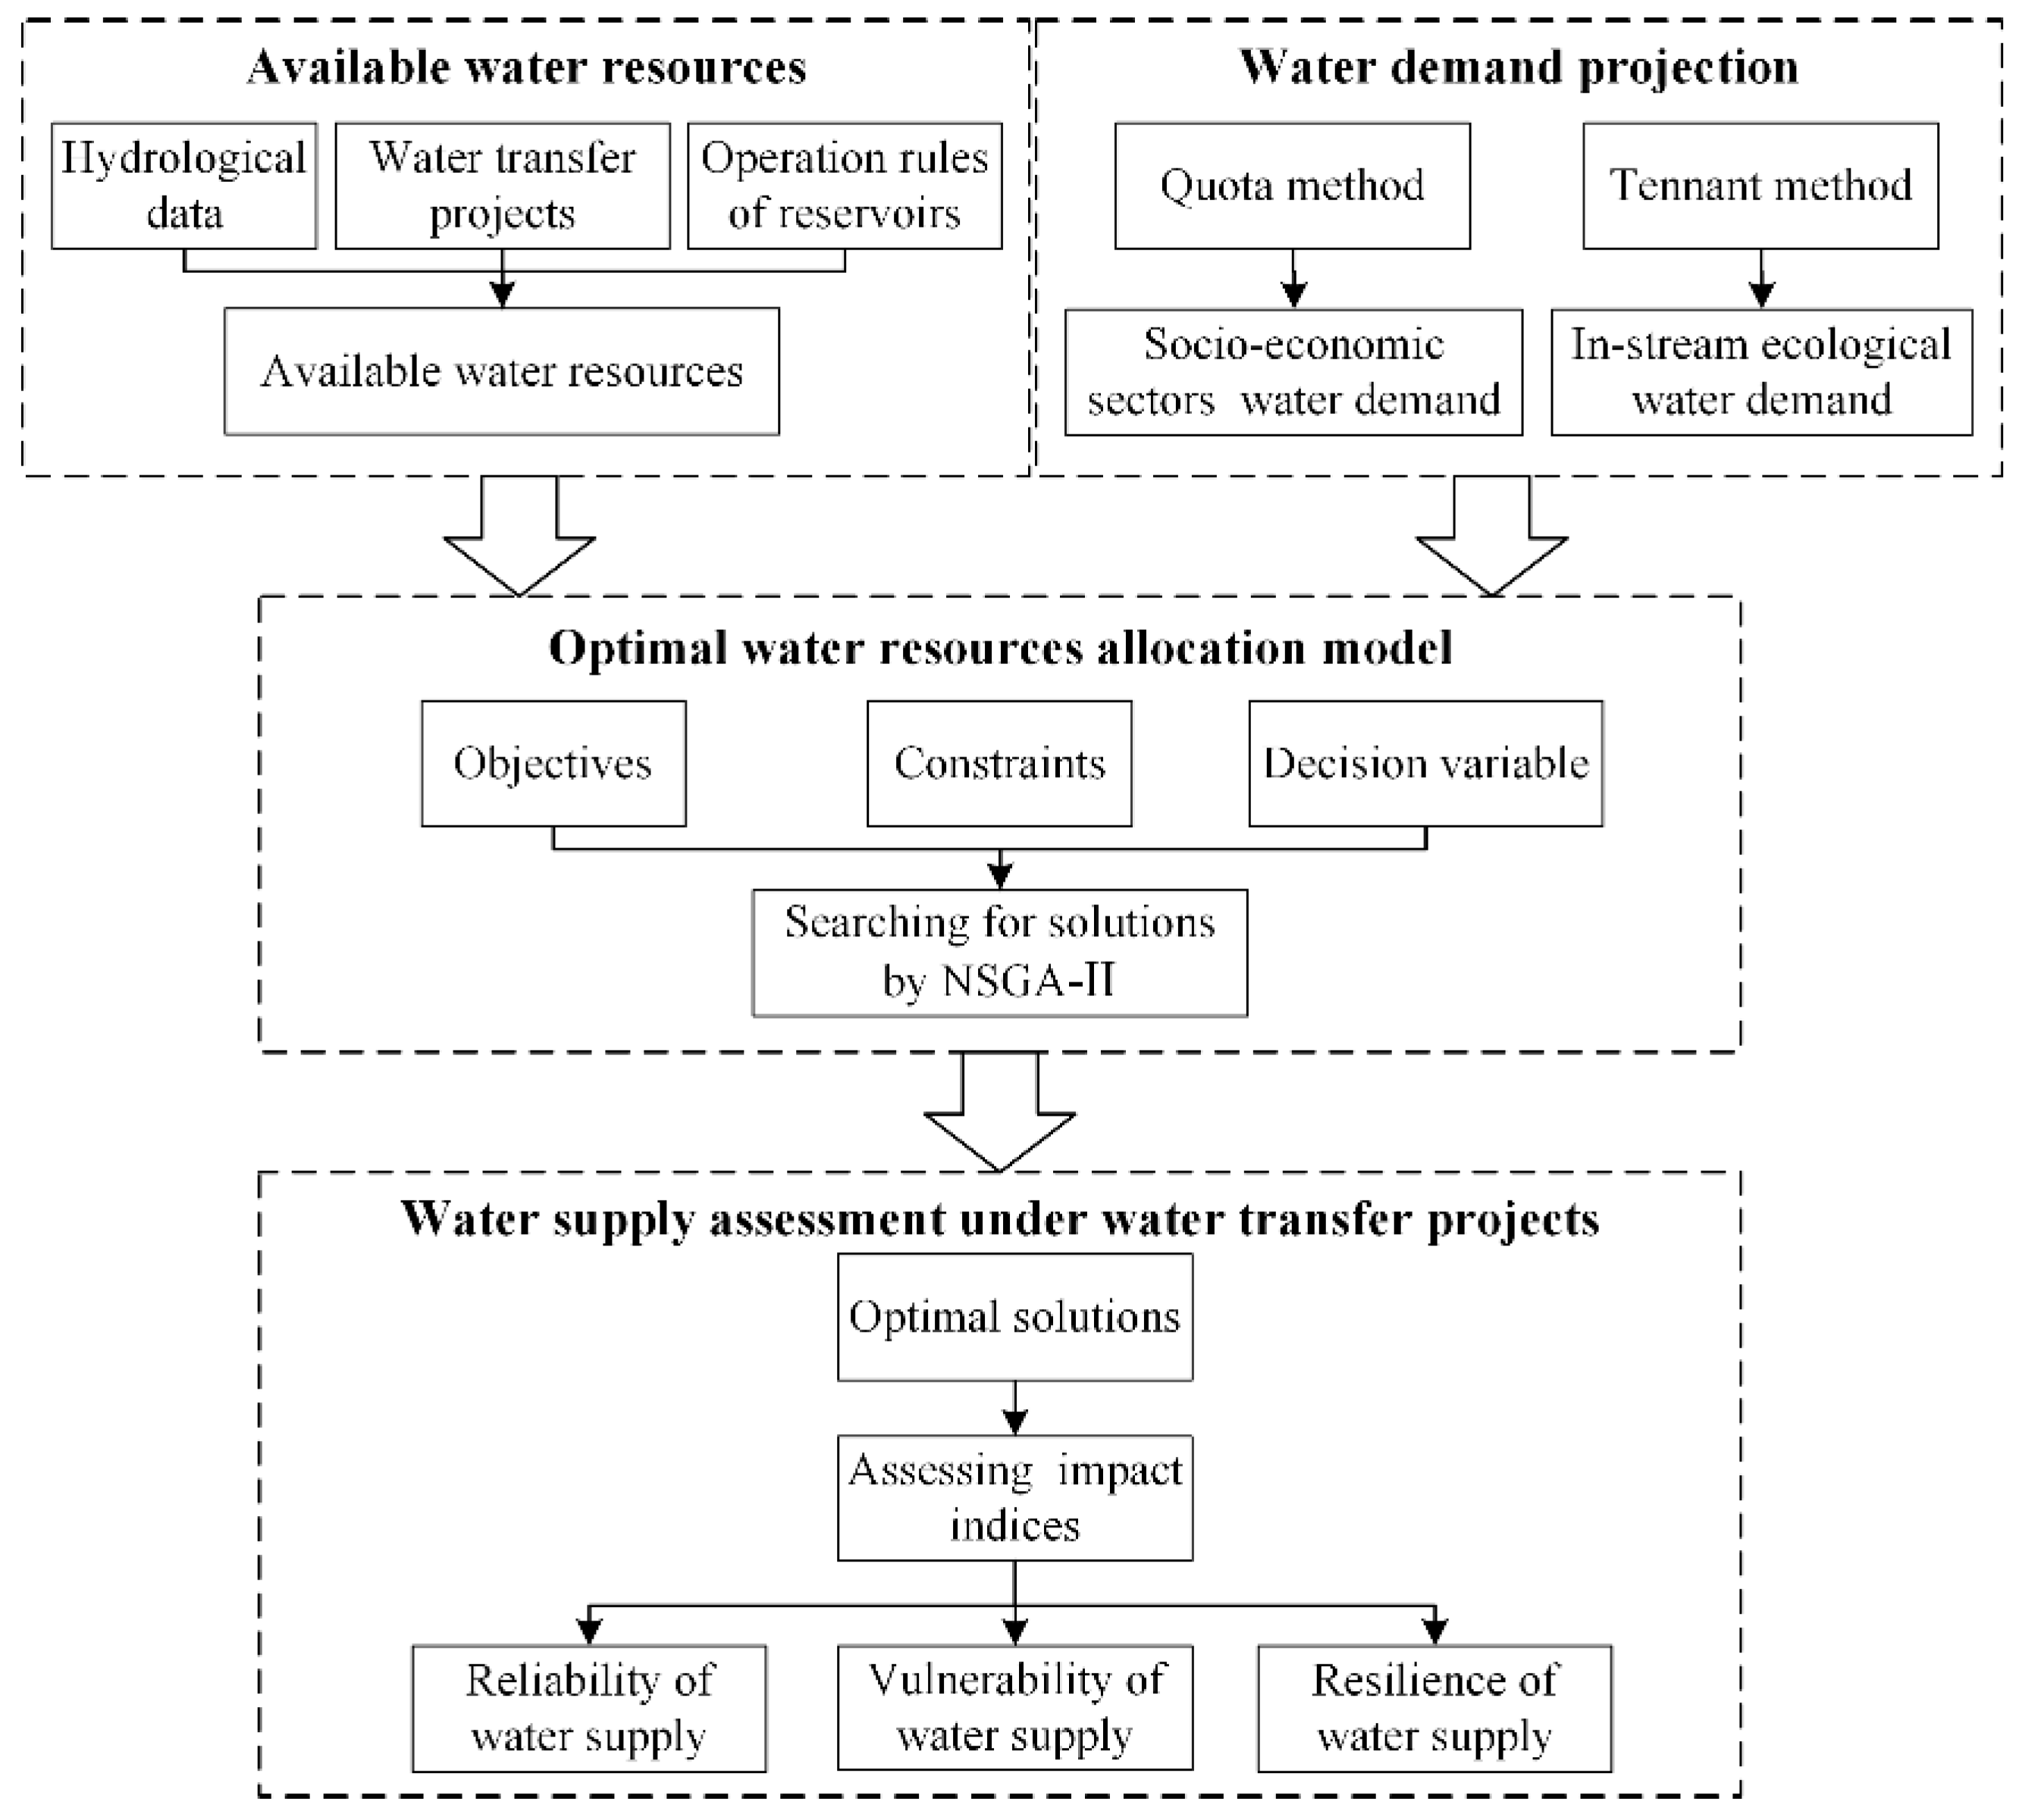
Figure 4.
Proportion of average water demands with respect to socio-economic sectors in the middle and lower reaches of the Hanjiang River basin.
Figure 4.
Proportion of average water demands with respect to socio-economic sectors in the middle and lower reaches of the Hanjiang River basin.

Figure 5.
Relation between objectives of the Pareto frontier for the optimal water resources allocation under four scenarios.
Figure 5.
Relation between objectives of the Pareto frontier for the optimal water resources allocation under four scenarios.

Figure 6.
Optimal results of the water supply to different water user sectors in the middle and lower reaches of the Hanjiang River basin.
Figure 6.
Optimal results of the water supply to different water user sectors in the middle and lower reaches of the Hanjiang River basin.

Figure 7.
Radar maps for three evaluation criteria of water supply at the 28 zones in the middle and lower reaches of the Hanjiang River basin for Scenarios S1–S4.
Figure 7.
Radar maps for three evaluation criteria of water supply at the 28 zones in the middle and lower reaches of the Hanjiang River basin for Scenarios S1–S4.


Table 1.
Description of the water transfer projects in the Hanjiang River basin.
| Project Name | Water Resource | Water Receiving Area | Water-Use Category | Designed Annual Water Transfer Demand (billion m3) (Total/Inter-Basin 1) | |
|---|---|---|---|---|---|
| 2020 | 2030 | ||||
| P1 | Danjiangkou Reservoir | Henan Province, Hebei Province, Tianjin and Beijing Cities | Domestic, industrial and agricultural use | 9.5/8.5 | 13.13/12.05 |
| P2 | Huangjinxia Reservoir and Sanhekou Reservoir 2 | Xi’an, Xianyang, Baoji, Weinan and Yangling Cities | Ecological, domestic, industrial and agricultural use | 1/1 | 1.5/1.5 |
| P3 | Danjiangkou Reservoir | Xiangyang, Zhaoyang, Suizhou, Guangshui and Xiaogan Cities | Ecological, domestic, industrial and agricultural use | 0.628/0 | 1.398/0.291 |
Notes: 1: Some water is transferred to Tangbai River basin and the northern Hubei Province, both of which are mainly located within the Hanjiang River basin. 2: Both Huangjinxia reservoir and Sanhekou reservoir are located in the upstream of Danjiangkou reservoir, thus the transferred water should be removed first when estimating the inflow to the Danjiangkou reservoir.
Table 2.
Information about 17 large or medium-sized reservoirs in the study area.
| NO. | Reservoir | Total Storage (million m3) | Useful Storage (million m3) | Dead Storage (million m3) | Flood Limited Water Level (m) |
|---|---|---|---|---|---|
| 1 | Sanliping | 510 | 211 | 261 | 403/412 |
| 2 | Siping | 269 | 145 | 102 | 313.86 |
| 3 | Danjiangkou | 33910 | 21220 | 12690 | 160.0/163.5 |
| 4 | Mengqiaochuan | 110.33 | 88.15 | 2.7 | 142.2 |
| 5 | Huayanghe | 107 | 70.8 | 1.4 | 144.19 |
| 6 | Xionghe | 195.9 | 115.9 | 20 | 125 |
| 7 | Xipaizihe | 220.4 | 22 | 2.23 | 111.8 |
| 8 | Hongshuihe | 103.6 | 58.9 | 5.4 | 117 |
| 9 | Shimenji | 154.03 | 114.69 | 1.85 | 195 |
| 10 | Sandaohe | 154.6 | 127.42 | 0.02 | 154 |
| 11 | Yuntaishan | 123 | 89 | 5 | 163 |
| 12 | Yinghe | 121.66 | 76.31 | 3.62 | 132.7 |
| 13 | Huangpo | 125.61 | 70.25 | 10.1 | 76 |
| 14 | Wenxiakou | 520 | 269 | 176 | 105 |
| 15 | Shimen | 159.1 | 68.6 | 13 | 195 |
| 16 | Gaoguan | 201.08 | 154.32 | 30.89 | 118 |
| 17 | Huiting | 313.4 | 173.5 | 32.5 | 84.75 |
Note: There are two different flood limited water levels for summer and autumn flood seasons in the Sanliping and Danjiangkou reservoirs, respectively.
Table 3.
Designed scenarios based on water transfer projects and water demands (billion m3).
| Water Transfer Project | 2020 | 2030 | ||
|---|---|---|---|---|
| S1 | S2 | S3 | S4 | |
| P1 | / | 8.500 | 8.500 | 12.050 |
| P2 | / | 1.000 | 1.000 | 1.500 |
| P3 | / | 0.000 | 0.000 | 0.291 |
Table 4.
Water demands projection for the study area in 2020 and 2030.
| Year | Domesticity | Industry | Agriculture (billion m3) | Off-Stream (billion m3) | ||||||
|---|---|---|---|---|---|---|---|---|---|---|
| (billion m3) | (billion m3) | P = 50% | P = 75% | P = 90% | P = 95% | P = 50% | P = 75% | P = 90% | P = 95% | |
| 2020 | 0.65 | 5.09 | 5.58 | 6.21 | 6.96 | 7.46 | 11.32 | 11.95 | 12.70 | 13.20 |
| 2030 | 0.87 | 6.57 | 5.09 | 5.64 | 6.26 | 6.74 | 12.53 | 13.07 | 13.69 | 14.18 |
Note: These four kinds of frequency 50%, 75%, 90%, and 95% represent a normal year, a dry year, a very dry year and an extremely dry year, respectively.
Table 5.
Maximum and minimum values on the Pareto frontier for different scenarios.
| Scenarios | Schemes | OF1 (billion m3) | OF2 (104 tons) |
|---|---|---|---|
| S1 | A | 2.123 | 22.216 |
| B | 2.160 | 20.721 | |
| S2 | A | 2.698 | 21.625 |
| B | 2.721 | 20.855 | |
| S3 | A | 3.216 | 22.200 |
| B | 3.228 | 21.485 | |
| S4 | A | 4.259 | 22.107 |
| B | 4.335 | 20.269 |
© 2019 by the authors. Licensee MDPI, Basel, Switzerland. This article is an open access article distributed under the terms and conditions of the Creative Commons Attribution (CC BY) license (http://creativecommons.org/licenses/by/4.0/).
Share and Cite
MDPI and ACS Style
Tian, J.; Liu, D.; Guo, S.; Pan, Z.; Hong, X. Impacts of Inter-Basin Water Transfer Projects on Optimal Water Resources Allocation in the Hanjiang River Basin, China. Sustainability 2019, 11, 2044. https://doi.org/10.3390/su11072044
AMA Style
Tian J, Liu D, Guo S, Pan Z, Hong X. Impacts of Inter-Basin Water Transfer Projects on Optimal Water Resources Allocation in the Hanjiang River Basin, China. Sustainability. 2019; 11(7):2044. https://doi.org/10.3390/su11072044
Chicago/Turabian StyleTian, Jing, Dedi Liu, Shenglian Guo, Zhengke Pan, and Xingjun Hong. 2019. "Impacts of Inter-Basin Water Transfer Projects on Optimal Water Resources Allocation in the Hanjiang River Basin, China" Sustainability 11, no. 7: 2044. https://doi.org/10.3390/su11072044
Note that from the first issue of 2016, this journal uses article numbers instead of page numbers. See further details here.