An Investigation on Factors Affecting Stock Valuation Using Text Mining for Automated Trading

School of Information Technology & Management, University of International Business and Economics, Beijing 100029, China
*
Author to whom correspondence should be addressed.
Sustainability 2019, 11(7), 1938; https://doi.org/10.3390/su11071938
Submission received: 6 March 2019
/
Revised: 28 March 2019
/
Accepted: 29 March 2019
/
Published: 1 April 2019
(This article belongs to the Special Issue Sustainability with Robo-Advisor and Artificial Intelligence in Finance)
Abstract
:Predicted price-to-book value ratios (P/BV) are widely used for the valuation of listed common stocks. However, with the application of automated trading system (ATS), the existing indicators that are applied in the method are losing their effectiveness in the Chinese market. Combining qualitative research with the text mining method, this study explores and validates those ignored factors to improve the accuracy of the stock valuation. On the basis of the principal of the existing valuation method, we clarify the scope of the factors that affects the P/BV ratio prediction. Through semi-structured interviews that are designed with six first-level factors which are taken from the literature, we then excavate some second-level factors. After that, with three corpuses including samples form Sina.com.cn, Xueqiu.com, and CSDN.net, four first-level factors and thirteen second-level factors have been verified step by step through the Latent Dirichlet Allocation (LDA) model. In the process, two other new factors and three sub-factors are also found. Furthermore, based on the factor correlation that was found in a data analysis, a factor relationship model was built. The results can be used in a stock valuation in future work as the basis of the indicator system for the prediction of P/BV ratio.
1. Introduction
With the development of information and communication technology (ICT) [1] and the application of artificial intelligence, varieties of intelligent platforms emerge [2]. They facilitate people’s lives and solve problems that cannot be solved by traditional methods [3]. Machine learning methods have also been applied to financial sectors [2], which has led to a shift in investment behavior and an impact on stock price movements. Under such changes, investors’ demand for accurate predictions has deepened [4,5], which in turn has driven the development of trading strategies and trading systems based on machine learning algorithms. Driven by such backgrounds, an automated trading system comes into being.
Automated trading system (ATS) is a computer program based on machine learning algorithm [6] to assist investors in financial asset trading [7]. It is able to gain insight into market trends, to automatically discover investment opportunities [8], and to generate trading orders quickly based on preset trading strategies to maximize revenue [9,10]. The objects of ATS refer to the objects that traders’ rights and obligations point to financial assets, which include all financial instruments that can be traded in the secondary market with real prices and future valuations [11]. A listed common stock, a typical object of ATS and one of the most actively traded objects in the secondary market, needs valuation. The design of a standardized valuation indicator system is of great significance [12] because the system is not only a reference for investment choice and decision-making but also a criterion which benefits the protection of the interests of market participants.
For stock valuations in traditional trading environments, there are some well-known but relatively sophisticated valuation methods like discounted cashflow (DCF) [13,14]. However, analysts prefer market approaches by using multiples like price-to-earning ratios (P/E), price-to-book value ratios (P/BV), etc. The valuation method using predicted P/BV ratio is a widely used valuation method for listed common stocks. Compared with P/E, P/BV has a higher accuracy prediction for market value and there is less information lost in the regression [13]. Thus, in recent years, some researchers are trying to propose innovative models to evaluate the book value of equity which affects the stock valuation. For example, Jianu [15] proposes a price model and calculates the book value of equity per share by maintaining the physical capital. However, with the gradual deepening of the research on ATS and the wide application of influence intelligent trading strategies [10] in the Chinese market, the traditional P/BV regression model ignores the influence of the development of automated trading on the selection of basic evaluation indicators. The effectiveness of stock valuation would be further reduced in China which is a market place with a huge trading volume and informative stock prices. As a result, new influencing factors are urgently needed to be introduced to adapt to changes in the current trading environment. In addition, researchers [7] mainly focus on the evaluation of the effectiveness of the trading system [8] and the effectiveness of the strategy [9] in the current research on intelligent transactions rather than the valuation of trading objects such as stocks. Nevertheless, the former could be influenced by the latter.
Therefore, in this study, combining qualitative research and the text mining method, we will conduct in-depth research on the factors affecting the predicted P/BV ratio in the context of automated trading. To be specific, a series of first-level factors and their sub-factors will be found through an excavation from the literature and semi-structure interviews. With the use of a text statistical analysis and the LDA model, these factors will be verified step by step, and a factor relationship model is supposed to be built. The results could help to complete the P/BV regression model. Based on these factors, we are able to include ignored independent variables to improve the accuracy of P/BV prediction.
The remainder of this paper is organized as follows: Section 2 will provide the literature review, followed by the methodology in Section 3. In this section, two stages of data collection and processing will be presented. Then, we will analyze the results of the two stages in Section 4. Finally, further discussion, the conclusion, and the future work will be revealed in Section 5.
2. Background
2.1. Automated Trading System (ATS)
With the improvement of the underlying technology and the application of machine learning methods, the automated trading system (ATS) becomes a powerful engine that promotes quantitative investment [6]. As a new computer technology to help maximize return in security exchange markets, automated trading [16] has received a lot of attention in developed countries such as the USA. In recent years, the investment environment of China is also about to change due to the application of ATS. New platforms like Straight flush, EAwang, and Powin which use the technic of ATS to provide scripts and strategies for individual and institutional investors have appeared. Furthermore, there are many people talking about automated trading, robo-advisor, and quantitative investment on finance websites or forums with great traffic like Xueqiu.com, CSDN.net, and Sina.com.cn. It suggests that stock price volatility may be influenced by the appearance of ATS since past research has found that news media content had a significant impact on stock prices and was able to predict the movements of the stock market [17].
The design and execution of investment strategies have become different from the ones without ATS. These strategies can be defined as a systematic sequence of actions automatically taken by computer programs without human emotion interferences [18]. An advanced ATS is supposed to handle complex tasks [16]: For example, collecting, screening, evaluating, and archiving market data as much as possible; using appropriate analytical models and prediction techniques to help user’s decision-making and to improve the performance of funds; adapting to market variations; and reacting as fast as possible, etc.
In order to find out how ATS changes investors’ decision-making and how valuation methods lose their efficiency, we need to understand the process of automated trading first. It is shown in Figure 1 [11]. With the input of user’s long-term or short-term objectives, the orders are executed automatically by computer program [9]. A series of rules are designed and combined in the program to determine the timing, price, and trading volume. Massive amounts of information that gathered and stored in the cloud are used for the realization and execution of entry positions and exit positions [10]. To some extent, the speed of trade, which is important in trading especially for institutional investors, is dependent on the quality and reliability of the sever hardware.
As a result, more opportunities for obtaining excess return and avoiding a catastrophic loss are provided for users of ATS [18], which drives more researchers to pay attention to the design and evaluation of a trading strategy, as well as the update of ATS [8]. However, its existence also has an impact on the fluctuations of stock prices and the stability of financial markets [10], which needs to be considered in stock valuation [14]. More notably, according to Jianu et al., the value of financial capital and the measurement of profit vary with market condition [15]. Thus, it is well-grounded to update the stock valuation method to adapt to the current trading market.
2.2. Valuation Method Using P/BV Ratio
2.2.1. P/BV Ratio
The method of stock valuation, the support of stock a recommendation, helps to forecast the direction of prices [14]. It is also applied in ATS as a reference analytical model. There are several market approaches using multiples such as price earnings ratio (P/E), price to book value (P/BV), price earnings to growth (PEG), price to sales (P/S), enterprise value to sales (EV/S), and more sophisticated methods like discounted cashflow (DCF) [19]. Researches have conducted that no obvious advantage is shown among these methods because different methods adapt to different markets [14]. However, analysts prefer market approaches to methods like DCF [20] because the accuracy of earnings forecasts is affected by multidimensional factors which are hard to measure.
In this paper, we mainly focus on factors affecting the stock valuation for automated trading in China. Because nowadays, the Chinese stock exchange, Shanghai Stock Exchange (SHSE), has become the fifth largest stock exchanges in the world, it is of great importance to make it clear the features and characteristics of the Chinese market. Furthermore, firm-level return predictors are frequently used in the stock valuation methods mentioned above, but many researches show that the return predictability of these predictors is weak in China [21]. That is because they are less heterogeneously distributed than in a more mature capital market like the USA. Chinese stock prices are less informative [22] and are hard to predict [23]. In other words, in a market with great asymmetric information, classical valuation methods ignoring useful information need to be updated to improve their efficiency. As the regression model of the P/BV ratio, one of the market approaches that are frequently used by analysts, is used to reduce the risk of missing information by introducing critical variables ignored before, we aim to develop this model to improve the valuation accuracy in the Chinese market.
The P/BV ratio refers to the price-to-book ratio, which is “computed by dividing the market price per share by the current book value of equity per share” [13]. This ratio is useful in stock valuation and investment analysis [24]. However, when measuring the P/BV ratio, there is a bias taken by accounting standards as well as the existence of different classes of shares [25]. To some extent, the potential for inconsistency can be avoided by estimating the market value of equity. Through this, the undervalued firms and overvalued ones could be separated. The most common method of separation is to predict the P/BV ratio for a group of comparable firms by a sector regression. Wilcox proposed that the return on equity (ROE) has a strong relationship with the P/BV ratio [26]. According to previous researches, apart from ROE, the firms can be differentiated by fundamentals including dividend payout ratio [25], the risk level of the stock (Beta), and the expected growth rate over the next five years (EGR) [27]. As a result, previous researches proposed such a multiple regression to predict this ratio [13], as in Equation (1).
Once we get the data of the actual P/BV, as well as the ROE, Payout, Beta, EGR over the year of all listed companies of a specific sector, we are able to regress the predicted P/BV ratio of these companies against those fundamentals (independent variables). Finally, we will obtain the valuation results through the comparison between the predicted P/BV ratio and the actual P/BV ratio of each company in this industry. If a firm’s predicted P/BV ratio is higher than the actual one, it could be undervalued, which has potential to invest in.
Nevertheless, there are still mismatches of the regression mentioned above. Differences continue to persist between the target firm and the group which it belongs to [25]. The model’s explanation of the predicted P/BV ratio is far from complete. For one thing, value premium, the greater risk-adjusted return, should be considered when estimating P/BV [27,28], while the return predictability of China is weak [14]. For another, ATS, which are not used frequently as a trading tool in the Chinese stock market of the past decade, would influence the decision-making of investors [18]. The ignored differences or factors may also lead to an inaccuracy in the prediction of P/BV ratio. In addition, error term (ε) in Equation (1) is also supposed to be reduced. According to Aydoğan et al., the explanatory powers are low when using an actual P/BV to forecast market returns in emerging equity markets because there are some strong implications brought by the differences of the market conditions [29]. However, media content that has new information is found to be related to the trading volume and stock returns, which helps to reduce the mismatch errors if prediction [17].
As a result, it is supposed to expand the regression to include specific independent variables that are ignored. We will explore those variables in this paper in order to lay a foundation for improving the accuracy of the valuation.
2.2.2. Valuation Factors
According to the principle of the valuation method we talked about in the last part, in the environment of automated trading, the ignored factors are related to aspects including the fundamentals of the target firms, investors’ preference and decision-making, as well as other factors which have a significant impact on the market value of common stocks. The influence of those factors should be embodied in the regression we mentioned above. Since the contain plenty of market information, they could be served as new independent variables or moderator variables. After making clear what the scope of the factors is, we extracted the following factors by searching references in previous researches.
The technology factor has penetrated throughout the industry. It refers to the high-tech, for example, the data structures and algorithms [16], which is applied in the construction of automated trading systems and the design of automated trading strategies [30].
The market mechanism could be considered as another critical factor. It can also be regarded as a price mechanism through which stock price can be determined with the accumulation of supply and demand for investors [10]. With the application of machine learning methods, the information obtaining cost has been reduced, the liquidity has been improved as well [31].
Regulation also has an impact on stock prices. Several matters, such as market manipulation, hacking, index construction, and violence, are going to appear in the market with financial innovation [32]. Furthermore, sometimes the use of an algorithm may lead to a volatile that is contrary to the law of value. For example, U.S. stock prices experienced a large and temporary decline in 2010, which was known as the “Flash Crash”. Kirilenko et al. [33] employed a regression-based baseline analysis for this event and proved that the lagged price changes are highly related to High-Frequency Trader inventory changes.
Network externalities also have an impact on the valuation of common stock. It refers to a phenomenon that the value of a product or a service increases with a large installed base of users [34]. Previous research shows that network externalities can generate a special amplification mechanism to bring about unexpected earning growth for mutual funds [35].
A corporate trust also has an impact on the stock valuation within ATS. A corporate trust represents a large grouping of business interests with significant market power. As a socioeconomic factor which related to crash risk [36], the volatility of trust may bring changes to the behavior of investors and even to the investment environment.
Reputation could be regarded as another critical factor in that firms’ specific information content [37] is directly associated with their stock price [38]. The association exists with or without the use of ATS in Chinese stock market. Furthermore, in the environment of automated trading, a company’s information is reflected to its stock price more quickly because ATS could help to collect and analyze more relevant data [18].
2.3. Latent Dirichlet Allocation (LDA)
In recent years, empirical economic researches pay more attention to the information encoded in text. Text mining methods are widely used in the financial industry, for example, to predict asset value by analyzing the text from company news, company fillings, monetary policies, social media, etc. [39]. Furthermore, Baker et al. [40] found that the news media content has the potential to predict the movement of stock markets [41]; the media pessimism is associated with market trading volume as well. Using text as data, Shen et al. [42] proposed that Baidu Index could predict stock price changes on the next day, which has the potential to improve the accuracy of Chinese stock valuation. It also suggests that using only firm-level predictors is not enough to predict stock prices, returns, [43] as well as valuation. Text with relevant information is of great importance for stock valuation.
Text mining methods such as the Latent Dirichlet Allocation (LDA) model can identify topics with a large amount of textual materials and extract features that we need [44]. The LDA model can be generated by three-layer Bayesian networks, which are, in turn, document layer, topic layer, and word layer. Each text represents a mixed distribution of topics, while each topic represents a probability distribution of words [45]. Since an article is randomly composed of several topics, researchers are able to obtain the relationship between texts by mapping them to a topic space [46]. Dyer et al. used the LDA model to examine specific topics to better understand 10-k disclosure [47]. Weifeng et al. also applied the LDA model to find topics from hacker community discussions and to further profile key sellers [48]. More notably, when using the LDA model, the number of topics and the value of parameters needs to be set manually [49]. Since there is no identified value for reference, it is supposed to compare each among alternative values [50]. The value with the best interpretability could be taken, which would further improve the accuracy of the algorithm. As a result, through way of trial and error, more useful information will be included in the research results.
3. Methodology
3.1. Research Procedure
Our study uses a qualitative method and text mining [51,52] for the excavation and verification of factors [53]. The research is divided into two stages.
In the first stage, since there is a lack of theoretical foundation for the ignored variables of common stock valuation in the context of automated trading exists, we conduct a semi-structured interview [54]. The outline design for the interview is based on the principle of the P/BV ratio valuation method and the factors proposed in related researches. In the second stage, in order to validate the factors and to dig deeper, we use text mining methods that are commonly used in recent research for data acquisition and analysis [51]. In this stage, according to the steps of text mining taken in current researches, we establish a research procedure to explore factors, as portrayed in Figure 2. It is composed of data collection, data analysis, and result analysis. To start with, based on the research objective, we identify the source of the corpus and carry out text acquisition. Next, using the obtained valid text, we conduct preliminary word frequency statistics. The results of the statistics can be the basis when setting the number of high-frequency topics and words in the LDA model [53]. After the generation of topics, we categorize and conceptualize these words in a qualitative way. The results obtained can be used to explain the first-level factors and second-level factors which are screened through literature and interviews. These factors, which will be validated step by step, can be used to develop the stock valuation method, using a P/BV ratio in the context of automated trading. Furthermore, they are supposed to be the basis of the index system for the valuation of listed common shares.
3.2. Data Collection and Processing—First Stage
In the first stage, following the method of qualitative research and based on the scope of index selection in the P/BV valuation method, we excavate factors from the literatures. After that, in-depth interviews are designed for excavation. In previous inductive researches, semi-structured interviews have been applied frequently for model construction [53,54].
In practice, we design several closed and open interview questions related to first-level factors, and then, we notice twelve interviewees who have been involved in automated trading. During the interview, we make a recording, and then the data collected are transcribed, encoded, and analyzed. In this way, interviewees from different industries are coded, and simple descriptive statistics are made [11]. They include bank clerks (I1 and I3, Female), a civil servant (I2, Male), Internet industry practitioners (I4 and I6, Male), a graduate student (I5, Female), a professor of finance and trade (I7, Female), an insurance practitioner (I8, Male), senior investors (I9 and I10, Male), a securities practitioner (I11, Female), and a professor of computer specialty (I12, Male). Therefore, to a certain extent, the deviation of gender differences and industry differences to interview results is eliminated. We follow the analysis process shown in Figure 3 for data processing. To begin with, the meaningful sentences are extracted from the manuscript. Through the way of manual coding, a series of phrases are obtained with the conceptualization of sentences. After that, these phrases are classified. In this way, the first-level factors and their corresponding second-level factors that have a significant impact on stock valuation are excavated [55].
3.3. Data Collection—Second Stage
In the second stage, we further validate the first-level factors and second factors that are screened from the literature and interviews by means of text mining. Then, we try to explore other factors that have a significant impact on stock valuation. In the process of data collection, in order to get access to the relative data comprehensively and to broaden the coverage, we mined the data on Sina.com.cn, Xueqiu.com, and CSDN.net (Chinese Software Developer Network). As China’s largest financial and economic network media, Sina.com.cn contains a lot of formal stock market reviews. Xueqiu.com mainly serves mobile terminal users, and since it is one of APPs that retail users prefer, we can get useful information through its column area. CSDN.net, China’s major Internet technology exchange platform, mainly serves IT workforce and financial workforce which are oriented to computer technology. Therefore, our corpus covers a wide range of websites closely related to Intelligent Transaction containing mass media, stock exchange websites, and IT websites. According to our research goal and practical application about Intelligent Transaction, we have an indication that it is suitable to gain texts related to our goal by using “quantification”, “shares”, and “valuation” as key words when searching data. Python is our data mining tool. The content includes the title, delivery time, and essay content. The purpose of the delivery time is to reduce scope and to enhance timeliness. The time range of texts of our choice is from November 1st, 2016 to October 31st, 2018. After doing this listed above, we wipe off weak relevance articles. We finally use 646 articles in Sina.com.cn, 577 articles in Xueqiu.com, and 829 articles in CSDN.net to do our research.
3.4. Data Processing—Second Stage
The next step is data processing with the establishment of corpus. We divide the process of text mining into the following five steps:
- We choose a website and combine the title of each news item with the content of the article to form a training corpus.
- For a high accuracy, we use the jieba instrument to segment words. This instrument is suitable for text analysis because its specialized financial dictionary ensures that the proper nouns in the financial field are not combined or cut by error.
- Right after word segmentation, we eliminate stop-words and high-frequency words which have little relationship with the topics. We then mainly retain the nouns, verbs, and adjectives.
- Once the total frequency or the length of words is lower than 2, we eliminate these words.
- The LDA model is used to extract the main topics from all posts.
When using the LDA model, the numbers of topics and words that are clustered into specific topics are set through the way of trial and error. Combining the results of word frequency statistic and word cloud, we firstly set ten topics and ten corresponding words to observe the interpretability of the model, and then add two topics five times. The number of words that clustered into specific topics are also tried to set as ten, fifteen, or twenty. The experiment could be completed until we find the best number of topics and corresponding words.
The parameters we used in the LDA model are shown in Figure 4. We choose θ to indicate the Text-Agent probability distribution. α, a super parameter for θ, values the density representing the document topics. The larger the α values, the more likely it is that the document will be generated by a mix of more topics. Then, we choose φ to indicate the Theme-Word probability distribution. β, a super parameter for φ, values the density representing document topics. The larger the β values, the denser the words are. In our research, α is set as 1/K and, therefore, as β, which are common settings. Our experiments show that the clustering results are not very sensitive to the set of parameters above. The other parameters used in the algorithm are shown in the following Table 1.
Each document M in the dataset corresponds to the polynomial distribution of K topics and is recorded as a multinomial distribution θ; each subject corresponds to the polynomial distribution of N words in the feature vocabulary and is recorded as a multinomial distribution φ and θ. Both θ and φ have a Dirichlet prior distribution with α and β with hyperparameters. The specific implementation steps of the LDA model are as follows: (1) Extract one topic z corresponding to each word from the plurality of distributions θ corresponding to each document M; (2) extract a word w from the subject z, and the multi-distribution corresponding to the subject is φ; and (3) repeat steps (1) and (2) for a total of N times until each word in the document is traversed.
4. Results
4.1. Result—First Stage
In the first stage of data analysis, by means of statement extraction, conceptualization, and classification, we find the first-level factors which have a significant influence on the research object and on their second-level factors with the data collected.
The results are shown in Table 2; the first column is the main factors including technology, market mechanism, regulation, network externalities, trust, and reputation. The second column, comments, shows sample interview results for these factors. The third column, keywords, is the results obtained by conceptualization and classification of the comments. The fourth column is sub-factors excavated from the above process. Second-level factors are also antecedent factors corresponding to the first-level ones [11]. More notably, to some extent, keywords and sub-factors can explain how the first-level factor puts an impact on stock valuation. Therefore, we will explain this impact mechanism by further validation and exploration at the next stage.
4.2. Result—Second Stage
We use a step by step analysis procedure in order to better explain and validate the factors obtained.
4.2.1. Word Frequency Statistics
With three kinds of corpus, we carry out word frequency statistics. As is shown in Figure 5, the horizontal axis shows the words, the vertical axis represents their frequency of occurrence. To start with, apart from words that are related to the research object itself, such as “share”, “fund”, “assets”, “invest”, and “value”, we find some factors related to fundamentals including “risk”, “profit”, and “rate of return”. Also, there are words related to market mechanisms like “market” and “China”. Factors related to technology involve “strategy”, “data”, “model”, and “quantitative”. “Product” and “company” are related to reputation. The results show that the corpus samples we obtained are valid. Furthermore, to some extent, the statistic results show that factors including the fundamentals, market mechanism, technology. and reputation have a significant impact on stock valuation.
4.2.2. Result Analysis with Word Cloud
By analyzing the word cloud, to a certain extent, we can build a vague understanding about what aspects of the corpus are covered. On this basis, we can narrow the scope of trial and error when setting the number of topics and keywords. At the same time, the word cloud and clustering results can also be cross-validated to reduce errors and omissions and to further enhance the reliability of the results. Figure 5 presents a word cloud from the corpus from CSDN.net. The relevant aspects of these high-frequency words can roughly include the aspects related to technology, fundamentals, market mechanism, and regulatory. Relevant aspects of the word cloud from Sina.com.net include market, firm reputation, fundamentals, technology, and regulation Relevant aspects of the word cloud from Xueqiu.com include market mechanism, fundamentals, and regulation. Moreover, in these word clouds, the high-frequency words have a high coincidence degree, but there are also differences in composition and frequency.
4.2.3. Result Analysis with the LDA Model
Using python, we carry out data processing for the corpuses. The clustering results are shown in the first column and second column based on samples from Sina.com.cn, Xueqiu.com, and CSDN.net. We choose to do clustering three times in order to alleviate data masking issues brought about from the differences among the corpuses. At the same time, it will help to excavate the implicit factors. Through the way of trial and error, we compare the interpretability of each clustering result and set ten topics and fifteen words that clustered into each topic. Since there are duplicate and meaningless topics and words which cannot be avoid, for example, the meanings of words have obvious similarities, or for words that have no specific meaning of their own like “this”, “that”, and “a”, we cut the information to reduce interference.
More notably, what the LDA model generated is hidden themes. As shown in Table 3, Table 4 and Table 5, the words that belong to a specific topic are used to explain the topic. The third columns and forth columns, which show our analytic process and results, are related to some of the main factors and sub-factors that we screened at the last stage. Moreover, some constructs with a good interpretability appear multiple times in the three clustering results. These factors are considered as new valuation factors which have a significant impact on the P/BV ratio. Combining the results obtained in word frequency statistics, the word cloud, and the LDA model, we can explain some of the factors as follows:
Technology and its subfactors, which include data acquisition and processing, system maturity, R&D team performance, and technology compliance, have been approved and validated. Furthermore, the impact that puts on a predicted P/BV ratio can be explained. The results show that with the adoption of technology, investor’s decision-making has been influenced by several technology indices [30], which leads to the improvement of prediction accuracy as well as the reduction of the room of arbitrage. Therefore, the traded prices of stocks will become closer and closer to the intrinsic value of assets and will be in accordance with the efficient market hypothesis. However, with the lack of system maturity, once a wrong order with a strong fund inflow is given, it could cause a stock market crash.
Market mechanisms and its second-level factors have been approved. These second-level factors include market reaction, assets concentration level, and economic conditions at home and abroad. The economic condition at home and abroad is a new factor. The results show that, on the one hand, asset concentration levels will influence stock prices through the impact of supply and demand relations [56]; on the other hand, macro-factors will not only influence the book value of a stock but also influence the behavior of market participants.
Regulation and its subfactors are validated in the process. The subfactors are qualification authentication, the legitimacy of return, and policy response. They will influence stock valuation directly [57], and the stock price will also be influenced by macroeconomic regulation.
Reputation and its sub-factors, which include information disclosure, long-term brand effect, social capacity, and operating condition: To be specific, the operation of business and branding will put a direct influence on the stock selection and valuation [58].
Service is a new factor with a good interpretability that occurs multiple times. Service in this condition refers to a service provided by listed companies in a practical operation. Furthermore, it also has second-level factors that are service modernizations [59]. With the development of the high-tech, the shares of creative firms are considered to have a higher market value.
Investor psychology is also a new factor, or a salient theme, that is screened at the second stage. There is also a subfactor: emotion. To be specific, investor psychology changes with interference from multiple factors [60]. In the process, it will put an influence on stock price volatility [14] and further influence the prediction of the P/BV ratio.
5. Discussion and Conclusions
5.1. Discussion
According to the results we have obtained through an analysis step by step, in the context of automated trading, stock valuation is influenced by more variables that are related to technology, creativity, etc. It further proves that limitations exist in previous valuation methods. Therefore, the valuation method using the P/BV ratio is supposed to extend their index system; in this way, the deviation from the prediction of a P/BV ratio could be reduced.
For the results obtained in the first and second stages, we explored the factor correlation. During the interview process, the respondents also mentioned the influence of other factors under the question of a certain factor, and they also mentioned a lot of relevant content in the open question. In addition, based on the results of text mining and a big data analysis, we also found that some factors often appear simultaneously in topic clustering, and in this topic, there are other words that can explain the relationship of these factors. Therefore, we have established a factor relationship model to illustrate the relationship between them, as is shown in Figure 6. The factors at the inner layer are the first-level factor, and the outer layer factors are the secondary-level factor that we dig. The arrow embodies the cross-impact between the factors we find. The arrow points to the dependent variable, which means that the estimate of the variable and the change of phenomenon related to these factors are affected by the arrow’s senders.
It is worth noting that the original variables in the valuation method using a P/BV ratio are also affected by the new factors we explored, which indicates that the selection and measurement of the independent variables need to be updated to adapt to the new environment.
5.2. Conclusions
In this study, combining qualitative research with text mining methods, we conduct in-depth research on the factors affecting a predicted P/BV ratio in the context of automated trading. A predicted P/BV ratio is used for the valuation of listed common stocks. To start with, based on the principle of the P/BV prediction method, we clarify the scope of the factors that affect the P/BV prediction. Under this scoping, we explore the existing literature, initially find the first-level factors affecting the valuation, then verify these factors by semi-structured interviews, and find a series of corresponding sub-factors. These factors have been verified step by step through text mining methods. In the end, in addition to the four fundamental factors that have been proposed by the existing valuation method, we propose six first-level factors and sixteen sub-factors. Furthermore, a factor relationship model is built based on the implicit correlation that is found in data analysis.
Theoretically, by exploring and validating factors affecting the value of predicted P/BV ratio, we develop the stock valuation theory and enhance its applicability in the automated trading environment. The series of factors, as well as the correlation among them, provide the basis for the construction of the valuation indicator system. To be more specific, the correlation among factors provide a basis for introducing cross-terms when constructing a regression model. At the same time, by considering the influence of important factors that were ignored before, the inconsistency of the regression could be reduced, which will improve the accuracy of prediction.
Practically, the valuation of listed common stock helps investors to measure the value of assets. There is uncertainty associated with asset valuation especially in the context of automated trading, but we are able to reduce bias by adding important variables to the valuation indicator system. As a reference for investment choice and decision-making, a standardized evaluation system also helps protect the interests of market participants and to maintain market order.
However, this study still has some limitations. We have validated first-level and second-level factors through interviews and text mining method, but we have neither built an econometrical model with the factors identified nor tested them.
In the future, we will combine the method of text mining and principal components analysis and to complete the P/BV regression model by including the ignored independent variables to it. To be specific, we will obtain the historical data of a series of representative Chinese stocks within an industry. These data contain the actual P/BV ratio, ROE, Payout, Beta, and EGR at time t, as well as the daily word counts of every factor we found out in this paper. The former can be collected from Eastmoney (a large stock exchange website), and the latter can be collected from the text of Sina Finance and be used to generate new independent variables. After verifying the relationship among a firm’s P/BV and those word counts by comparing their tendency chart, we are able to integrate the variables and to introduce them to a P/BV regression. The accuracy can be tested using an ERR indicator that is proposed by Błażej [14]. In this way, we will attach the research more practical significance.
Author Contributions
Conceptualization, X.C. and D.H.; methodology, X.C. and D.H.; software, X.M.; validation, X.C. and D.H.; formal analysis, D.H.; investigation, D.H., C.L., and X.M.; data curation, X.M. and D.H.; writing—original draft preparation, D.H., X.C., X.M., and C.L.; writing—review and editing, X.C., J.C.; funding acquisition, J.C. and X.C.
Funding
This research was funded in part by the National Key R&D Program of China under Grant No. 2017YFB1400700, the Fundamental Research Funds for the Central Universities in UIBE (CXTD10-06), Program for Excellent Talents in UIBE (Grant No. 18JQ04), and the Foundation for Disciplinary Development of SITM in UIBE for providing funding for part of this research.
Acknowledgments
We thank all the participants who attended the interviews and helped this research.
Conflicts of Interest
The authors declare no conflict of interest.
References
- Dohler, M.; Ratti, C.; Paraszczak, J.; Falconer, G. Smart cities. IEEE Commun. Mag. 2013, 51, 70–71. [Google Scholar] [CrossRef]
- Bahrammirzaee, A. A comparative survey of artificial intelligence applications in finance: Artificial neural networks, expert system and hybrid intelligent systems. Neural Comput. Appl. 2010, 19, 1165–1195. [Google Scholar] [CrossRef]
- Meiring, G.A.M.; Myburgh, H.C. A review of intelligent driving style analysis systems and related artificial intelligence algorithms. Sensors 2015, 15, 30653–30682. [Google Scholar] [CrossRef] [PubMed]
- Lee, H.; Kim, S.G.; Park, H.W.; Kang, P. Pre-launch new product demand forecasting using the bass model: A statistical and machine learning-based approach. Technol. Forecast. Soc. Chang. 2014, 86, 49–64. [Google Scholar] [CrossRef]
- Paiva, F.D.; Cardoso, R.T.N.; Hanaoka, G.P.; Duarte, W.M. Decision-making for financial trading: A fusion approach of machine learning and portfolio selection. Expert Syst. Appl. 2019, 115, 635–655. [Google Scholar] [CrossRef]
- David, W. Empowering automated trading in multi-agent environments. Comput. Intell. 2010, 20, 562–583. [Google Scholar]
- Petropoulos, A.; Chatzis, S.P.; Siakoulis, V.; Vlachogiannakis, N. A stacked generalization system for automated forex portfolio trading. Expert Syst. Appl. 2017, 90, 290–302. [Google Scholar] [CrossRef]
- Geva, T.; Zahavi, J. Empirical evaluation of an automated intraday stock recommendation system incorporating both market data and textual News. Decis. Support Syst. 2014, 57, 212–223. [Google Scholar] [CrossRef]
- Raudys, S. Portfolio of automated trading systems: Complexity and learning set size issues. IEEE Trans. Neural Netw. Learn. Syst. 2013, 24, 448–459. [Google Scholar] [CrossRef] [PubMed]
- Izumi, K.; Toriumi, F.; Matsui, H. Evaluation of automated-trading strategies using an artificial market. Neurocomputing 2009, 72, 3469–3476. [Google Scholar] [CrossRef]
- Huang, D.; Cheng, X.; Hou, T.; Liu, K.; Li, C. Exploring evaluation factors and framework for the object of automated trading system. In Proceedings of the 52nd Hawaii International Conference on System Sciences (HICSS), Maui, HI, USA, 8–11 January 2019; Available online: https://scholarspace.manoa.hawaii.edu/handle/10125/59564 (accessed on 8 January 2019).
- Cheng, X.; Wang, X.; Huang, J.; Zarifis, A. An Experimental Study of Satisfaction Response: Evaluation of Online Collaborative Learning. Int. Rev. Res. Open Distrib. Learn. 2016, 17, 60–78. [Google Scholar] [CrossRef]
- Damodaran, A. Book value multiples. In Investment Valuation: Tools and Techniques for Determining the Value of any Asset, 3rd ed.; John Wiley & Sons: Hoboken, NJ, USA, 2012; pp. 498–513. [Google Scholar]
- Błażej, P. The accuracy of alternative stock valuation methods—The case of the warsaw stock exchange. Ekon. Istraživanja 2017, 30, 416–438. [Google Scholar] [CrossRef]
- Jianu, I.; Jianu, I.; Țurlea, C. Measuring the company’s real performance by physical capital maintenance. Econ. Comput. Econ. Cybern. Stud. Res. 2017, 51, 37–57. [Google Scholar]
- Freitas, F.D.; Freitas, C.D.; De Souza, A.F. Intelligent trading architecture. Concurr. Comput. Pract. Exp. 2016, 28, 929–943. [Google Scholar] [CrossRef]
- Tetlock, P.C. Giving content to investor sentiment: The role of media in the stock market. J. Financ. 2007, 62, 1139–1168. [Google Scholar] [CrossRef]
- Hu, Y.; Liu, K.; Zhang, X.; Su, L.; Ngai, E.W.T.; Liu, M. Application of evolutionary computation for rule discovery in stock algorithmic trading: A literature review. Appl. Soft Comput. 2015, 36, 534–551. [Google Scholar] [CrossRef]
- Fernandez, P. Valuation using multiples. How do analysts reach their conclusions? IESE Bus. Sch. 2001, 1–13. [Google Scholar] [CrossRef]
- Bradshaw, M.T. How do analysts use their earnings forecasts in generating stock recommendations? Account. Rev. 2004, 79, 25–50. [Google Scholar] [CrossRef]
- Cakici, N.; Chan, K.; Topyan, K. Cross-sectional stock return predictability in China. Eur. J. Financ. 2017, 23, 581–605. [Google Scholar] [CrossRef]
- Chen, X.; Kim, K.A.; Yao, T.; Yu, T. On the predictability of Chinese stock returns. Pac. Basin Financ. J. 2010, 18, 403–425. [Google Scholar] [CrossRef]
- Westerlund, J.; Narayan, P.K.; Zheng, X. Testing for stock return predictability in a large Chinese panel. Emerg. Mark. Rev. 2015, 24, 81–100. [Google Scholar] [CrossRef]
- Nezlobin, A.; Rajan, M.V.; Reichelstein, S. Structural properties of the price-to-earnings and price-to-book ratios. Rev. Account. Stud. 2016, 21, 438–472. [Google Scholar] [CrossRef]
- Chue, T.K. Understanding cross-country differences in valuation ratios: A variance decomposition approach. Contemp. Account. Res. 2015, 32, 1617–1640. [Google Scholar] [CrossRef]
- Wilcox, J.W. The P/B-ROE valuation model. Financ. Anal. J. 1984, 40, 58–66. [Google Scholar] [CrossRef]
- Fama, E.F.; French, K.R. The anatomy of value and growth stock returns. Financ. Anal. J. 2007, 63, 44–54. [Google Scholar] [CrossRef]
- Pätäri, E.; Leivo, T. A closer look at value premium: Literature review and synthesis. J. Econ. Surv. 2017, 31, 79–168. [Google Scholar] [CrossRef]
- Aydoğan, K.; Gürsoy, G. P/E and price-to-book ratio as predictors of stock returns in emerging equity markets. Emerg. Mark. Q. 2000, 4, 1–18. [Google Scholar]
- Kim, Y.J.; Cin, B.C.; Cho, K.; Yi, J. Introduction: Technology, finance, and trade in emerging markets. Emerg. Mark. Financ. Trade 2015, 51, 945–946. [Google Scholar] [CrossRef]
- Hendershott, T.; Jones, C.M.; Menkveld, A.J. Does algorithmic trading improve liquidity? J. Financ. 2011, 66, 33. [Google Scholar] [CrossRef]
- Thompson, G.F. Time, trading and algorithms in financial sector security. New Political Econ. 2017, 22, 1–11. [Google Scholar] [CrossRef]
- Kirilenko, A.; Kyle, A.S.; Samadi, M.; Tuzun, T. The flash crash: High-frequency trading in an electronic market. J. Financ. 2017, 72, 967–998. [Google Scholar] [CrossRef]
- Katz, M.; Shapiro, C. Network externalities, competition, and compatibility. Am. Econ. Rev. 1985, 75, 424–440. [Google Scholar]
- Blocher, J. Network externalities in mutual funds. J. Financ. Mark. 2016, 30, 1–26. [Google Scholar] [CrossRef]
- Cao, C.; Xia, C.; Chan, K.C. Social trust and stock price crash risk: Evidence from China. Int. Rev. Econ. Financ. 2016, 46, 148–165. [Google Scholar] [CrossRef]
- Kim, S.; Ha, W.; Seo, J.; Han, S.; Kim, M. A method of evaluating trust and reputation for online transaction. Comput. Inform. 2015, 33, 1095–1115. [Google Scholar]
- Haleblian, J.J.; Pfarrer, M.D.; Kiley, J.T. High-reputation firms and their differential acquisition behaviors. Strateg. Manag. J. 2017, 38, 2237–2254. [Google Scholar] [CrossRef]
- Gentzkow, M.; Kelly, B.T.; Taddy, M. Text as data. Natl. Bur. Econ. Res. 2017, w23276. [Google Scholar]
- Baker, M.; Wurgler, J. Investor sentiment and the cross-section of stock returns. J. Financ. 2006, 61, 1645–1680. [Google Scholar] [CrossRef]
- Heiberger, R.H. Collective attention and stock prices: Evidence from Google trends data on standard and poor’s 100. PLoS ONE 2015, 10, e0135311. [Google Scholar] [CrossRef]
- Shen, D.; Zhang, Y.; Xiong, X.; Zhang, W. Baidu index and predictability of Chinese stock returns. Financ. Innov. 2017, 3, 4. [Google Scholar] [CrossRef]
- Groenewold, N. (Ed.) The Chinese Stock Market: Efficiency, Predictability, and Profitability; Edward Elgar Publishing: Cheltenham, UK, 2004. [Google Scholar]
- Vosoughi, S.; Roy, D.; Aral, S. The spread of true and false news online. Science 2018, 359, 1146–1151. [Google Scholar] [CrossRef]
- Blei, D.M.; Ng, A.Y.; Jordan, M.I. Latent dirichlet allocation. J. Mach. Learn. Res. 2003, 3, 993–1022. [Google Scholar]
- Liu, Y.; Wang, J.; Jiang, Y. PT-LDA: A latent variable model to predict personality traits of social network users. Neurocomputing 2016, 210, 155–163. [Google Scholar] [CrossRef]
- Dyer, T.; Lang, M.; Stice-Lawrence, L. The evolution of 10-K textual disclosure: Evidence from Latent Dirichlet Allocation. J. Account. Econ. 2017, 64, 221–245. [Google Scholar] [CrossRef]
- Li, W.; Chen, H.; Nunamaker, J.F., Jr. Identifying and profiling key sellers in cyber carding community: AZSecure text mining system. J. Manag. Inf. Syst. 2016, 33, 1059–1086. [Google Scholar] [CrossRef]
- Gaskell, H.; Derry, S.; Moore, R.A. Is there an association between low dose aspirin and anemia (without overt bleeding)?: Narrative review. BMC Geriatr. 2010, 10, 71. [Google Scholar] [CrossRef]
- Rumshisky, A.; Ghassemi, M.; Naumann, T.; Szolovits, P.; Castro, V.M.; McCoy, T.H.; Perlis, R.H. Predicting early psychiatric readmission with natural language processing of narrative discharge summaries. Transl. Psychiatry 2016, 6, e921. [Google Scholar] [CrossRef] [PubMed]
- Sun, J.; Wang, G.; Cheng, X.; Fu, Y. Mining Affective Text to Improve Social Media Item Recommendation. Inf. Process. Manag. 2015, 51, 444–457. [Google Scholar] [CrossRef]
- Kim, S.G.; Kang, J. Analyzing the discriminative attributes of products using text mining focused on cosmetic reviews. Inf. Process. Manag. 2018, 54, 938–957. [Google Scholar] [CrossRef]
- Teresi, J.A.; Golden, R.R.; Gurland, B.J. Concurrent and predictive validity of indicator scales developed for the comprehensive assessment and referral evaluation interview schedule. J. Gerontol. 1984, 39, 158. [Google Scholar] [CrossRef]
- Mercer, B. Interviewing people with chronic illness about sexuality: An adaptation of the PLISSIT model. J. Clin. Nurs. 2008, 17, 341–351. [Google Scholar] [CrossRef] [PubMed]
- Cheng, X.; Macaulay, L. Exploring Individual Trust Factors in Computer Mediated Group Collaboration: A Case Study Approach. Group Decis. Negot. 2014, 23, 533–560. [Google Scholar] [CrossRef]
- Chang, R.P.; Rhee, S.G.; Stone, G.R.; Tang, N. How does the call market method affect price efficiency? Evidence from the Singapore Stock Market. J. Bank. Financ. 2008, 32, 2205–2219. [Google Scholar] [CrossRef]
- Kalach, G.M. Contemporary trend in financial policy at stock market. Actual Probl. Econ. 2009, 96, 216–222. [Google Scholar]
- Sila, V.; Gonzalez, A.; Hagendorff, J. Independent director reputation incentives and stock price informativeness. J. Corp. Financ. 2017, 47, 219–235. [Google Scholar] [CrossRef]
- Carter, R.B.; Strader, T.J.; Dark, F.H. The IPO window of opportunity for digital product and service firms. Electron. Mark. 2012, 22, 255–266. [Google Scholar] [CrossRef]
- Wang, X.L.; Shi, K.; Fan, H.X. Psychological mechanisms of investors in Chinese Stock Markets. J. Econ. Psychol. 2006, 27, 762–780. [Google Scholar] [CrossRef]
Figure 1.
The process of automated trading: ① Gathering and storing user information in the cloud. ② User’s decision making. ③ Monitoring the market to find buying and selling opportunities.
Figure 1.
The process of automated trading: ① Gathering and storing user information in the cloud. ② User’s decision making. ③ Monitoring the market to find buying and selling opportunities.
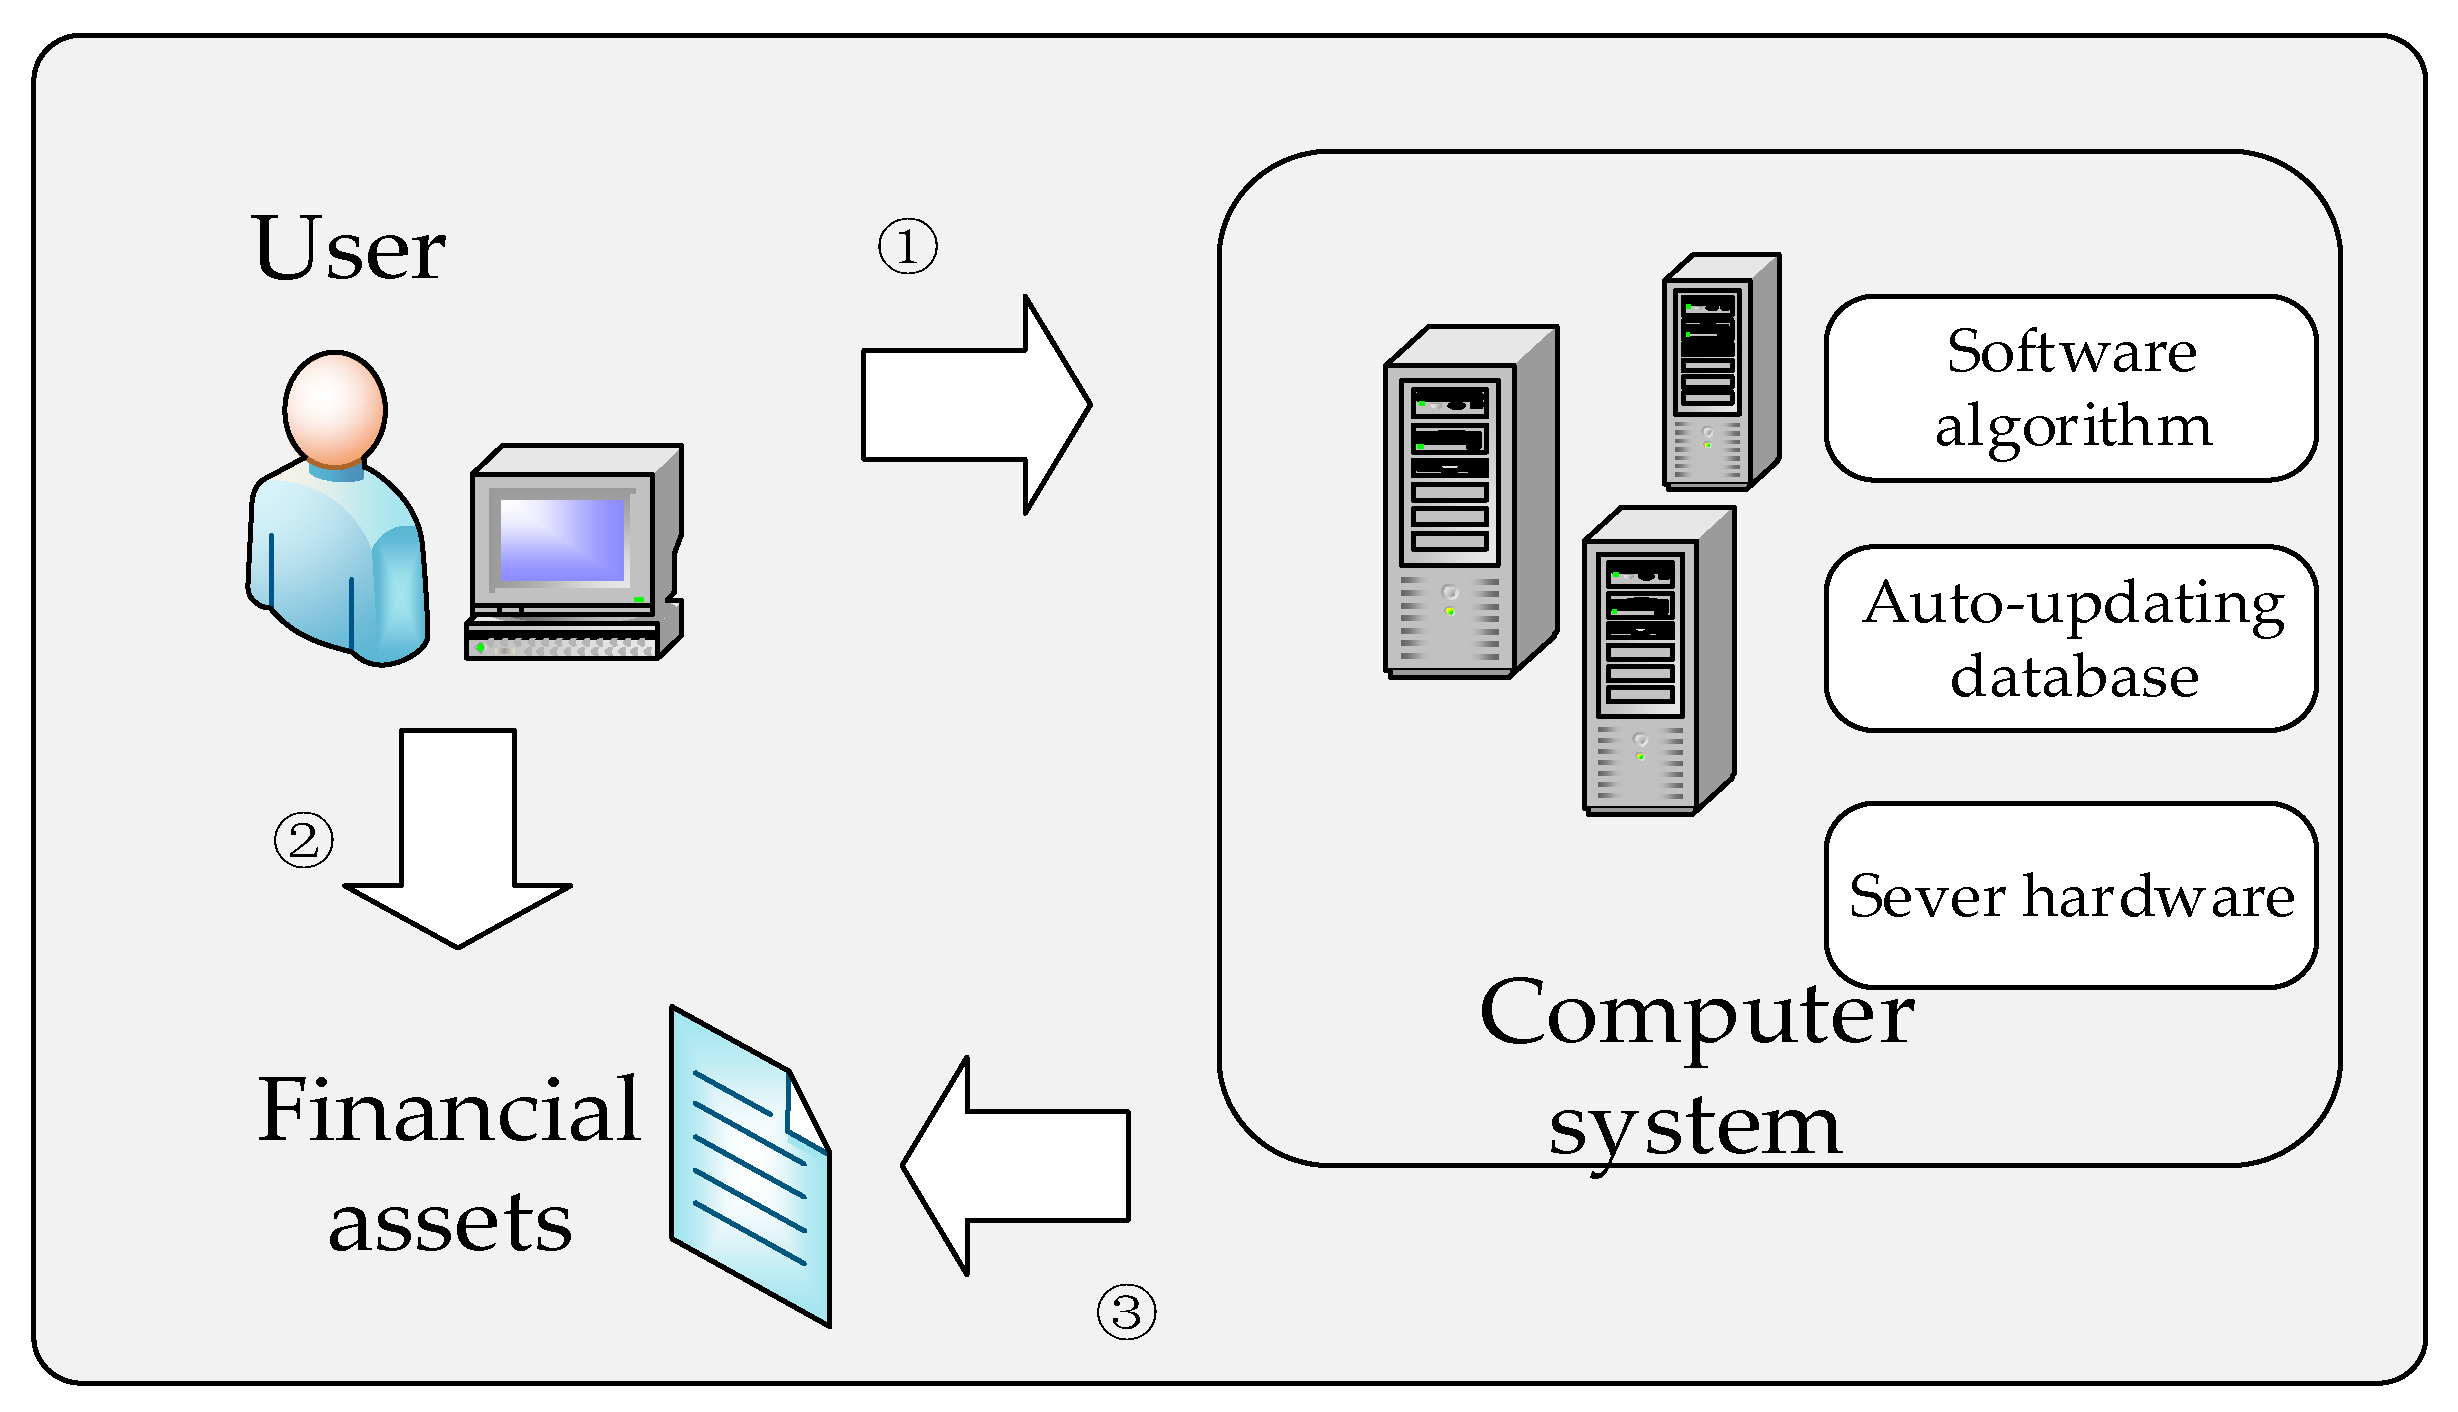
Figure 2.
The research procedure.

Figure 3.
Examples of the conceptualization and categorization.

Figure 4.
The LDA model and relevant parameters.

Figure 5.
A statistical analysis of text: (a) word frequency statistics; (b) a word cloud for xueqiu.com; (c) a word cloud for CSDN.net; and (d) a word cloud for sina.com.cn.
Figure 5.
A statistical analysis of text: (a) word frequency statistics; (b) a word cloud for xueqiu.com; (c) a word cloud for CSDN.net; and (d) a word cloud for sina.com.cn.


Figure 6.
An integrated mapping of the valuation factors.


Table 1.
The symbols used in the Latent Dirichlet Allocation (LDA) model.
| Symbol | Meaning |
|---|---|
| W | Word |
| N | Number of words |
| M | Number of texts |
| K | Number of topics |
| Z | Assignment of topics |
Table 2.
Comment examples for the factors and sub-factors.
| Comments Example | Keywords | Sub-factors | |
|---|---|---|---|
| Technology | (I4) Whether it has enough data to support it to make this decision | Data diversity, Data abundance | Data Acquisition and Processing |
| (I3) A machine may be more rational than a human being. It may be more comprehensive. (I6) It has to ensure the safety of our data, such as bank cards. If the database leaks, it is all over. | Comprehensiveness Security | System maturity | |
| (I7) The R&D personnel of the platform may only be an information technology personnel, so there may be a problem of disconnection. | Technical team | R&D team performance | |
| (I7) Some practitioners seem to break national law and regulations when developing the system or trading stocks. | Legitimacy | Technology compliance | |
| Market mechanism | (I5) The design of algorithms needs an adjustment on the basis of public feedback and policy. | Feedback Adjustment | Market reaction |
| (I4) The efficiency of the market and the development of those tools are promoted by each other. | Mutual promotion | Market prioritizing | |
| (I7) The amount of funds will also have an impact. | The amount of funds | Assets concentration level | |
| Regulation | (I4) In my view, it is necessary to consider a series of procedures and qualifications. (I2) They are supposed to make an introduction about what support they have rallied for people who do not know about it. | Qualification | Qualification authentication |
| (I3) Market manipulation can be found anywhere for they cannot make a profit without it. (I6) The program is written by people, while people are probably breaking the law to do some things. | Market manipulation, Legitimacy | The legitimacy of return | |
| (I5) It is necessary for those companies to respond to national policy, which will help to improve the corporate value. | National policy | Policy response | |
| Network externalities | (I10) The value of shares needs to be determined by their own price. | Price | Stock price |
| (I8) There are different strategies including black box and white box to choose from in every platform. | Different strategy | Functional development | |
| (I9) The practicability of the automated trading platform can be influenced by the involvement of customers. | Customer involvement | Customer involvement | |
| A corporate trust | (I6) In the whole market, if the ability to earn profits is getting higher and higher, more and more people will rely on this system. | Rely | Dependency |
| (I7) The impact on the fund security and user privacy, which are brought by the high-tech, needs to be given more attention. | Security | Perceived security | |
| (I4) Evidence needs to be provided for users to convince them that the system can help them make a profit. | Profitability | Benefit | |
| Reputation | (I4) The information that is disclosed by firms with goodwill is authentic. | Authentic information | Information disclosure |
| (I1) Investors are influence by a firm’s reputation and word-of-mouth. | Brand | Long-term brand effect | |
| (I6) The latter refers to things like bad news. (I1) Big news | Report | Social capacity | |
| (I7) Tt is necessary to consider its duration. | Duration | Operating condition |
Table 3.
A clustering analysis using the LDA results—Xueqiu.
| Topic | High Frequency Words | Categories | Related factors |
|---|---|---|---|
| 1 | Industry segments, The overall market, Leading shares, Range, Bear market, Choice, Transaction, Strategy, Expectation, Stock index | Market reaction | Market mechanism |
| 2 | Factor analysis, Model, Portfolio, Market value, Stock selection, Weight, Build, Multifactor, alpha, Calculation | R&D team performance | Technology |
| 3 | CSI100, Evaluation, Trillion yuan, Determine, Stock price, Index, Random walk, Shanghai and Shenzhen stock markets, GDP | Assets concentration level | Market mechanism |
| 4 | Performance, Product, Consumption, Growth, Enterprise, Development, Improve, Business, Continued, Brand, Income | Brand, Operating condition, Service | Reputation, Service |
| 5 | Enterprise, Cash flow, Growth rate, Formula, Calculation, Intrinsic value, Expectation, Dividend, Per share, Growth, Net profit, Discounted rate | Expected growth rate Dividend | Fundamentals |
| 6 | Dividend, Range, Medicine, Classification, Transaction on exchange, Reasonable price hike, Rating, Public, OTC | Qualification The legitimacy of return | Regulation |
| 7 | Strategy, Hedge, Arbitrage, Portfolio, Fundamentals, Stock selection, Products, Analysis, Trend, Study, Index, Tools, Use, Program, Statistics | System maturity | Technology |
Table 4.
A clustering analysis using the LDA results—Sina.
| Topic | High Frequency Words | Categories | Related Factors |
|---|---|---|---|
| 1 | Innovation, Institution, Pilot, Strategy, CSRC (China Securities Regulatory Commission), Standard, Institutions, Investors, Technology, Release, News Report, Number, Rules | Technology compliance, Legitimacy, Social capacity Policy response | Technology, Regulation, Reputation |
| 2 | Past, Hopeful, Shock, Fluctuation, The market momentum, Emotion, Market value, Profit, Stock selection, Reverse | Market reaction, Emotion | Market mechanism, Investor psychology |
| 3 | Capacity, Information, R & D, Expansion, Demand, Global, Industry, Revenue, Business, Service | Operating condition, Service | Reputation Service |
| 4 | United States, Business cycle, Interest rates, Dollar, FED, RMB, Policy, Treasury bonds, Monetary policy, Industry segments, Consumption, Inflation, GDP, Exchange rate | Economic conditions at home and abroad | Market mechanism |
| 5 | Factor analysis, Report, Model, Forecast, Index, Method, Portfolio, Use, Rating, Beta, Artificial intelligence | R&D team performance | Technology |
| 6 | Fund, Management, Holders, Share, Trustees, Contract, Provisions, Account, Shareholders Meeting, Notice, Should | Information disclosure | Reputation |
| 7 | Stock, index, Fall, Average, Loss, Customer, Lead to, Pessimistic, Change | Market reaction, Emotion | Market mechanism, Investor psychology |
Table 5.
A clustering analysis using the LDA results—CSDN.
| Topic | High Frequency Words | Categories | Related Factors |
|---|---|---|---|
| 1 | MACD, Strategy, Probability, Position, Buy, Software, Setting, Value, Indicator, Average, Parameters, Match, Algorithm | System maturity | Technology |
| 2 | Fund manager, Configuration Shareholding, App, Trading system, Repurchase, Research, Risk, Information, Performance, The listed companies, The overall market, Investors, | R&D team performance Data Acquisition and Processing System maturity | Technology |
| 3 | History, China, Underestimates, Pharmaceuticals, Brand, Consumer, Securities, Group | Brand | Reputation |
| 4 | P/E, Yield, PB/V, ROE, Dividend, Market index, Rise and fall, Average, Growth rate, Net assets, Net profit | Fundamentals Multiples | Fundamentals |
| 5 | Industry, Enterprise, Products, China, Economy, Business, Financing, Development, Technology, American, Customers, Global, Future, Risk, Science | Operating condition, Economic conditions at home and abroad | Market mechanism Reputation |
| 6 | User, Services, Internet, Network, Publishing, Digital, Product, Value, Indicators, A leading reference | Service modernization | Service |
| 7 | Strategy, Model, Financial, Python, Predictive, Platform, Technology, Algorithm, Machine, System, Development, Language, Training, Artificial intelligence, Information | System maturity Data Acquisition and Processing | Technology |
© 2019 by the authors. Licensee MDPI, Basel, Switzerland. This article is an open access article distributed under the terms and conditions of the Creative Commons Attribution (CC BY) license (http://creativecommons.org/licenses/by/4.0/).
Share and Cite
MDPI and ACS Style
Cheng, X.; Huang, D.; Chen, J.; Meng, X.; Li, C. An Investigation on Factors Affecting Stock Valuation Using Text Mining for Automated Trading. Sustainability 2019, 11, 1938. https://doi.org/10.3390/su11071938
AMA Style
Cheng X, Huang D, Chen J, Meng X, Li C. An Investigation on Factors Affecting Stock Valuation Using Text Mining for Automated Trading. Sustainability. 2019; 11(7):1938. https://doi.org/10.3390/su11071938
Chicago/Turabian StyleCheng, Xusen, Danya Huang, Jin Chen, Xiangsong Meng, and Chengyao Li. 2019. "An Investigation on Factors Affecting Stock Valuation Using Text Mining for Automated Trading" Sustainability 11, no. 7: 1938. https://doi.org/10.3390/su11071938
Note that from the first issue of 2016, this journal uses article numbers instead of page numbers. See further details here.