USLE K-Factor Method Selection for a Tropical Catchment
by
 , ,
, ,
Valter S. Marques
1, 
Marcos B. Ceddia
2,
Mauro A. H. Antunes
2,
Daniel F. Carvalho
2,
Jamil A. A. Anache
3,*,
Dulce B. B. Rodrigues
4 and
Paulo Tarso S. Oliveira
4 1
Federal Institute of Goiás, GO 154, Km 3, Ceres, GO 76300-000, Brazil
2
Institute of Technology, Federal Rural University of Rio de Janeiro, BR 465, Km 7, Seropédica, RJ 23890-000, Brazil
3
São Carlos School of Engineering, University of São Paulo, CxP. 359, São Carlos, SP 13566-590, Brazil
4
Faculty of Engineering, Architecture and Urbanism and Geography, Federal University of Mato Grosso do Sul, CxP. 549, Campo Grande, MS 79070-900, Brazil
*
Author to whom correspondence should be addressed.
Sustainability 2019, 11(7), 1840; https://doi.org/10.3390/su11071840
Submission received: 17 February 2019
/
Revised: 15 March 2019
/
Accepted: 22 March 2019
/
Published: 27 March 2019
Abstract
:The use of the Universal Soil Loss Equation (USLE) and the Sediment Delivery Ratio (SDR) facilitates sediment yield (SY) estimates in watersheds. However, the soil loss predictions are frequently unrealistic because of the methods used to estimate the USLE’s factors. Here, we evaluated the performance of methods to estimate the soil erodibility (K-factor) and the influence of its estimation in the SY predictions. K-factor values were obtained from three widely used equations and using a portable rainfall simulator. These values were used to compute annual average soil loss and SY in a tropical watershed. We compared SY estimates with a 15-month observed sediment discharge dataset sampled in the catchment outlet. The most reliable method for the K-factor estimating was the USLE nomograph. Furthermore, our results indicate that the use of a portable rainfall simulator to estimate the K-factor tends to underestimate soil loss and sediment delivery.
1. Introduction
The prediction of soil loss is important to establish practices of land use for future generations, thereby ensuring the sustainable production of food, fibers and renewable fuels [1,2]. However, it is well known that only a fraction of the sediment eroded within a drainage basin will find its way to the catchment outlet and be represented as the sediment yield [3]. The Sediment Delivery Ratio (SDR) is widely used to represent the entire process involved between on-site erosion and downstream sediment yield. SDR is the ratio between the sediment yield at the catchment outlet and the gross soil erosion of the whole drainage area. This approach has been used to estimate the sediment yield in many watersheds worldwide [3,4]. Over the last decades, the development of Geographical Information Systems (GIS) technologies allowed the application of the Universal Soil Loss Equation (USLE) and SDR models to compute sediment yield spatially. Such estimates are possible by calculating the product between the gross erosion given by the USLE in a cell i of a catchment and the SDR calculated for the same cell i, representing the contribution of each cell i to the catchment’s sediment yield [4,5,6,7,8,9,10,11,12,13].
The USLE [14] and its revised version [15] have been widely used in Brazil [16,17,18,19] and worldwide [20,21]. However, the results are frequently unrealistic because of the methods used to estimate some factors of this equation, which were empirically developed in the United States and may not be applicable under different conditions [22]. The soil erodibility factor (K-factor) represents the rate of soil loss per unit of erosion index in a standard plot 22.1 m long, on a 9% slope under a continuous bare cultivated fallow, tilled in slope direction [14]. As it is necessary to perform experimental fieldwork under natural or artificial rainfall for each soil class, the determination of the K-factor is expensive and time-consuming [23,24]. Therefore, in large countries such as Brazil, the determination of this factor becomes more difficult, taking a gap or inaccurate information about its values.
The soil erodibility factor has been determined by three procedures. The first, carried out in field conditions and under natural rainfall, associates the soil loss with the rainfall erosivity index [24]. Although this is considered the standard procedure, it demands too much time to generate a reliable dataset and extensive fieldwork for sediment collection. The second, also widely used, is similar except for the use of artificial rather than natural rainfall. Both the procedures reflect soil erodibility as required by the USLE [14]. The third procedure allows estimating the K-factor by indirect methods based on pedotransfer equations. These methods use multiple regression models that include independent soil variables associated to soil erodibility obtained previously in standard procedures [25,26,27,28,29,30,31,32,33,34,35].
Since basic field hydrological studies are scarce in tropical countries in the southern hemisphere [17,36] and considering that there are different methods available to estimate soil erodibility (K-factor), which can be a major source of uncertainty in USLE-SDR applications [37], it is important to evaluate which method is more suitable to predict soil loss and sediment yield in tropical watersheds. Thus, here it was tested whether pedotransfer equations are capable of predicting the K-factor with a satisfactory performance and whether local observations of the K-factor using a portable rainfall simulator were reliable resources for modelling the catchment sediment yield. The objective of this study was to evaluate the performance of different methods to estimate soil erodibility for soil loss and sediment yield modeling using sediment yield observations. We computed K-factor values from three widely used empirical equations [14,15,38] and using a portable rainfall simulator. Furthermore, the K-factor estimated from these different approaches were used to compute annual average soil erosion and sediment yield in the Córrego Água Azul catchment, midwestern Brazil. We also used observed sediment discharge sampled in the basin outlet to evaluate our results.
2. Materials and Methods
2.1. Study Area
The Córrego Água Azul catchment (area of 2.69 km2) is located in the municipality of Ceres, State of Goiás, Brazil (49°37.2′ W to 49°36′ W; 15°19.98′ S to 15°21.30′ S) (Figure 1A). The area belongs to the geological formation Complexo Barro Alto, made up of decomposed basic igneous rocks (45% to 52% of silica) and containing a substantial amount of reworked material [39]. In general, landform is flat to slightly wavy, with altitude ranging from 525–644 m and average slope steepness of 0.0654 m m−1. The catchment is regularly drained (drainage density equal to 0.80 km km−2), and it has one first order main stream. The study area faces accelerated rill and interrill soil erosion due to the dominant agricultural land uses.
According to Köppen climate classification, the climate is Aw tropical wet and dry or savanna, with the dry season occurring during winter. The average annual temperature and precipitation are approximately 25 °C and 1300 mm, respectively. Monthly and annual rainfall data for the last 12 years were obtained from the Instituto Nacional de Pesquisa Espaciais (INPE) and the Sistema de Meteorologia e Hidrologia do Estado de Goiás (SIMEHGO). The predominant soil types are Latossolos (Oxisols), Nitossolos (Alfisols), Cambissolos (Cambisols) and Gleissolos (Gleysols), with texture varying from sandy to clayey (Figure 1B).
2.2. Sediment Delivery Monitoring
Streamflow and sediment concentration at the catchment outlet were measured twice a day, during July 2010 through September 2011 (15 months in total) according to the procedures suggested by [40]. Suspended sediment samples were collected from river flow at 6:30 a.m. and 6:30 p.m. with a sampler model DH48 through vertical sample integration. The crucibles empty weight (We) were determined and filled with 50 mL of water (measured in volumetric pipette) and placed in an oven at 105 °C for 12 h. The crucibles were cooled in desiccators after water evaporation and weighed in analytical scale to determine remaining sediment weight (Ws), in grams, using Equation (1):
where: SC is the sediment content in the discharge (mg L−1); WS is oven-dried crucible plus the sediment weight; WE is the empty crucible weight; SV is the sample volume (L).
SC = (WS − WE)/SV
We computed sediment discharge according to Equation (2):
where: SYobs is the sediment discharge (Mg T−1); DS is discharge (m3 T−1); SC is sediment content in the discharge (mg L−1); T is the period (daily, monthly, annual); 10−6 is the unit conversion factor.
SYobs = DS × SC × 10−6
The streamflow was determined twice a day (6 a.m. and 6 p.m.) through a thin-plate weir installed in a concrete wall built at the catchment outlet (Figure 2A,B), across the watercourse. This structure permitted the replacement of the weir form (triangular or rectangular fully contracted) depending on water volume during the evaluation period.
2.3. Sediment Delivery Modelling
The sediment yield of the studied catchment was calculated for each cell i using Equation (3) [3,10]. The processing steps detailed in this section are summarized in Figure 3. The distributed modelling considers the catchment as a raster divided in a number of cells, with a spatial resolution of 1.0 m. The SDR and soil loss for the whole catchment is given by the average between all values from each cell. The sediment yield that reaches the catchment’s outlet is the sum of all cell values (SYiest).
where: SYiest is the sediment delivery in the catchment outlet in a given period of time in a given time T (daily, monthly, annual) (Mg T−1); Ai is the soil loss in the cell i in a given time T (daily, monthly, annual) (Mg ha−1 T−1); PA is the DEM-HC cell (pixel) area (ha); SDRi is the Sediment Delivery Ratio (dimensionless).
SYiest = ∑[Ai × SDRi × PA]
2.3.1. Soil Loss Estimates
We estimated the sediment delivery in the Córrego Água Azul catchment using the Universal Soil Loss Equation (USLE) [14]:
where: Ai is soil loss calculated for a unit of area in the cell I (Mg ha−1 year−1); R is the rainfall erosivity factor (MJ mm ha−1 year−1 h−1); K is the soil erodibility factor (Mg ha h ha−1 MJ−1 mm−1); L is slope length or steepness factor (dimensionless); S is slope steepness factor (dimensionless); C represents the land cover and management factor (dimensionless); and P is the conservation practices factor (dimensionless).
Ai = (R × K × LS × C × P)i,
The R-factor was determined according to the national map developed by Trindade, et al. [41]. To obtain the rainfall erosivity map for Brazil, the authors used 1521 rain gauges with time series longer than 20 years and geostatistical techniques [41]. This R-factor was used to develop the final maps for soil loss and sediment yield after deciding each K-factor estimate would be used in the model simulation step.
We also evaluated monthly sediment delivery estimates using the monthly rainfall erosivity index (EI30) for the same period the sediment delivery was monitored (from July 2010 to September 2011). To estimate the monthly sediment yield of the catchment during the monitoring period (from July 2010 to September 2011), the monthly rainfall erosivity index (EI30) was calculated using measured rainfall data (kinetic energy, intensity, and rainfall depths) as an input to the Rainfall Intensity Summarization Tool (RIST) [21].
The K-factor was estimated with different approaches: using indirect models and rainfall simulation tests in the main soil types of the catchment. This factor was calculated by the weighted average erodibility of each soil mapping unit, through soil attributes in A horizon and modal profile of these units (Figure 1B). We used three widely used empirical equations and from measures of experimental tests with a portable rainfall simulator. Equations (5)–(7) came from Bouyoucos [38], the USLE nomograph [14], and RUSLE (revised USLE) K equations [15], respectively.
where: SAN, SIL and CLA are contents (%) of sand, silt and clay, respectively.
where: M is the silt plus very fine sand contents multiplied by 100 minus clay content (%); a is the organic matter content (%); b is a code related to soil structure (dimensionless); c is a code related to soil permeability (dimensionless).
where: Dg is the geometrical particle diameter (mm), based on the fractions of the texture classes and arithmetic means of the particle diameter of each texture class.
K = [(SAN + SIL)/CLA]/100
K = [2.1 × 10⁻⁴ M1.14 (12 − a) + 3.25 (b − 2) + 2.5 (c − 3)]. (0.1317/100)
K = 0.0034 + 0.0405 × exp[−0.5 ((logDg + 1.659)/0.7101)2]
Soil loss caused by artificial rain was determined in the field using a portable rainfall simulator on plots of 0.7 m2 [42] (1 m of slope length and approximately 8% of slope gradient) for the main soil classes found in the catchment. Thus, K-factors from rainfall simulations were estimated using the USLE equation. We assigned the constant value of 1 to the Factors C and P [14], as the simulations were performed in tilled fallow without plant cover conditions; and the value of 0.19 to the Factors L and S obtained from Equations (8) and (9) [43,44] considering the rainfall simulator plots slope length and gradient. Rainfall simulators that covers a small area can misrepresent some erosion processes that may occur due to the small area (e.g., rill erosion), but it is a suitable way to investigate the soil’s onsite conditions more feasibly [45]. A total of 21 field tests were performed in triplicate for each evaluated soil class (Figure 2C,D). The rainfall events simulated exhibited 45 mm h−1 intensity and were applied during 60 min. Mean drop diameter was 2 mm, water pressure in the emitters 34.47 kPa and dripping height 2.30 m.
The values of L, S, C and P factors of the USLE were GIS-based information obtained from field surveys. To determine the topographic factor (L and S Factors), we first produced a digital elevation model with hydrological consistency (DEM-HC) for the catchment, using 1.0 m spatial resolution and a scale of 1:5000. This was obtained with ArcGis 9.3 software (ESRI, Redlands, CA, USA), which also was used to computed the L-factor (Equation (8)) [14] and S-factor (Equation (9)) [44].
where: L is the slope length or hillside factor (dimensionless); λ is the slope length (m) valued for 1 m in the study area due to the DEM-HC spatial resolution; m is the coefficient of Foster, Meyer and Onstad [43]’s equation (dimensionless) (0.5 for slopes ≥ 5%, 0.4 for 4% slopes, 0.3 for slopes ≤ 3%); and 22.13 m is slope length of the standard plot [14].
where: S is the hillside slope or slope steepness factor (dimensionless); and sen θ is the slope angle (degrees). The calculations resulted in an average topography (LS) factor of 0.263 for the catchment.
L = (λ/22.13)m
S = 3.0 × (sin θ)0.8 + 0.56
Land cover and management factor (C-Factor) was determined from land cover and land use maps (Figure 1C) of the Córrego Água Azul catchment generated using satellite images from the Ikonos II sensor. The images were exported to ArcGis 9.3 software, which georeferenced the classes of land use and occupation and converted them into vector format. C-factor values were assigned to each land use class, in accordance with Bertoni and Lombardi Neto [25], who performed an experimental assessment thought the main land uses found in Brazil using standard USLE plots.
Values for the conservation practices (P-factor) were assigned to each conservation practice adopted in the catchment, as proposed by the experimental assessments performed in Brazilian agricultural land sites [25]. Therefore, the P-factor value was 1.0 for areas occupied by buildings, flooded sites and those covered by bare soil; 0.5 for areas planted along the contour lines; 0.2 for livestock-grazing areas; 0.01 for Capoeira (secondary forest) areas; 0.001 for regions covered with grasses and forest.
2.3.2. Sediment Delivery Ratio Modelling
In general, the SDR decreases as the overland flow length increases, as it is more difficult for sediments to reach the channels over longer traveling distances. SDR is calculated from the receiving drainage length ratio to the total drainage length according to the Equation (10) [12], which has been applied for distributed SDR modeling in similar studies [46,47]: The flow length algorithm available in the GIS package used as input a flow direction raster obtained previously from the DEM-HC. We computed the flow path for both upstream and downstream. The downstream flow length is the downslope distance along the flow path, from each cell i to the catchment’s outlet; and the upstream flow length is the longest upslope distance along the flow path, from each cell i to the top of the drainage divide.
where: FLup is the flow length upstream of the cell i (m) and FLdown is the flow length downstream of the cell i (m). The sum of both FLup and FLdown is the total length of drainage that pass thought the cell i (m).
SDRi = FLup/(FLup + FLdown)
2.3.3. Sediment Delivery Estimates
We used the evaluation guidelines suggested by Moriasi, et al. [48], which consist of three quantitative statistics: Nash-Sutcliffe efficiency (NSE), percent bias (PBIAS) and the root mean square error (RMSE), and graphic techniques in addition the coefficient of determination (R2).
The relative magnitude of the residual variance compared to the measured data variance was calculated using the NSE [49]. This index indicates how well the plot of observed versus simulated data fits the 1:1 line. The tendency of estimates to be larger or smaller than the observed data was evaluated using the PBIAS [50]. The PBIAS is expected to be close to zero when the model is accurate to estimate the sediment delivery. Positive values indicate model underestimation bias and negative ones. The PBIAS can be considered very good if PBIAS < ±15%; good, if 15% ≤ PBIAS < ±30%; satisfactory, if 30% ≤ PBIAS < ±55%; and unsatisfactory, if PBIAS ≥ ±55%. The RMSE is an error index and indicates the error in the unit of the constituent of interest [51].
We used a scatter plot to compare the observed and the estimated monthly means of sediment delivery in the studied catchment. In addition, the R2 was also determined for each estimation alternative, and it describes the degree of collinearity between the observed and estimated data, ranging from 0.0–1.0. Values of R2 greater than 0.5 are considered acceptable [48].
3. Results and Discussion
3.1. Factors of the USLE
We found an average R-factor of 9378 MJ mm ha−1 year−1 h−1 to the studied area, a high value according to recent R-factor estimation across Brazil developed by Almagro, et al. [52]. The average monthly EI30 varies along the year (Figure 4A), agreeing with the average monthly rainfall. Concerning the EI30 obtained for the sediment yield monitoring period (July 2010–September 2011), the values were higher than the average, however they also agreed with the rainfall depth observed during the monitored period.
The inputs (Table 1) for the K-factor equations, which are soil physical characteristics, and the outputs (Table 2) are given by soil class for each K-factor estimation method. Table 2 shows K-factor values determined by a direct method (rainfall simulation) and using three indirect methods (Equations (5)–(7)). Irrespective of soil type, the greatest values were obtained by Equations (5) and (7). The K-factor values determined by Equation (6) were ranked at third place. For all soil classes evaluated, the smallest K value was determined by the direct method.
Except for Equation (5), which produced similar K values between the soil classes, the other methods generated the smallest K values for the Oxisol type. K values obtained by Equation (6), which is the nomograph method, were greater than those obtained with the rainfall simulator for all the soil type. The greatest difference was observed to the Oxisols Latossolo Vermelho Eutrófico (LVe) and Latossolo Vermelho Distrófico (LVd), nearly 12- and 14-fold range, respectively.
The LS-factor distribution though the catchment area can be observed in Figure 5B. The average LS in the study area is 0.72 and among the USLE factors, it is the factor most influenced in the pattern of the gross erosion map (Figure 6A). According to Risse, et al. [53] the LS and C factors have been shown to be the two factors that most greatly influence the USLE model’s overall efficiency.
The C and P factors in the catchment, obtained by weighted average, were 0.183 and 0.38, respectively. Figure 5C,D show the distribution of these values in the catchment based on agricultural data available in the literature [25,54]. According to Oliveira, Nearing and Wendland [54], the C-factor can be helpful to evaluate the effect of land use changes on the soil loss rates. Further, mean rates of soil loss under conventional agricultural areas can be 124-fold greater then under undisturbed vegetation [55], highlighting the importance of such factor.
3.2. Sediment Delivery Ratio (SDR)
We calculated the SDR, soil loss, and sediment delivery for each cell in the catchment and the results are shown in Figure 6. The SDR spatial distribution can be observed in Figure 6B and it is mainly determined by the land topography. However, in some cases, the spatial heterogeneity of the SDR is not represented in the sediment yield modelling in the context of watersheds, and it is computed as a single ratio to multiply by the average gross erosion of the area [7,56]. We found a SDR value of approximately 5% in the Córrego Água Azul catchment. This value has the same order of magnitude of the SDR (6.1%) found in a similar catchment in terms of annual sediment yield [3] and is similar to the values (5.5–10.5%) observed in a tropical catchment inside the same biome in Brazil [57]. De Vente, Poesen, Verstraeten, Rompaey and Govers [4] also reported studies in catchments with areas between 30–1000 km2 and sediment yield (around 100 Mg yr−1) that also show SDR values smaller than 10%, indicating that our study area has a small SDR value; considering that the authors found values greater than 50% in some basins.
3.3. SDR-USLE Model Evaluation
The uncertainties associated with USLE-SDR family models are barely discussed in the literature and validating the soil erosion rates produced by these models is challenging due to the lack of observational records, especially in data-scarce environments [58]. However, some efforts have been made to compute K-factor flaws [53,59,60,61,62,63], which tend to present a higher uncertainty when compared to the other USLE factors [37]. In contrast to the K-factor, the SDR uncertainties were found to be around 5% [37]. Thus, the USLE-SDR outcomes can be highly influenced by the K-factor and the method selection is important to reduce the bias between the observations and estimates. Hence, Figure 4B shows SDR-USLE-based sediment yield predictions in the studied area, based on the different estimates of soil erodibility obtained by indirect and direct methods, and sediment delivery measures taken directly from the outlet in 2010–2011 (solid red line). Considering that the most realistic sediment yield values are those measured in the outlet, they were used as reference to evaluate and compare the results produced by the different K estimates used in the USLE. Systematic variations in sediment yield estimates were obtained using the soil erodibility values determined by the different Equations (5)–(7) as well as by rainfall simulation.
Table 3 evidences the statistical metrics used to compare and contrast observed and estimated sediment yield for the Córrego Água Azul catchment. Compared to the sediment yield measured in the catchment outlet (133.13 Mg yr−1) and using the PBIAS as an indicator, K-factor by Renard, Foster, Weesies, Mccool and Yoder [15] produced the most overestimated soil loss and sediment yield predictions (Table 3 and Figure 4B). This method corresponds to a regression equation based on a global soil survey and taking into account only the particles’ geometric diameter. In addition, this method may overestimate the erodibility for Oxisols [64], and such soil class occupies a large area in the studied catchment. The sediment yield outcomes based on the other K-factor equations showed underestimated values (see the PBIAS values on Table 3), likewise studies that uses literature K-factor values to run soil erosion models [61]. Estimates based on Wischmeier and Smith [14], in turn, resulted in sediment delivery values closer to those measured in the outlet in 2010–2011 (109.58 Mg yr−1). The K-factor obtained with the rainfall simulator underestimated the soil erosion, agreeing with Singh and Khera [65]. The sediment delivery was underestimated by using the rainfall simulator K-factor (Table 3). Some authors have suggested that erosivity values obtained from natural and simulated rainfall are discrepant, and the disadvantage in using simulators is that the rainfall events produced are limited to specific sites and relatively small areas over time, imposing limits for the initial rainfall tests [66,67]. Although the portable rainfall simulator K-factor presented an intermediate performance near satisfaction in comparison with the other methods, the device used in this study is suitable for generating only interrill erosion, as rill erosion has to be observed in larger plots (this study used 0.7 m2 plots) [42,45]. Furthermore, the scale factor is very important in this kind of study, as the larger the plot-size, the better the agreement with watershed-scale measurements [68]. However, the portable rainfall simulator can be an alternative to obtain field-observed K-factor values.
Negative values of NSE and high values of RMSE (Table 3) have indicated that the K-factor based in the Renard, Foster, Weesies, Mccool and Yoder [15] method was not suitable to estimate the sediment yield and the soil loss in the studied catchment. The methods developed by Wischmeier and Smith [14] and Bouyoucos [38] have provided the more suitable K-factor values to be used in the SDR-USLE model to estimate soil loss and sediment yield in the studied catchment. These methods showed the best fit with the observed data (Figure 4B) and also had the best efficiencies (Table 3). However, for a better understanding of the most adequate alternatives to predict soil loss and sediment yield, it is recommended the use of longer observations periods in the model calibration and validation [14,15]. The K-factor obtained with the portable rainfall simulator [42] presented results near satisfaction according to the NSE, which was close to 0.5 and the lower RMSE, being comparable to conventional experiments (natural rainfall and bigger plots) [69] and an alternative for surveys where field data and resources for conventional experiments are scarce.
We found the same R2 value for all evaluated methods (Table 3), demonstrating that all of them respect the dynamics of the sediment delivery along the time. The dynamics of the sediment yield is determined by the flow rate, which is sensible to the rainfall. Thus, as the K-factor did not change along the time, the rainfall erosivity was responsible for maintaining the same behavior of the four evaluated estimations. The NSE revealed that only the Wischmeier and Smith [14] and Bouyoucos [38] equations provided acceptable results due to their range, which also agreed with the observations. However, it is important to make clear that the methods used to estimating soil erodibility should have an extensive performance evaluation along the country, because of environmental diversity found in Brazil.
3.4. Average Annual Soil Loss and Sediment Yield
The results of the USLE factors multiplication that constitute the gross erosion considering the best predictions for the K-factor (Figure 6A) and the average R-factor obtained with more than 20 years of rainfall data are shown in Figure 4A. The K-factor map represents the soil variability given by the seven soil classes found in the catchment. We found an average soil loss and standard deviation in the catchment of 12.08 Mg ha−1 yr−1 and 62.60 Mg ha−1 yr−1, respectively. This high standard deviation can be explained by the high range of the LS-factor, which has values up to 73.5. Similar results have been observed in the study developed by Oliveira, Alves Sobrinho, Rodrigues and Panachuki [2]. We noted the greatest values of soil loss in the northern catchment due to mainly the topography and land use. Overall, the parts of the catchment far from the channels present great resistance to soil loss, with small values for the K-factor.
Using the average gross erosion generated with the USLE (Figure 6A) and the SDR map (Figure 6B), we obtained the spatial distribution of the sediment yield in the catchment (Figure 6C). Each cell reproduces its contribution to the total sediment, which is delivered in the catchment outlet. The total sediment delivery of the drainage area was 166.93 Mg yr−1 (equivalent to 0.006 Mg ha−1 yr−1). Both the soil loss and the sediment yield maps show the influence of the LS-factor. However, the presence of roads and bare soil areas can also be noted.
In spite of the relatively short period of observations to evaluate the model’s performance, the USLE-SDR distributed approach in a small catchment provides the specific rates for soil loss and sediment yield. For larger areas, distributed approaches are capable of analyzing sediment yields in Brazilian watersheds, where limited input data is available [6]. Likewise, after the integration of the sediment yield map, it represents the average total amount of sediment that may reach the catchment’s outlet in accordance with observed data. Therefore, these results contributed to assess the validity of the USLE-SDR distributed approach to estimate soil loss and sediment yield in small catchments in a tropical country applying pedotransfer equations to obtain the K-factor.
5. Conclusions
In this study, we assessed the performance of different methods to estimate soil erodibility by comparing the sediment yield (SY) observed in the catchment outlet with the estimated SY calculated using the USLE-SDR approach with the K-factor estimates. K-factor values were obtained from three widely used empirical equations developed by Renard, Foster, Weesies, Mccool and Yoder [15], Wischmeier and Smith (1978) and Bouyoucos (1935); and using a portable rainfall simulator.
We found that the K-factor most suitable to estimate soil loss and sediment yield in the studied area was obtained from the Wischmeier and Smith [14] and Bouyoucos [38] methods. Both methods present a percent bias smaller than 50% and acceptable efficiencies and good correlation indexes. Our results also showed that the use of a portable rainfall simulator to estimate the K-factor tend to underestimate soil loss and sediment delivery predictions, and its performance is near satisfactory, being an alternative for data scarce environments. However, studies in other catchments and using longer periods of observations are required to achieve better assumptions concerning the method evaluated in this study.
We found the average simulated soil loss and the estimated total sediment delivery in the catchment of 12.08 Mg ha−1 yr−1 and 166.93 Mg yr−1 (equivalent to 0.006 Mg ha−1 yr−1), respectively. Furthermore, the SDR value represents approximately 5% of the gross soil loss in the studied catchment. Hence, these acceptable estimates represent an advance in soil science and hydrology in Brazil and tropical areas, since we found that the USLE-SDR distributed approach may be applied to small watersheds using pedotransfer functions to estimate the K-factor.
Author Contributions
Conceptualization, V.S.M. and M.B.C.; Formal analysis, J.A.A.A. and P.T.S.O.; Funding acquisition, M.B.C., D.F.C. and P.T.S.O.; Investigation, V.S.M. and M.A.H.A.; Methodology, M.A.H.A.; Project administration, V.S.M. and D.F.C.; Resources, D.F.C.; Supervision, D.F.C.; Visualization, D.B.B.R. and P.T.S.O.; Writing—original draft, V.S.M., J.A.A.A., D.B.B.R. and P.T.S.O.; Writing—review & editing, J.A.A.A. and P.T.S.O.
Funding
This study was supported by grants from the Ministry of Science, Technology, Innovation and Communication—MCTIC and National Council for Scientific and Technological Development—CNPq (grants 441289/2017-7 and 306830/2017-5), and by the Coordination of Improvement of Higher Education Personnel—CAPES—Brazilian Federal Government, grant number “finance code 001”.
Acknowledgments
The authors thank the Federal Rural University of Rio de Janeiro (UFRRJ) and the Federal Institute of Goiás at Ceres, both for the institutional support.
Conflicts of Interest
The authors declare no conflict of interest. The funders had no role in the design of the study; in the collection, analyses, or interpretation of data; in the writing of the manuscript, or in the decision to publish the results
References
- Galdino, S.; Sano, E.E.; Andrade, R.G.; Grego, C.R.; Nogueira, S.F.; Bragantini, C.; Flosi, A.H. Large-scale Modeling of Soil Erosion with RUSLE for Conservationist Planning of Degraded Cultivated Brazilian Pastures. Land Degrad. Dev. 2016, 27, 773–784. [Google Scholar] [CrossRef]
- Oliveira, P.T.S.; Alves Sobrinho, T.; Rodrigues, D.B.B.; Panachuki, E. Erosion Risk Mapping Applied to Environmental Zoning. Water Resour. Manag. 2011, 25, 1021–1036. [Google Scholar] [CrossRef]
- Walling, D.E. The Sediment Delivery Problem. J. Hydrol. 1983, 65. [Google Scholar] [CrossRef]
- De Vente, J.; Poesen, J.; Verstraeten, G.; Rompaey, A.V.; Govers, G. Spatially distributed modelling of soil erosion and sediment yield at regional scales in Spain. Glob. Planet. Chang. 2008, 60, 393–415. [Google Scholar] [CrossRef] [Green Version]
- Alatorre, L.C.; Beguería, S.; Lana-Renault, N.; Navas, A.; García-Ruiz, J.M. Soil erosion and sediment delivery in a mountain catchment under scenarios of land use change using a spatially distributed numerical model. Hydrol. Earth Syst. Sci. 2012, 16, 1321–1334. [Google Scholar] [CrossRef] [Green Version]
- Batista, P.V.G.; Silva, M.L.N.; Silva, B.P.C.; Curi, N.; Bueno, I.T.; Acérbi Júnior, F.W.; Davies, J.; Quinton, J. Modelling spatially distributed soil losses and sediment yield in the upper Grande River Basin—Brazil. Catena 2017, 157, 139–150. [Google Scholar] [CrossRef]
- Didoné, E.J.; Minella, J.P.G.; Merten, G.H. Quantifying soil erosion and sediment yield in a catchment in southern Brazil and implications for land conservation. J. Soils Sediments 2015, 15, 2334–2346. [Google Scholar] [CrossRef]
- Ferro, V.; Minacapilli, M. Sediment delivery processes at basin scale. Hydrol. Sci. J. 1995, 40, 703–717. [Google Scholar] [CrossRef] [Green Version]
- Fryirs, K. (Dis)Connectivity in catchment sediment cascades: A fresh look at the sediment delivery problem. Earth Surf. Process. Landf. 2013, 38, 30–46. [Google Scholar] [CrossRef]
- Jain, M.K.; Kothyari, U.C. Estimation of soil erosion and sediment yield using GIS. Hydrol. Sci. J. 2000, 45, 771–786. [Google Scholar] [CrossRef] [Green Version]
- Lee, G.L.; Lee, K.H. Determining the Sediment Delivery Ratio Using the Sediment-Rating Curve and a Geographic Information System–Embedded Soil Erosion Model on a Basin Scale. J. Hydrol. Eng. 2010, 15, 834–843. [Google Scholar] [CrossRef]
- Lin, C.Y.; Lin, W.T.; Chou, W.C. Soil erosion prediction and sediment yield estimation: The Taiwan experience. Soil Tillage Res. 2002, 68, 143–152. [Google Scholar] [CrossRef]
- Lu, H.; Moran, C.J.; Prosser, I.P. Modelling sediment delivery ratio over the Murray Darling Basin. Environ. Model. Softw. 2006, 21, 1297–1308. [Google Scholar] [CrossRef]
- Wischmeier, W.H.; Smith, D.D. Predicting Rainfall Erosion Losses. A Guide to Conservation Planning. In USDA Agriculture Handbook; USDA, Science and Education Administration: Hyattsville, MD, USA, 1978; Volume 537. [Google Scholar]
- Renard, K.G.; Foster, G.R.; Weesies, G.A.; Mccool, D.K.; Yoder, D.C. Predicting soil erosion by water: A guide to conservation planning with the revised universal soil loss equation (RUSLE). In USDA Agriculture Handbook; USDA, Science and Education Administration: Hyattsville, MD, USA, 1997; Volume 703. [Google Scholar]
- Anache, J.A.A.; Wendland, E.C.; Oliveira, P.T.S.; Flanagan, D.C.; Nearing, M.A. Runoff and soil erosion plot-scale studies under natural rainfall: A meta-analysis of the Brazilian experience. CATENA 2017, 152, 29–39. [Google Scholar] [CrossRef]
- Anache, J.A.A.; Flanagan, D.C.; Srivastava, A.; Wendland, E.C. Land use and climate change impacts on runoff and soil erosion at the hillslope scale in the Brazilian Cerrado. Sci. Total Environ. 2018, 622–623, 140–151. [Google Scholar] [CrossRef] [PubMed]
- Couto, A.A.; Da Conceição, F.T.; Fernandes, A.M.; Spatti, E.P.; Lupinacci, C.M.; Moruzzi, R.B. Land use changes associated with the expansion of sugar cane crops and their influences on soil removal in a tropical watershed in São Paulo State (Brazil). Catena 2019, 172, 313–323. [Google Scholar] [CrossRef]
- Gomes, L.; Simões, S.; Dalla Nora, E.; De Sousa-Neto, E.; Forti, M.; Ometto, J. Agricultural Expansion in the Brazilian Cerrado: Increased Soil and Nutrient Losses and Decreased Agricultural Productivity. Land 2019, 8, 12. [Google Scholar] [CrossRef]
- Borrelli, P.; Robinson, D.A.; Fleischer, L.R.; Lugato, E.; Ballabio, C.; Alewell, C.; Meusburger, K.; Modugno, S.; Schutt, B.; Ferro, V.; et al. An assessment of the global impact of 21st century land use change on soil erosion. Nat. Commun. 2017, 8, 2013. [Google Scholar] [CrossRef] [PubMed] [Green Version]
- Panagos, P.; Borrelli, P.; Meusburger, K.; Yu, B.; Klik, A.; Jae Lim, K.; Yang, J.E.; Ni, J.; Miao, C.; Chattopadhyay, N.; et al. Global rainfall erosivity assessment based on high-temporal resolution rainfall records. Sci. Rep. 2017, 7, 4175. [Google Scholar] [CrossRef]
- Kinnell, P.I.A. A comparison of the abilities of the USLE-M, RUSLE2 and WEPP to model event erosion from bare fallow areas. Sci. Total Environ. 2017, 596-597, 32–42. [Google Scholar] [CrossRef]
- Nearing, M.A.; Romkens, M.J.M.; Norton, L.D.; Stott, D.E.; Rhoton, F.E.; Laflen, J.M.; Flanagan, D.C.; Alonso, C.V.; Binger, R.L.; Dabney, S.M.; et al. Measurements and Models of Soil Loss Rates. Science 2000, 290, 1300–1301. [Google Scholar] [CrossRef]
- Lin, B.-S.; Chen, C.-K.; Thomas, K.; Hsu, C.-K.; Ho, H.-C. Improvement of the K-Factor of USLE and Soil Erosion Estimation in Shihmen Reservoir Watershed. Sustainability 2019, 11, 355. [Google Scholar] [CrossRef]
- Bertoni, J.; Lombardi Neto, F. Conservação do Solo, 5th ed.; Ícone: São Paulo, Brazil, 2005; p. 355. [Google Scholar]
- Borselli, L.; Torri, D.; Poesen, J.; Iaquinta, P. A robust algorithm for estimating soil erodibility in different climates. Catena 2012, 97, 85–94. [Google Scholar] [CrossRef]
- Dumas, J. Relation entre l’érodibilité des sols et leurs caractéristiques analytiques. Cahiers Orstom Série Pédologie Bondy 1965, 3, 307–333. [Google Scholar]
- El-Swaify, S.A.; Dangler, E.W. Erodibilities of selected tropical soils in relation to structural and hydrologic parameters. In Proceedings of the National Conference on Soil Erosion, West Lafayette, Indiana, 24–26 May 1976; pp. 105–110. [Google Scholar]
- Middleton, H.E. Properties of Soils which Influence Soil Erosion; USDA Technical Bulletin; United States Department of Agriculture: Washington, DC, USA, 1930; Volume 178. [Google Scholar]
- Römkens, M.J.M.; Roth, C.B.; Nelson, D.W. Erodibility of selected clay subsoils in relation to physical and chemical properties. Soil Sci. Soc. Am. 1977, 41, 954–960. [Google Scholar] [CrossRef]
- Roth, C.B.; Nelson, D.W.; Römkens, M.J. Prediction of Subsoil Erodibility Using Chemical, Mineralogical and Physical Parameters; United States Government Publishing Office: Washington, DC, USA, 1974. [Google Scholar]
- Stavi, I.; Lal, R. Variability of soil physical quality and erodibility in a water-eroded cropland. Catena 2011, 84, 148–155. [Google Scholar] [CrossRef]
- Wischmeier, W.H.; Johnson, C.B.; Cross, B.V. A soil erodibility nomograph for farmland and constrution sites. J. Soil Water Conserv. 1971, 26, 189–193. [Google Scholar]
- Wischmeier, W.H.; Mannering, J.V. Relation of soil properties to its erodibility. Soil Sci. Soc. Am. 1969, 33, 131–137. [Google Scholar] [CrossRef]
- Young, R.A.; Mutchler, C.K. Erodibility of some Minnesota soils. J. Soil Water Conserv. 1977, 32, 180–182. [Google Scholar]
- Burt, T.P.; Mcdonnell, J.J. Whither field hydrology? The need for discovery science and outrageous hydrological hypotheses. Water Resour. Res. 2015, 51, 5919–5928. [Google Scholar] [CrossRef] [Green Version]
- Swarnkar, S.; Malini, A.; Tripathi, S.; Sinha, R. Assessment of uncertainties in soil erosion and sediment yield estimates at ungauged basins: An application to the Garra River basin, India. Hydrol. Earth Syst. Sci. 2018, 22, 2471–2485. [Google Scholar] [CrossRef]
- Bouyoucos, G.J. The clay ratio as a criterion of susceptibility of soils to erosion. J. Am. Soc. Agron. 1935, 27, 738–741. [Google Scholar] [CrossRef]
- Embrapa/Cnps. Sistema Brasileiro de Classificação de Solos; Embrapa Produção de Informação/Rio de Janeiro: EMBRAPA Solo: Brasília, Brazil, 1999. [Google Scholar]
- Carvalho, N.O. Hidrossedimentologia Prática; Editora Interciência: Rio de Janeiro, Brazil, 2008. [Google Scholar]
- Trindade, A.L.F.; Oliveira, P.T.S.; Anache, J.A.A.; Wendland, E. Variabilidade espacial da erosividade das chuvas no Brasil. Pesquisa Agropecuária Brasileira, 2016, 51, 1918–1928. [Google Scholar] [CrossRef]
- Alves Sobrinho, T.; Gómez, J.A.; Macpherson, H.G. A portable rainfall and overland flow simulator. Soil Use Manag. 2008, 24, 163–170. [Google Scholar] [CrossRef]
- Foster, G.R.; Meyer, L.D.; Onstad, C.A. A runoff erosivity factor and variable slope length exponents for soil loss estimates. Trans. ASAE 1977, 20, 683–687. [Google Scholar] [CrossRef]
- Mccool, D.K.; Brown, L.C.; Foster, G.R.; Mutchler, C.K.; Meyer, L.D. Revised slope steepness factor for the Universal Soil Loss Equation. Trans. ASAE 1987, 30, 1387–1396. [Google Scholar] [CrossRef]
- Gómez, J.A.; Nearing, M.A. Runoff and sediment losses from rough and smooth soil surfaces in a laboratory experiment. Catena 2005, 59, 253–266. [Google Scholar] [CrossRef]
- Chiu, Y.-J.; Lee, H.-Y.; Wang, T.-L.; Yu, J.; Lin, Y.-T.; Yuan, Y. Modeling Sediment Yields and Stream Stability Due to Sediment-Related Disaster in Shihmen Reservoir Watershed in Taiwan. Water 2019, 11, 332. [Google Scholar] [CrossRef]
- Chou, W.-C. Modelling Watershed Scale Soil Loss Prediction and Sediment Yield Estimation. Water Resour. Manag. 2010, 24, 2075–2090. [Google Scholar] [CrossRef]
- Moriasi, D.N.; Arnold, J.G.; Van Liew, M.W.; Bingner, R.L.; Harmel, R.D.; Veith, T.L. Model Evaluation Guidelines for Systematic Quantification of Accuracy in Watershed Simulations. Trans. ASABE 2007, 50. [Google Scholar] [CrossRef]
- Nash, J.E.; Sutcliffe, J.V. River flow forecasting through conceptual models Part I—A discussion of principles. J. Hydrol. 1970, 10, 282–290. [Google Scholar] [CrossRef]
- Sorooshian, S.; Duan, Q.; Gupta, V.K. Calibration of rainfall-runoff models: Application of global optimization to the Sacramento Soil Moisture Accounting Model. Water Resour. Res. 1993, 29, 1185–1194. [Google Scholar] [CrossRef]
- Willmott, C.J.; Matsuura, K. On the use of dimensioned measures of error to evaluate the performance of spatial interpolators. Int. J. Geogr. Inf. Sci. 2006, 20, 89–102. [Google Scholar] [CrossRef]
- Almagro, A.; Oliveira, P.T.S.; Nearing, M.A.; Hagemann, S. Projected climate change impacts in rainfall erosivity over Brazil. Sci. Rep. 2017, 7. [Google Scholar] [CrossRef]
- Risse, L.M.; Nearing, M.A.; Laflen, J.M.; Nicks, A.D. Error Assessment in the Universal Soil Loss Equation. Soil Sci. Soc. Am. J. 1993, 57, 825–833. [Google Scholar] [CrossRef]
- Oliveira, P.T.S.; Nearing, M.A.; Wendland, E. Orders of magnitude increase in soil erosion associated with land use change from native to cultivated vegetation in a Brazilian savannah environment. Earth Surf. Process. Landf. 2015, 40, 1524–1532. [Google Scholar] [CrossRef]
- Montgomery, D.R. Soil erosion and agricultural sustainability. Proc. Natl. Acad. Sci. USA 2007, 104, 13268–13272. [Google Scholar] [CrossRef] [PubMed] [Green Version]
- Duraes, M.F.; Mello, C.R.; Beskow, S. Sediment yield in Paraopeba River Basin—MG, Brazil. Int. J. River Basin Manag. 2016, 14, 367–377. [Google Scholar] [CrossRef]
- Colman, C.B.; Garcia, K.M.P.; Pereira, R.B.; Shinma, E.A.; Lima, F.E.; Gomes, A.O.; Oliveira, P.T.S. Different approaches to estimate the sediment yield in a tropical watershed. Rbrh 2018, 23. [Google Scholar] [CrossRef]
- Benavidez, R.; Jackson, B.; Maxwell, D.; Norton, K. A review of the (Revised) Universal Soil Loss Equation ((R)USLE): With a view to increasing its global applicability and improving soil loss estimates. Hydrol. Earth Syst. Sci. 2018, 22, 6059–6086. [Google Scholar] [CrossRef]
- Buttafuoco, G.; Conforti, M.; Aucelli, P.P.C.; Robustelli, G.; Scarciglia, F. Assessing spatial uncertainty in mapping soil erodibility factor using geostatistical stochastic simulation. Environ.Earth Sci. 2011, 66, 1111–1125. [Google Scholar] [CrossRef]
- Avalos, F.a.P.; Silva, M.L.N.; Batista, P.V.G.; Pontes, L.M.; De Oliveira, M.S. Digital soil erodibility mapping by soilscape trending and kriging. Land Degrad. Dev. 2018, 29, 3021–3028. [Google Scholar] [CrossRef]
- Wang, G.; Gertner, G.; Liu, X.; Anderson, A. Uncertainty assessment of soil erodibility factor for revised universal soil loss equation. CATENA 2001, 46, 1–14. [Google Scholar] [CrossRef]
- Torri, D.; Poesen, J.; Borselli, L. Predictability and uncertainty of the soil erodibility factor using a global dataset. CATENA 1997, 31, 1–22. [Google Scholar] [CrossRef]
- Parysow, P.; Wang, G.; Gertner, G.; Anderson, A.B. Spatial uncertainty analysis for mapping soil erodibility based on joint sequential simulation. CATENA 2003, 53, 65–78. [Google Scholar] [CrossRef]
- Anache, J.A.A.; Bacchi, C.G.V.; Panachuki, E.; Alves Sobrinho, T. Assessment of methods for predicting soil erodibility in soil loss modeling. Geociências 2015, 34, 32–40. [Google Scholar]
- Singh, M.J.; Khera, K.L. Nomographic estimation and evaluation of soil erodibility under simulated and natural rainfall conditions. Land Degrad. Dev. 2009, 20, 471–480. [Google Scholar] [CrossRef]
- Dawdy, D.R.; Lichty, R.W.; Bergmann, J.M. A Rainfall-Runoff Simulation Model for Estimation of Flood Peaks for Small Drainage Basins. In Synthesis in Hydrology; Geological Survey Professional: Washington, DC, USA, 1972; Volume 2042. [Google Scholar]
- Sheridan, G.J.; Noske, P.J.; Lane, P.N.J.; Sherwin, C.B. Using rainfall simulation and site measurements to predict annual interrill erodibility and phosphorus generations rates from unsealed forest roads: Validation against in-situ erosion measurements. Catena 2008, 73, 49–62. [Google Scholar] [CrossRef]
- Sadeghi, S.H.R.; Bashari Seghaleh, M.; Rangavar, A.S. Plot sizes dependency of runoff and sediment yield estimates from a small watershed. Catena 2013, 102, 55–61. [Google Scholar] [CrossRef]
- Munn, J.R.; Huntington, G.L. A Portable Rainfall Simulator for Erodibility and Infiltration Measurements on Rugged Terrain1. Soil Sci. Soc. Am. J. 1976, 40, 622–624. [Google Scholar] [CrossRef]
Figure 1.
Location and Digital Elevation Model (DEM) (A), soil taxonomy (NVe: Alfisols; LVe and LVd: Oxisols; CXbe: Cambisols; GXbe: Gleysol) (B), land use (C) of Córrego Água Azul catchment in Ceres, Goiás, Brazil.
Figure 1.
Location and Digital Elevation Model (DEM) (A), soil taxonomy (NVe: Alfisols; LVe and LVd: Oxisols; CXbe: Cambisols; GXbe: Gleysol) (B), land use (C) of Córrego Água Azul catchment in Ceres, Goiás, Brazil.
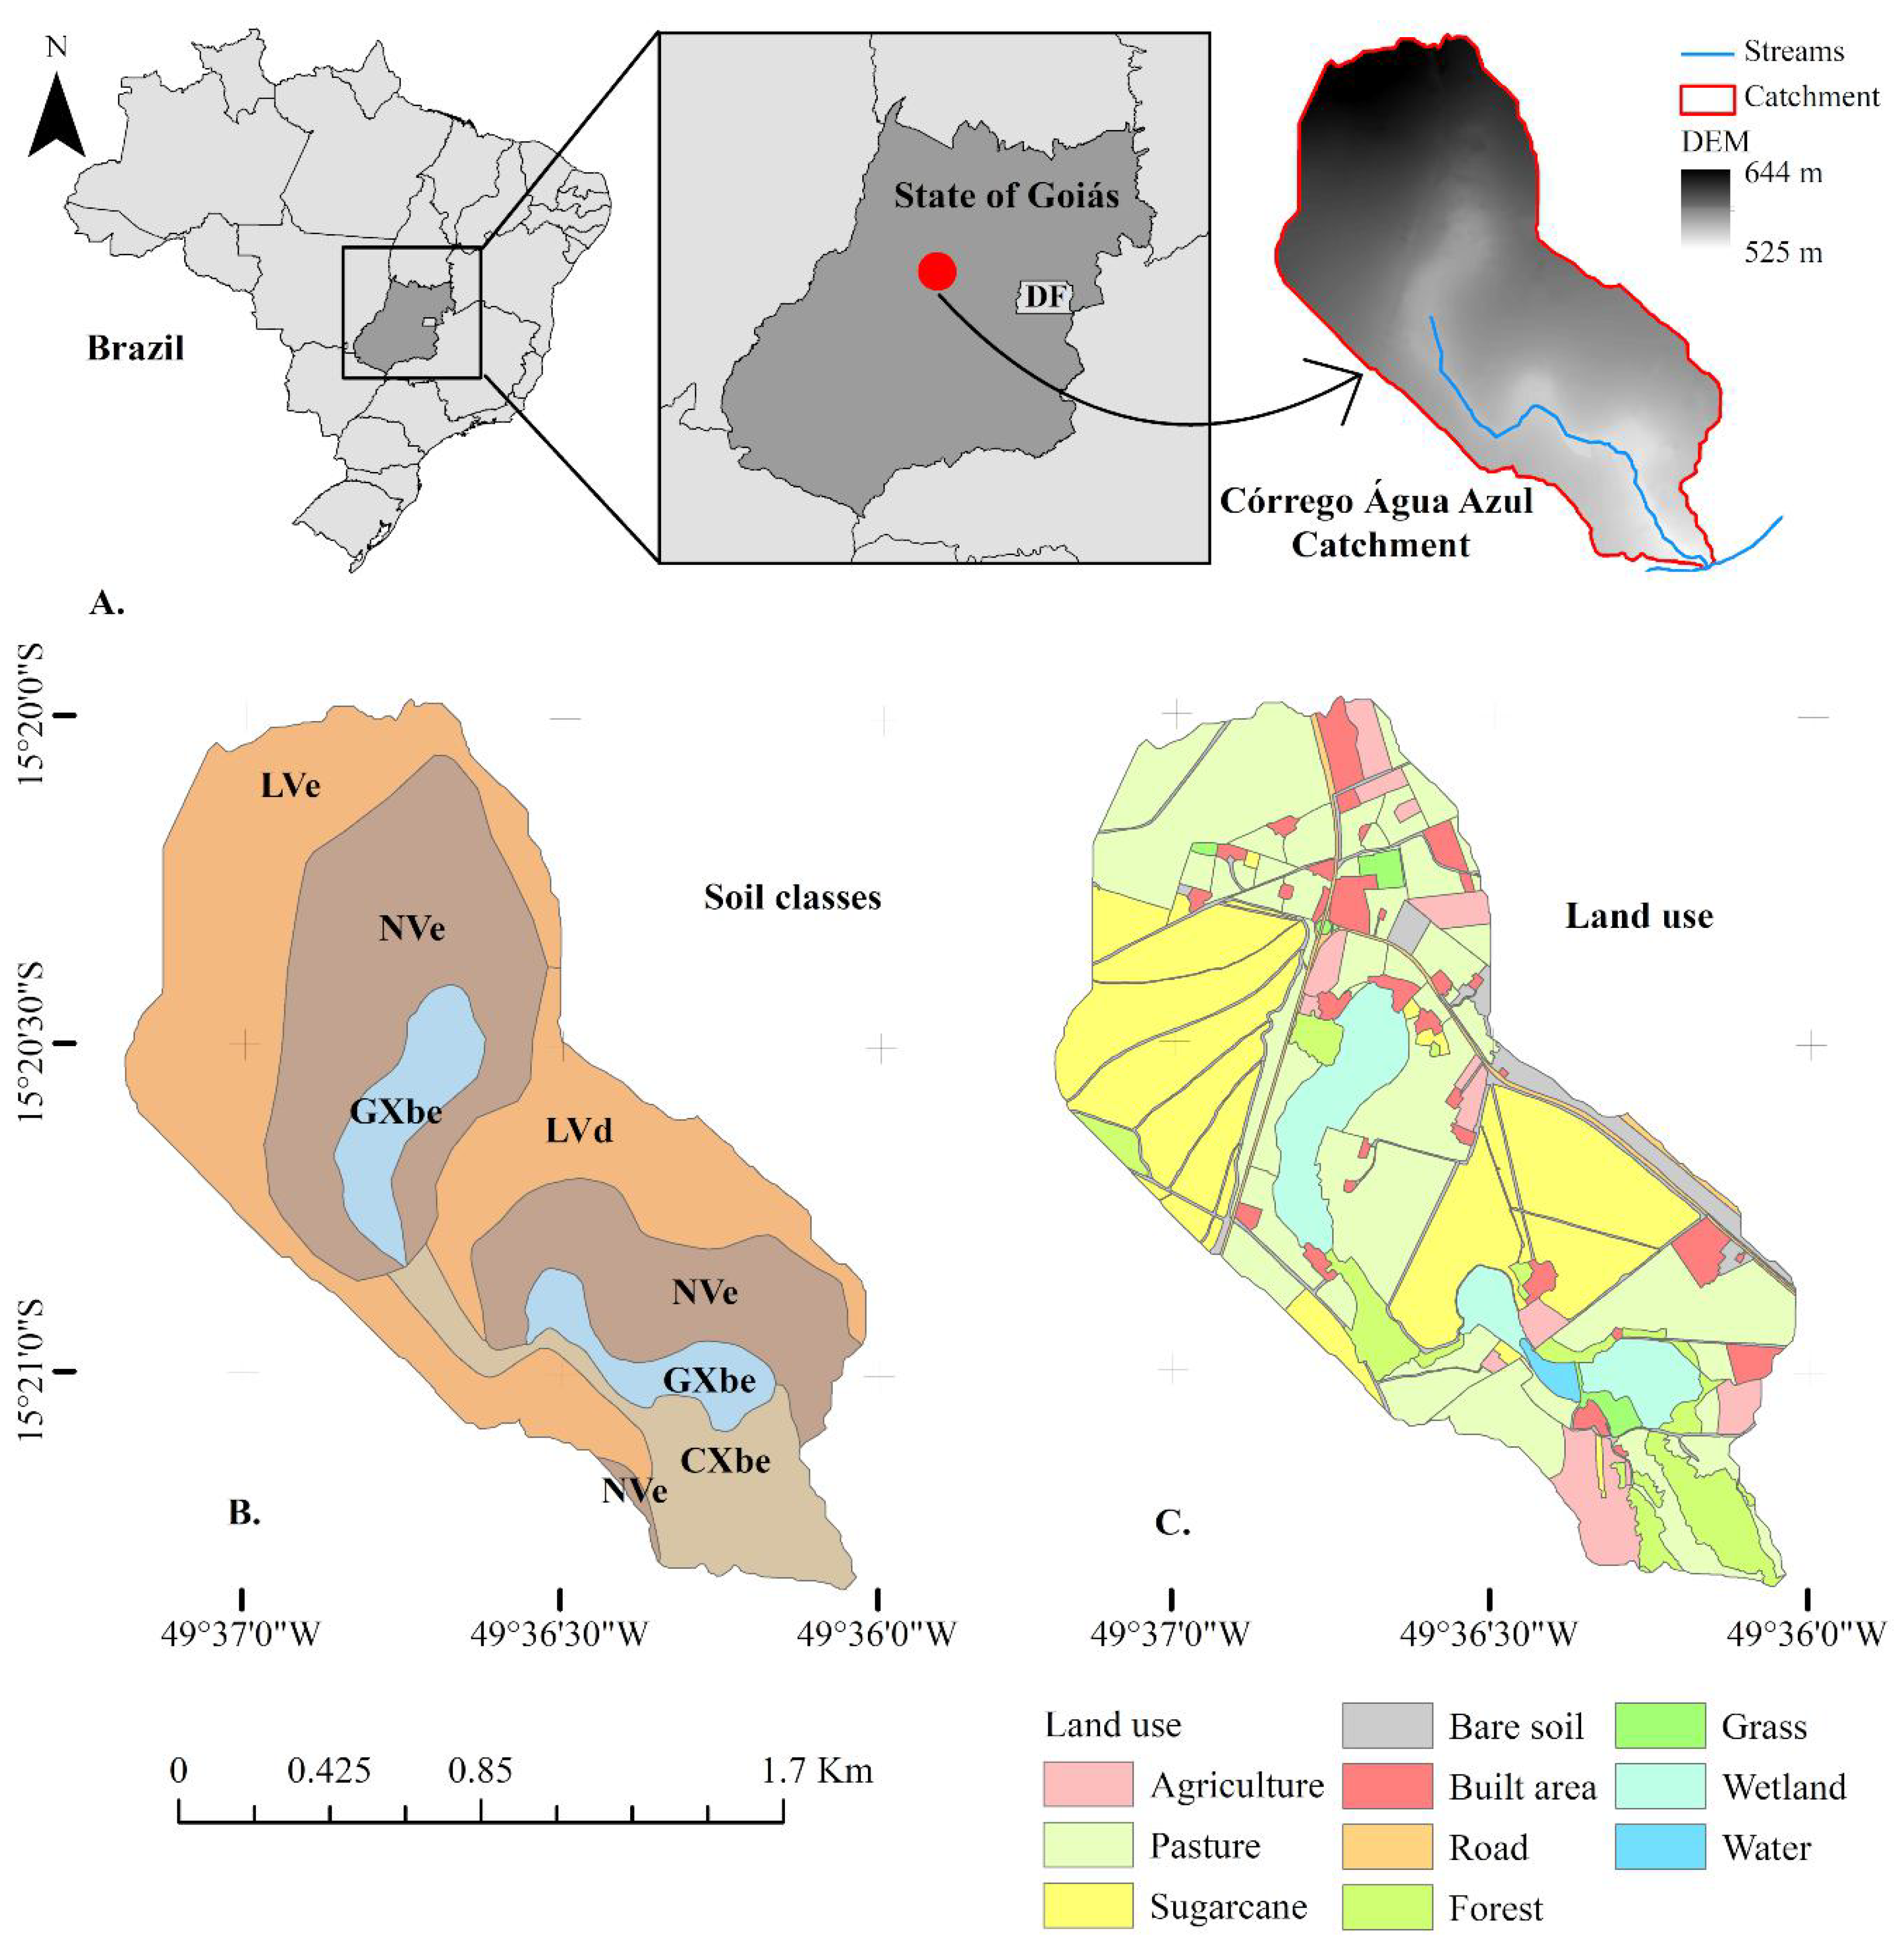
Figure 2.
Flow measurement system located in the catchment’s outlet during the dry (A) and wet (B) seasons; tests performed with simulated rainfall for soil erodibility (K-factor) estimation: (C) rainfall simulator, and (D) experimental plot.
Figure 2.
Flow measurement system located in the catchment’s outlet during the dry (A) and wet (B) seasons; tests performed with simulated rainfall for soil erodibility (K-factor) estimation: (C) rainfall simulator, and (D) experimental plot.

Figure 3.
Workflow chart containing the steps performed for soil erosion and sediment yield modeling.
Figure 3.
Workflow chart containing the steps performed for soil erosion and sediment yield modeling.

Figure 4.
Monthly averages and monitored rates for 2010/2011 of rainfall (lines) and EI30 index (bars) distribution along the study period (A); sediment yield in the Córrego Água Azul catchment predicted by SDR-USLE using direct and indirect methods of K-factor; values measured in the outlet (primary axes); and observed rainfall in the study area during the monitoring period (secondary axes) (B).

Figure 5.
Distributed values in Córrego Água Azul catchment for the USLE components, including the best estimates for the K-factor [14] (A); LS-factor (B); C-factor (C); and P-factor (D).
Figure 5.
Distributed values in Córrego Água Azul catchment for the USLE components, including the best estimates for the K-factor [14] (A); LS-factor (B); C-factor (C); and P-factor (D).

Figure 6.
Spatial distributions in the Córrego Água Azul catchment of the predicted soil loss using USLE (A); the SDR calculated for each cell (B), and the modelled sediment yield (C).
Figure 6.
Spatial distributions in the Córrego Água Azul catchment of the predicted soil loss using USLE (A); the SDR calculated for each cell (B), and the modelled sediment yield (C).


Table 1.
Soil physical and chemical attributes of the A horizon (superficial layer).
| Soil Class | CS (a) | FS (b) | Silt | Clay | OC (c) | OM (d) | M (e) | s (f) | p (g) |
|---|---|---|---|---|---|---|---|---|---|
| NVe (1) | 9.7 | 14.8 | 11.3 | 64.3 | 1.1 | 2.0 | 933.1 | 3.0 | 4.0 |
| NVe (2) | 12.3 | 14.7 | 21.5 | 51.5 | 3.8 | 6.6 | 1751.5 | 3.0 | 4.0 |
| NVe (3) | 19.2 | 19.9 | 11.5 | 49.5 | 0.6 | 1.0 | 1583.2 | 3.0 | 4.0 |
| LVe (4) | 14.2 | 13.1 | 21.1 | 51.7 | 2.9 | 4.9 | 1651.2 | 1.0 | 4.0 |
| LVd (5) | 11.2 | 19.7 | 14.1 | 55.0 | 2.0 | 3.5 | 1521.0 | 1.0 | 3.0 |
| CXbe (6) | 11.3 | 29.0 | 18.4 | 41.4 | 0.4 | 0.7 | 2777.1 | 2.0 | 4.0 |
| GXbe (7) | 12.1 | 21.0 | 20.5 | 46.4 | 1.9 | 3.3 | 2224.4 | 3.0 | 4.0 |
(1) Alfisol (nitossolo vermelho eutrófico chernossólico); (2) Alfisol (nitossolo vermelho eutrófico latossólico); (3) Alfisol (nitossolo vermelho eutrófico latossólico); (4) Oxisol (latossolo vermelho eutrófico típico muito profundo); (5) Oxisol (latossolo vermelho distrófico típico muito profundo); (6) Cambisol (cambissolo háplico Tb Eutrófico típico); (7) Gleysol (Gleissolo Háplico Tb Eutrófico típico). (a) CS—coarse sand; (b) FS—fine sand; (c) OC—organic carbon; (d) OM—organic matter; (e) M—parameter representing soil texture, dimensionless; (f) s—texture classes; (g) p—permeability classes.
Table 2.
K-factor values in the Córrego Água Azul catchment, determined by three indirect methods and by one direct method using rainfall simulator.
Table 2.
K-factor values in the Córrego Água Azul catchment, determined by three indirect methods and by one direct method using rainfall simulator.
| Soil Class | K-Factor (Mg ha h ha−1 MJ−1 mm−1) | Area | ||||
|---|---|---|---|---|---|---|
| Bouyoucos [38] | Wischmeier and Smith [14] | Renard, Foster, Weesies, Mccool and Yoder [15] | Rainfall Simulator [42] | (ha) | % | |
| NVe (1) | 0.006 | 0.014 | 0.045 | 0.021 | 36.2 | 13.4 |
| NVe (2) | 0.009 | 0.015 | 0.046 | 0.021 | 63.7 | 23.7 |
| NVe (3) | 0.010 | 0.021 | 0.048 | 0.021 | 1.0 | 0.4 |
| LVe (4) | 0.009 | 0.008 | 0.046 | 0.003 | 78.9 | 29.3 |
| LVd (5) | 0.008 | 0.006 | 0.046 | 0.002 | 36.3 | 13.5 |
| CXbe (6) | 0.014 | 0.030 | 0.049 | - | 28.6 | 10.6 |
| GXbe (7) | 0.012 | 0.023 | 0.047 | - | 24.2 | 9.0 |
(1) Alfisol (nitossolo vermelho eutrófico chernossólico); (2) Alfisol (nitossolo vermelho eutrófico latossólico); (3) Alfisol (nitossolo vermelho eutrófico latossólico); (4) Oxisol (latossolo vermelho eutrófico típico muito profundo); (5) Oxisol (latossolo vermelho distrófico típico muito profundo); (6) Cambisol (cambissolo háplico Tb Eutrófico típico); (7) Gleysol (Gleissolo Háplico Tb Eutrófico típico); (-) no rainfall simulations were performed on these soil classes.
Table 3.
K-factor estimation methods performance to predict the sediment yield (SY).
| K-Factor Method in SY Estimation | R2 | NSE | RMSE | PBIAS |
|---|---|---|---|---|
| Bouyoucos [38] | 0.72 | 0.52 | 8.96 | 43.91 |
| Wischmeier and Smith [14] | 0.72 | 0.71 | 6.88 | 16.71 |
| Renard, Foster, Weesies, Mccool and Yoder [15] | 0.72 | −3.17 | 26.28 | −176.73 |
| Rainfall Simulator [42] | 0.72 | 0.49 | 9.22 | 46.46 |
R2: coefficient of determination; NSE: Nash–Sutcliffe efficiency; RMSE: root mean square error; and PBIAS: percent bias.
© 2019 by the authors. Licensee MDPI, Basel, Switzerland. This article is an open access article distributed under the terms and conditions of the Creative Commons Attribution (CC BY) license (http://creativecommons.org/licenses/by/4.0/).
Share and Cite
MDPI and ACS Style
Marques, V.S.; Ceddia, M.B.; Antunes, M.A.H.; Carvalho, D.F.; Anache, J.A.A.; Rodrigues, D.B.B.; Oliveira, P.T.S. USLE K-Factor Method Selection for a Tropical Catchment. Sustainability 2019, 11, 1840. https://doi.org/10.3390/su11071840
AMA Style
Marques VS, Ceddia MB, Antunes MAH, Carvalho DF, Anache JAA, Rodrigues DBB, Oliveira PTS. USLE K-Factor Method Selection for a Tropical Catchment. Sustainability. 2019; 11(7):1840. https://doi.org/10.3390/su11071840
Chicago/Turabian StyleMarques, Valter S., Marcos B. Ceddia, Mauro A. H. Antunes, Daniel F. Carvalho, Jamil A. A. Anache, Dulce B. B. Rodrigues, and Paulo Tarso S. Oliveira. 2019. "USLE K-Factor Method Selection for a Tropical Catchment" Sustainability 11, no. 7: 1840. https://doi.org/10.3390/su11071840
Note that from the first issue of 2016, this journal uses article numbers instead of page numbers. See further details here.