The Environmental Effects of Urban Development in Hanoi, Vietnam from Satellite and Meteorological Observations from 1999–2016


Center for Space and Remote Sensing Research, National Central University, Taoyuan 32001, Taiwan
*
Author to whom correspondence should be addressed.
Sustainability 2019, 11(6), 1768; https://doi.org/10.3390/su11061768
Submission received: 4 March 2019
/
Revised: 12 March 2019
/
Accepted: 22 March 2019
/
Published: 23 March 2019
(This article belongs to the Section Sustainable Urban and Rural Development)
Abstract
:Since 1990 the Hanoi capital region (or Hanoi metropolitan area) in Vietnam has undergone rapid development, which has gone together with increasing socio-economic growth and prosperity. However, the environmental degradation that has accompanied urban development has raised considerable concern from the public in recent years. This research investigates the effects of urban development on urban sprawl, urban heat island (UHI), and metropolitan weather phenomena that are related to the quality of urban life in the period from 1999–2016. To achieve these objectives, remote sensing technologies were applied to satellite images at three time points (i.e., 1999, 2009, and 2016) that were associated with the meteorological dataset from ground-based stations. The spatial distribution evolution was examined for the land use/land cover changes while using the normalized difference vegetation index (NDVI) and normalized difference built-up index (NDBI). The increasing impact of urban sprawl on UHI intensity is determined based on the land surface temperature (LST) in multi-temporal forms. Increasing urbanization with the development of gradual outward and northward expansion from the city centre intensified the correlation analysis shows that the UHI. The potential formation of new UHI areas in the near future is also indicated. Furthermore, more than 30% of the metropolitan area is decaying in ecological quality according to an assessment of the urban thermal field variance index (UTFVI). With respect to metropolitan weather, the urbanization in Hanoi affected the observation of meteorological parameters revealed that the relative humidity, total rainfall, temperature, and wind speed over both urban and rural areas. The overall results imply that urban development and its environmental effects and impacts have imposed pressing issues and new challenges to sustainable development in the Hanoi metropolitan area.
1. Introduction
The world has recently experienced the most rapid pace of urbanization since the industrial revolution in the second half of the twentieth century, especially in developing countries [1]. Rapid urbanization has strongly promoted economic and social development, but many environmental issues have emerged as a consequence of this development [2,3]. The urban heat island (UHI) phenomenon is one of the major negative impacts of urbanization, which indicates a metropolitan core that has higher air temperature and land surface temperature (LST) than the surrounding rural area. The surface UHI (SUHI) and atmospheric UHI are two types of UHI [4]. Atmospheric UHI is observed based on air temperature and SUHI is observed based on LST [5]. Together with the urbanization process, the rapid spread of urban areas and changes in land use have led to significant and remarkable UHI phenomena [2]. Urbanization via the adjustment of natural surfaces and atmospheric conditions has an effect on local weather and climate systems, and UHI affects the quality of urban life through impacts on human health and ecosystem functions [6,7]. Thus, a top priority has been the identification and assessment of urbanization impacts, and recent research has been performed with a view towards a better understanding of the impacts and problems that are related to urbanization [2].
Hanoi, the capital of Vietnam, occupies an important geographical and political position. Since 1990, industrialization and modernization began to accelerate in Hanoi, creating a firm foundation for development in the 21st century. The city has achieved excellent results during this period, and the results in the field of economic development and modernization of urban infrastructure are most noteworthy. However, Hanoi also faces serious environmental problems. Issues that are related to urbanization in Hanoi are multi-faceted and many problems related to urban transition still require additional research [8]. The city has rapidly urbanized since the country adopted economic reforms that drove built-up land to exponentially expand, especially in the buffer zone between 10 and 35 km from the city centre [9]. The change in land use in Hanoi has increased the number of hotspots and also increased the average night air temperature in new urban areas by up to 1°C [10].
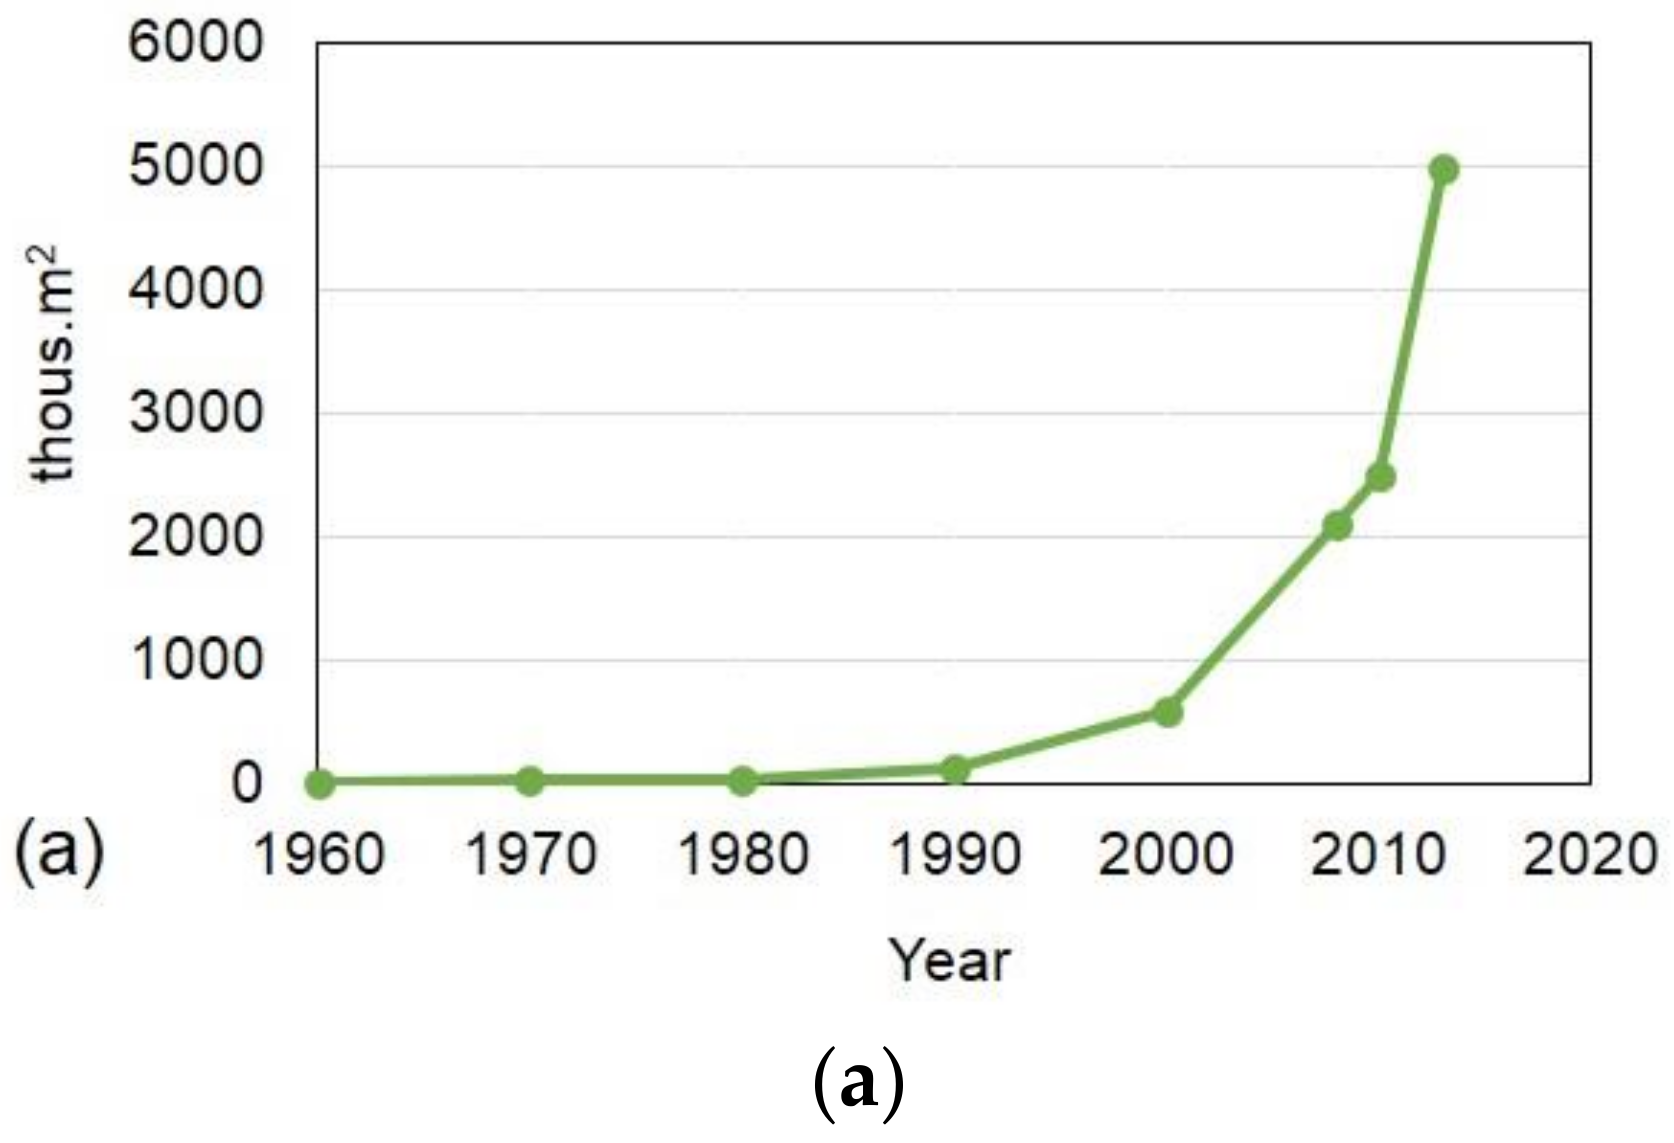
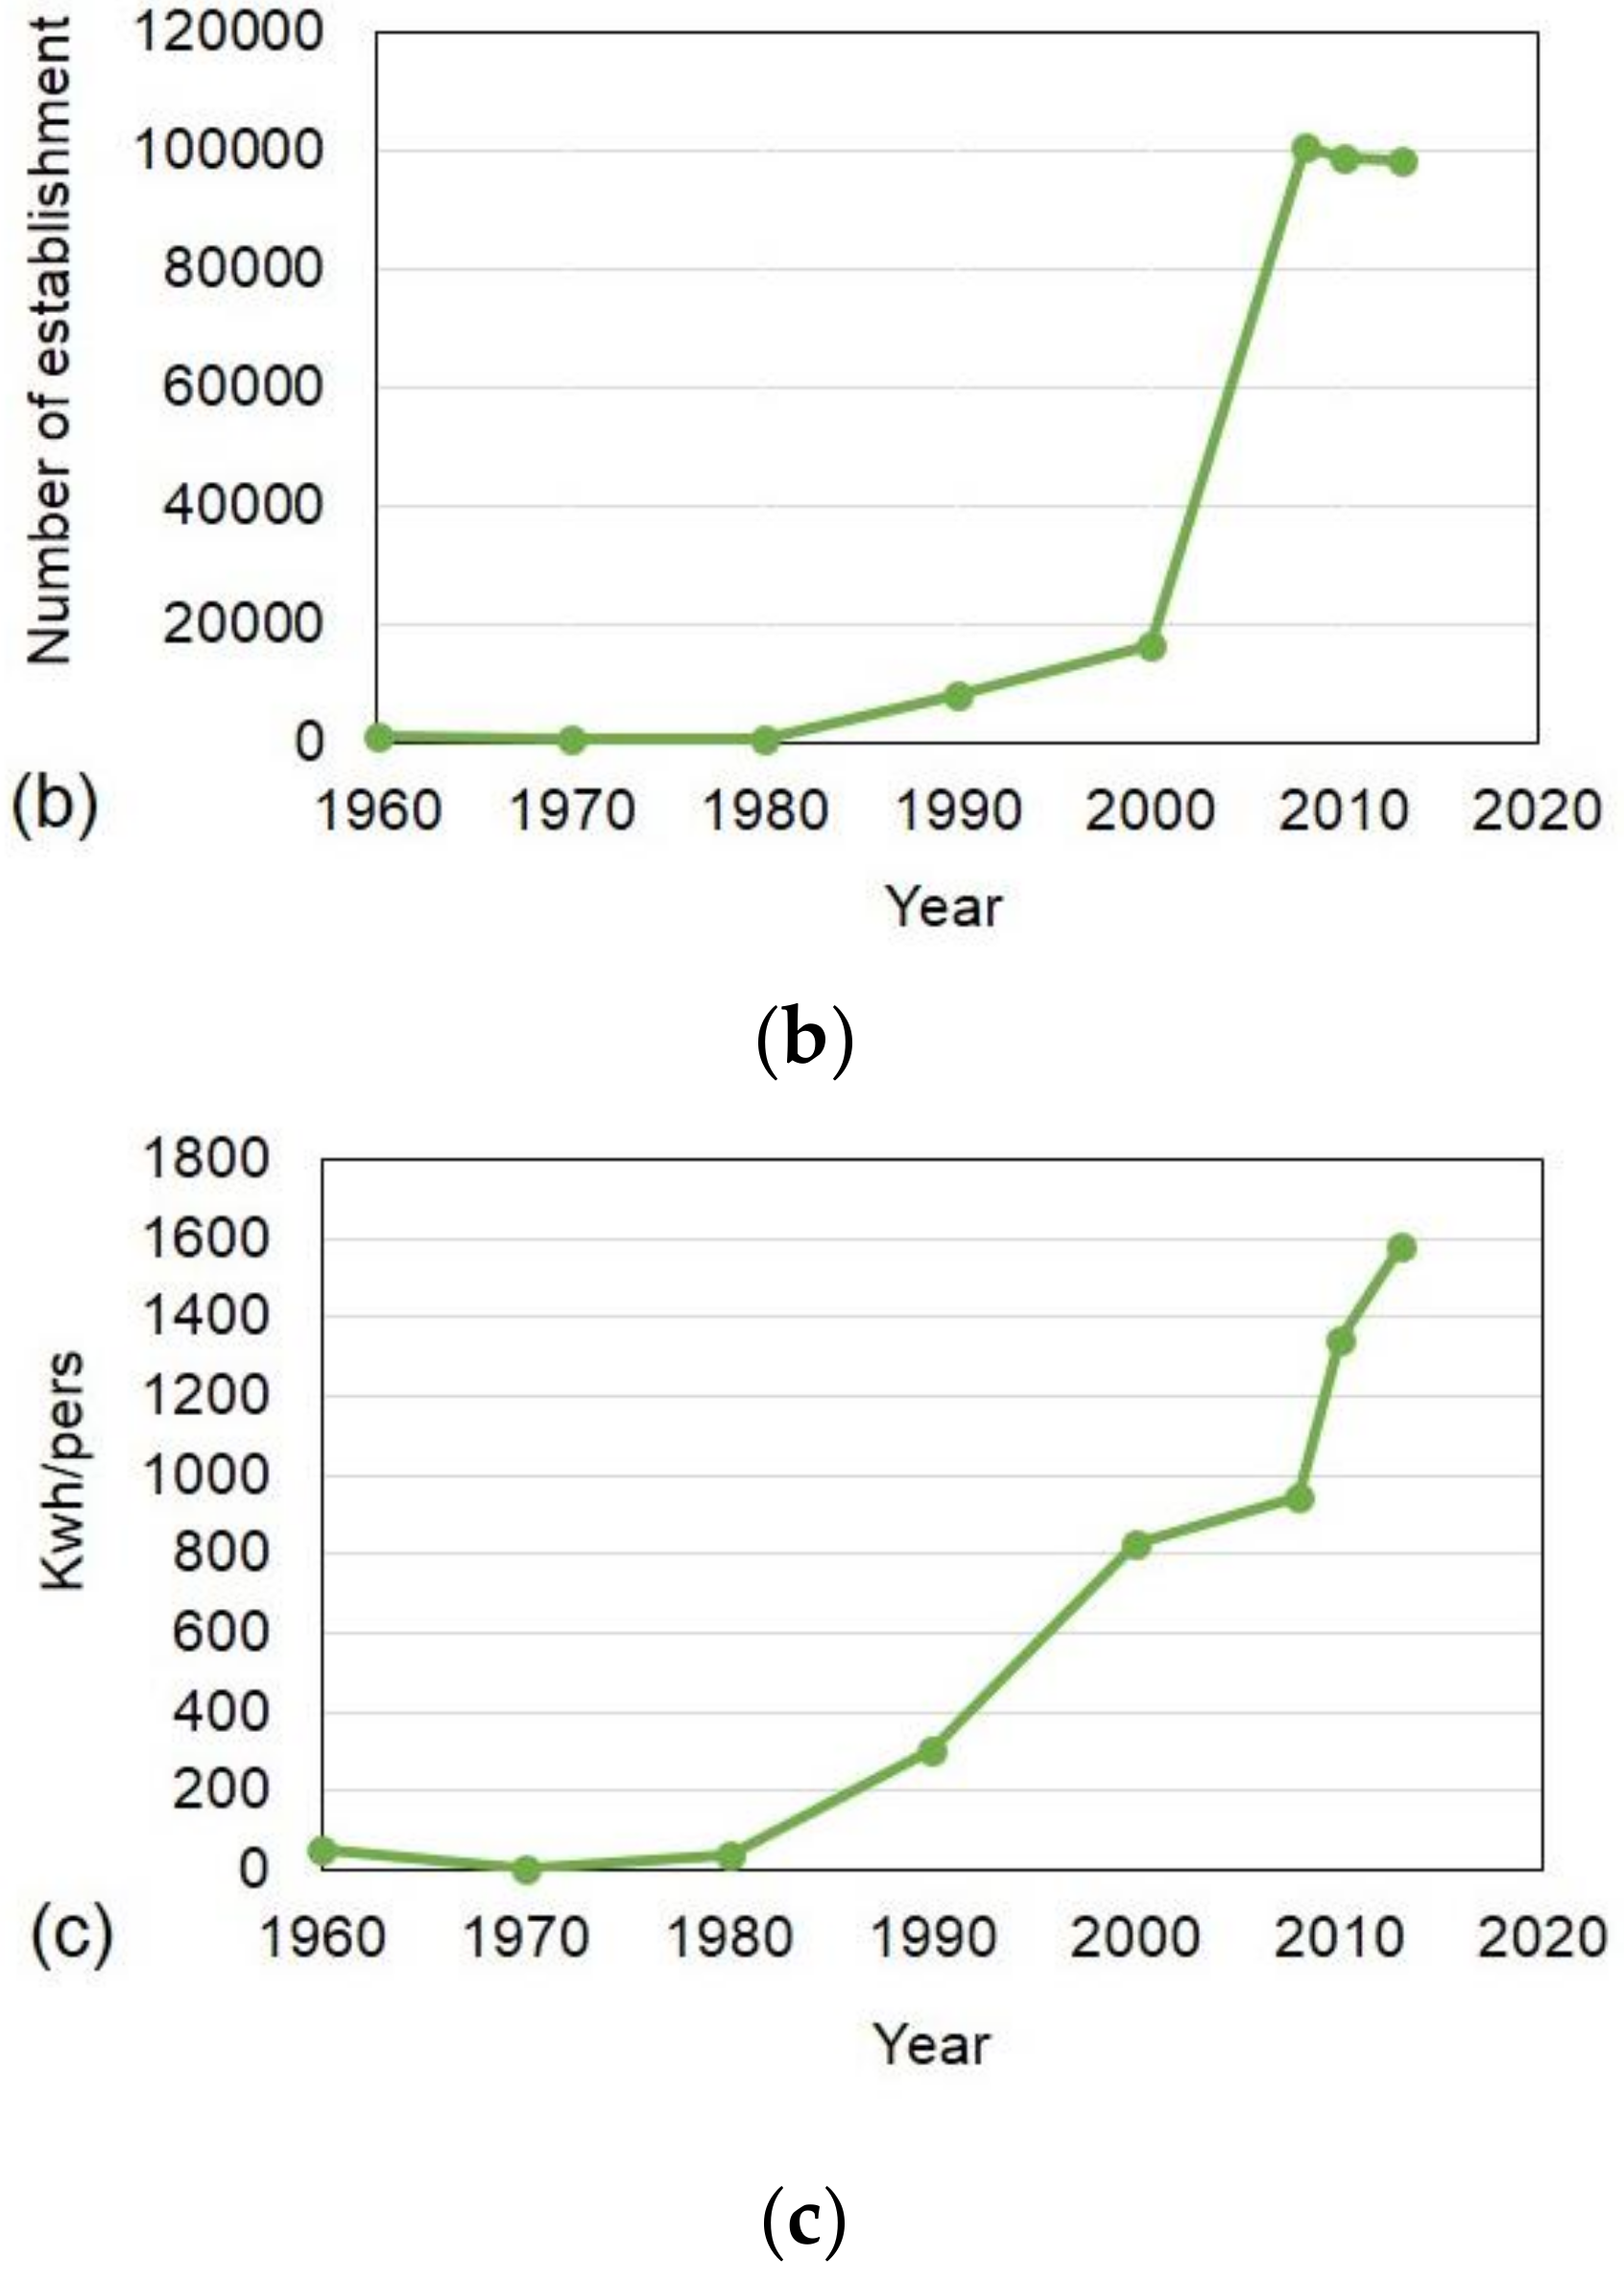
Hanoi has significantly increased in population (4643.4 thousand in 17 years, a 46.37% increase) and experienced urbanization, as indicated by the increase of residential and industrial classes as land uses and rapid increases in socio-economic indicators from 1960 to 2013, such as the newly built-up areas of residential housing (4987 thous.m2, a 99.48% increase), industrial establishments (97092 industrial establishments, a 97.75% increase), and electricity per capita (1531 kWh/pers, a 93.75% increase) [11]. The environmental degradation that accompanied urban development has increased great concern from the public. Therefore, the investigation and assessment of urban development and its environmental effects in the Hanoi metropolitan area are essential and urgent issues in environmental sustainability.
With the advantages of high spatial and temporal resolution, availability, and free and easy access, numerous studies of UHI have been based on LST that were observed from satellite imagery [12]. For UHI studies at the local scale, thermal data (including Landsat 5 TM and Landsat 8 OLI with spatial resolutions of 120 and 100 m, respectively) were widely used [13]. LST is governed by a complex pattern of landscape structure that is directly linked to land use/land cover (LULC) variables [14]. To examine the spatial and temporal variations of LST that are caused by land cover changes, the normalized difference vegetation index (NDVI) and the normalized difference built-up index (NDBI) are among the most commonly used landscape indices [15]. In addition, based on remote sensing data, a number of available thermal comfort indices have been used to evaluate the effects of UHI on urban quality of life, namely, the temperature humidity index (THI), the physiological equivalent temperature [16], the wet-bulb globe temperature (WBGT), and the urban thermal field variance index (UTFVI) [17,18,19,20]. The UTFVI was used in the ecological evaluation of UHI zones because of the application that was previously tested for Landsat data [7]. Thus, Landsat imagery was used to monitor the development of the urban sprawl and UHI in this research. Retrievals of satellite observations and in situ meteorology data were combined to explore the urbanization effects and the UHI phenomenon in Hanoi.
In this study, the impacts of urban development on the environment in the Hanoi metropolitan area during the period from 1999 to 2016 were examined regarding four aspects. First, we analysed the impact of urbanization on the development of SUHI: (a) analysis of the change in urbanization indicators; (b) mapping of the LULC and the detection of the related changes over time; (c) retrieval of LST, calculation of NDVI and NDBI from Landsat data, and the production of LST, NDVI, and NDBI spatial distribution maps; (d) mapping of the UHI zone and non-UHI zone based on the LST; and, (e) Establishment of the correlation of LST with NDVI and NDBI, LST for each land type, and UHI with urbanization indicators. Second, we explored the development trend of atmospheric UHI via changes in air temperature and UHI index over time. Third, we evaluated the impact of UHI on the quality of urban life in Hanoi based on the UTFVI. Finally, we assessed the impacts of urbanization on the changes in regional weather, including relative humidity, total rainfall, temperature, and wind speed in both urban and rural areas.
2. Materials and Methods
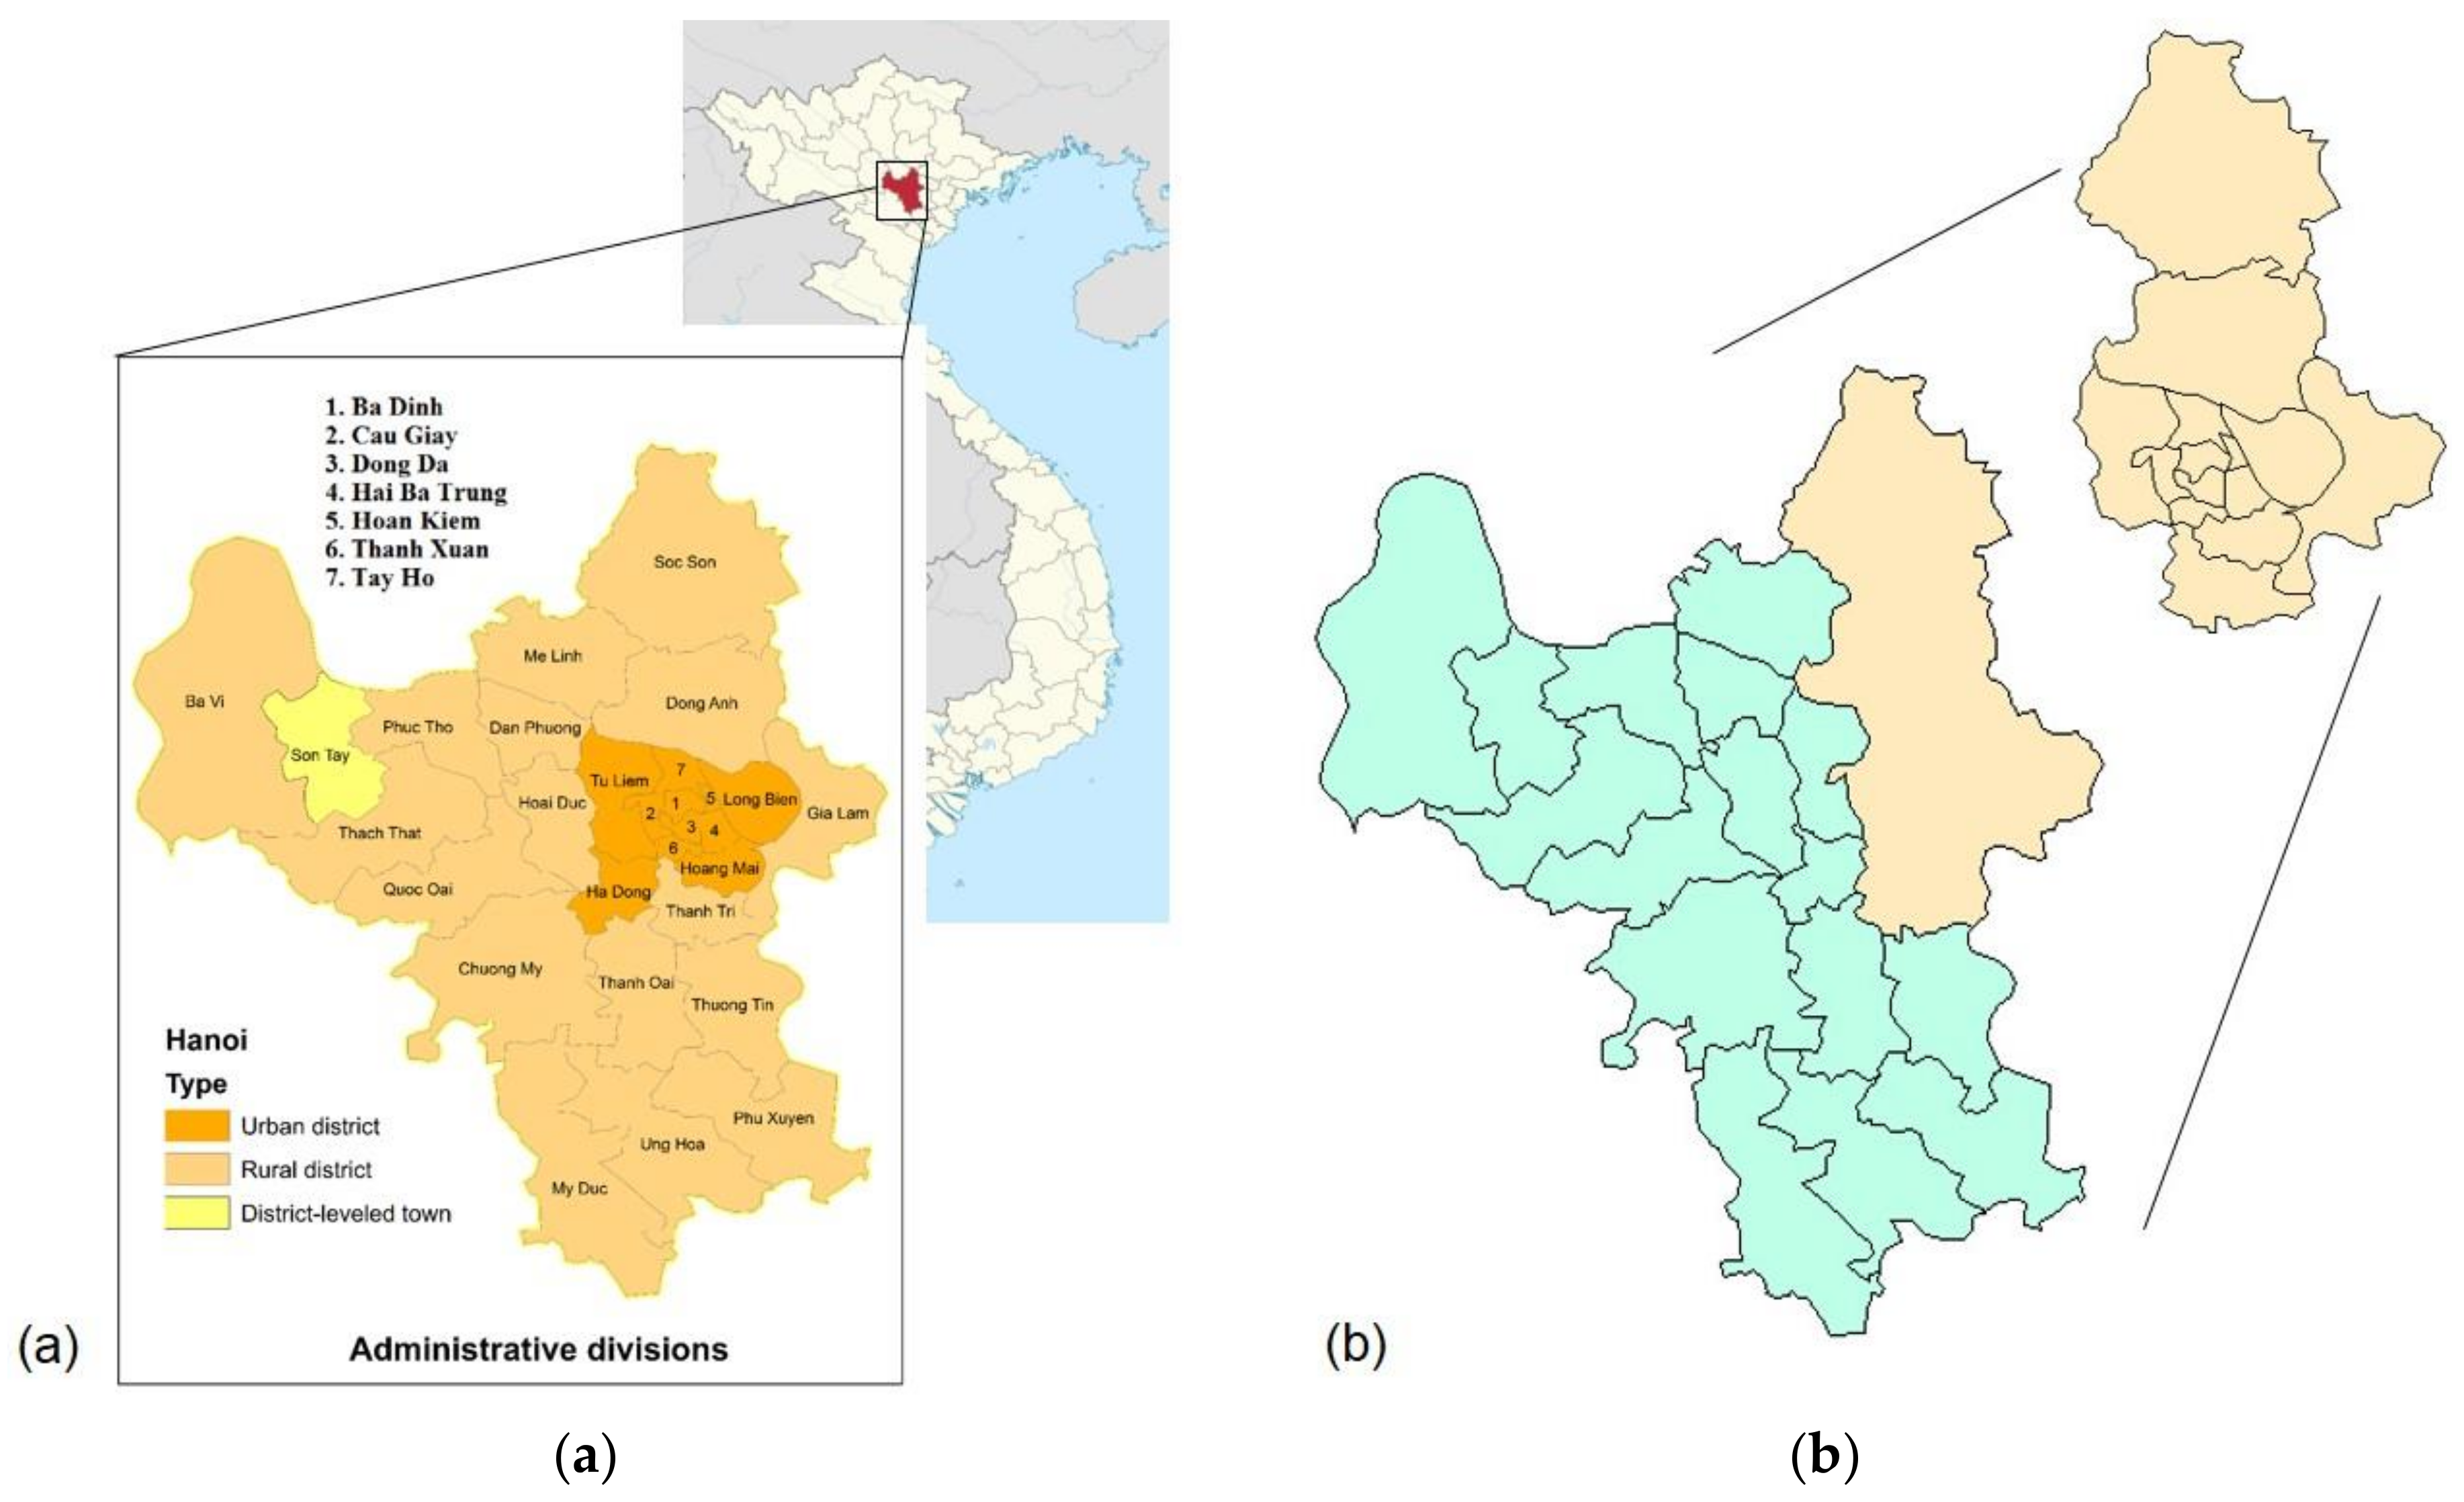
Hanoi, as the political centre of Vietnam, is located in the northern region and it covers an area of 3358.9 km2. The city is the country’s second largest city by population, with 7328.4 thousand people in 2016. Hanoi has a subtropical climate with abundant precipitation. With the typical climate of northern Vietnam, the city experiences four distinct seasons. Hanoi’s administrative boundaries changed in 2008, during which Ha Dong was transformed into an urban area, Ha Tay was merged into Hanoi, and Son Tay was downgraded to a district-level town (Figure 1b). Hence, the city is divided into 12 urban districts, one district-level town, and 17 rural districts (Figure 1a). At the metropolitan level, Hanoi is developing based on a centre core and satellite urban areas [21]. In addition to the eight existing industrial parks, five new large-scale industrial parks and 16 small- and medium-sized industrial clusters are under construction by the city. Figure 1 shows the study area.
The datasets that were used in this study include (1) Landsat images of the study region at three time points (1999, 2009, and 2016), as collected from United States Geological Survey (USGS), and Table 1 shows the descriptions of the Landsat images; (2) Socio-economic statistical data, including the newly built area of residential housing in the year, the number of industrial establishments, electricity per capita during 1961–2013, and the population and population density during 1999–2016, as sourced from the Statistical Yearbook, Statistical Office in Hanoi city; and, (3) Climatic data during 1961–2016, including temperature, rainfall, wind speed, and relative humidity, as supplied by the Vietnam Meteorological Bureau.
3. Methodology
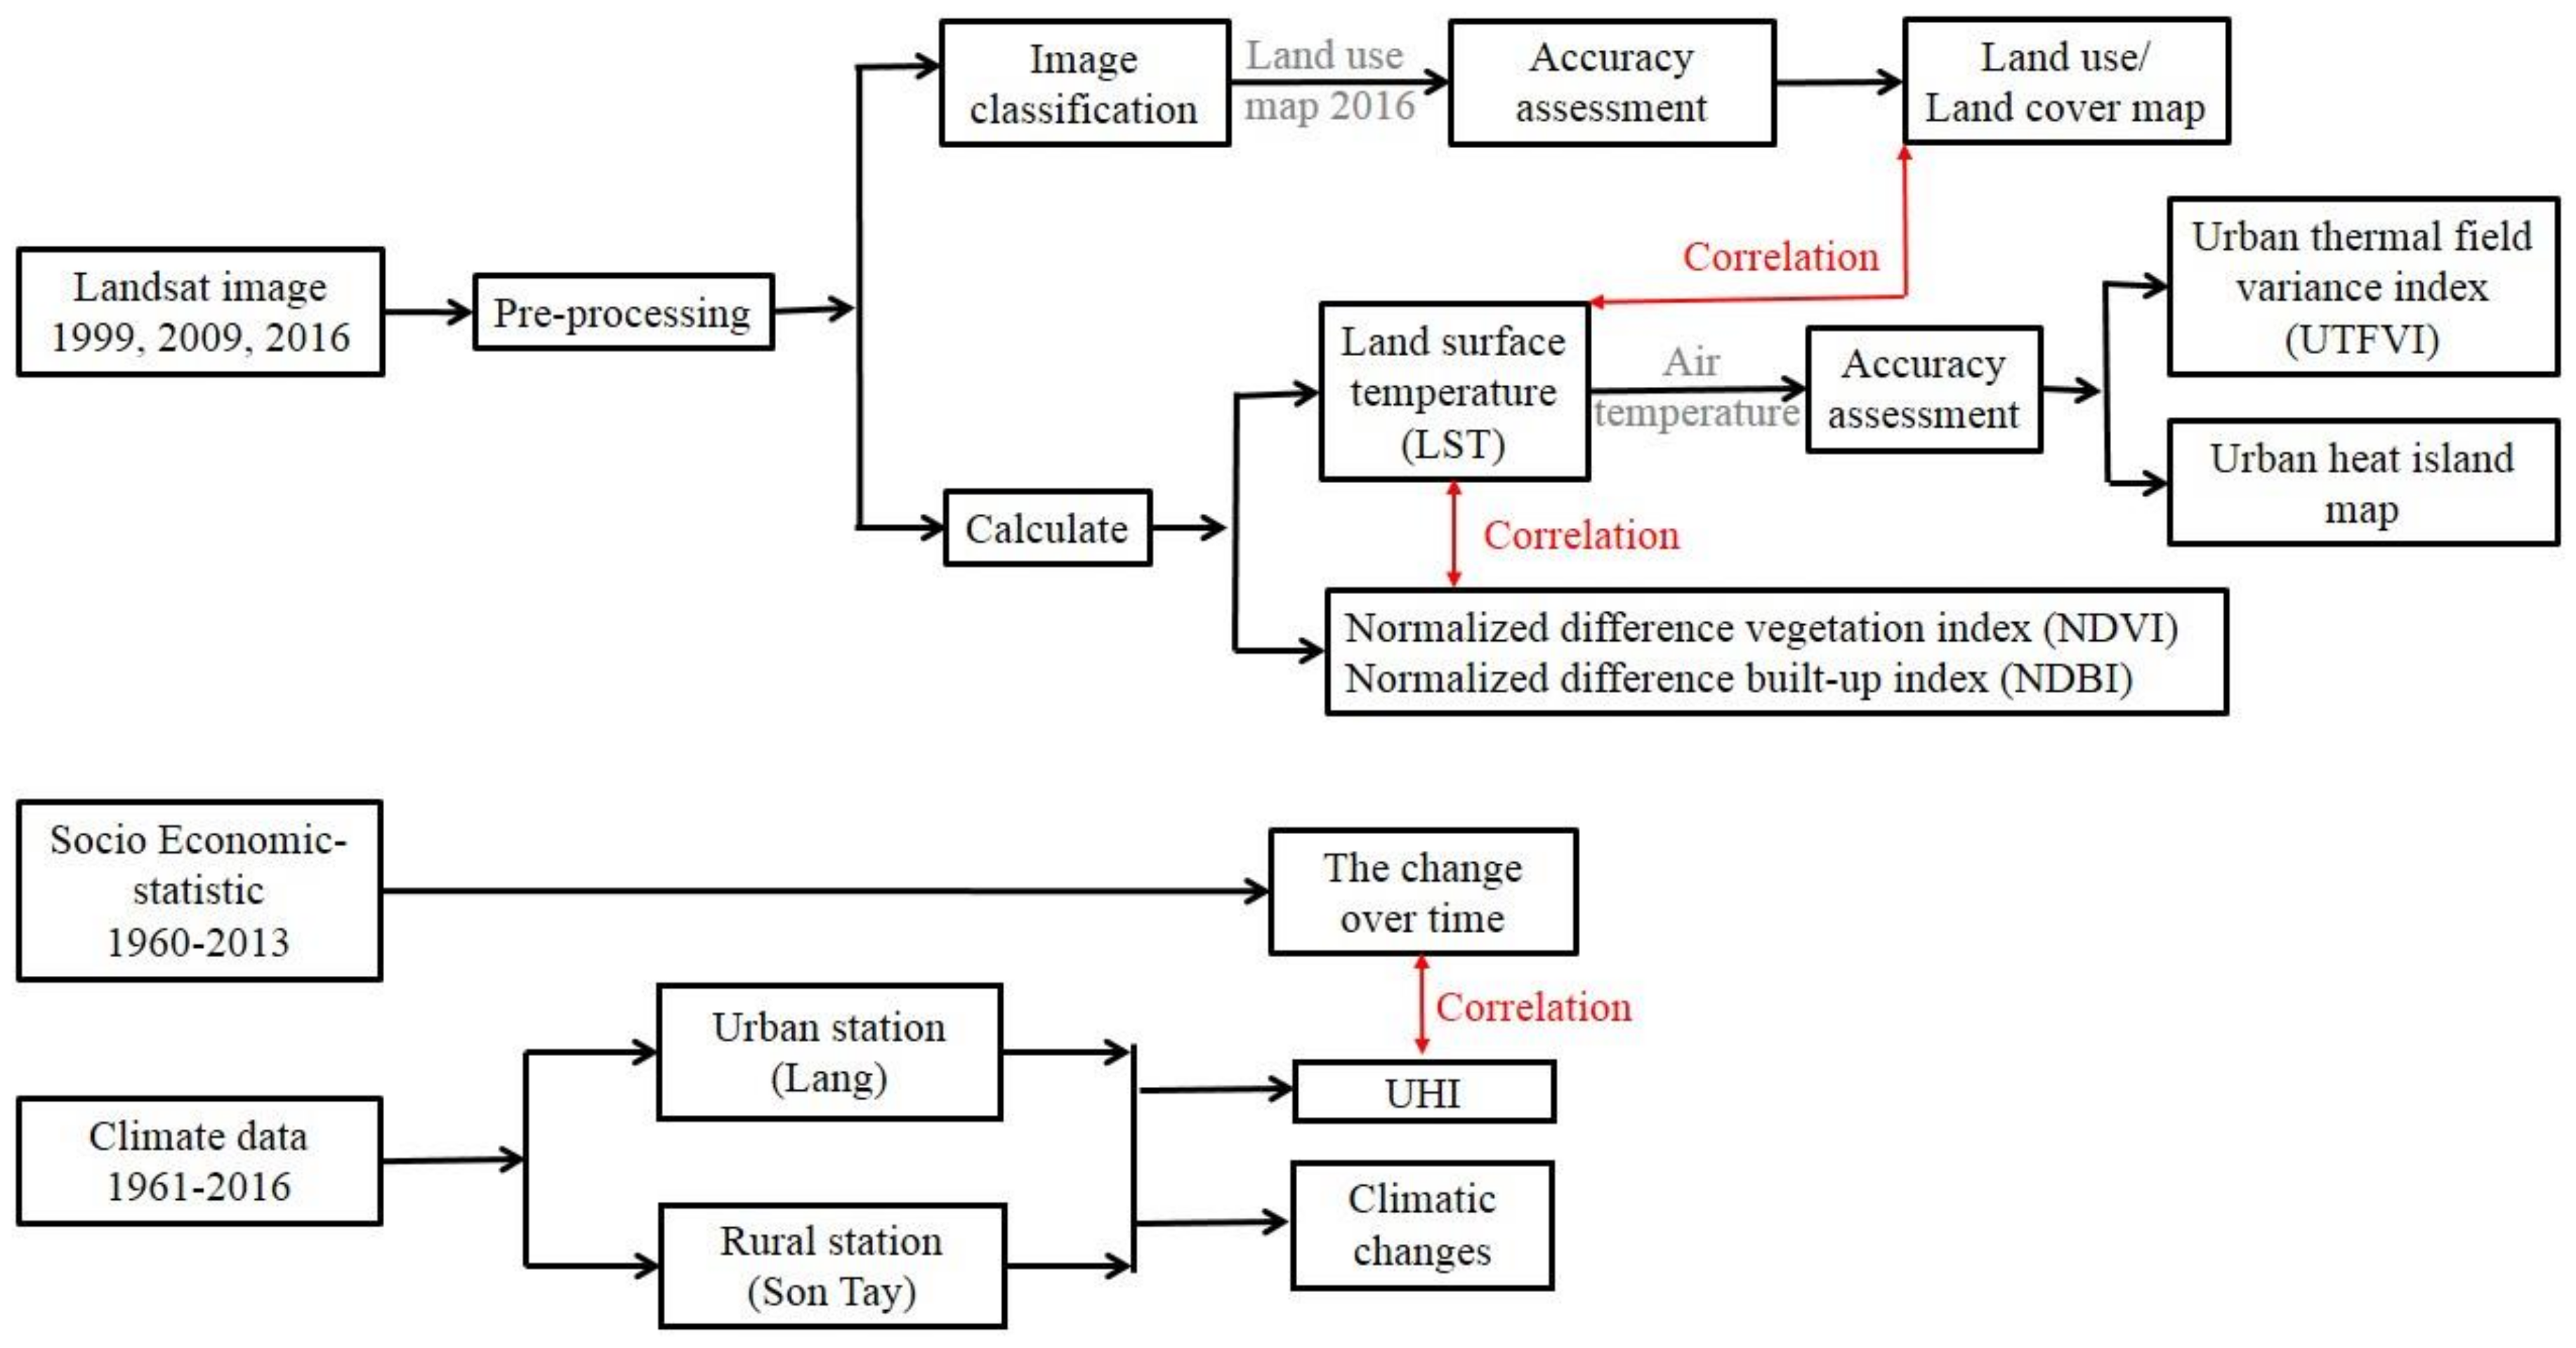
The overall methodology of this study has been presented in a flowchart (Figure 2).
3.1. Change of Urbanization Indicators
In this study, population and population density data from 1999 to 2016 were used to analyse the population change and population distribution in Hanoi. Furthermore, the 2016 population density map was produced.
Socio-economic statistical data, including the newly built area of residential housing in the year, the number of industrial establishments, and electricity per capita in Hanoi during the period 1960–2016, were analysed to indicate development over time.
3.2. Image Processing
3.2.1. Pre-processing
First, the single-band images of Landsat 5/Landsat 8 were combined into a multi-band image (excluding the thermal band) while using the layer stacking tool.
Second, two Landsat images were merged each year to cover the entire study area. However, the study area is only a small portion of that region. Therefore, while using the clip tool in ArcGIS software [22], we created a copy of only the data that fell within the study area and discarded the information that lies outside of the area.
Third, the quick atmospheric correction module in the ENVI software was used to perform atmospheric correction. Finally, all of the image data were re-projected to a universal transverse mercator (UTM) coordinate system, datum WGS84, zone 48. The Landsat images were interpreted into product datasets at a scale of 1:450.000.
3.2.2. Mapping Land Use Land Cover (LULC)
In the early 1970s, visual analysis was the first land cover classification method that was applied to Landsat imagery and, subsequently, pixel-based classification methods, including unsupervised and supervised classification, were used [23]. Furthermore, over the most recent four decades, the supervised classification method using maximum likelihood classifier (MLC) became one of the most commonly used classification methods for Landsat imagery [23,24]. Therefore, in this study, MLC was conducted on the optical bands of Landsat images to construct the land use/land cover maps with eight categories of land use classes (Table 2). In addition, the changes in land use types over time were detected and analysed from the resulting maps.
After classification was performed, the LULC map in 2016 was compared with the land use map in 2016, as supplied by the Hanoi Environment and Natural Resource Department as reference data to assess the accuracy of the classification. The result of the classification map was assessed based on the simple random sampling method, as the traditional and simplest accuracy assessment [25]. In general, 50 samples for each class are suggested [26]; therefore, the validation of classification was calculated from 400 comparison samples of the classified image. The evaluation quantitative classification performance analysis result is based on the total accuracy, the error matrix (including the producer accuracy and user accuracy), and the Kappa index [27].
3.2.3. Calculation of NDVI and NDBI
NDVI is one of the most widely used vegetation indices and it has a long record of merit within the remote sensing community [28,29]. This index is a measure of the difference in reflectance between the red band (RED) and near-infrared band (NIR) of the images. The NDVI ranges between −1.0 to +1.0, where positive values indicate vegetated areas and negative values denote non-vegetated areas [30]. NDVI is expressed in the following Equation (1):
where NIR corresponds to Landsat TM band 4 (0.76–0.90 µm) and Landsat OLI band 5 (0.85–0.88 µm) and RED corresponds to Landsat TM band 3 (0.63–0.69 µm) and Landsat OLI band 4 (0.64–0.67 µm).
NDBI is an effective technique for mapping urban built-up areas, with a total accuracy of 92% [31]. NDBI is calculated based on the difference between NIR and MIR (middle-infrared band) of the images. This index is obtained from Equation (2) [32]:
where MIR corresponds to Landsat TM band 5 (1.55–1.75 µm) and Landsat OLI band 6 (1.57–1.65 µm.
3.2.4. Retrieval of LST
To derive LST from Landsat data, a variety of algorithms has been developed [13]. The technique that is presented in this study is used in retrieving the LST of a given Landsat image based on the input of the RED, NIR, and TIR (thermal infrared band). Firstly, the proportional vegetation P(v) is calculated from the NDVI values, as Equation (3) [33].
where the NDVImin (minimum NDVI) and NDVImax (maximum NDVI) stand for the dynamic range of NDVI value.
For the LST retrieval, LSE (land surface emissivity) is required and is performed while using the following equation [34]:
where ɛs and ɛv are the soil emissivity and vegetation emissivity, respectively. The values of m = 0.004 and n = 0.986 were obtained from the final result of a previous study [34].
After converting the DN values to at-sensor spectral radiance (Lλ), LST can be retrieved with LSE (ε) from Equation (4) while using the following equation:
where LST is the land surface temperature in Celsius (o C); K1 and K2 are the thermal constants of the TIR, which can be identified in the metadata file that is associated with the satellite image [35]; Lλ is the spectral radiation value; and, ԑ is the emissivity calculated from Equation (4). To supply the results in Celsius, it is necessary to revise the data by adding absolute zero, which is approximately equal to −273.15. The relationships between land cover types and LST in Hanoi were analyzed accordingly.
3.2.5. Mapping of the UHI zone
Not all cities have separate UHIs, and their distribution and development depends on many factors. Therefore, it is necessary to indicate the spatial distribution and development trends of the UHI areas. The intensity of the UHI is identified as the difference between the LST of the UHI areas, and that of the rural areas while using the following equations [36]:
referred to UHI area
denoted as non-UHI, where μ and δ are the mean and standard deviation of the LST in the study area, respectively.
However, the UHI zone distribution that is based on this method might be influenced by many factors. Therefore, to increase accuracy, a combined method using the LULC map and LST map is used to determine the heat island zone. In this study, the heat island region is defined as containing both of the following elements:
LST > µ + 0.5 * δ and the LULC type is Residential and Industrial referred to UHI area.
3.2.6. Urban Thermal Field Variance Index (UTFVI)
In urbanized areas, the UHI effect is an important factor in environmental and public health studies [37]. A number of thermal comfort indices are available for the evaluation of UHI impacts on the quality of urban life. In this study, UTFVI was chosen and it is estimated by Equation (8) [20].
where Ts is the LST and Tm is the mean of the LST of the study area.
3.3. Variation of Meteorology
Atmospheric UHI was observed based on the air temperature that was collected from four stations in Hanoi from 1999–2016. Two stations represent urban areas, namely, Lang and Ha Dong, and two stations represent rural areas, namely, Son Tay and Ba Vi.
To analyse the climatic effects of urbanization in Hanoi, two stations, i.e., Lang and Son Tay, were selected as the urban and rural representative stations, respectively. We aimed to analyse the difference of the temporal variations (between urban and rural areas) in the mean annual temperature, total rainfall, relative humidity, and wind speed from 1961–2016. The variation in annual temperature was defined as the UHI index.
3.4. Statistical Analysis
Scatter diagrams were plotted with regression analyses to examine the correlations of LST with NDVI and NDBI. The points for analysis were extracted from the pixel values of the LST, NDVI, and NDBI maps over study area. The UHI index and the relationships between the UHI index and urbanization indicators, including the newly built area of residential housing in the year, the number of industrial establishments, and electricity per capita, were also analysed and discussed.
4. Results and Discussion
4.1. Evolvement of Urbanization in Hanoi
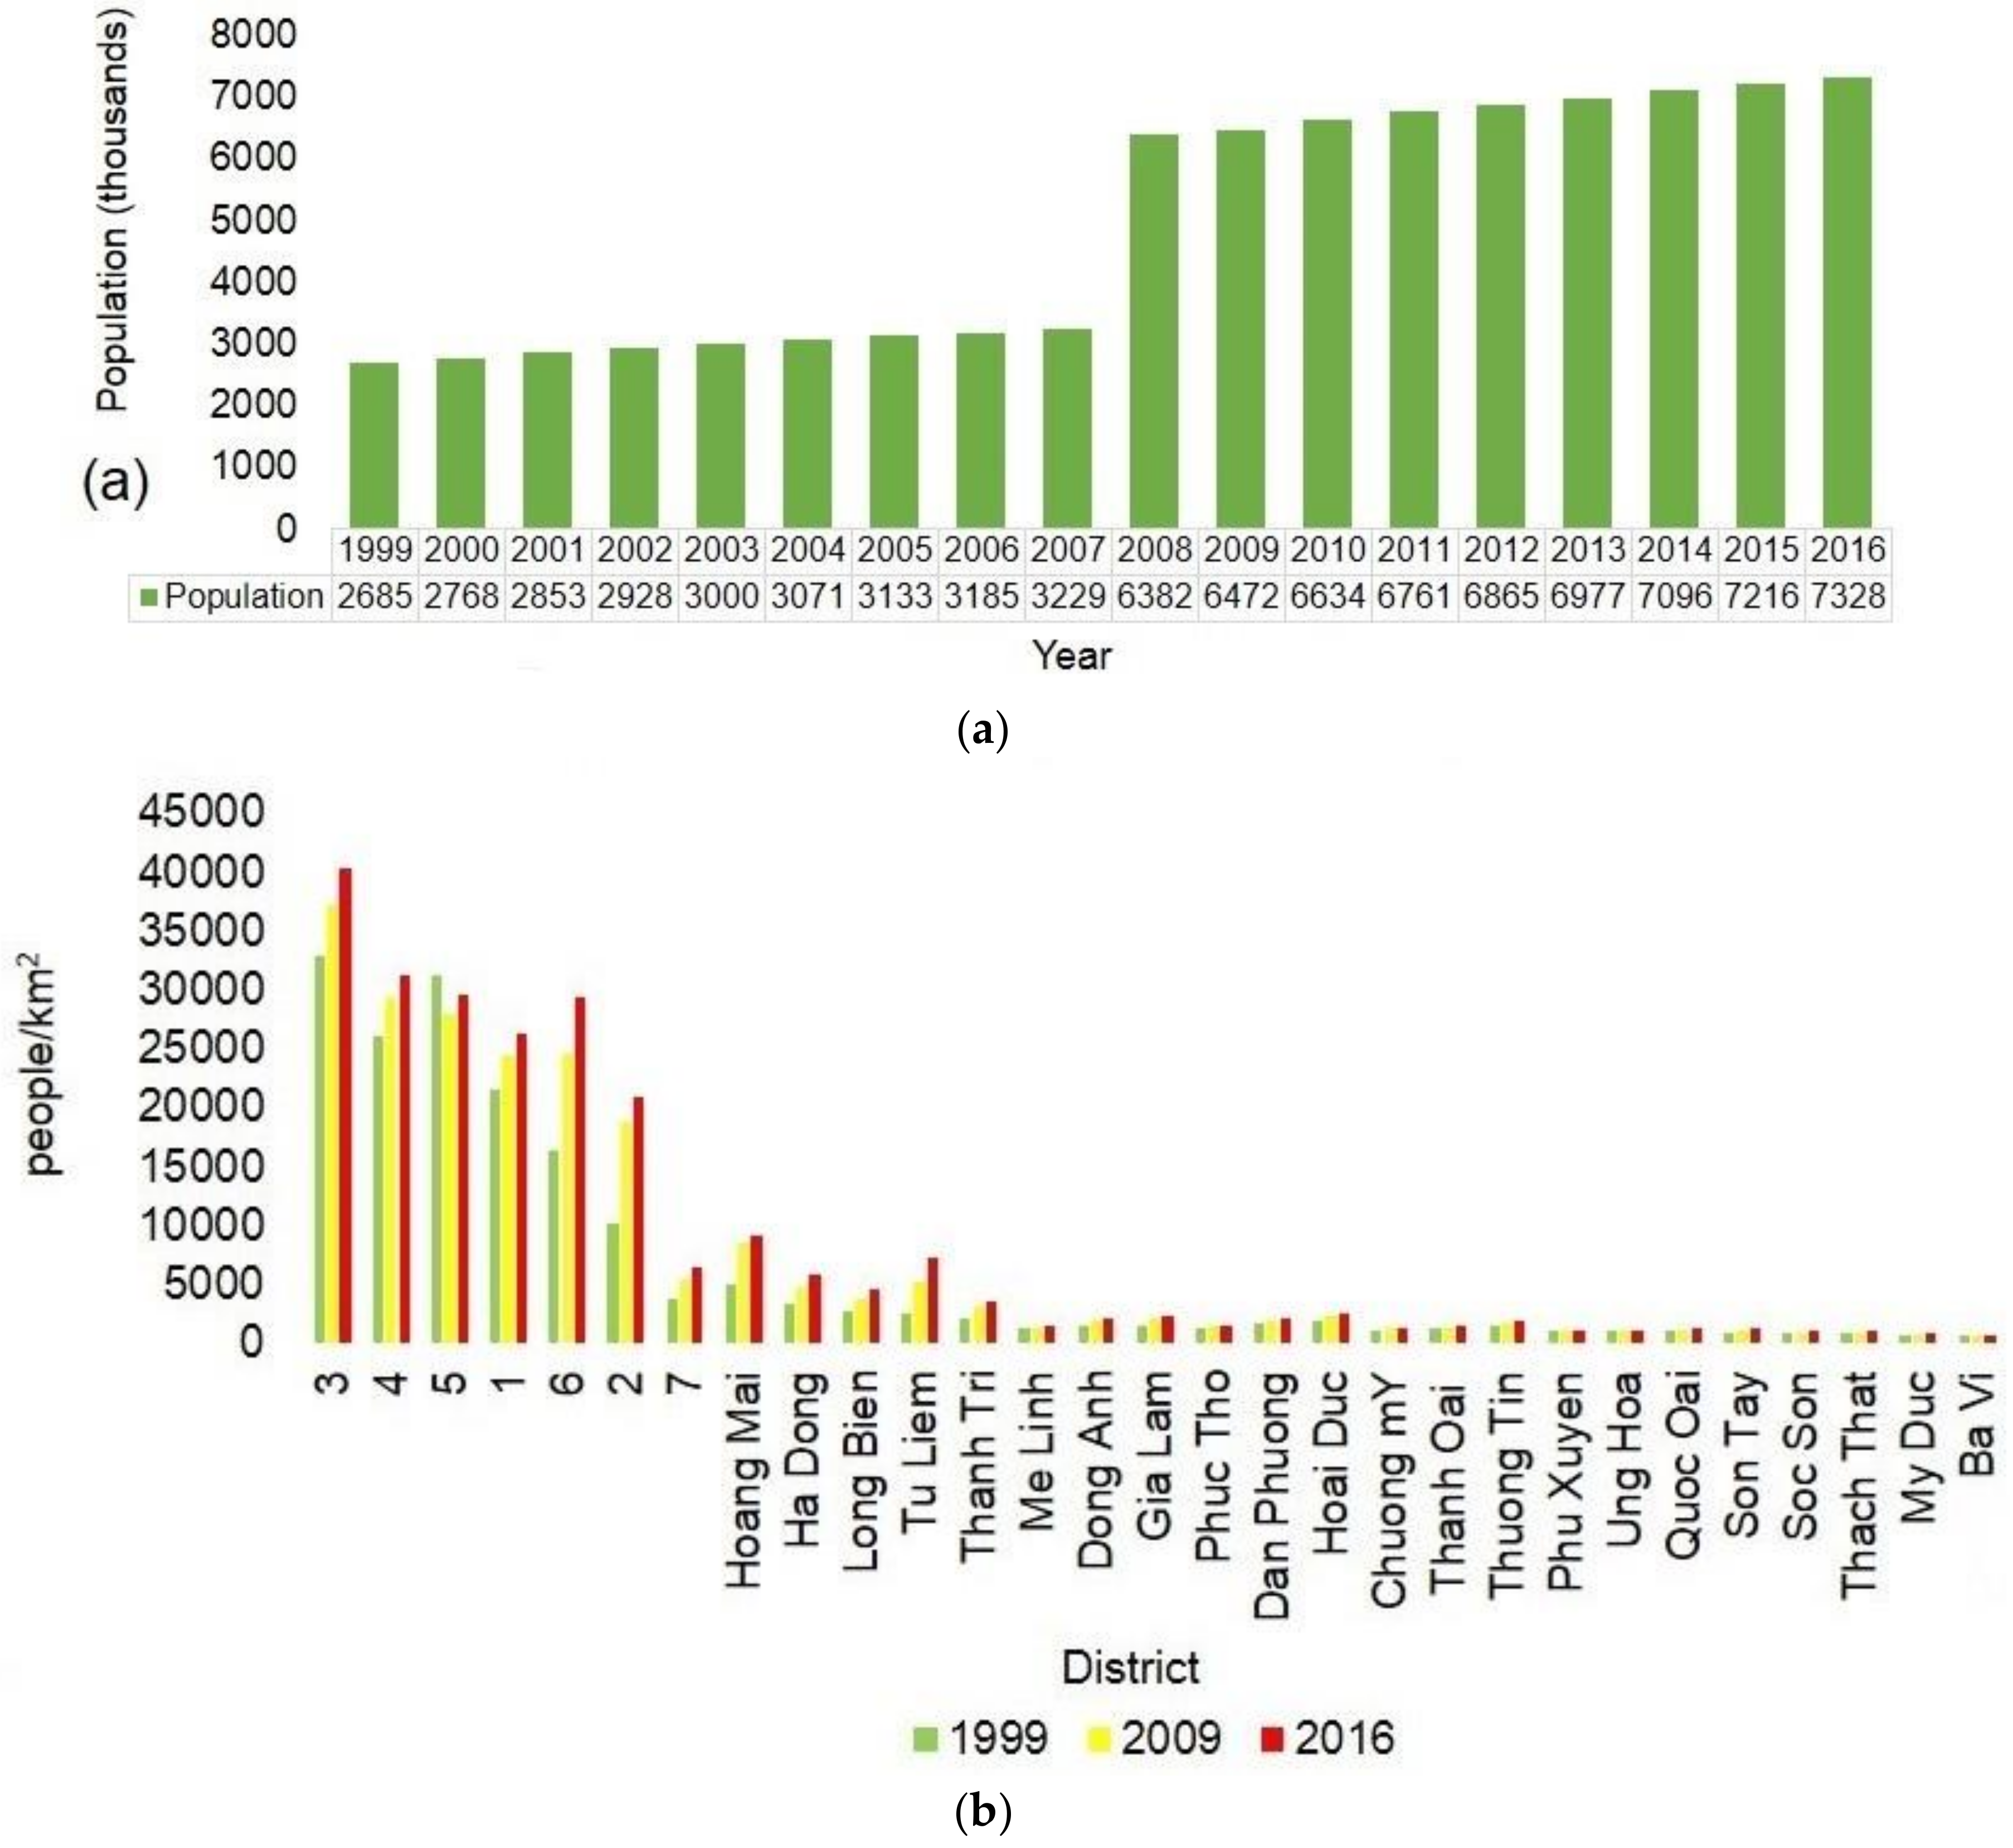
From 1998 to 2016, Hanoi experienced a considerable change in the total population and population density (Figure. 3). The total population significantly increased from 2685 thousand people in 1999 to 7328.4 thousand people in 2016 (Figure 3a), exhibiting an increase of 4643.4 thousand people after 17 years, with a rate of increase of 273.14 thousand people per year. A double jump in population occurred in 2008 with an increase of 3153.3 thousand people as compared with 2007, causing administrative expansion at this time. In addition, this event is related to rapid urbanization and economic development, i.e., people from other provinces left their hometowns and then moved to Hanoi with the desire to find jobs with higher incomes.
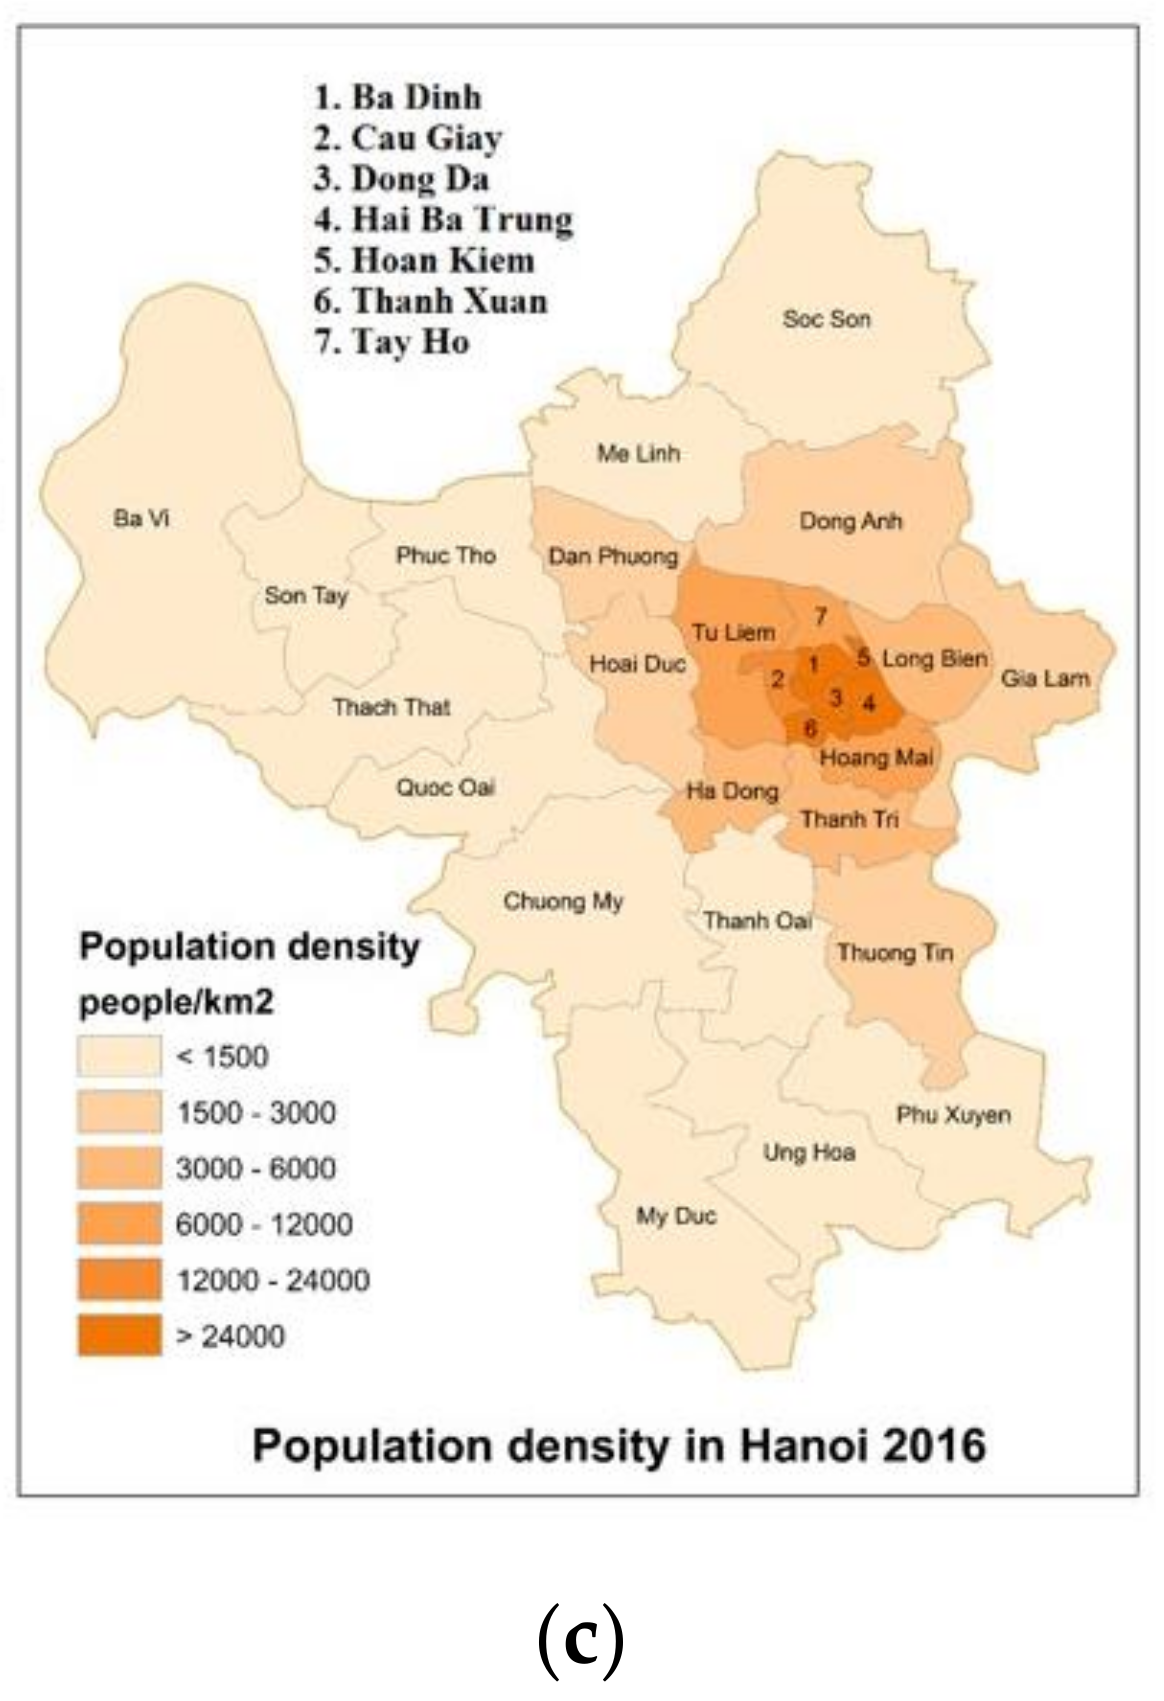
Population density also continuously increased in all districts of Hanoi during the study period (Figure 3b). According to the population density map in 2016 (Figure 3c), the five districts of Ba Dinh: 26249 people/km2, Cau Giay: 20931 people/km2, Dong Da: 40331 people/km2, Hai Ba Trung: 31308 people/km2, Hoan Kiem: 29471 people/km2, and Thanh Xuan: 29295 people/km2 have the highest population densities, which tend to increase over time. These locations are the central areas of Hanoi, where the business and economic conditions are favourable, and this situation has driven the density population in these areas much higher than in the surrounding regions.
Other aspects, including the newly built area of residential housing in the year, the number of industrial establishments, and electricity per capita, were also used to describe the process and extent of urbanization in Hanoi. From 1960 to 2013, these indicators significantly increased in Hanoi (Figure 4), especially after 1990. The newly built area of residential housing (Figure 4a) increased by 4987 thousand m2 in the 53 years from 1960 to 2013, with a rate of increase of 94.09 thousand m2 per year. Since the beginning of rapid development in 1990, the construction and rehabilitation of the city’s infrastructure have led to the rapid increase in new buildings in Hanoi and, after 23 years, this value has increased by 4870.5 thousand m2, equivalent to an increase rate of 211.76 thousand m2 per year. At the same time, the number of industrial establishments (Figure 4b) has increased from 1128 in 1960 to 98220 in 2013, an increase of 97092 industrial establishments. As a result, the number of industrial establishments after 53 years has increased by 1831.93 industrial establishments per year. In the period of 1990–2013, the value has rapidly grown, with 90,163 new industrial establishments after 23 years, which is equivalent to an increase rate of 3920.13 industrial establishments per year. Finally, from 1960 to 2013, electricity per capita (Kwh/pers) in Hanoi (Figure 4c) has increased by 1531 Kwh/pers in 53 years, with an increase rate of 28.89 Kwh/pers per year. During the period from 1960–2013, electricity per capita increased by 1281 Kwh/pers after 23 years, with an increase rate of 55.7 Kwh/pers per year. The growth tendency of these socio-economic indicators is closely related to the economic development of the city, especially after the boom of 1990.
It is clear that the capital has experienced rapid urbanization since 1990, with continuous increases in population and socio-economic indicators over time.
4.2. Changes of LULC
Table 4 shows the result of the accuracy assessment of the land use/land cover classification map in 2016. The overall accuracy (90.75%) and Kappa index (0.88) are sufficiently high to believe in the classification result. Therefore, we classify the land use/land cover for 1999 and 2009, based on the 2016 classification map.
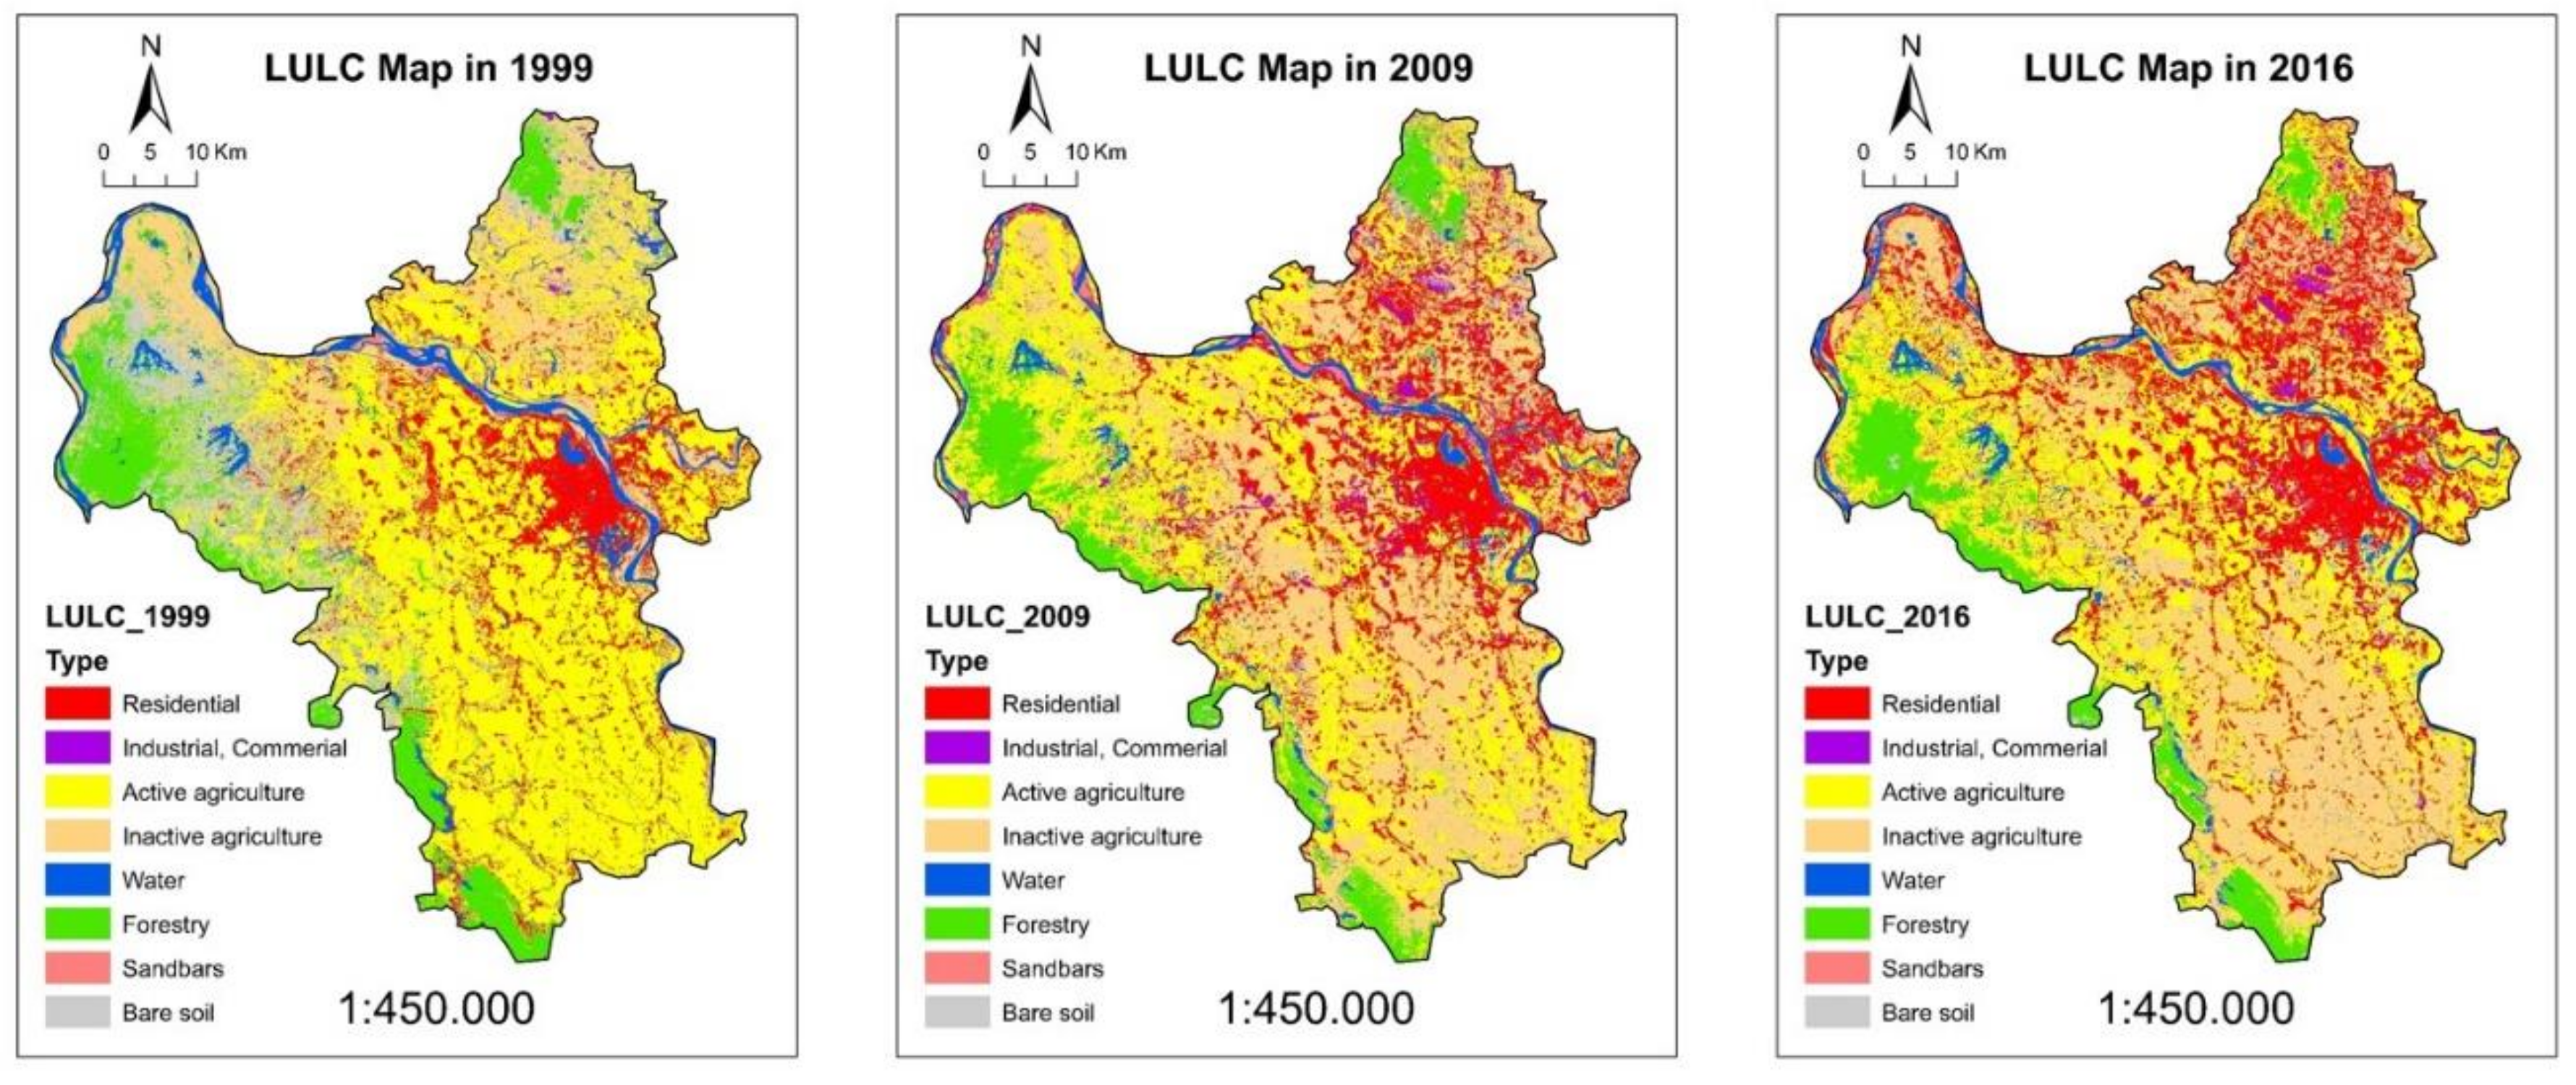
In general, the classification results reveal that, agricultural land, including active and inactive agriculture land, has the largest area of land use/land cover type and it is distributed throughout the city (over 50% in all three time points). Forests occupy a small area, which is mainly located in the west and southwest of Hanoi. Residential areas are found in the city centre and the northwest in 2009 and 2016.
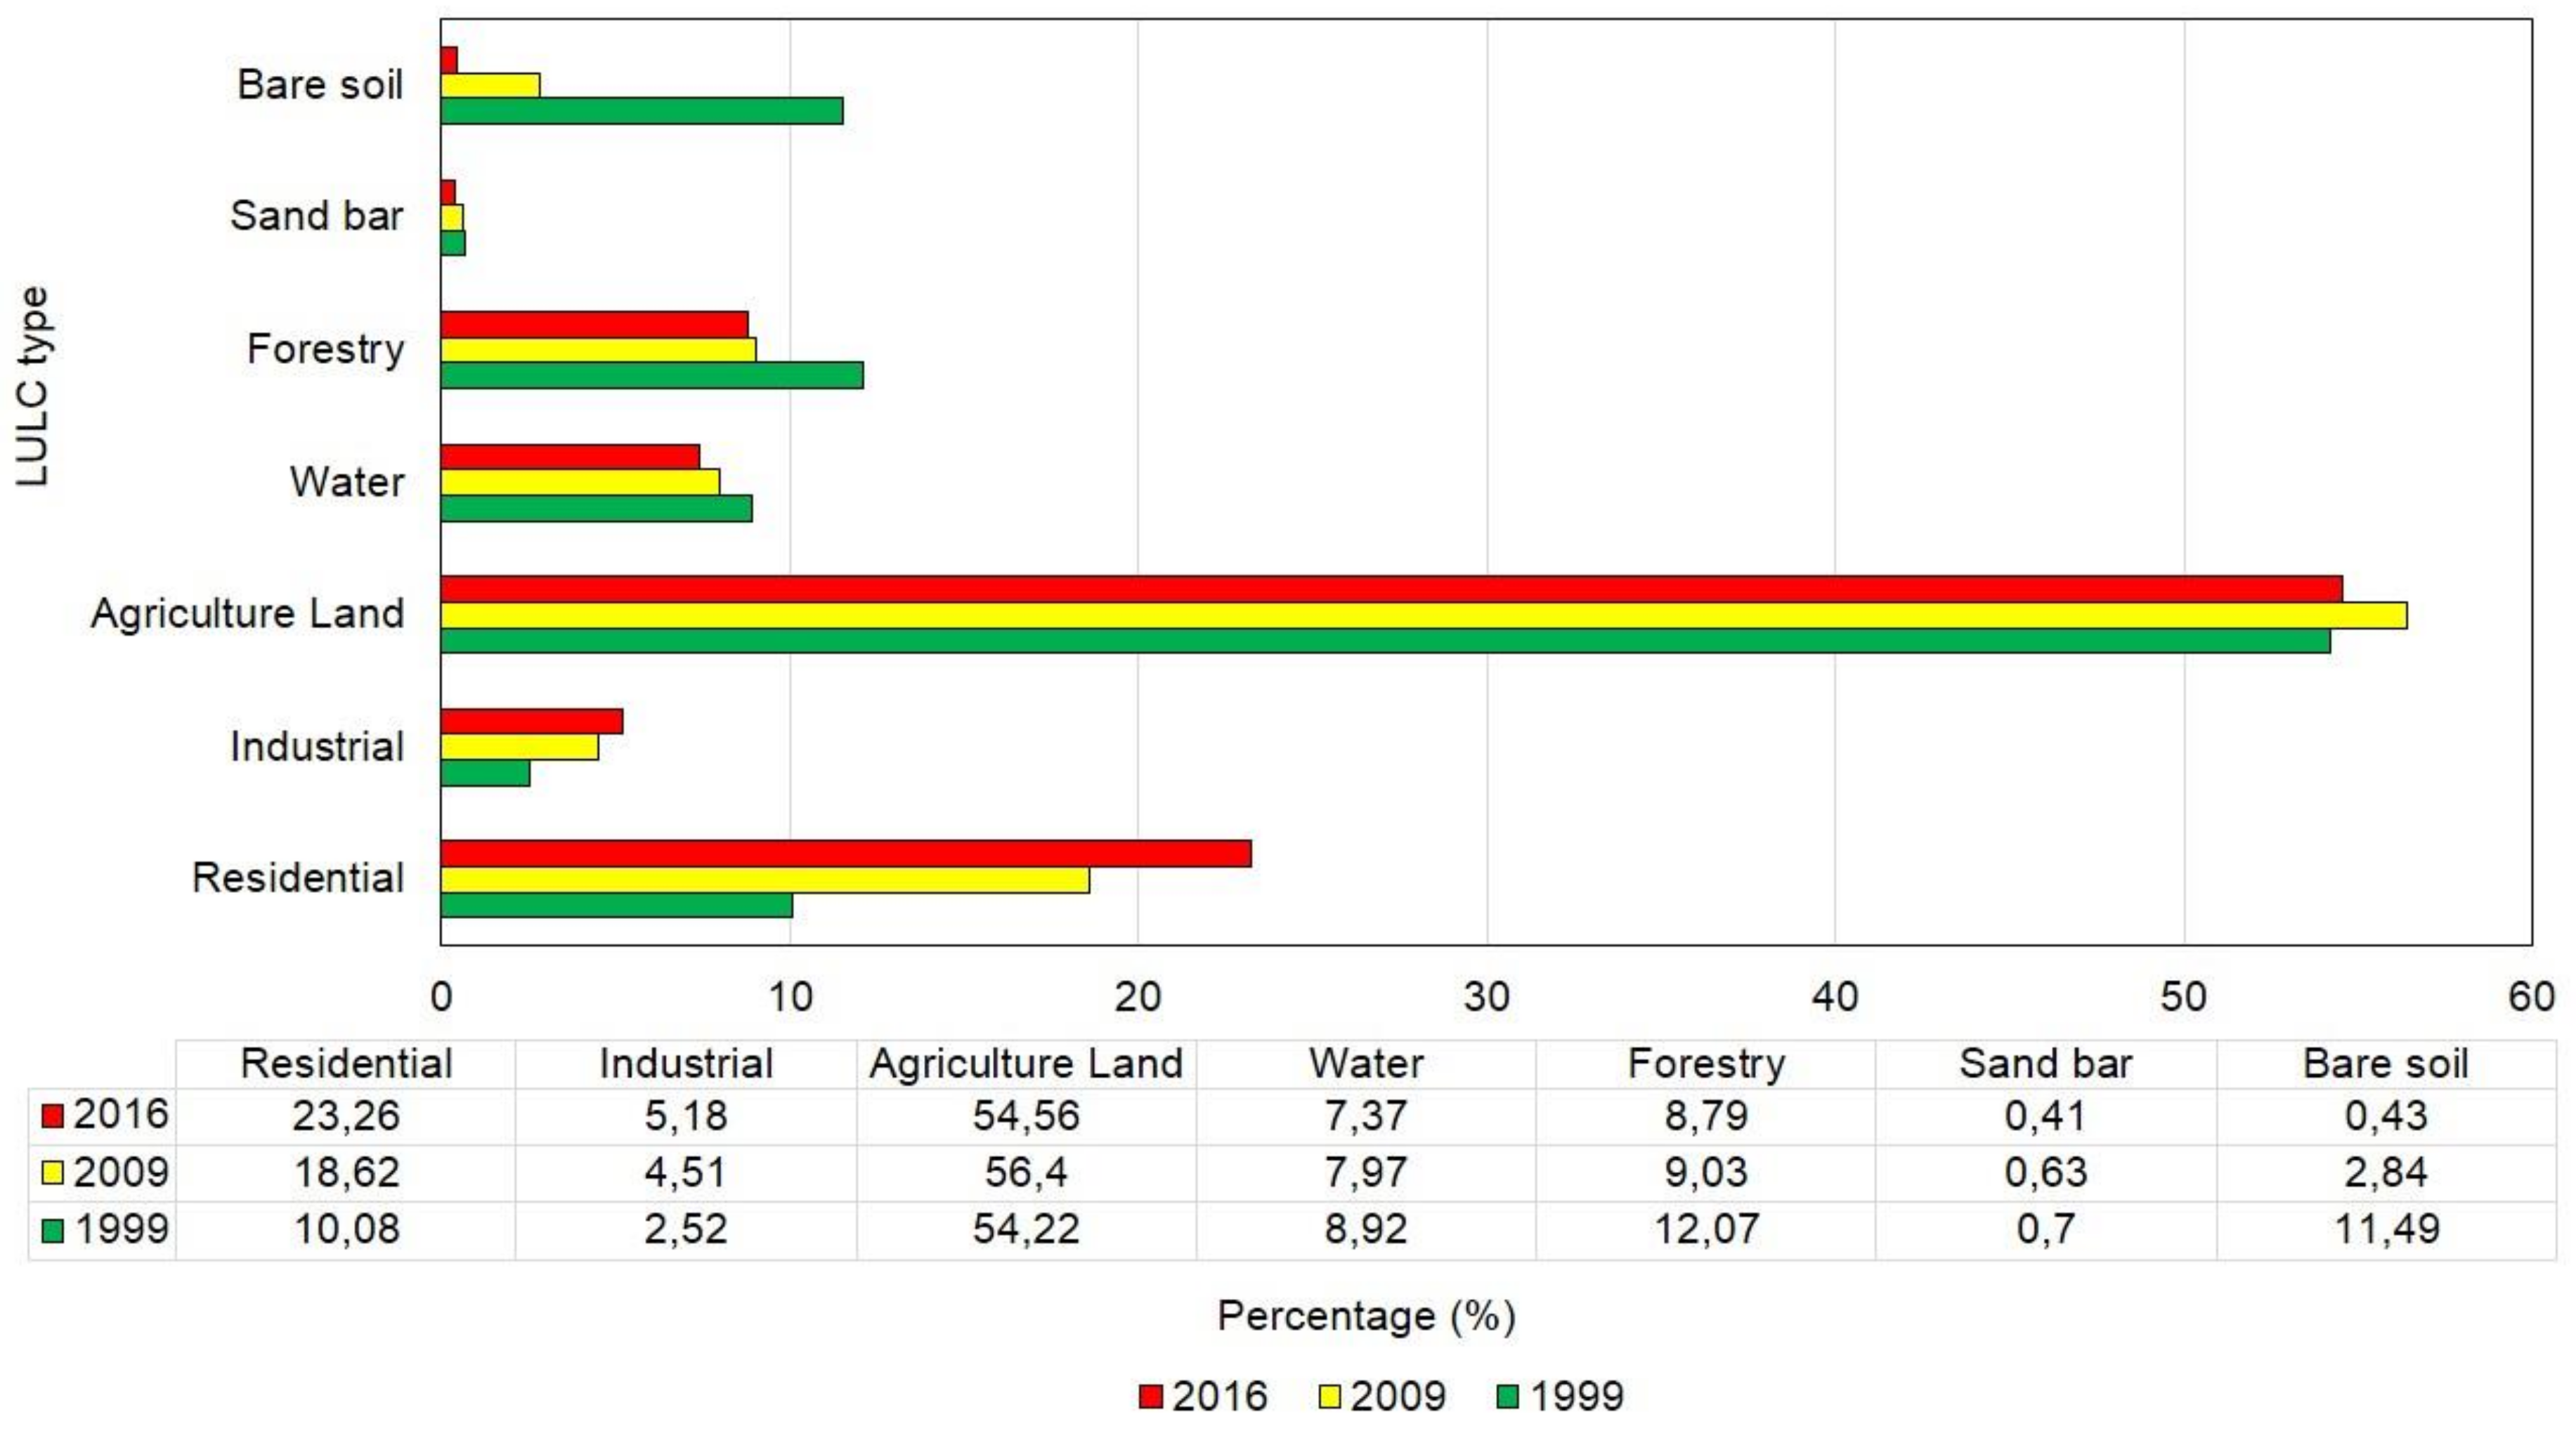
Figure 5 displays the LULC map of Hanoi in 1999, 2009, and 2016, with eight land use/land cover classes of residential, industrial, commercial, active agriculture, inactive agriculture, water, forestry, sandbars, and bare soil. Furthermore, the temporal variations of land use/land cover in fractions at the three time points are analysed and presented in Figure 6 for additional detail in the study area. When compared with 1999, the land use types considerably changed in 2009 and 2016, largely reflecting changes in bare soil and residential areas. The percentage of bare soil area significantly decreased, from 11.49% in 1999 to 0.43% in 2016, which is a reduction by 11.06% after 17 years. Building land, including residential and industrial areas, occupied a small portion of the city centre in 1999, with percentages of 10.08% and 2.52%, respectively. By 2009 and 2016, Hanoi’s residential areas developed and expanded to the northeast, west, and southwest of the city. In 2009, the total proportion of residential and industrial area was 23.13%. These areas have continued to grow over time, and these values reached 23.26% and 5.18% for residential and industrial areas, respectively. Therefore, from 1999 to 2016, a significant increase in the area of building land occurred, namely, increases of 13.18% in the residential area and 2.66% in the industrial area. In 2016, we clearly note the development of building areas in Hanoi, especially in the crowded residential and industrial zone in the northeast.
In short, the results of LULC analysis show that substantial changes in land use are primarily due to a reduction of bare soil and a sharp increase in the building land, which accounts for 28.44% of the total area in 2016. Due to economic development and administrative extension, Hanoi has experienced considerable change in land use and land cover, and this change was mainly due to urban expansion, leading to an increase in residential or industrial areas. Population growth, economic development, and policy reform have played important roles in driving all of these changes.
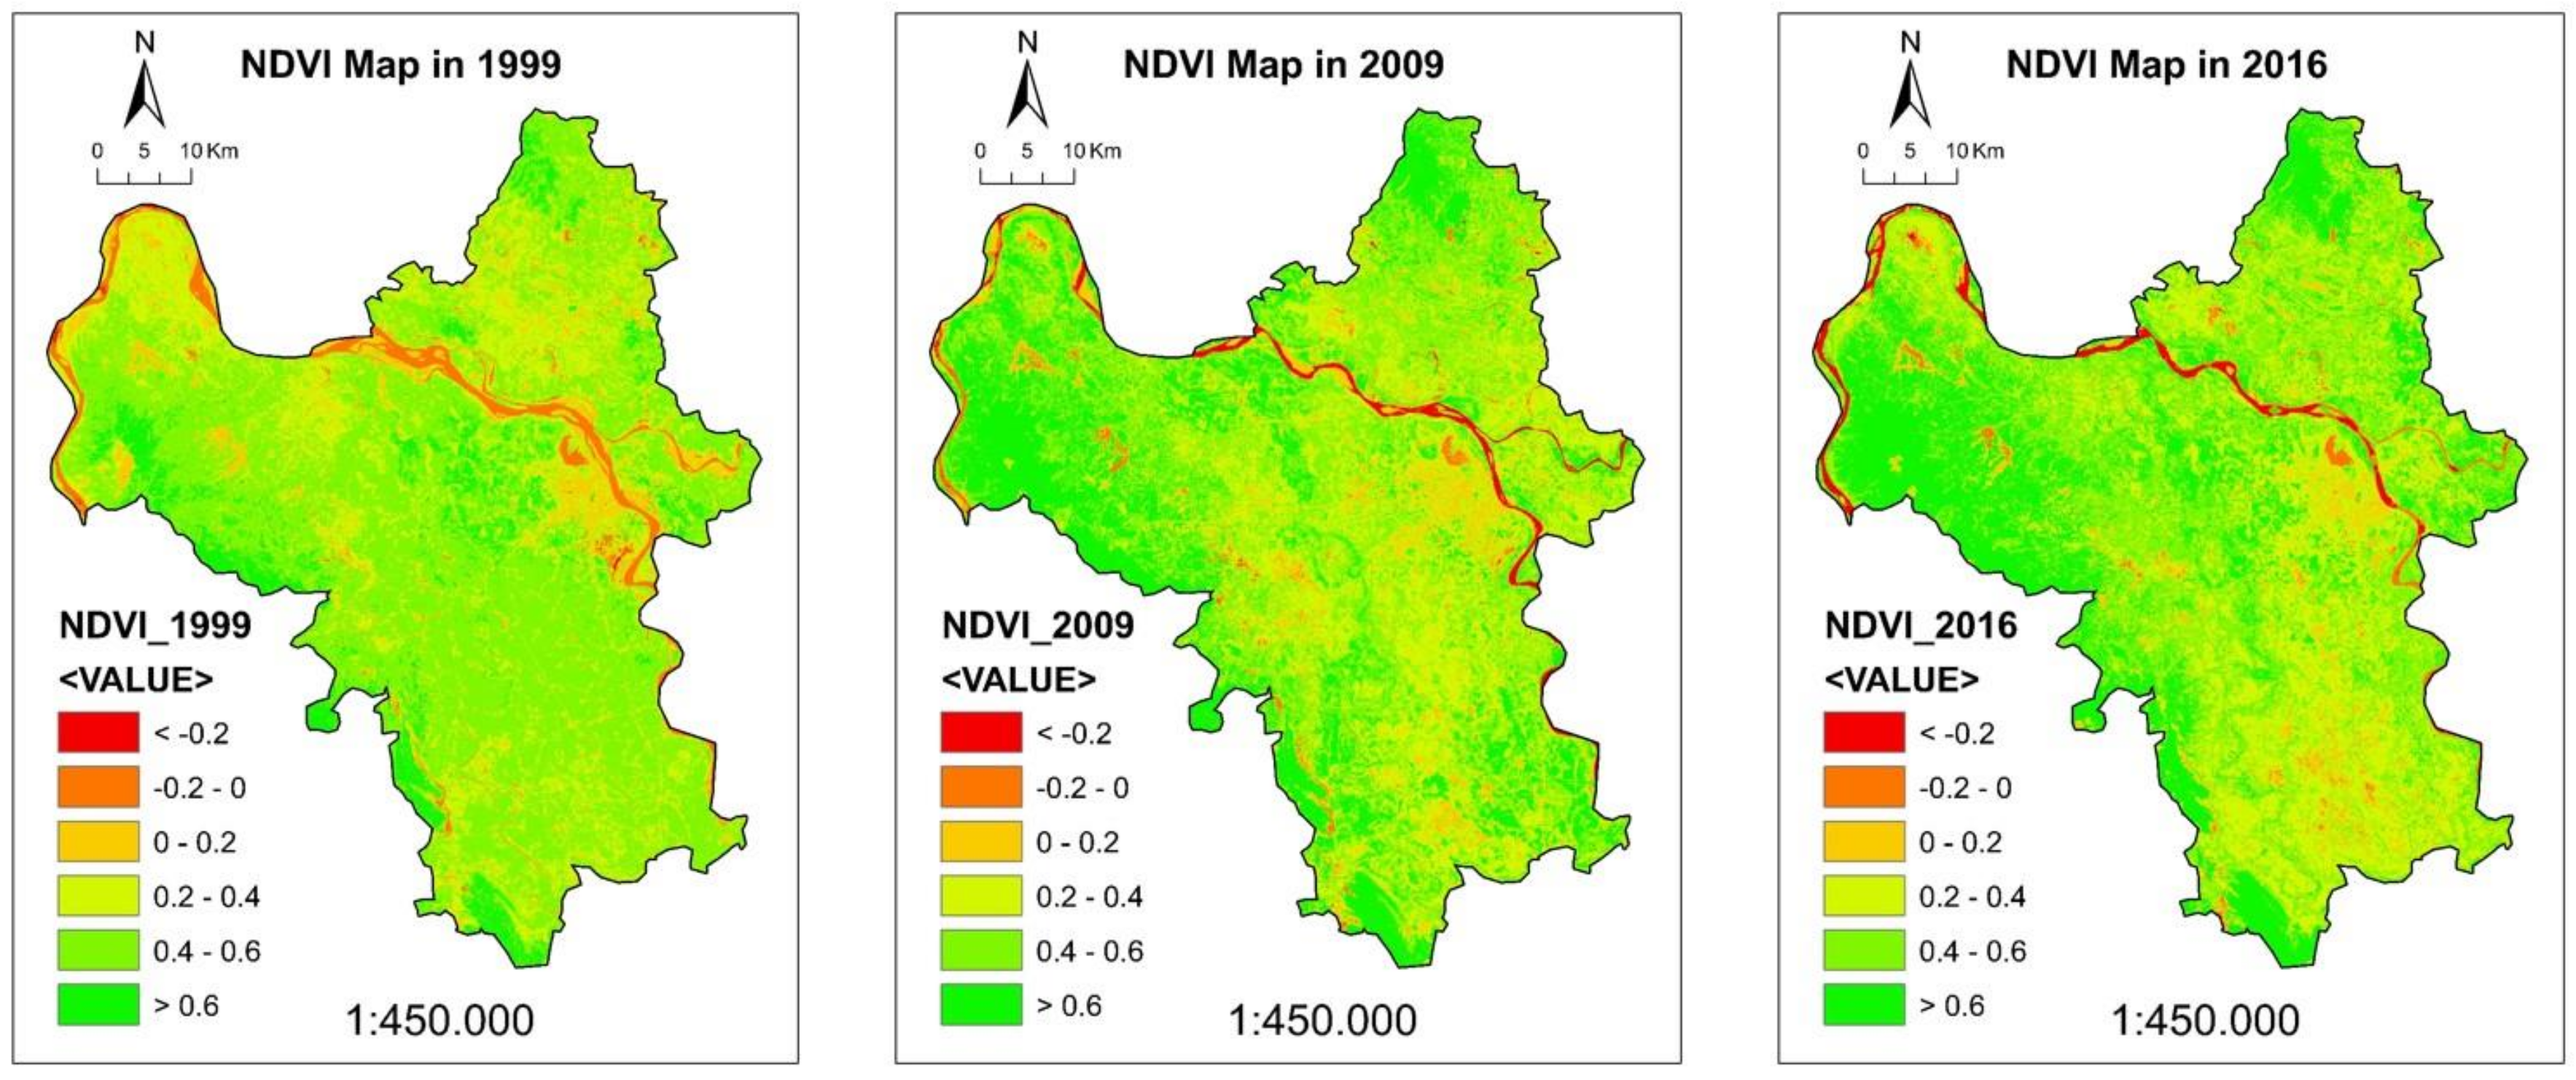
4.3. NDVI and NDBI Maps
Figure 7 presents the NDVI maps of Hanoi at the three times, 1999, 2009, and 2016, based on Landsat images. In all three time points, areas with higher NDVI values were mostly found in the forest and active agricultural land of Hanoi, and urban, inactive agriculture land, and bare soil areas have lower NDVI values. In 1999, bare soil accounted for a significant area in the northeast, which was the cause of low NDVI values in this area. By 2009 and 2016, areas with low NDVI values were found in the southern portion of Hanoi due to the influence of wetlands.
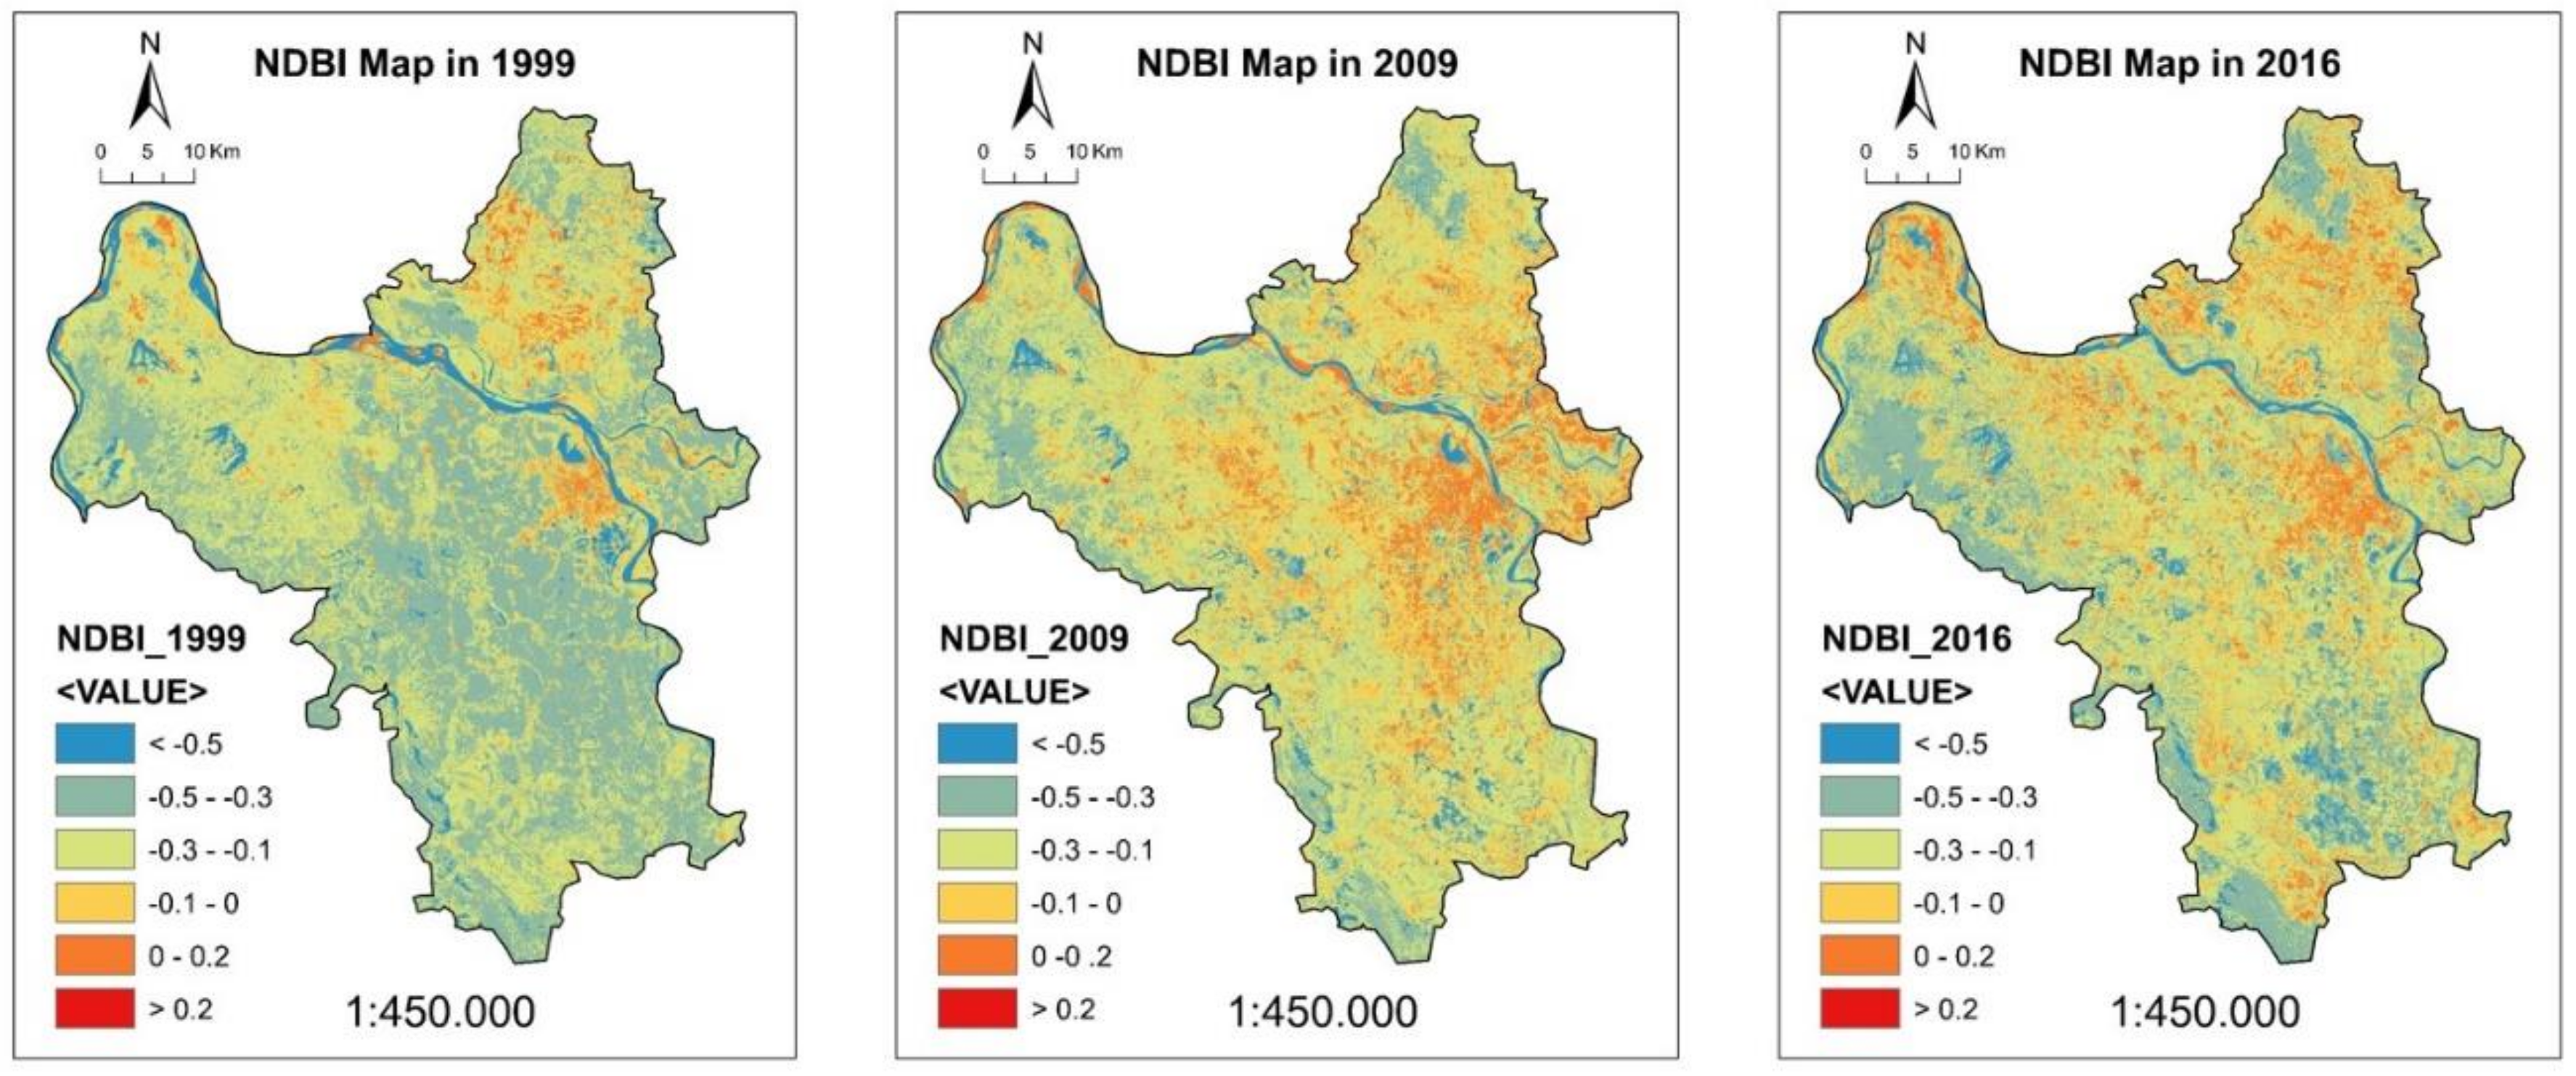
Figure 8 shows the NDBI maps of Hanoi at the three time points: 1999, 2009, and 2016. In all three time points, areas with higher NDBI values were found mostly in the city centre. When compared with the NDVI map in 1999, areas with high NDBI values were found in the northeast due to the effect of bare soil. By 2009 and 2016, the high NDBI areas extended beyond the city centre and towards the northeast of Hanoi. The fast extension of high building index areas in 2009 and 2016 was due to the high rate of urban development outside the city centre during this period, as mentioned previously.
4.4. LST Retrievals
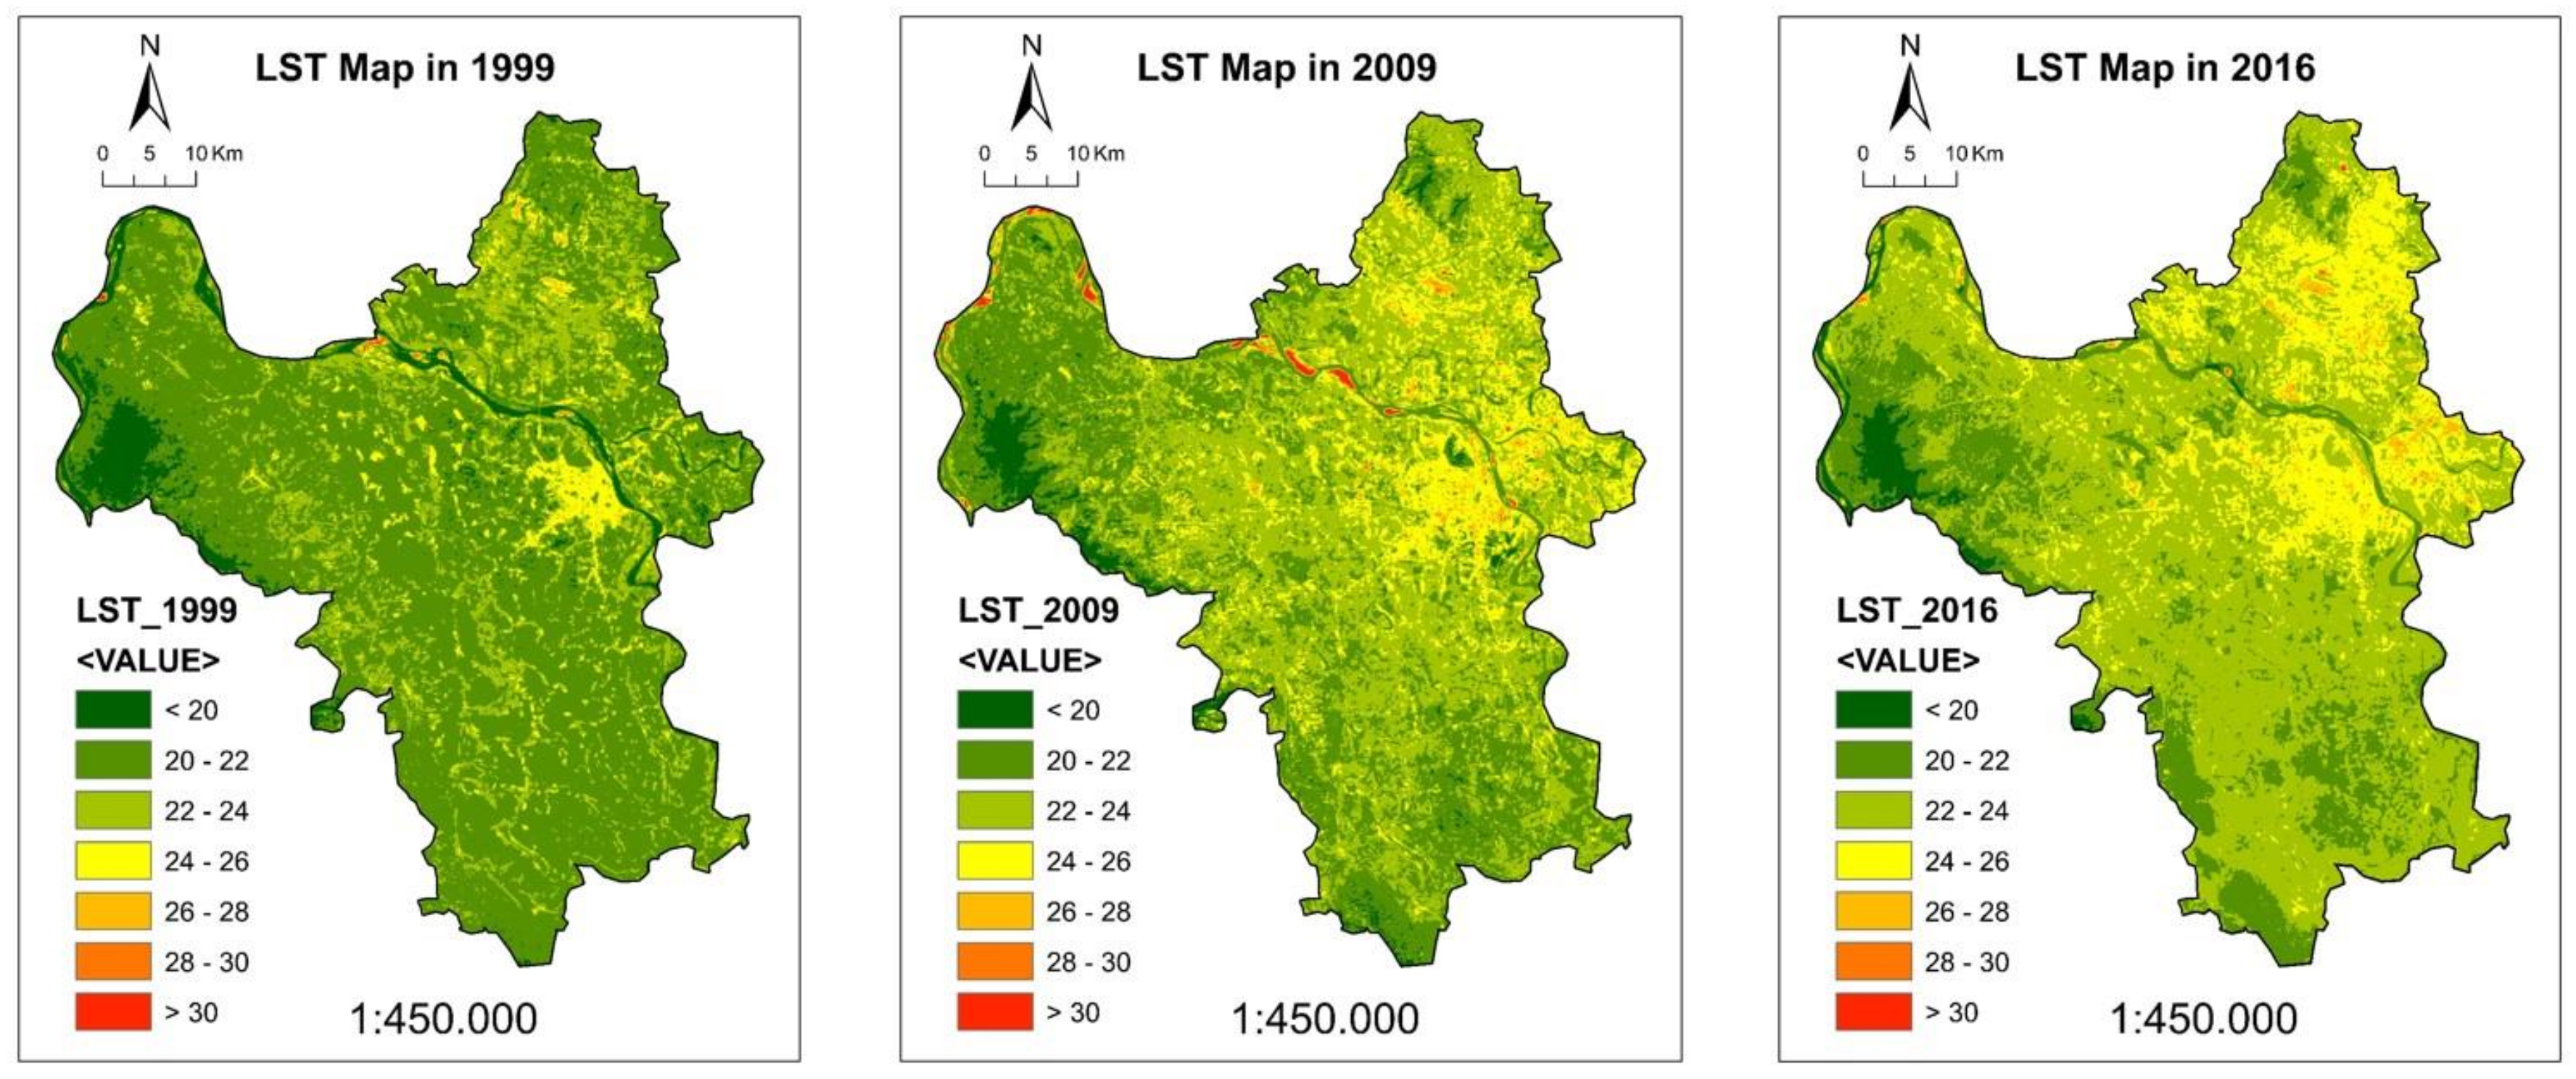
The spatial distributions of LST at the three time points (1999, 2009, and 2016) in Hanoi are also derived from the Landsat thermal images, as shown in Figure 9. In general, the higher LST values were mostly found along the city centre of Hanoi (> 24 °C) during all three time points. The city centre represented the most crowded residential area with a dense construction of buildings, resulting in an increase in impervious surfaces, such as asphalt, parking, and pavement areas in this area. The impervious surfaces increase solar energy absorption and transform this energy into heat. In addition, the thermal energy from industrial activities in industrial zones makes the surface temperatures in this area higher than those of the surroundings. Therefore, the LST in these areas is quite high when compared with the surrounding areas, where the location of the industrial zone reaches an LST greater than 30 °C. The rural areas have lower LST, which is most pronounced in 1999, with an LST ranging from 20 to 24 °C. Forest and water areas are always the lowest LST areas in all three time points, presenting an LST below 20 °C. In 1999 and 2009, high LST areas were mostly located in the core metropolitan region. Over time, the LST has tended to increase in areas around the urban core. In 2016, high LST areas had considerably extended towards the northeast, following the spatial pattern of LULC change. The LST in this area reached only 22–24°C in 1999, but in 2016 it rose to 24–28 °C. Furthermore, it is clear that the spatial pattern of NDBI is generally consistent with LST, whereas that of the NDVI is the reverse. These results indicate that the lower vegetation content in the city centre causes higher LST and NDBI values when compared with the surrounding areas.
Table 5 shows the results of LST validation at three time points. The air temperature data that were collected from four meteorological stations in Hanoi (Lang, Son Tay, Ba Vi, Ha Dong) were used to compare the LST obtained from the Landsat image. The differences between the air temperature and LST are in the range of 0.3°C to 3.34 °C. The difference is higher in urban areas, whereas the air temperature is closer to LST in rural areas.
4.5. UHI and Non-UHI Zone
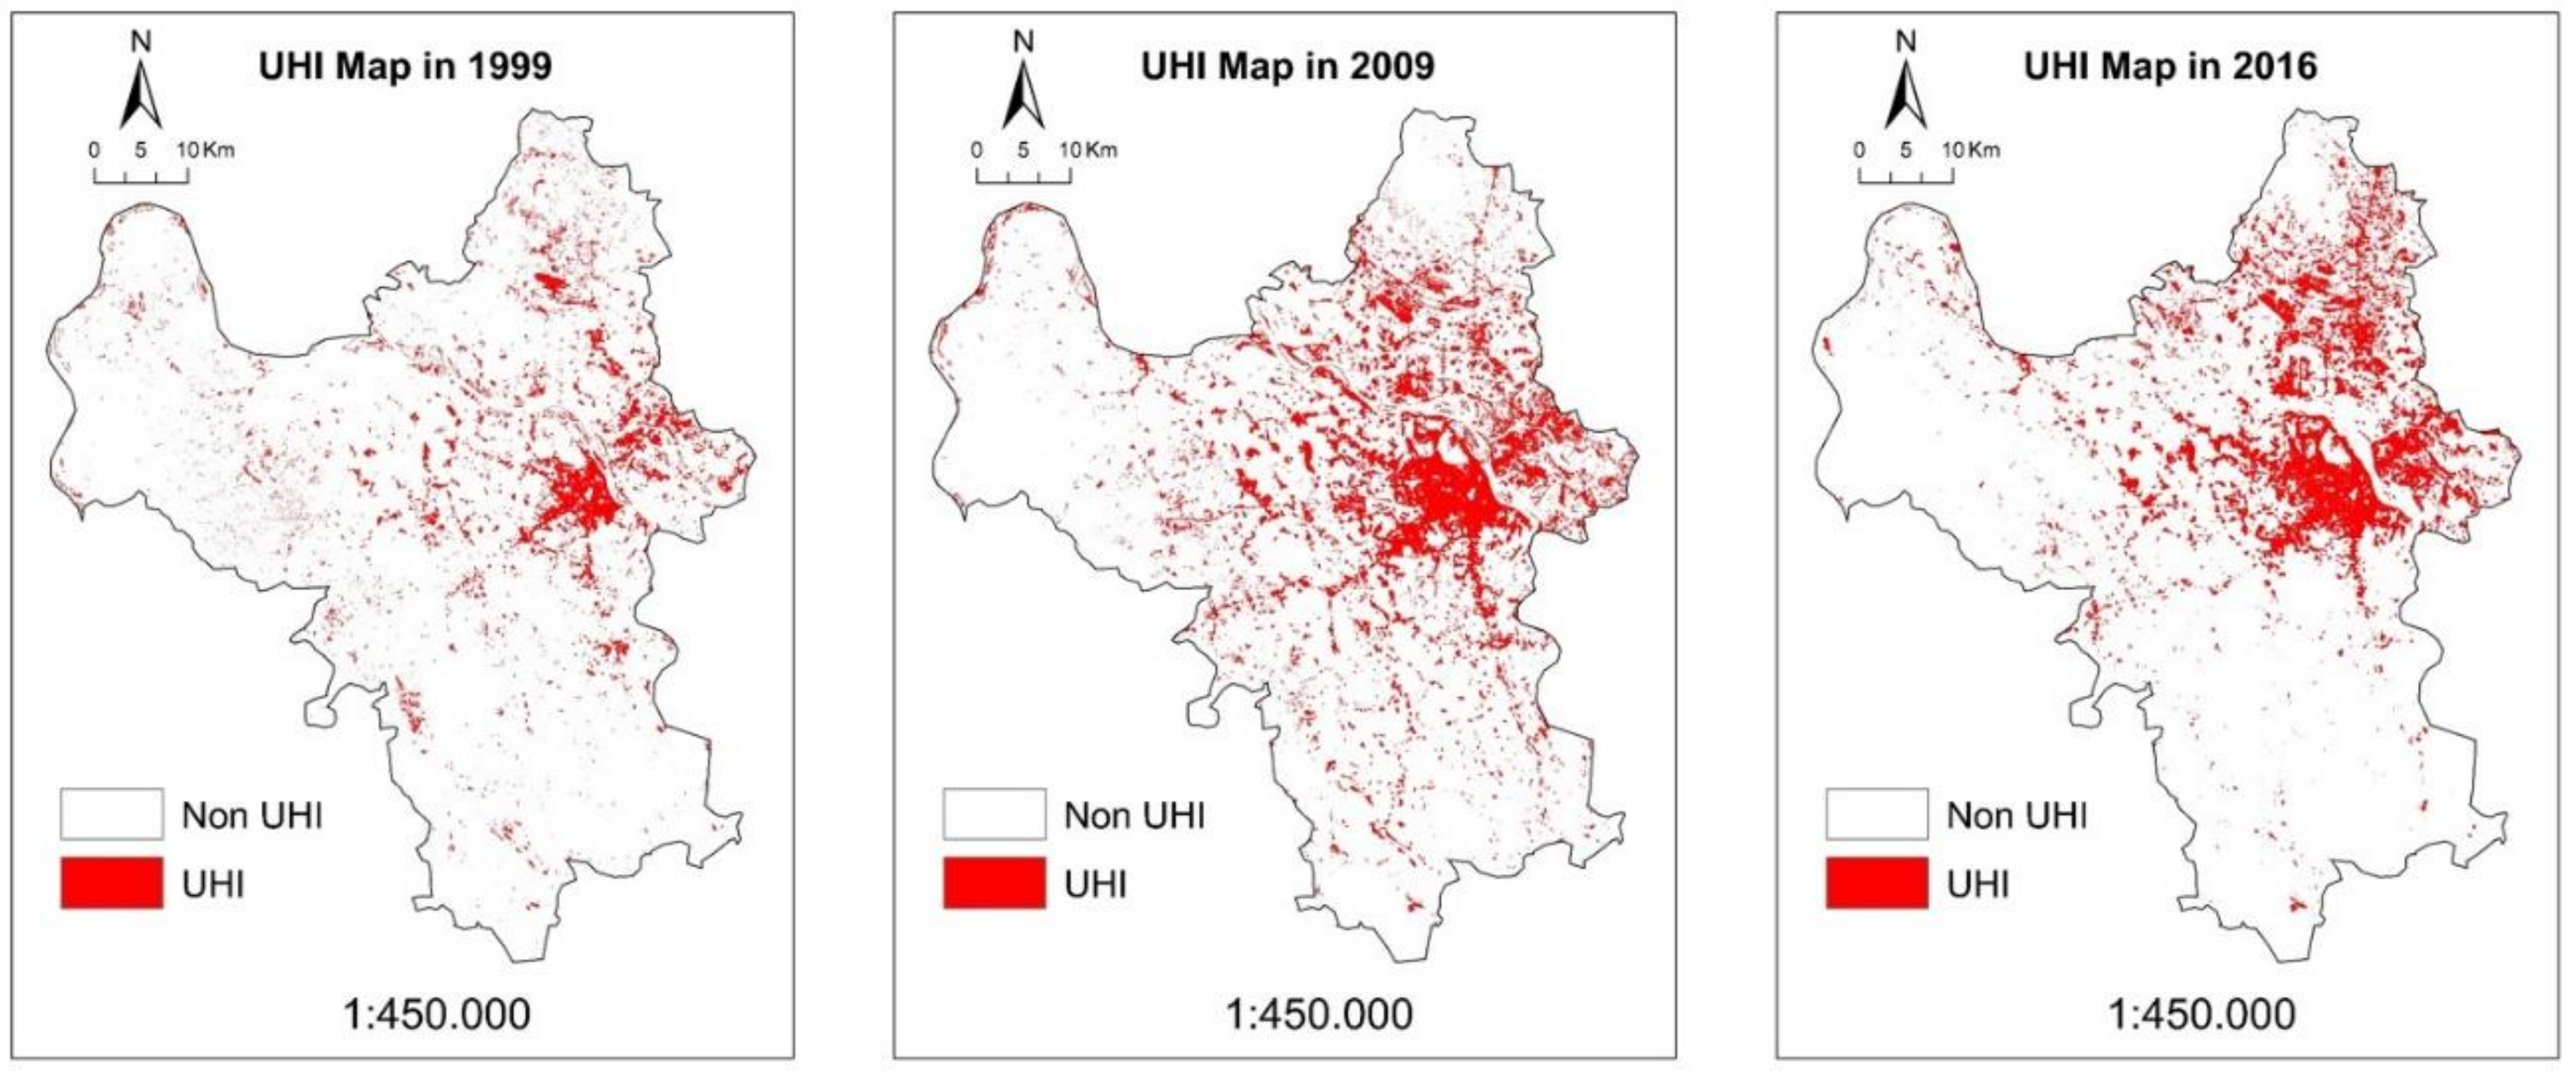
Figure 10 illustrates the identified UHI zones in Hanoi at the three time points of 1999, 2009, and 2016, and Table 6 summarizes the percentages in the area of the UHI zone. The spatial pattern of the UHI area was found in the metropolitan core zone. This area has expanded around the city centre over time and it grew to the northeast in 2016, following the spatial pattern of LULC and LST changes. In 1999, the UHI area only accounted for 10.98% and it has increased by 20.85% after 17 years, reaching 31.83% in 2016. It is clear that the UHI in Hanoi has expanded over time, and these changes are in line with the city’s growth trend in this period. In addition, the northeastern region of 2016 clearly shows the expansion of the UHI area. This result reveals the close relationship between the distribution of UHI and the development of land use and LST.
4.6. Association of LST with LULC
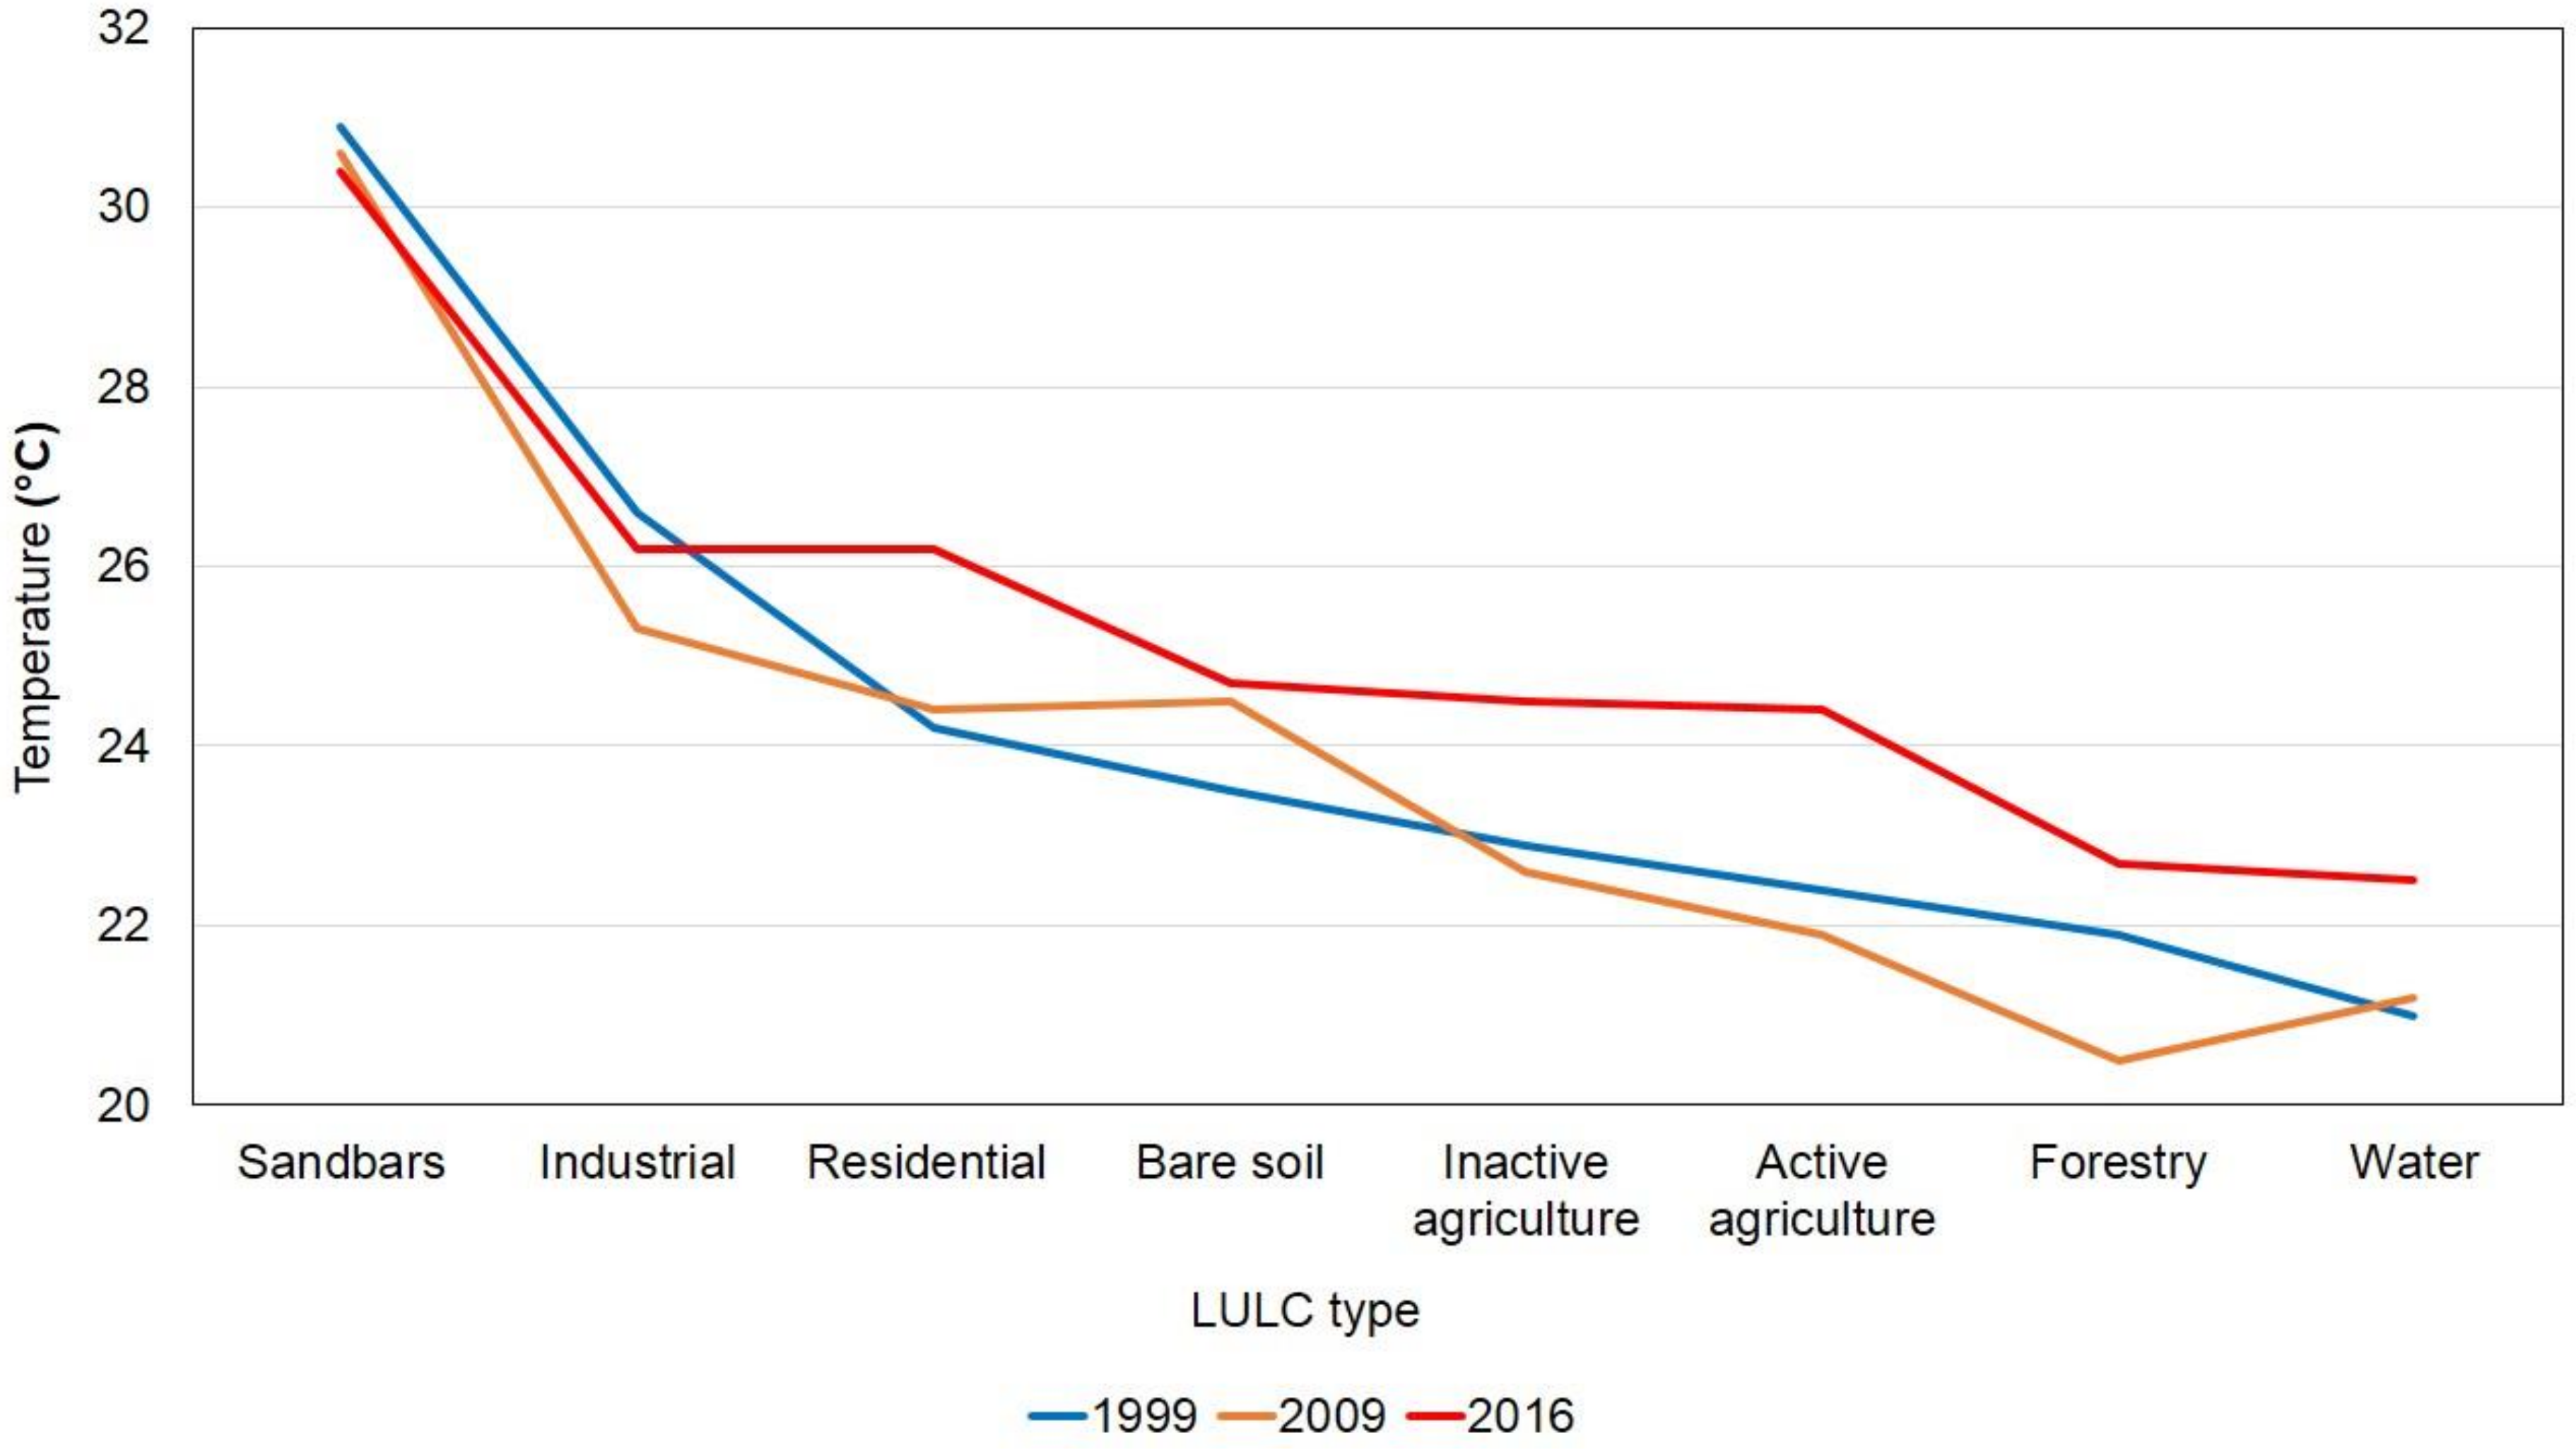
As shown in Figure 11, the association of LST with the LULC type in Hanoi suggests that the change in LST depends on different type of LULC. In all three time points of the study, sandbars, residential areas, and industrial areas were the three land use types with the highest average LST (greater than 24 °C). In general, the LST in built-up areas is 3°C higher than in agricultural land. The sandy areas can heat up rather quickly, reaching levels that are even higher than the air temperature. The sun direct hits sandy areas, and if the sand is dark, it absorbs all of the heat and does not reflect at all. Therefore, sand cannot reflect any sunlight away from itself and retain heat, leading to higher LST in those areas. Industrial and residential areas have high construction density, in which impervious surfaces are capable of absorbing large amounts of solar radiation and retaining more heat than other types.
In addition, these areas are heated by heat sources that are released from human activities, such as traffic and industrial activity, whereas areas that are covered by vegetation (namely, forest and agricultural land) have lower LST. Vegetation absorbs solar radiation for chlorophyll processing of chloroplasts, and evaporation of water from the leaf surfaces can absorb heat to aid in reducing the temperature of its surroundings. Trees produce a barrier effect by covering the space under the bushes, which can block solar radiation, thereby reducing the temperature of the soil surface and the air temperature below the tree foliage. This observation is also the reason for higher LST in areas that are not covered by vegetation. Finally, evaporative cooling is a physical phenomenon in which the evaporation of a liquid cools objects that are in contact within it or the surrounding environment, typically in the surrounding air. Therefore, in water areas or the areas that are affected by water (inactive agriculture land), the temperature decreases due to the evaporative cooling effect.
In brief, the results of surface temperature that were obtained from satellite images illustrate that LST is closely related to land use types. Water, forest, and agriculture land have lower LST, and densely populated residential and industrial zones and bare soil areas have higher LST, reaching values exceeding 24 °C.
4.7. Correlations between LST and NDVI/NDBI
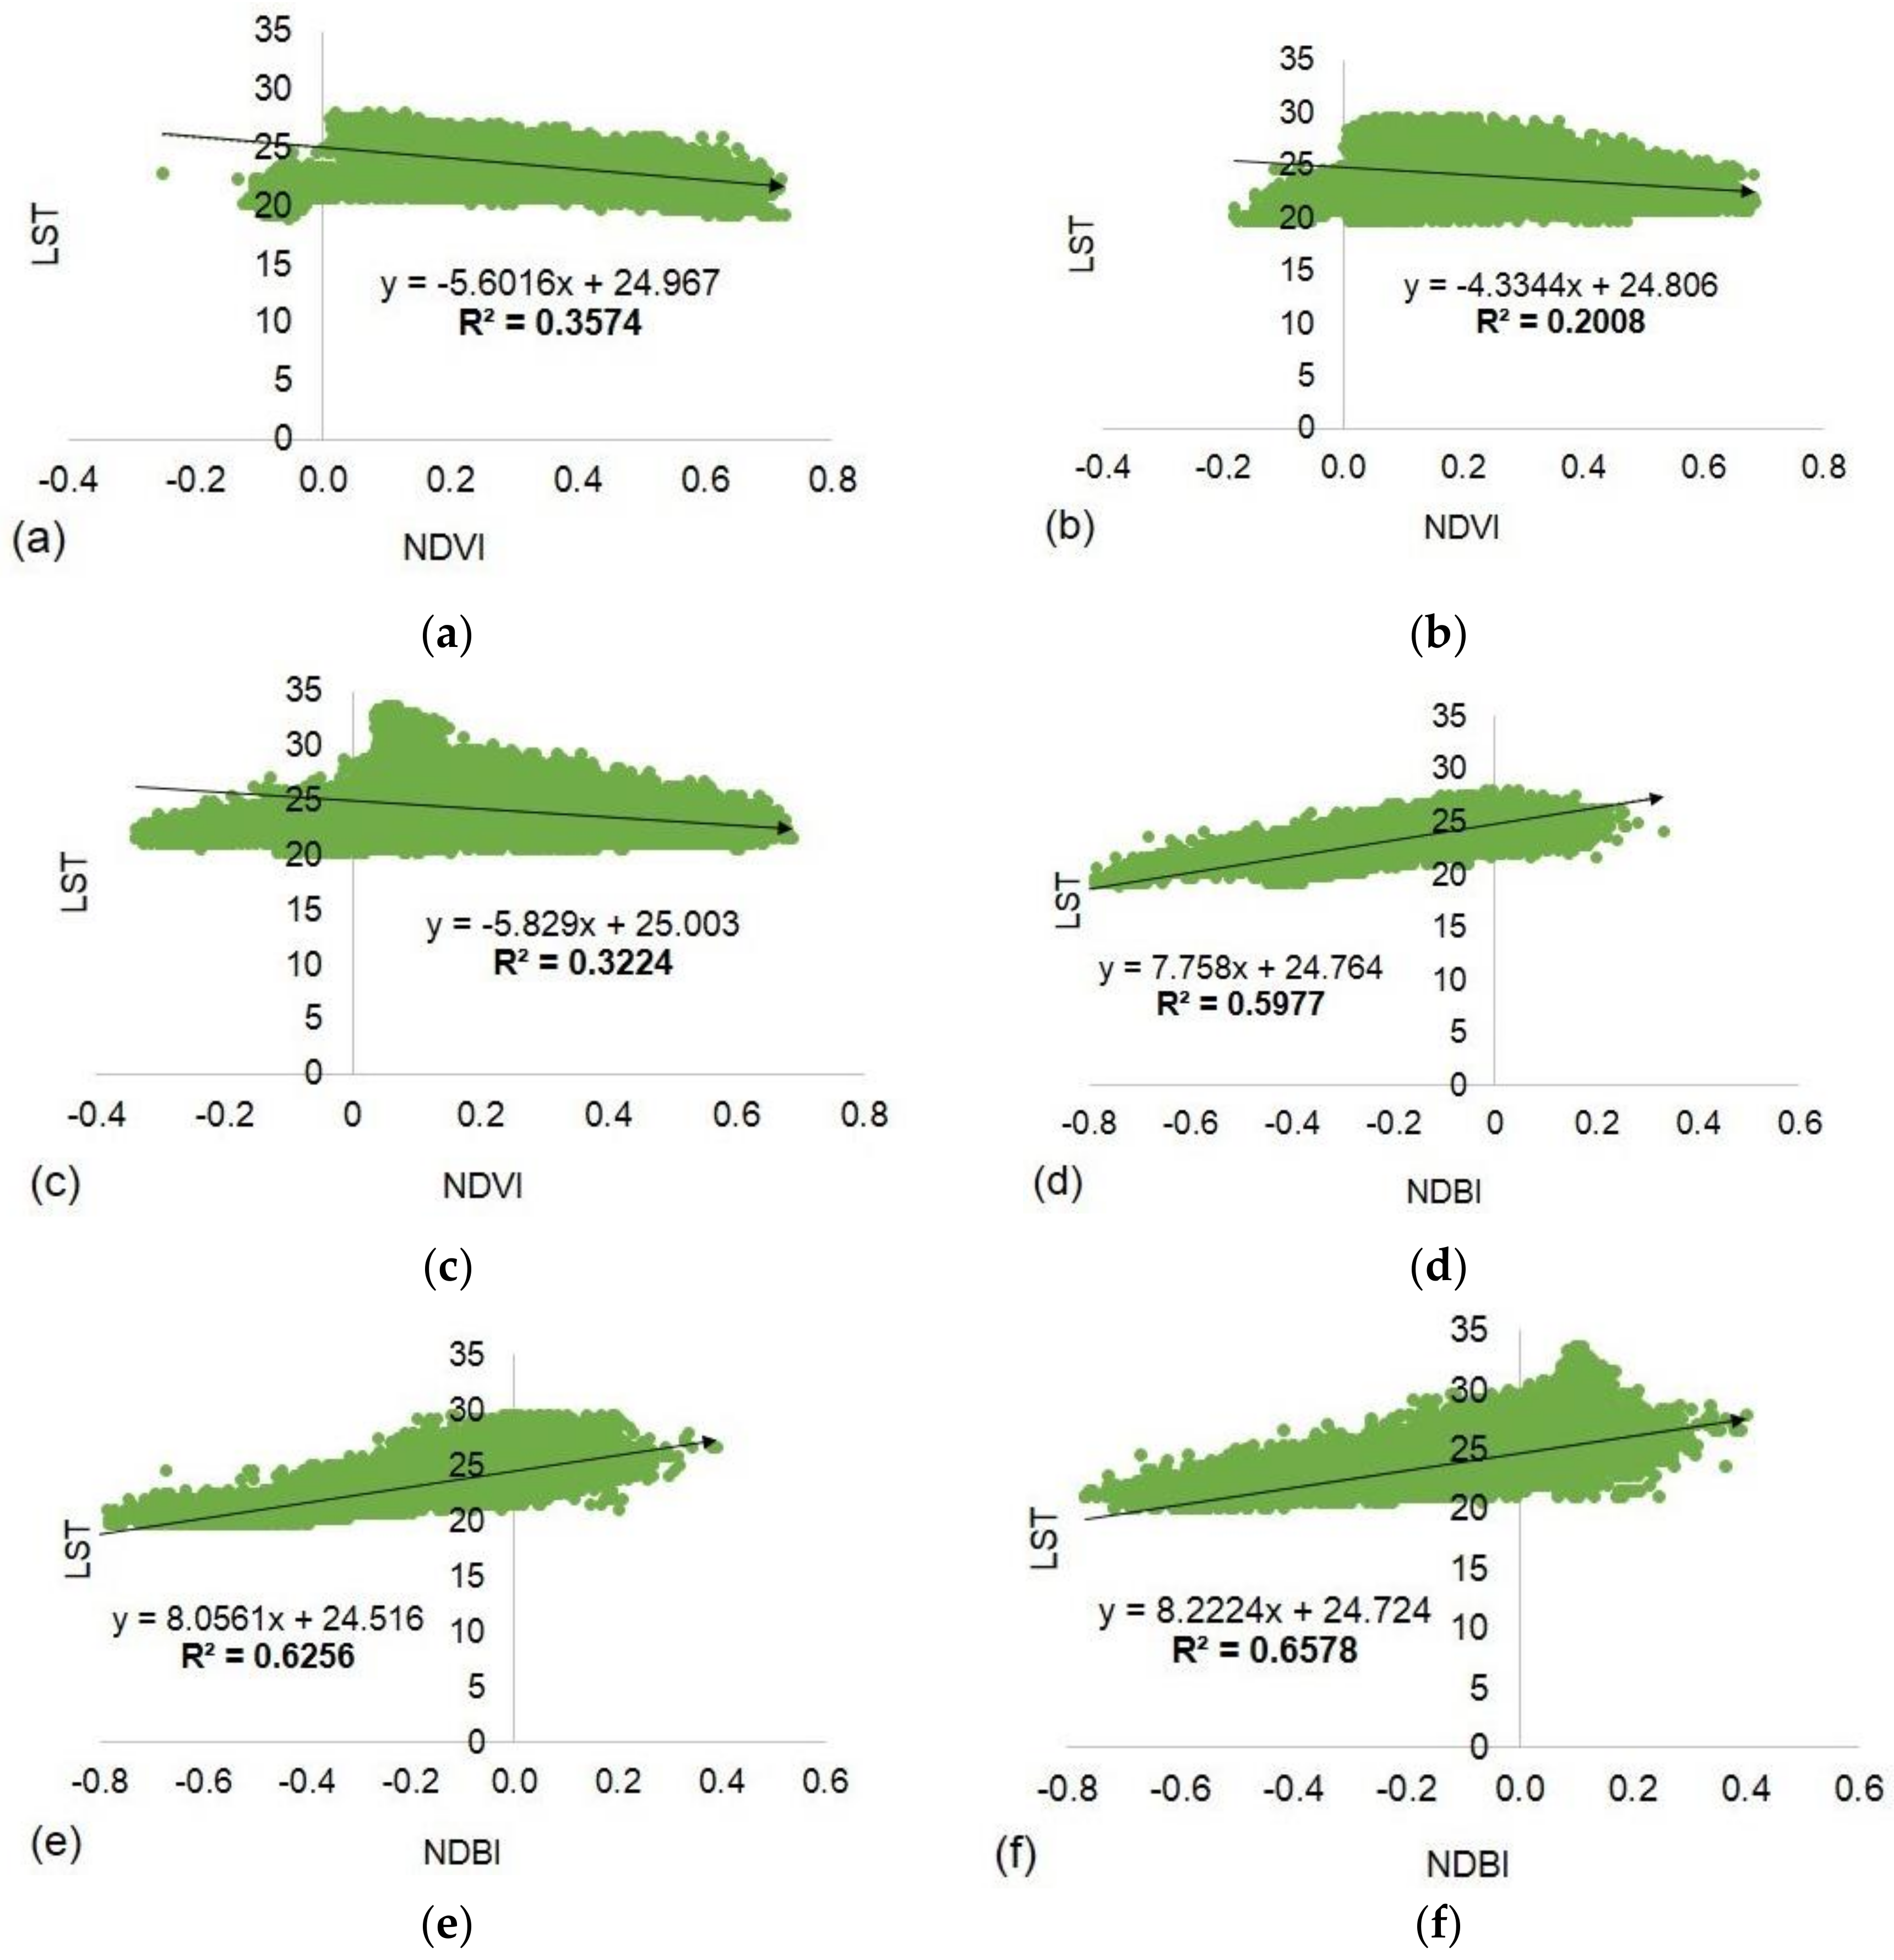
According to the scatter plots in Figure 12, the impact of NDVI on LST is weaker than the counterpart of NDBI, indicating that the explanatory power of NDBI is stronger than that of NDVI regarding of LST spatial pattern. Low correlations between NDVI and LST were observed for all three time points (1999: R2 = 0.3574, 2009: R2 = 0.2008, and 2016: R2 = 0.3224), due to the effect of the season. At all time points, the level of vegetation cover in the study area was not high (bare soil or inactive agricultural land accounted for most of the area), thus reducing the impact of the vegetation on LST. The correlation between NDBI and LST was low in 1999, which was perhaps because the area was still less urbanized. Therefore, urbanization in this area could drive this correlation to obviously increase in 2009 and 2016. The increasing of the regression coefficient (R2) between NDBI and LST indicates that the interpretation of NDBI on the spatial variations of LST became more sensitive between 1999 (R2 = 0.5977), 2009 (R2 = 0.6256), and 2016 (R2 = 0.6578), as the area became more urbanized. Furthermore, the positive correlation of LST with NDBI and the negative correlation of LST with NDVI were found across the three time points (i.e., 1999, 2009, and 2016), essentially confirming the influence of urbanization on the development of UHI.
4.8. Relationships between UHI and Urbanization Indicators in Hanoi
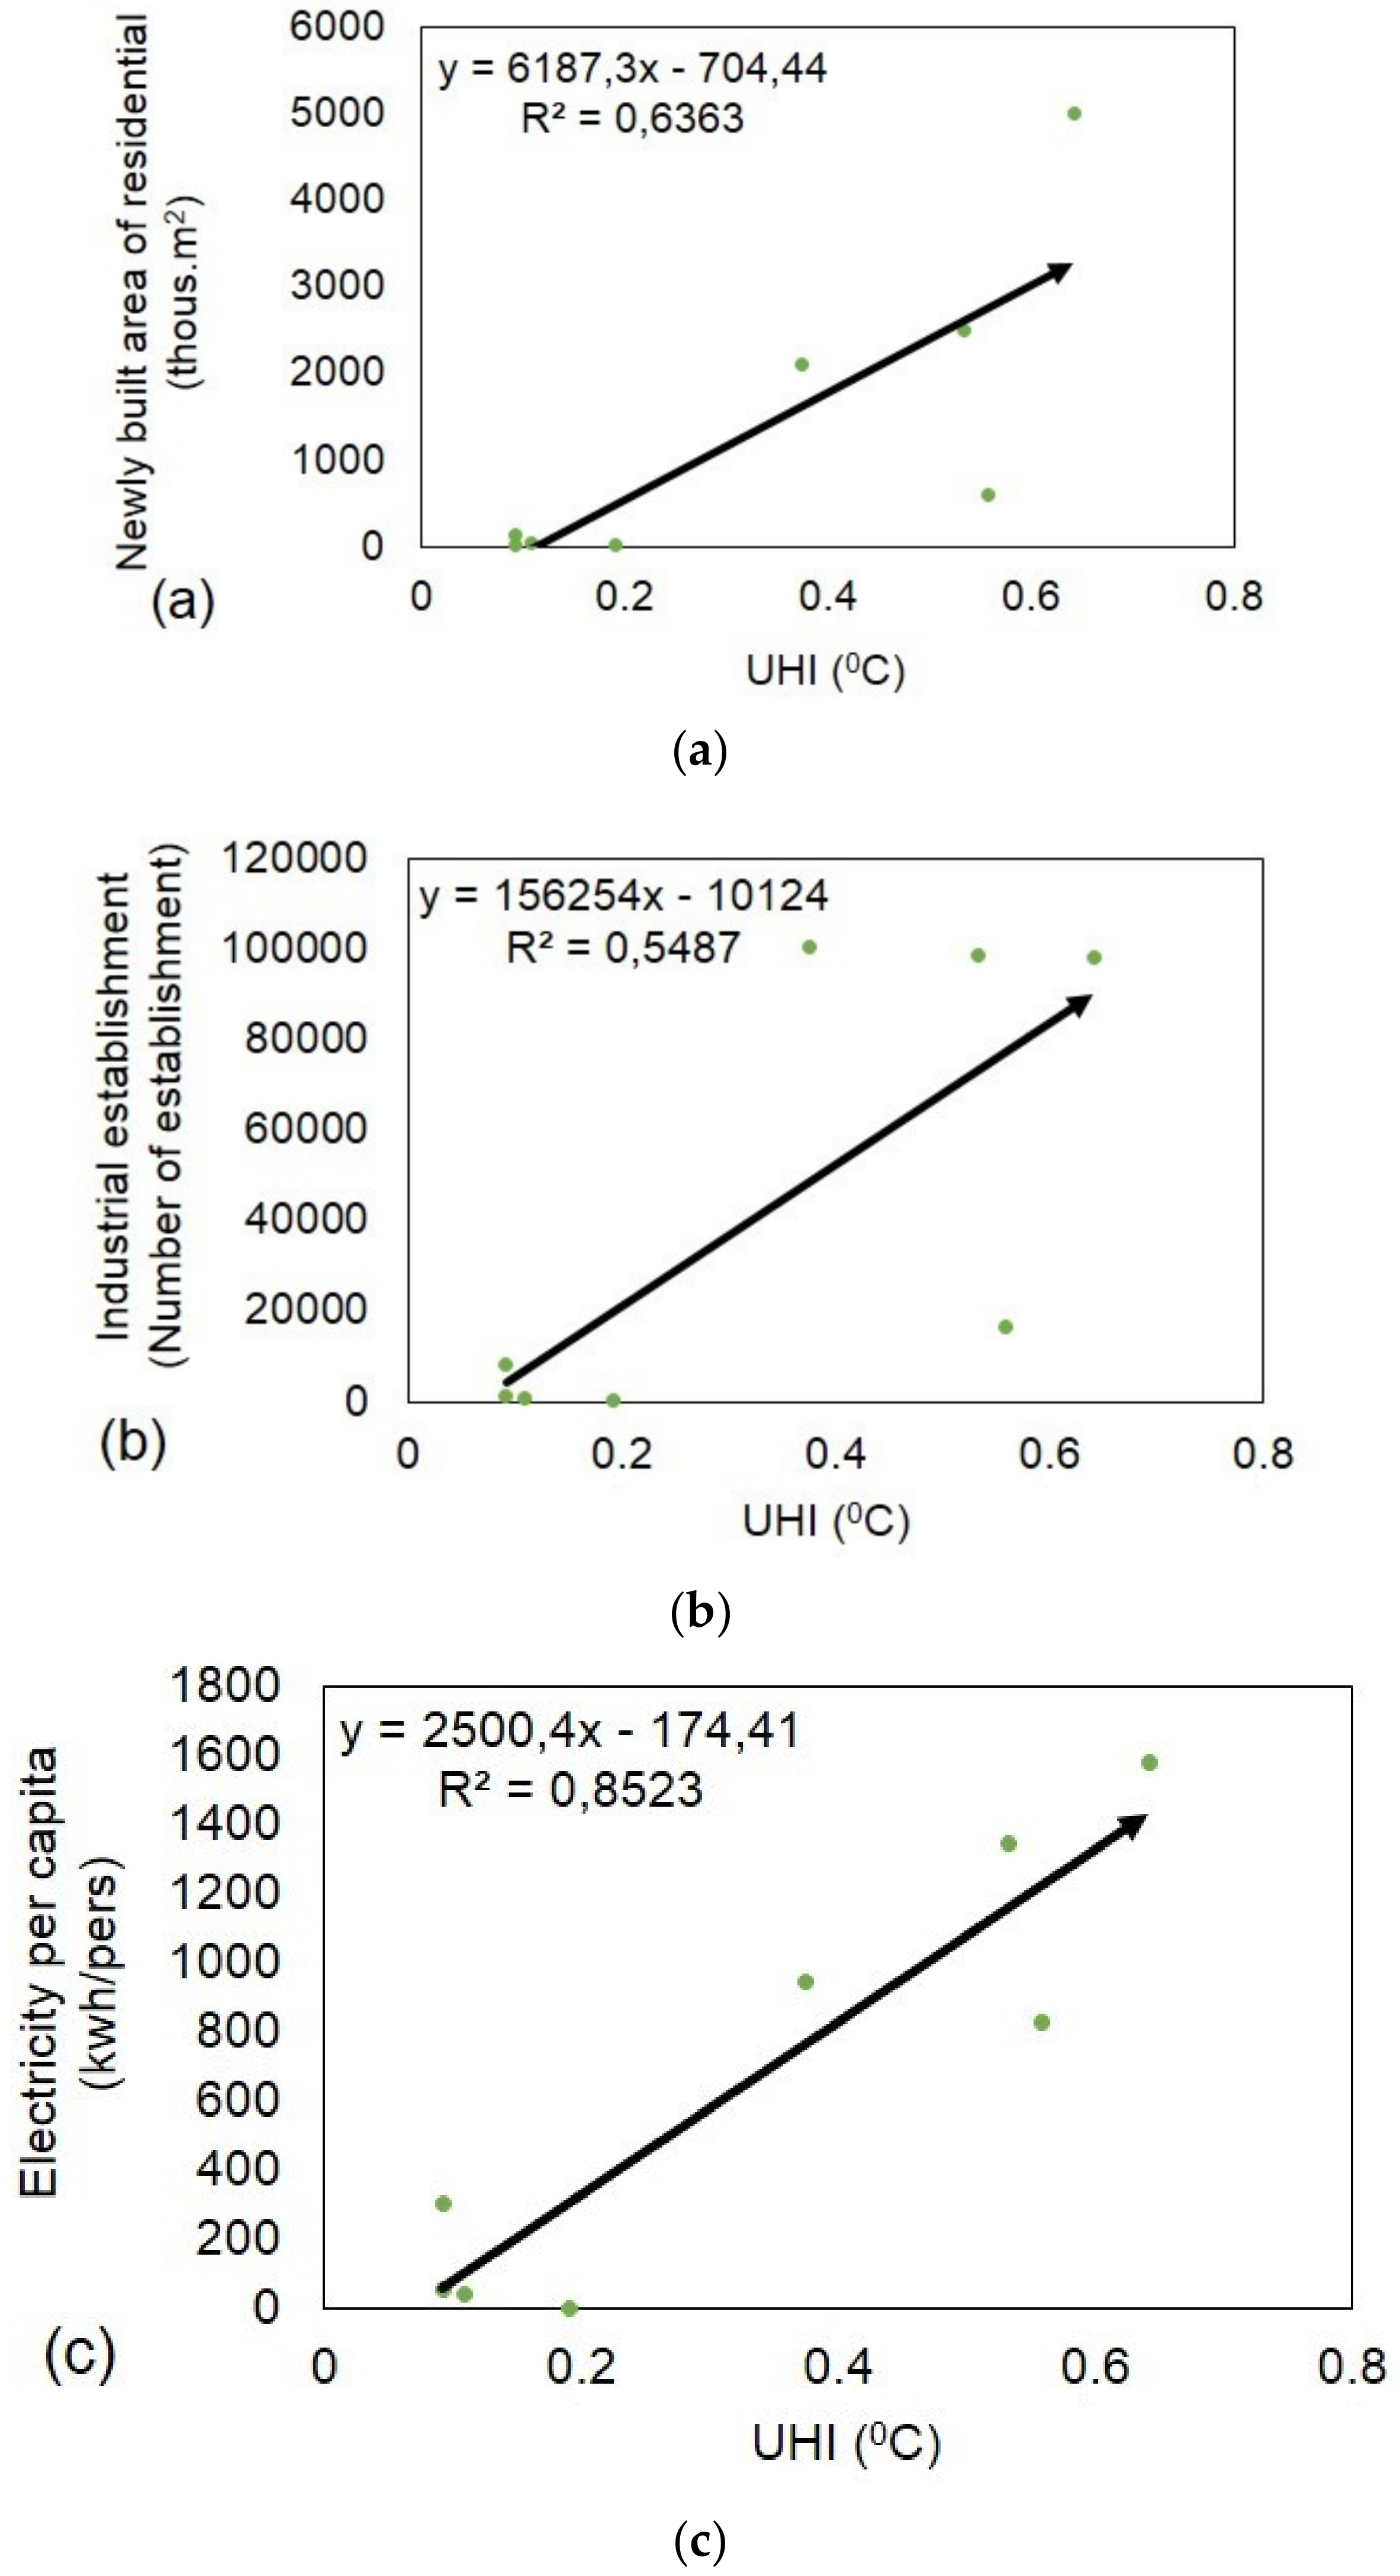
Figure 13 depicts the correlation between UHI and urbanization indicators in Hanoi during the period from 1960 to 2016. The significant positive relationship between the UHI index and the number of newly built areas of residential housing in the year (R2 = 0.6363) reveals that, when the newly built area of residential housing increases by one unit, this leads to a UHI increase of 0.0001°C (Figure 13a). The regression coefficient of the industrial establishment and UHI is R2 = 0.5487, meaning that, when industrial establishment increases by one unit, it leads to a UHI increase of 4E-06°C (Figure 13b). Finally, the strongest relationships were found between UHI and electricity per capita (R2 = 0.8523), which is equivalent to observing that an electricity per capita increase by one unit leads to a UHI increase by 0.0003°C (Figure 13c). These results imply that the growth in UHI was driven by the continuous increase in urbanization indicators.
4.9. Atmospheric UHI
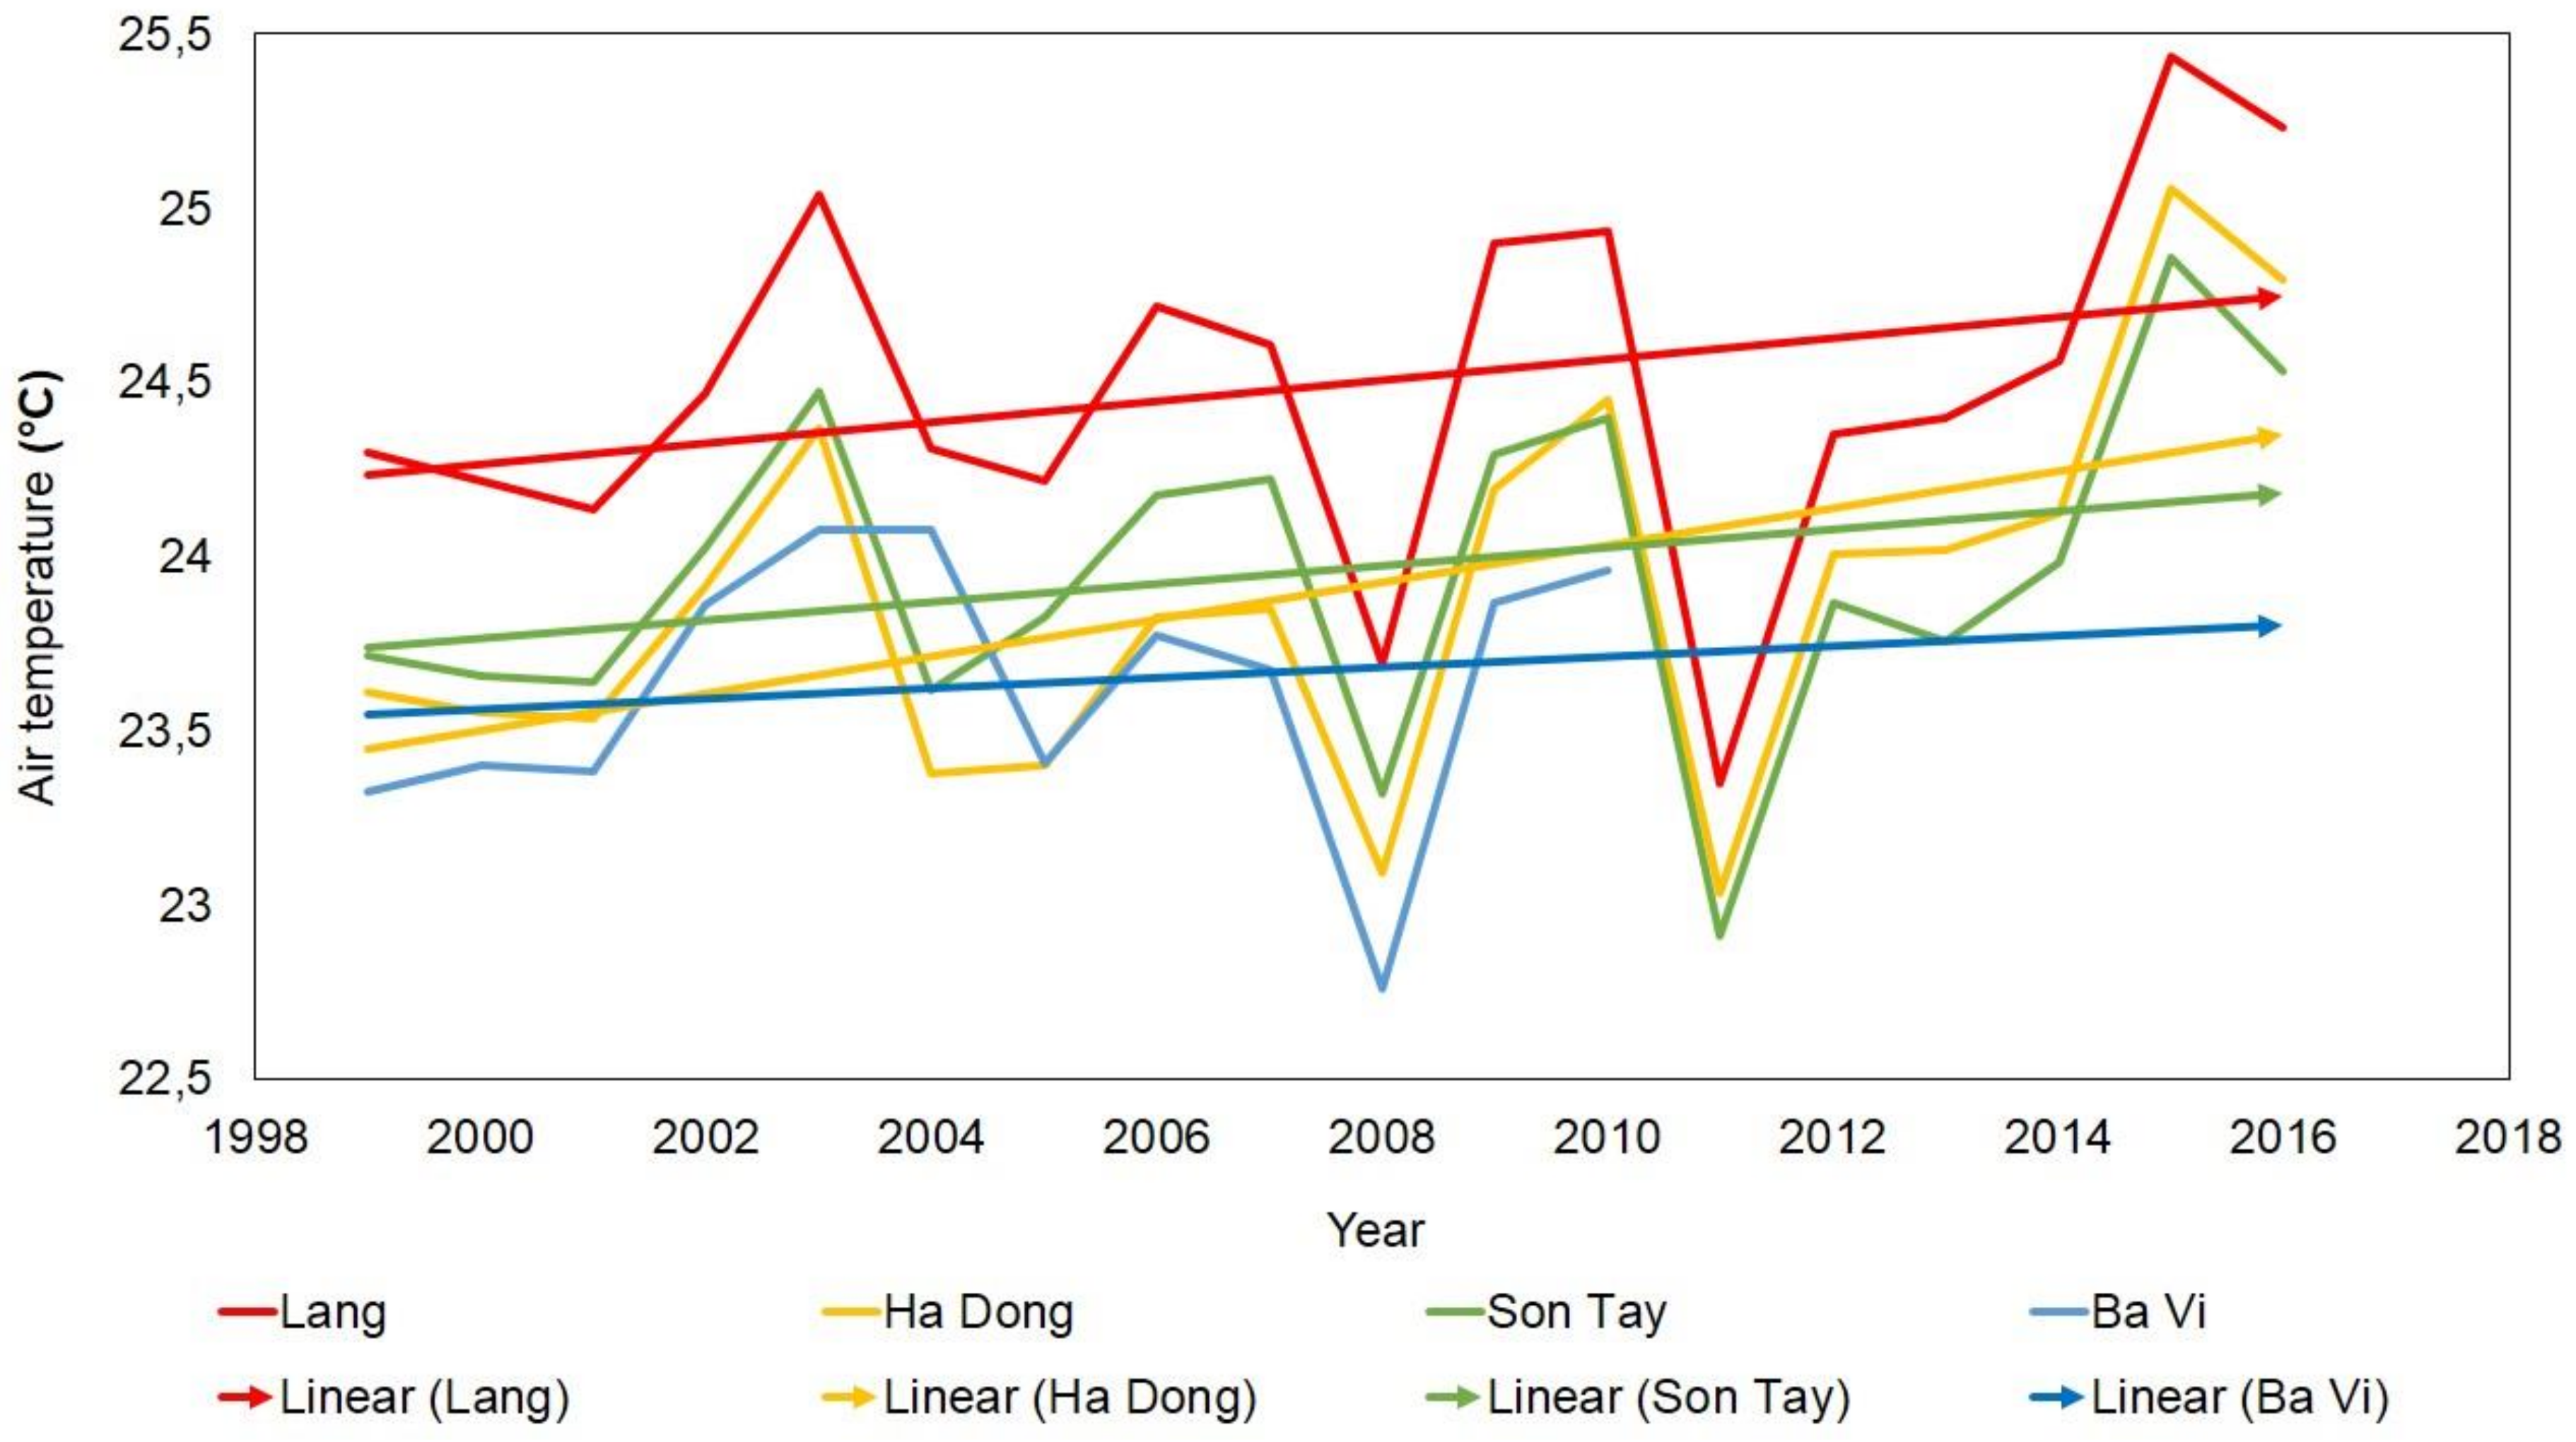
Figure 14 shows the annual mean temperature at four meteorological stations in Hanoi, with a trend of continuous increase over time from 1999 to 2016. The air temperature at the Lang station increased by 0.93°C after 17 years, from 24.3°C in 1999 to 25.23°C in 2016, which is an average increase of 0.052°C per year. At the Ha Dong station, in the same period, the air temperature increased by 1.18 °C, from 23.61°C in 1999 to 24.79°C in 2016, which is an increase rate of 0.066°C per year. The air temperature at the Son Tay station increased by 0.82 °C after 17 years, from 23.72°C in 1999 to 24.53°C in 2016, which is an average increase of 0.045°C per year. Finally, the air temperature at the Ba Vi station increased by 0.63°C after 11 years, from 23.32°C in 1999 to 23.95°C in 2010, with an increase rate of 0.057°C per year. More specifically, the highest increase occurred at Ha Dong station, which means that Ha Dong has the strongest changes of temperature over time. Ha Dong was transformed into an urban area after 2008, which has promoted the development of the area with an expansion of construction and population growth. This observation is one of the main reasons for the significant increase in air temperature in this area under the influence of human activities. Additionally, the Ba Vi station is located in a mountainous area that is away from the centre of the city, where the air temperature is cooler and the slowest increases occur over time.
Rapid urbanization is generally accompanied with a considerable increase in the number of buildings and a loss of vegetation cover in the entire city. Therefore, at the same time, the city is heated by sources of heat that are released from vehicles and from the machines of industrial and service activities, which leads to a warming of the air in the area that spreads to the entire city. Everyday traffic vehicles emit a large amount of emissions that greatly affect the temperature of the city. The large concrete structures and the dense plastic road surface that are used to create the city’s surface are different. These surfaces absorb a large amount of heat radiation from the sun such that the temperature rises rapidly. The high-rise buildings create a barrier, making it more difficult for fresh air to blow in and for air to move. These occurrences also cause the temperature of the city to increase. Vegetation includes all plants, from evergreen forests to grassy meadows and cropland, which control humility and temperature immediately around their leaves through transpiration. Therefore, plants have the effect of cooling the surrounding air and reducing the ambient temperature. It is clear that these are the main and potential causes for the increase in air temperature throughout the city, as well as the development of atmospheric UHI over time.
Figure 15 shows the increase of UHI in Hanoi from 1999 to 2016. Over the past 17 years, the air temperature difference between the two meteorological stations, namely, the Lang (urban station) and the Son Tay (rural station), has increased by 0.12°C (the differences are 0.58°C and 0.7°C in 1999 and 2016, respectively). Therefore, in each year, the difference in temperature has increased by 0.0065 °C. This result implies that atmospheric UHI tends to develop over time with higher increases in air temperature in urban areas.
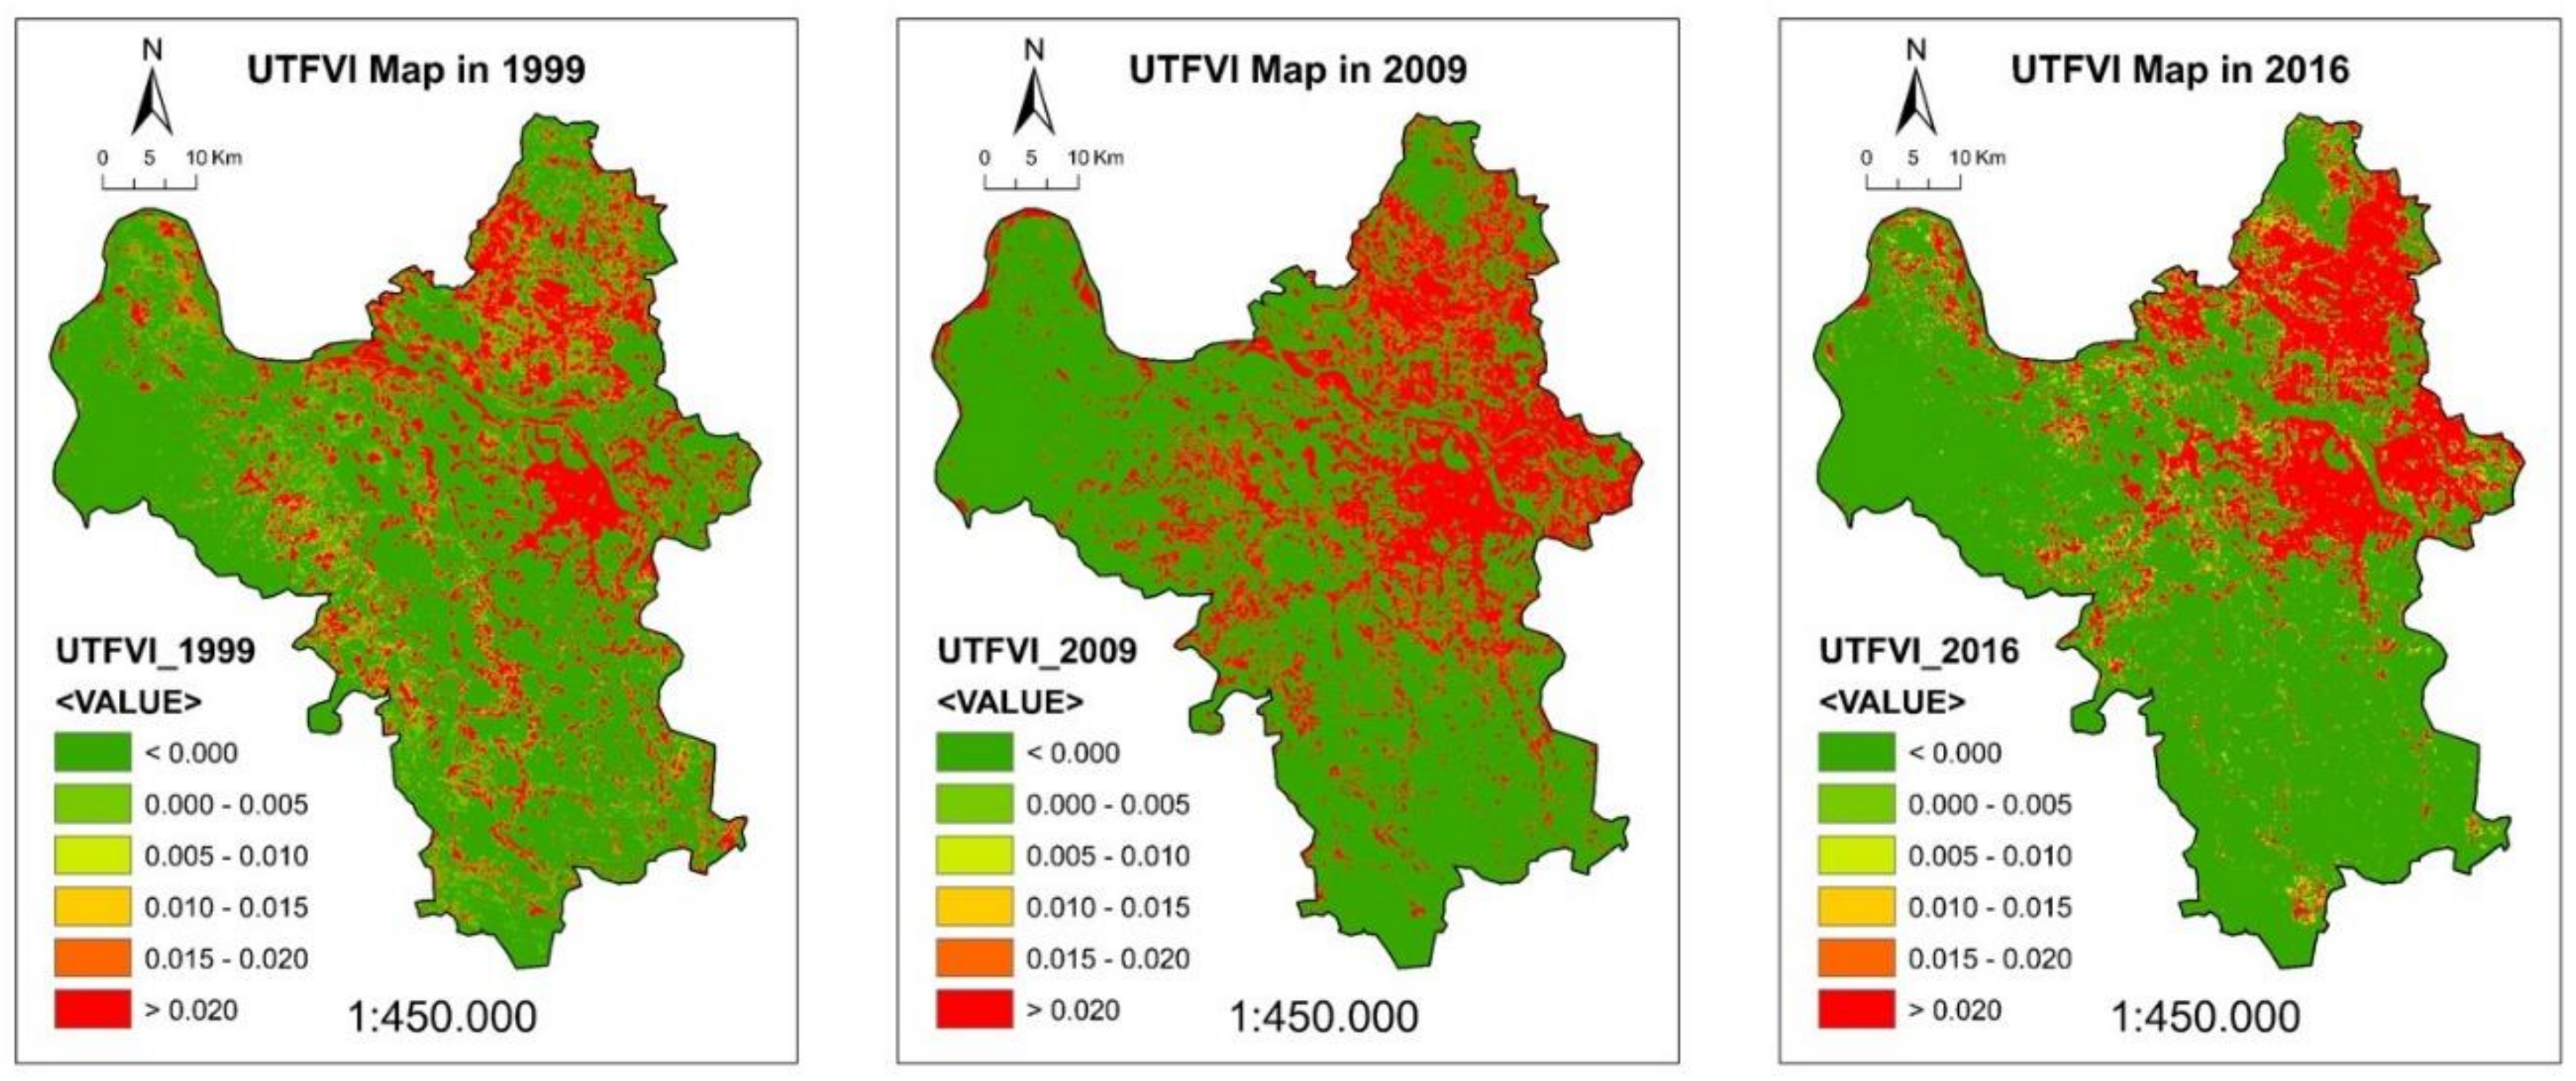
4.10. UTFVI Map in Hanoi
Figure 16 shows the result of quantitative ecological evaluation of the UHI effects in Hanoi at three time points. The various impacts of UHI were identified based on the degree of thermal comfort that is associated with the existence of UHI. The city experiences two degrees of thermal comfort: areas of worst heat condition (UTFVI > 0.02) and areas of excellent heat condition (UTFVI < 0). Generally, the larger portion of Hanoi has experienced good conditions for living, namely, the rural areas and those that are located in forestry and agricultural land. However, the areas affected by bad and worse conditions (UTFVI > 0.01) were relatively small and they were found at the boundaries of the residential area. More importantly, the area that experienced the worst heat condition was the city centre and bare soil areas. Similar to the spatial variation of LST, land use types, and UHI, the areas under pressure of the worst heat condition in 2016 significantly developed in the northeastern regions.
4.11. Variation of Regional Weather in Hanoi (1961–2016)
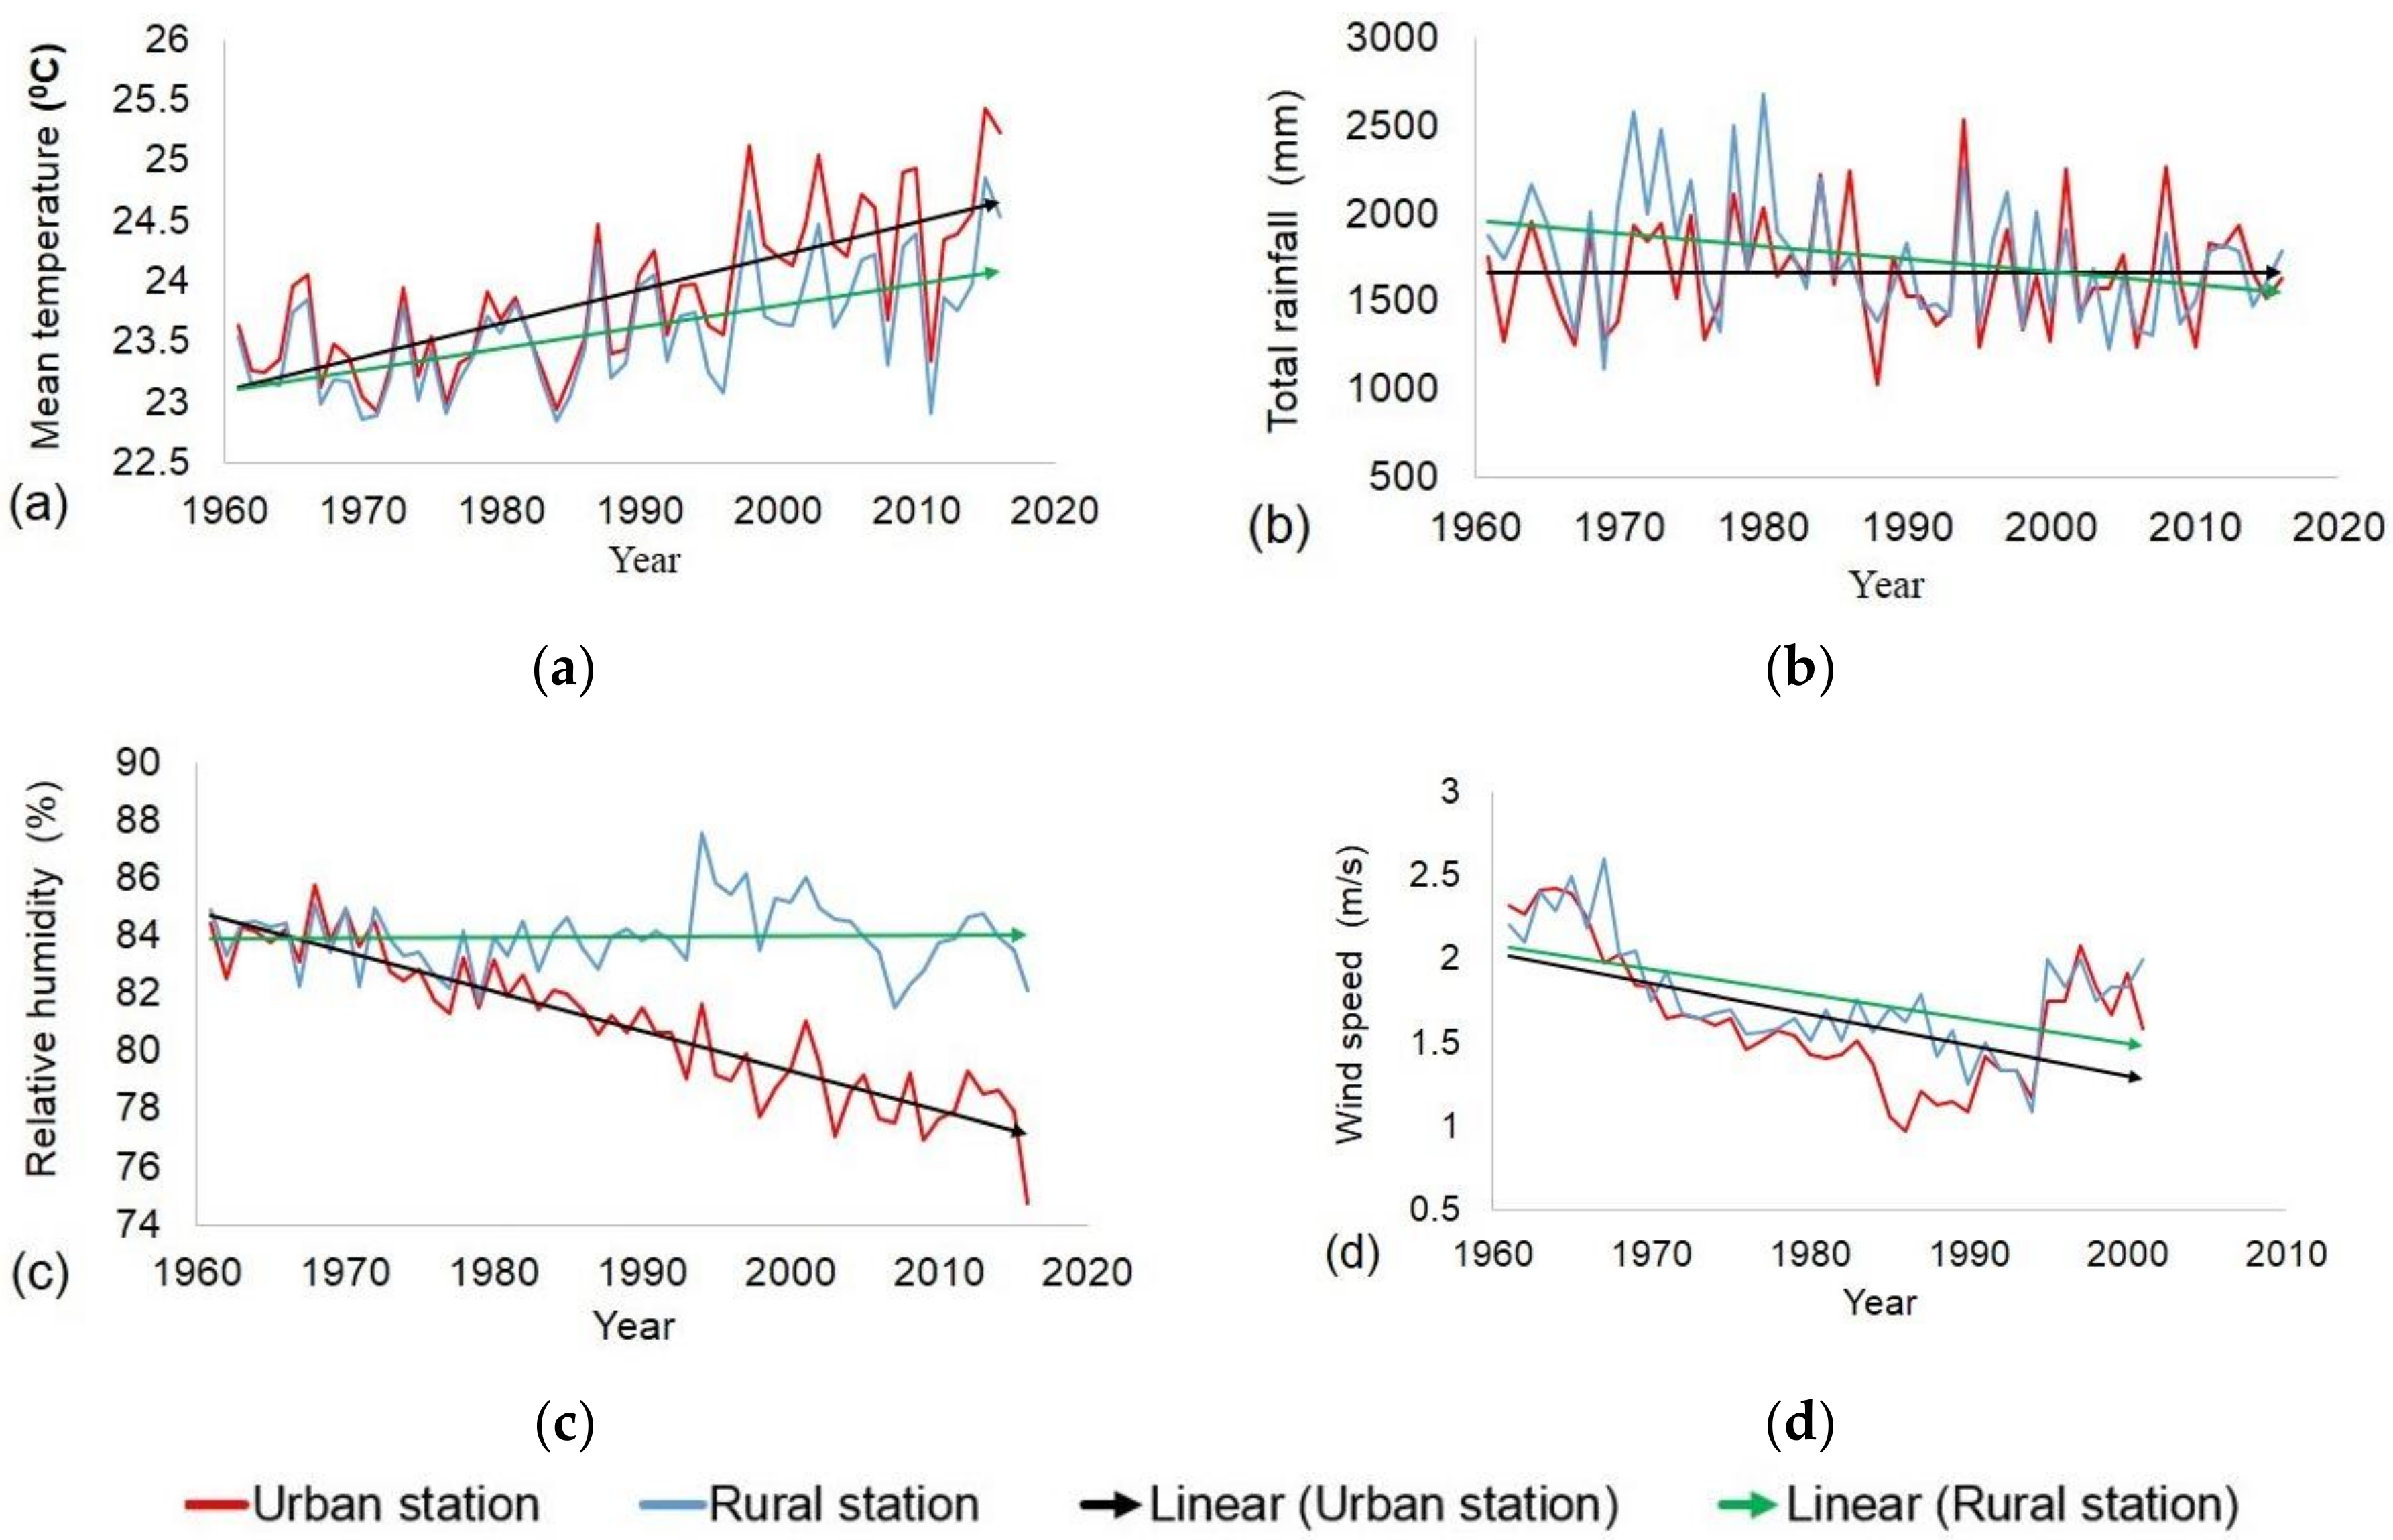
Figure 17 displays the variances in annual mean temperature, total rainfall, relative humidity, and wind speed at the Lang (urban area) and the Son Tay (rural area) stations during the period 1961–2016. Climatic factors, including annual mean temperature, relative humidity, and wind speed in urban and rural stations are all significantly increased with time, whereas rainfall does not change much in total.
The mean annual temperatures at both stations show an increasing trend over time after 55 years, i.e., those of the urban station increased by 1.6 °C, which is equivalent to an increase of 0.03°C per year, and those of the rural station increased by 1 °C, which is an increase rate of 0.02°C per year. The main explanation is the increases in construction density and impervious surfaces over time. In addition, waste heat from urban housing, transportation, and industrial activities as Hanoi became increasingly urbanized affected the increase in temperature in the two areas. The mean annual temperature at Lang station is higher than that of the Son Tay station during the study period. 0.09 °C was the difference between the two stations in 1961, and this value reaches 0.7°C in 2016. All of the abovementioned causes of temperature increases mainly occur in the urban areas (the Lang station), leading to relatively higher temperatures in the rural areas (the Son Tay station).
The mean annual relative humidity and wind speed show a decreasing trend over time. In the urban station, the mean annual relative humidity decreased by 9.67% after 55 years, which is equivalent to a decrease of 0.18% per year, and that of the rural station slightly decreased by 2.83%, an average decrease of 0.05% per year. A continuous increase of temperature and loss of vegetation cover in urban areas were the main reasons for the significant decrease in relative humidity. The wind speed in the urban station after 40 years decreased by 0.74 m/s, a decrease of 0.02 m/s per year, and that in the rural station decreased by 0.21 m/s, which is equivalent to a decrease of 0.005 m/s per year. The increase in construction activity, with larger numbers of tall buildings over time, is a potential cause of this phenomenon. Moreover, the mean annual relative humidity and wind speed at Lang station were higher than those of the Son Tay station during the study period, showing the difference between the urban and rural areas. The difference in relative humidity between the two stations in 1961 was 0.5% and it increased to 7.33% in 2016. The difference in wind speed between two stations in 1961 was 0.12 m/s and it increased to 0.42% in 2016.
5. Conclusions
Urbanization and its impacts on the environment are essential issues for sustainable development in Hanoi. Consequently, further measures are highly necessary to reduce UHI impacts and to maintain the quality of urban life for Hanoi residents. Based on this study, it is obvious that the distribution of the SUHI phenomena is responsive to the city’s LULC and LST distribution. In general, a difference of 6°C exists between the low SUHI intensity areas in rural areas and the high-intensity areas in the metropolitan core area. From 1999, in the northeastern region, the average LST fluctuated by only 22°C, but then dramatically increased in 2016, reaching 25°C. The results indicate that urbanization has created impacts on the development of the SUHI in Hanoi during the period 1999–2016, and suggest that Hanoi is likely to develop a new potential SUHI area in its northeastern region in the future. In addition, the continuous increase in air temperature at the meteorological stations reveals the accelerated atmospheric UHI phenomenon in the city. The positive correlation between the socio-economic indicators and UHI suggests that UHI constantly grows, being driven by the increasing newly built area of residential housing (R2 = 0.6363), the number of industrial establishments (R2 = 0.5487), and electricity per capita (R2 = 0.8523), as well as population expansion.
Urbanization has also created effects on the climate and environmental indicators in Hanoi, which directly influence people and their quality of life. Ranges of heat comforts were investigated according to UTFVI, with the measurement of the urban ecological quality of life. The city experiences both good conditions of thermal comfort and bad conditions of thermal discomfort. Due to the cooling effects of the vegetation, the rural areas of the city experience normal to good heat conditions for living. However, bad to worse heat conditions are detected in a large area of the city, illustrating the potential impacts of the UHI phenomenon on urban quality of life, specifically in the urban core, residential areas, and the bare soil areas of the city. Both the urban and rural areas recorded an increase in temperature and a decrease in wind speed, with larger changes appearing in urban areas. A decreasing tendency was found for total rainfall and relative humidity in rural and urban areas. It can be observed that urbanization, in general, and UHI, in particular, have direct impacts on climate change in Hanoi. The most susceptible factor is relative humidity (decrease of 0.18% per year), followed by temperature (increase of 0.03°C per year) and then wind speed (decrease of 0.02 m/s per year) in urban areas.
In summary, the overall results indicate that urban development and its environmental effects and impacts have imposed pressing problems and new challenges for the sustainable development of an increasingly urbanized Hanoi. These challenges must be the focus of additional attention and corresponding measures from city administrators in the years to come. It is suggested that the development plans of constructing a new satellite city should take the context of negative impacts of urbanization in terms of the evidence provided in this study into account in the future. Obviously, with the goal of sustainable development, urban development must be associated with concerns regarding protecting green vegetation. Characteristics of agricultural areas in each municipality, which affect the production and employment capacity, thus directly impacting both the demographic flow and the value of real estate [39]. Moreover, the temporal development of socio-economic and demographic variables that characterize an expanded urban area are complex and hard to predict [40]. Therefore, population allocation, construction of industrial zones, and planning of land use types are the issues that are worthy of attention and need to be addressed in close relation with the development of the new urban zones. More importantly, with the UHI areas that are already detected, they are fully capable of reducing and restoring in the future based on the sustainable development policies from city policymakers.
It is worth noting that an efficient approach of integrating multiple satellite observations and ground-based measurements in exploring the impacts of urban sprawl on other aspects of the environment has been presented in this study. The results from the Landsat images provided evidence of spatial distribution and the capacity to closely monitor urban development and the SUHI region over time. The association with ground-based measurements and socio-economic indicators facilitates detailing the context of UHI phenomena and the variations of metropolis weather in the study area. In fact, the proposed approach can be employed to the other urban regions or territories. Furthermore, it equips with the potential for the assessments of the impacts on environment and regional climate that are caused from LULC changes.
Author Contributions
Conceptualization, T.H.L. and T.M.N.; methodology, T.M.N. and H.P.C.; software, validation and formal analysis, T.M.N.; investigation, T.M.N. and H.P.C.; writing—original draft preparation, T.M.N.; writing—review and editing, T.H.L. and H.P.C.; supervision, project administration and funding acquisition, T.H.L.
Funding
This work was supported by the Ministry of Science and Technology, Taiwan (grant number MOST 107-2111-M-008-024).
Acknowledgments
The authors thank the following institutions for their data supports in this work, U.S. Geological Survey (USGS), Statistical Office in Hanoi city, Vietnam Meteorological Bureau and Hanoi Environment and Natural Resource Department (source of the core datasets). We also thank the anonymous reviewers whose feedback improved this manuscript significantly. Finally, the authors acknowledge our colleagues who offered expertise that greatly assisted this research.
Conflicts of Interest
The authors declare no conflict of interest.
References
- Chadchan, J.; Shankar, R. Emerging urban development issues in the context of globalisation. J. ITPI 2009, 6, 78–85. [Google Scholar]
- Cui, L.; Shi, J. Urbanization and its environmental effects in Shanghai, China. Urban Clim. 2012, 2, 1–15. [Google Scholar] [CrossRef] [Green Version]
- Kim, Y.-H.; Baik, J.-J. Spatial and temporal structure of the urban heat island in Seoul. J. Appl. Meteorol. 2005, 44, 591–605. [Google Scholar] [CrossRef]
- Asgarian, A.; Amiri, B.J.; Sakieh, Y. Assessing the effect of green cover spatial patterns on urban land surface temperature using landscape metrics approach. Urban Ecosyst. 2015, 18, 209–222. [Google Scholar] [CrossRef]
- Ranagalage, M.; Estoque, R.C.; Murayama, Y. An urban heat island study of the Colombo metropolitan area, Sri Lanka, based on Landsat data (1997–2017). Isprs Int. J. Geo-Inf. 2017, 6, 189. [Google Scholar] [CrossRef]
- Li, X.X.; Koh, T.Y.; Panda, J.; Norford, L.K. Impact of urbanization patterns on the local climate of a tropical city, Singapore: An ensemble study. J. Geophys. Res. Atmos. 2016, 121, 4386–4403. [Google Scholar] [CrossRef] [Green Version]
- Alfraihat, R.; Mulugeta, G.; Gala, T. Ecological evaluation of urban heat island in Chicago City, USA. J. Atmos. Pollut. 2016, 4, 23–29. [Google Scholar]
- Labbé, D.; Collin, J.-P.; Boudreau, J.-A. Facing the Urban Transition in Hanoi: Recent Urban Planning Issues and Initiatives. INRS Centre-Urbanisation Culture Société: Montréal, QC, Canada, 2010. [Google Scholar]
- Nong, D.H.; Lepczyk, C.A.; Miura, T.; Fox, J.M. Quantifying urban growth patterns in Hanoi using landscape expansion modes and time series spatial metrics. Plos One 2018, 13, e0196940. [Google Scholar] [CrossRef] [PubMed]
- Trihamdani, A.R.; Kubota, T.; Lee, H.S.; Sumida, K.; Phuong, T.T.T. Impacts of land use changes on urban heat islands in Hanoi, Vietnam: Scenario analysis. Procedia Eng. 2017, 198, 525–529. [Google Scholar] [CrossRef]
- Vietnam General Statistics Office. Figures of socio-economic achievements of the capital during 60 years of building and development, 2014. Available online: http://thongkehanoi.gov.vn/ (accessed on 4 March 2018).
- Chen, W.; Zhang, Y.; Pengwang, C.; Gao, W. Evaluation of urbanization dynamics and its impacts on surface heat islands: A case study of Beijing, China. Remote Sens. 2017, 9, 453. [Google Scholar] [CrossRef]
- Guha, S.; Govil, H.; Dey, A.; Gill, N. Analytical study of land surface temperature with NDVI and NDBI using Landsat 8 OLI and TIRS data in Florence and Naples city, Italy. Eur. J. Remote Sens. 2018, 51, 667–678. [Google Scholar] [CrossRef]
- Zhou, W.; Qian, Y.; Li, X.; Li, W.; Han, L. Relationships between land cover and the surface urban heat island: seasonal variability and effects of spatial and thematic resolution of land cover data on predicting land surface temperatures. Landsc. Ecol. 2014, 29, 153–167. [Google Scholar] [CrossRef]
- Kumar, D.; Shekhar, S. Statistical analysis of land surface temperature–vegetation indexes relationship through thermal remote sensing. Ecotoxicol. Environ. Saf. 2015, 121, 39–44. [Google Scholar] [CrossRef] [PubMed]
- Moser-Reischl, A.; Uhl, E.; Rötzer, T.; Biber, P.; van Con, T.; Tan, N.T.; Pretzsch, H. Effects of the urban heat island and climate change on the growth of Khaya senegalensis in Hanoi, Vietnam. For. Ecosyst. 2018, 5, 37. [Google Scholar] [CrossRef]
- Kakon, A.N.; Nobuo, M.; Kojima, S.; Yoko, T. Assessment of thermal comfort in respect to building height in a high-density city in the tropics. Am. J. Eng. Appl. Sci. 2010, 3, 545–551. [Google Scholar] [CrossRef]
- Matzarakis, A.; Mayer, H.; Iziomon, M.G. Applications of a universal thermal index: physiological equivalent temperature. Int. J. Biometeorol. 1999, 43, 76–84. [Google Scholar] [CrossRef]
- Willett, K.M.; Sherwood, S. Exceedance of heat index thresholds for 15 regions under a warming climate using the wet-bulb globe temperature. Int. J. Climatol. 2012, 32, 161–177. [Google Scholar] [CrossRef]
- Zhang, Y.; Yu, T.; Gu, X.; Zhang, Y.; Chen, L. Land surface temperature retrieval from CBERS-02 IRMSS thermal infrared data and its applications in quantitative analysis of urban heat island effect. J. Remote Sens. Beijing 2006, 10, 789. [Google Scholar]
- Iwata, S. The Comprehensive Urban Development Programme in Hanoi Capital City of the Socialist Republic of Vietnam (HAIDEP); Final report; JICA: Hanoi, Vietnam, 2007. [Google Scholar]
- ESRI. ArcGIS desktop: release 10. Environmental Systems Research Institute: Redlands, CA, USA, 2011. [Google Scholar]
- Phiri, D.; Morgenroth, J. Developments in Landsat land cover classification methods: A review. Remote Sens. 2017, 9, 967. [Google Scholar] [CrossRef]
- Lu, D.; Weng, Q. A survey of image classification methods and techniques for improving classification performance. Int. J. Remote Sens. 2007, 28, 823–870. [Google Scholar] [CrossRef] [Green Version]
- Patil, M.B.; Desai, C.G.; Umrikar, B.N. Image classification tool for land use/land cover analysis: A comparative study of maximum likelihood and minimum distance method. Int. J. Geol. Earth Env. Sci. 2012, 2, 189–196. [Google Scholar]
- Congalton, R.G. A review of assessing the accuracy of classifications of remotely sensed data. Remote Sens. Environ. 1991, 37, 35–46. [Google Scholar] [CrossRef]
- Congalton, R.G.; Green, K. Assessing the Accuracy of Remotely Sensed Data: Principles and Practices; CRC press: Boca Raton, FL, USA, 2008. [Google Scholar]
- Jiang, Z.; Huete, A.R.; Chen, J.; Chen, Y.; Li, J.; Yan, G.; Zhang, X. Analysis of NDVI and scaled difference vegetation index retrievals of vegetation fraction. Remote Sens. Environ. 2006, 101, 366–378. [Google Scholar] [CrossRef]
- Vani, V.; Mandla, V. Comparative Study of NDVI and SAVI vegetation Indices in Anantapur district semi-arid areas. Int. J. Civ. Eng. Technol. 2017, 8, 287–300. [Google Scholar]
- Zhang, Y.; Odeh, I.O.; Han, C. Bi-temporal characterization of land surface temperature in relation to impervious surface area, NDVI and NDBI, using a sub-pixel image analysis. Int. J. Appl. Earth Obs. Geoinf. 2009, 11, 256–264. [Google Scholar] [CrossRef]
- He, C.; Shi, P.; Xie, D.; Zhao, Y. Improving the normalized difference built-up index to map urban built-up areas using a semiautomatic segmentation approach. Remote Sens. Lett. 2010, 1, 213–221. [Google Scholar] [CrossRef] [Green Version]
- Zha, Y.; Gao, J.; Ni, S. Use of normalized difference built-up index in automatically mapping urban areas from TM imagery. Int. J. Remote Sens. 2003, 24, 583–594. [Google Scholar] [CrossRef]
- Quintano, C.; Fernández-Manso, A.; Calvo, L.; Marcos, E.; Valbuena, L. Land surface temperature as potential indicator of burn severity in forest Mediterranean ecosystems. Int. J. Appl. Earth Obs. Geoinf. 2015, 36, 1–12. [Google Scholar] [CrossRef]
- Sobrino, J.A.; Jimenez-Munoz, J.C.; Paolini, L. Land surface temperature retrieval from LANDSAT TM 5. Remote Sens. Environ. 2004, 90, 434–440. [Google Scholar] [CrossRef]
- Tan, K.C.; San Lim, H.; MatJafri, M.Z.; Abdullah, K. Landsat data to evaluate urban expansion and determine land use/land cover changes in Penang Island, Malaysia. Environ. Earth Sci. 2010, 60, 1509–1521. [Google Scholar] [CrossRef]
- Guha, S.; Govil, H.; Mukherjee, S. Dynamic analysis and ecological evaluation of urban heat islands in Raipur city, India. J. Appl. Remote Sens. 2017, 11, 036020. [Google Scholar] [CrossRef]
- El-Hattab, M.; Amany, S.; Lamia, G. Monitoring and assessment of urban heat islands over the Southern region of Cairo Governorate, Egypt. Egypt. J. Remote Sens. Space Sci. 2017. [Google Scholar] [CrossRef]
- Liu, L.; Zhang, Y. Urban heat island analysis using the Landsat TM data and ASTER data: A case study in Hong Kong. Remote Sens. 2011, 3, 1535–1552. [Google Scholar] [CrossRef]
- Bencardino, M.; Nesticò, A. Demographic changes and real estate values. A quantitative model for analyzing the urban-rural linkages. Sustainability 2017, 9, 536. [Google Scholar] [CrossRef]
- Bencardino, M.; Nesticò, A. Urban sprawl, labor incomes and real estate values. Part II, LNCS. Proc. Int. Conf. Comput. Sci. Its Appl. 2017, 10405, 17–30. [Google Scholar]
Figure 1.
(a) Geographic location and administrative districts of the study area in Hanoi city, (b) comparison of Hanoi before and after expansion of the administrative boundaries in 2008.
Figure 1.
(a) Geographic location and administrative districts of the study area in Hanoi city, (b) comparison of Hanoi before and after expansion of the administrative boundaries in 2008.

Figure 2.
Flowchart of this study.
Figure 3.
(a) Total population (thousands), (b) population density (people/km2), and (c) population density map in 2016 (people/km2) in Hanoi from 1999 to 2016.
Figure 3.
(a) Total population (thousands), (b) population density (people/km2), and (c) population density map in 2016 (people/km2) in Hanoi from 1999 to 2016.
Figure 4.
Variances in socio-economic indicators of Hanoi from 1960 to 2013, (a) newly built area of residential housing in the year (thousand m2), (b) industrial establishment (number of establishment), and (c) electricity per capita (Kwh/pers).
Figure 4.
Variances in socio-economic indicators of Hanoi from 1960 to 2013, (a) newly built area of residential housing in the year (thousand m2), (b) industrial establishment (number of establishment), and (c) electricity per capita (Kwh/pers).

Figure 5.
Results of land use/land cover classification in Hanoi in 1999, 2009, and 2016.
Figure 6.
Temporal variations of seven LULC types in proportion based on the results of Figure 5.
Figure 6.
Temporal variations of seven LULC types in proportion based on the results of Figure 5.
Figure 7.
NDVI maps of Hanoi from Landsat data in 1999, 2009 and 2016.
Figure 8.
Normalized difference built-up index (NDBI) maps of Hanoi from Landsat data in 1999, 2009 and 2016.
Figure 8.
Normalized difference built-up index (NDBI) maps of Hanoi from Landsat data in 1999, 2009 and 2016.
Figure 9.
Retrievals of the land surface temperature (LST) map in Hanoi from Landsat data in 1999, 2009, and 2016.
Figure 9.
Retrievals of the land surface temperature (LST) map in Hanoi from Landsat data in 1999, 2009, and 2016.

Figure 10.
Identified UHI zones of Hanoi in 1999, 2009, and 2016.
Figure 11.
Associations of LST with LULC types in Hanoi in 1999, 2009, and 2016.
Figure 12.
Relationships among LST, normalized difference vegetation index (NDVI), and NDBI in Hanoi; (a), (b), and (c) LST and NDVI in 1999, 2009, and 2016, respectively; (d), (e), and (f), LST and NDBI in 1999, 2009, and 2016, respectively.
Figure 12.
Relationships among LST, normalized difference vegetation index (NDVI), and NDBI in Hanoi; (a), (b), and (c) LST and NDVI in 1999, 2009, and 2016, respectively; (d), (e), and (f), LST and NDBI in 1999, 2009, and 2016, respectively.
Figure 13.
Correlations of UHI in Hanoi with (a) newly built area of residential housing in the year (thousand m2), (b) industrial establishment (number of establishment), and (c) electricity per capita (Kwh/pers) urbanization indicators.
Figure 13.
Correlations of UHI in Hanoi with (a) newly built area of residential housing in the year (thousand m2), (b) industrial establishment (number of establishment), and (c) electricity per capita (Kwh/pers) urbanization indicators.
Figure 14.
Annual mean air temperature (°C) in four stations of Hanoi (Lang, Ha Dong, and Son Tay stations during the period 1999–2016 and Ba Vi station during the period from 1999–2010).
Figure 14.
Annual mean air temperature (°C) in four stations of Hanoi (Lang, Ha Dong, and Son Tay stations during the period 1999–2016 and Ba Vi station during the period from 1999–2010).
Figure 15.
Variations of annual air temperature (°C) between the Lang station and the Son Tay station from 1999 to 2016.
Figure 15.
Variations of annual air temperature (°C) between the Lang station and the Son Tay station from 1999 to 2016.
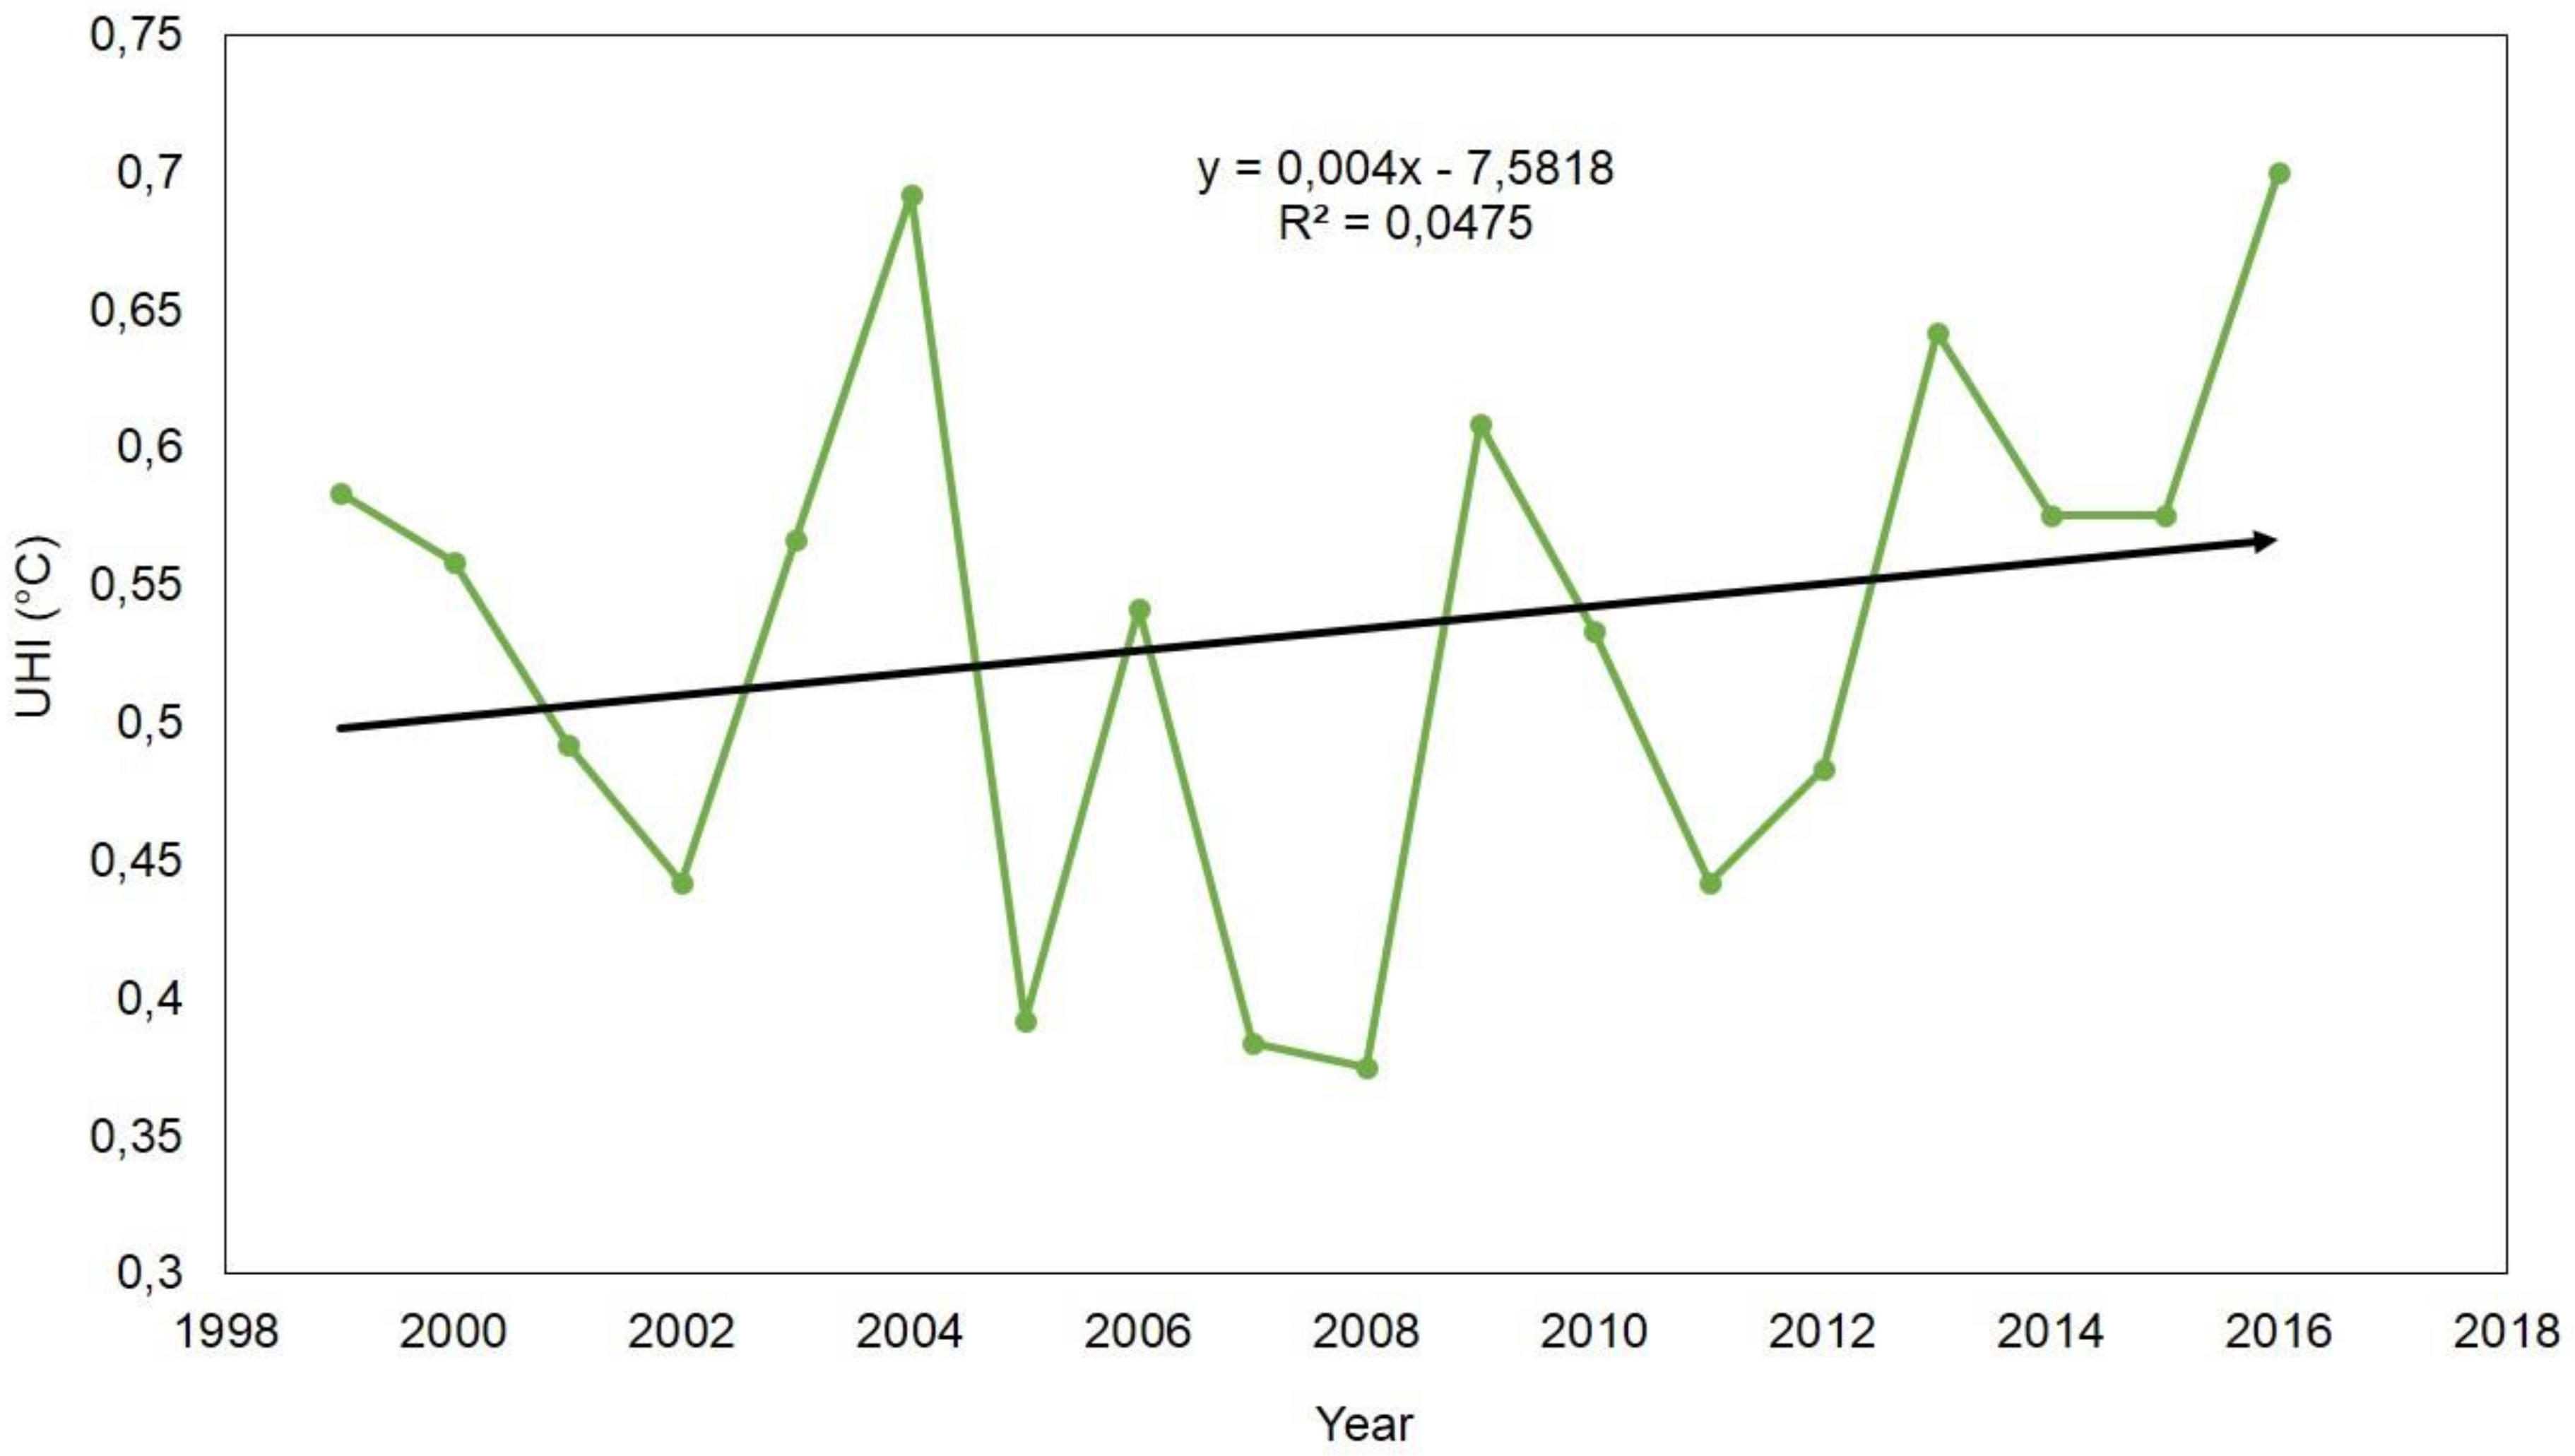
Figure 16.
UTFVI maps of Hanoi in 1999, 2009, and 2016.
Figure 17.
Changes in (a) annual mean temperature (°C), (b) total rainfall (mm), (c) relative humidity (%) during the period 1961–2016, and (d) wind speed (m/s) during the period 1961–2001 in the Lang station and the Son Tay station.
Figure 17.
Changes in (a) annual mean temperature (°C), (b) total rainfall (mm), (c) relative humidity (%) during the period 1961–2016, and (d) wind speed (m/s) during the period 1961–2001 in the Lang station and the Son Tay station.

Table 1.
The Landsat imagery datasets used in this study.
| Sensor | Scene ID | Acquisition date | Season |
|---|---|---|---|
| Landsat 5 TM | LT51270451999266BKT00 | 23/09/1999 | Autumn |
| LT51270461999266BKT00 | |||
| Landsat 5 TM | LT51270452009309BJC00 | 05/11/2009 | Autumn |
| LT51270462009309BJC00 | |||
| Landsat 8 OLI/TIRS | LC81270452016281LGN01 | 07/10/2016 | Autumn |
| LC81270462016281LGN01 |
Table 2.
Eight categories of land use/land cover classes that were used in this study.
| Classes | Include | |
|---|---|---|
| 1 | Residential | Rural residential land and urban residential land |
| 2 | Industrial, Commercial | Land for industrial parks, industrial clusters, export processing zones; land for trading and service |
| 3 | Active agriculture | Land for cultivation of perennial trees, land for cultivation of annual crops, paddy land |
| 4 | Inactive agriculture (Wetland and Dry land) | Wetland—Paddy land: pump water in the field to prepare for farming works Dry land—Land for cultivation of perennial trees, land for cultivation of annual crops |
| 5 | Water | Land with rivers, streams, canals, springs (located in rivers, natural lakes) |
| 6 | Forestry | Land for special-use forests Land for protection forests Land for production forests |
| 7 | Sandbars | Riparian land |
| 8 | Bare soil | Unused land and Unused Mountain Land |
Table 3.
Thresholds of the six urban thermal field variance index (UTFVI) levels used in this study.
Table 3.
Thresholds of the six urban thermal field variance index (UTFVI) levels used in this study.
| UTFVI | Urban Heat Island (UHI) Phenomenon | Ecological Evaluation Index |
|---|---|---|
| <0.000 | None | Excellent |
| 0.000–0.005 | Weak | Good |
| 0.005–0.010 | Middle | Normal |
| 0.010–0.015 | Strong | Bad |
| 0.015–0.020 | Stronger | Worse |
| >0.020 | Strongest | Worst |
Table 4.
Results of validations of land use/land cover (LULC) classification in 2016.
| Types of LULC | User’s (%) | Producer’s (%) |
|---|---|---|
| Residential | 94 | 96 |
| Industrial | 93 | 92 |
| Active agriculture land | 90 | 94 |
| Inactive agriculture land | 81 | 78 |
| Water | 88 | 90 |
| Forestry | 94 | 94 |
| Sand-bar | 96 | 98 |
| Bare soil | 88 | 84 |
| Overall Accuracy (%) | 90.75 | |
| Kappa Index | 0.88 | |
Table 5.
Comparisons of LST retrievals with air temperature from meteorology stations of Hanoi.
| Land surface temperature validation (°C) | |||||||||
|---|---|---|---|---|---|---|---|---|---|
| Station | 23/09/1999 | 05/11/2009 | 07/10/2016 | ||||||
| Retrieved LST | Air temperature AT | Difference LST-AT | Retrieved LST | Air temperature AT | Difference LST-AT | Retrieved LST | Air temperature AT | Difference LST-AT | |
| Lang | 27.92 | 26.4 | 1.52 | 25.88 | 23.1 | 2.78 | 28.49 | 26.7 | 1.79 |
| Ha Dong | 26.87 | 25.7 | 1.17 | 25.34 | 22 | 3.34 | 27.23 | 26 | 1.23 |
| Son Tay | 25.9 | 25.6 | 0.3 | 22.76 | 21.5 | 1.26 | 25.84 | 25.3 | 0.54 |
| Ba Vi | 24.88 | 23.8 | 1.08 | 22.75 | 21 | 1.75 | 25.17 | 24.1 | 1.07 |
Table 6.
Temporal fractions of the Urban Heat Island zone in Hanoi (1999, 2009 and 2016).
| Class | 1999 (%) | 2009 (%) | 2016 (%) |
|---|---|---|---|
| UHI | 10.98 | 25.36 | 31.83 |
| Non-UHI | 89.02 | 74.64 | 68.17 |
© 2019 by the authors. Licensee MDPI, Basel, Switzerland. This article is an open access article distributed under the terms and conditions of the Creative Commons Attribution (CC BY) license (http://creativecommons.org/licenses/by/4.0/).
Share and Cite
MDPI and ACS Style
Nguyen, T.M.; Lin, T.-H.; Chan, H.-P. The Environmental Effects of Urban Development in Hanoi, Vietnam from Satellite and Meteorological Observations from 1999–2016. Sustainability 2019, 11, 1768. https://doi.org/10.3390/su11061768
AMA Style
Nguyen TM, Lin T-H, Chan H-P. The Environmental Effects of Urban Development in Hanoi, Vietnam from Satellite and Meteorological Observations from 1999–2016. Sustainability. 2019; 11(6):1768. https://doi.org/10.3390/su11061768
Chicago/Turabian StyleNguyen, Thi Mai, Tang-Huang Lin, and Hai-Po Chan. 2019. "The Environmental Effects of Urban Development in Hanoi, Vietnam from Satellite and Meteorological Observations from 1999–2016" Sustainability 11, no. 6: 1768. https://doi.org/10.3390/su11061768
Note that from the first issue of 2016, this journal uses article numbers instead of page numbers. See further details here.