Identification of Key Influencing Factors of Sustainable Development for Traditional Power Generation Groups in a Market by Applying an Extended MCDM Model

Abstract
:1. Introduction
- (1)
- Unlike previous studies researching the whole power industry to pursue sustainable development, this study is focused on representative enterprises based on the real market-oriented renovation, especially systematic research. In this paper, the topic of traditional power generation groups (TPGG) was proposed for the first time, which represents power generation groups that were in the planning environment before but now are facing a transformation due to the power market reform in China.
- (2)
- Most research on corporate sustainability has analyzed one or two aspects, such as leadership, corporate finance, or social responsibility. To the best of our knowledge, this is the first research to provide a deep analysis of the issue of TPGGs from a systematic perspective, covering the five aspects of “society and environment,” “economy,” “resources and technology,” “enterprise management,” and “market.” Meanwhile, an innovative comprehensive index system on two levels was established to identify the influencing factors of TPGG sustainability.
- (3)
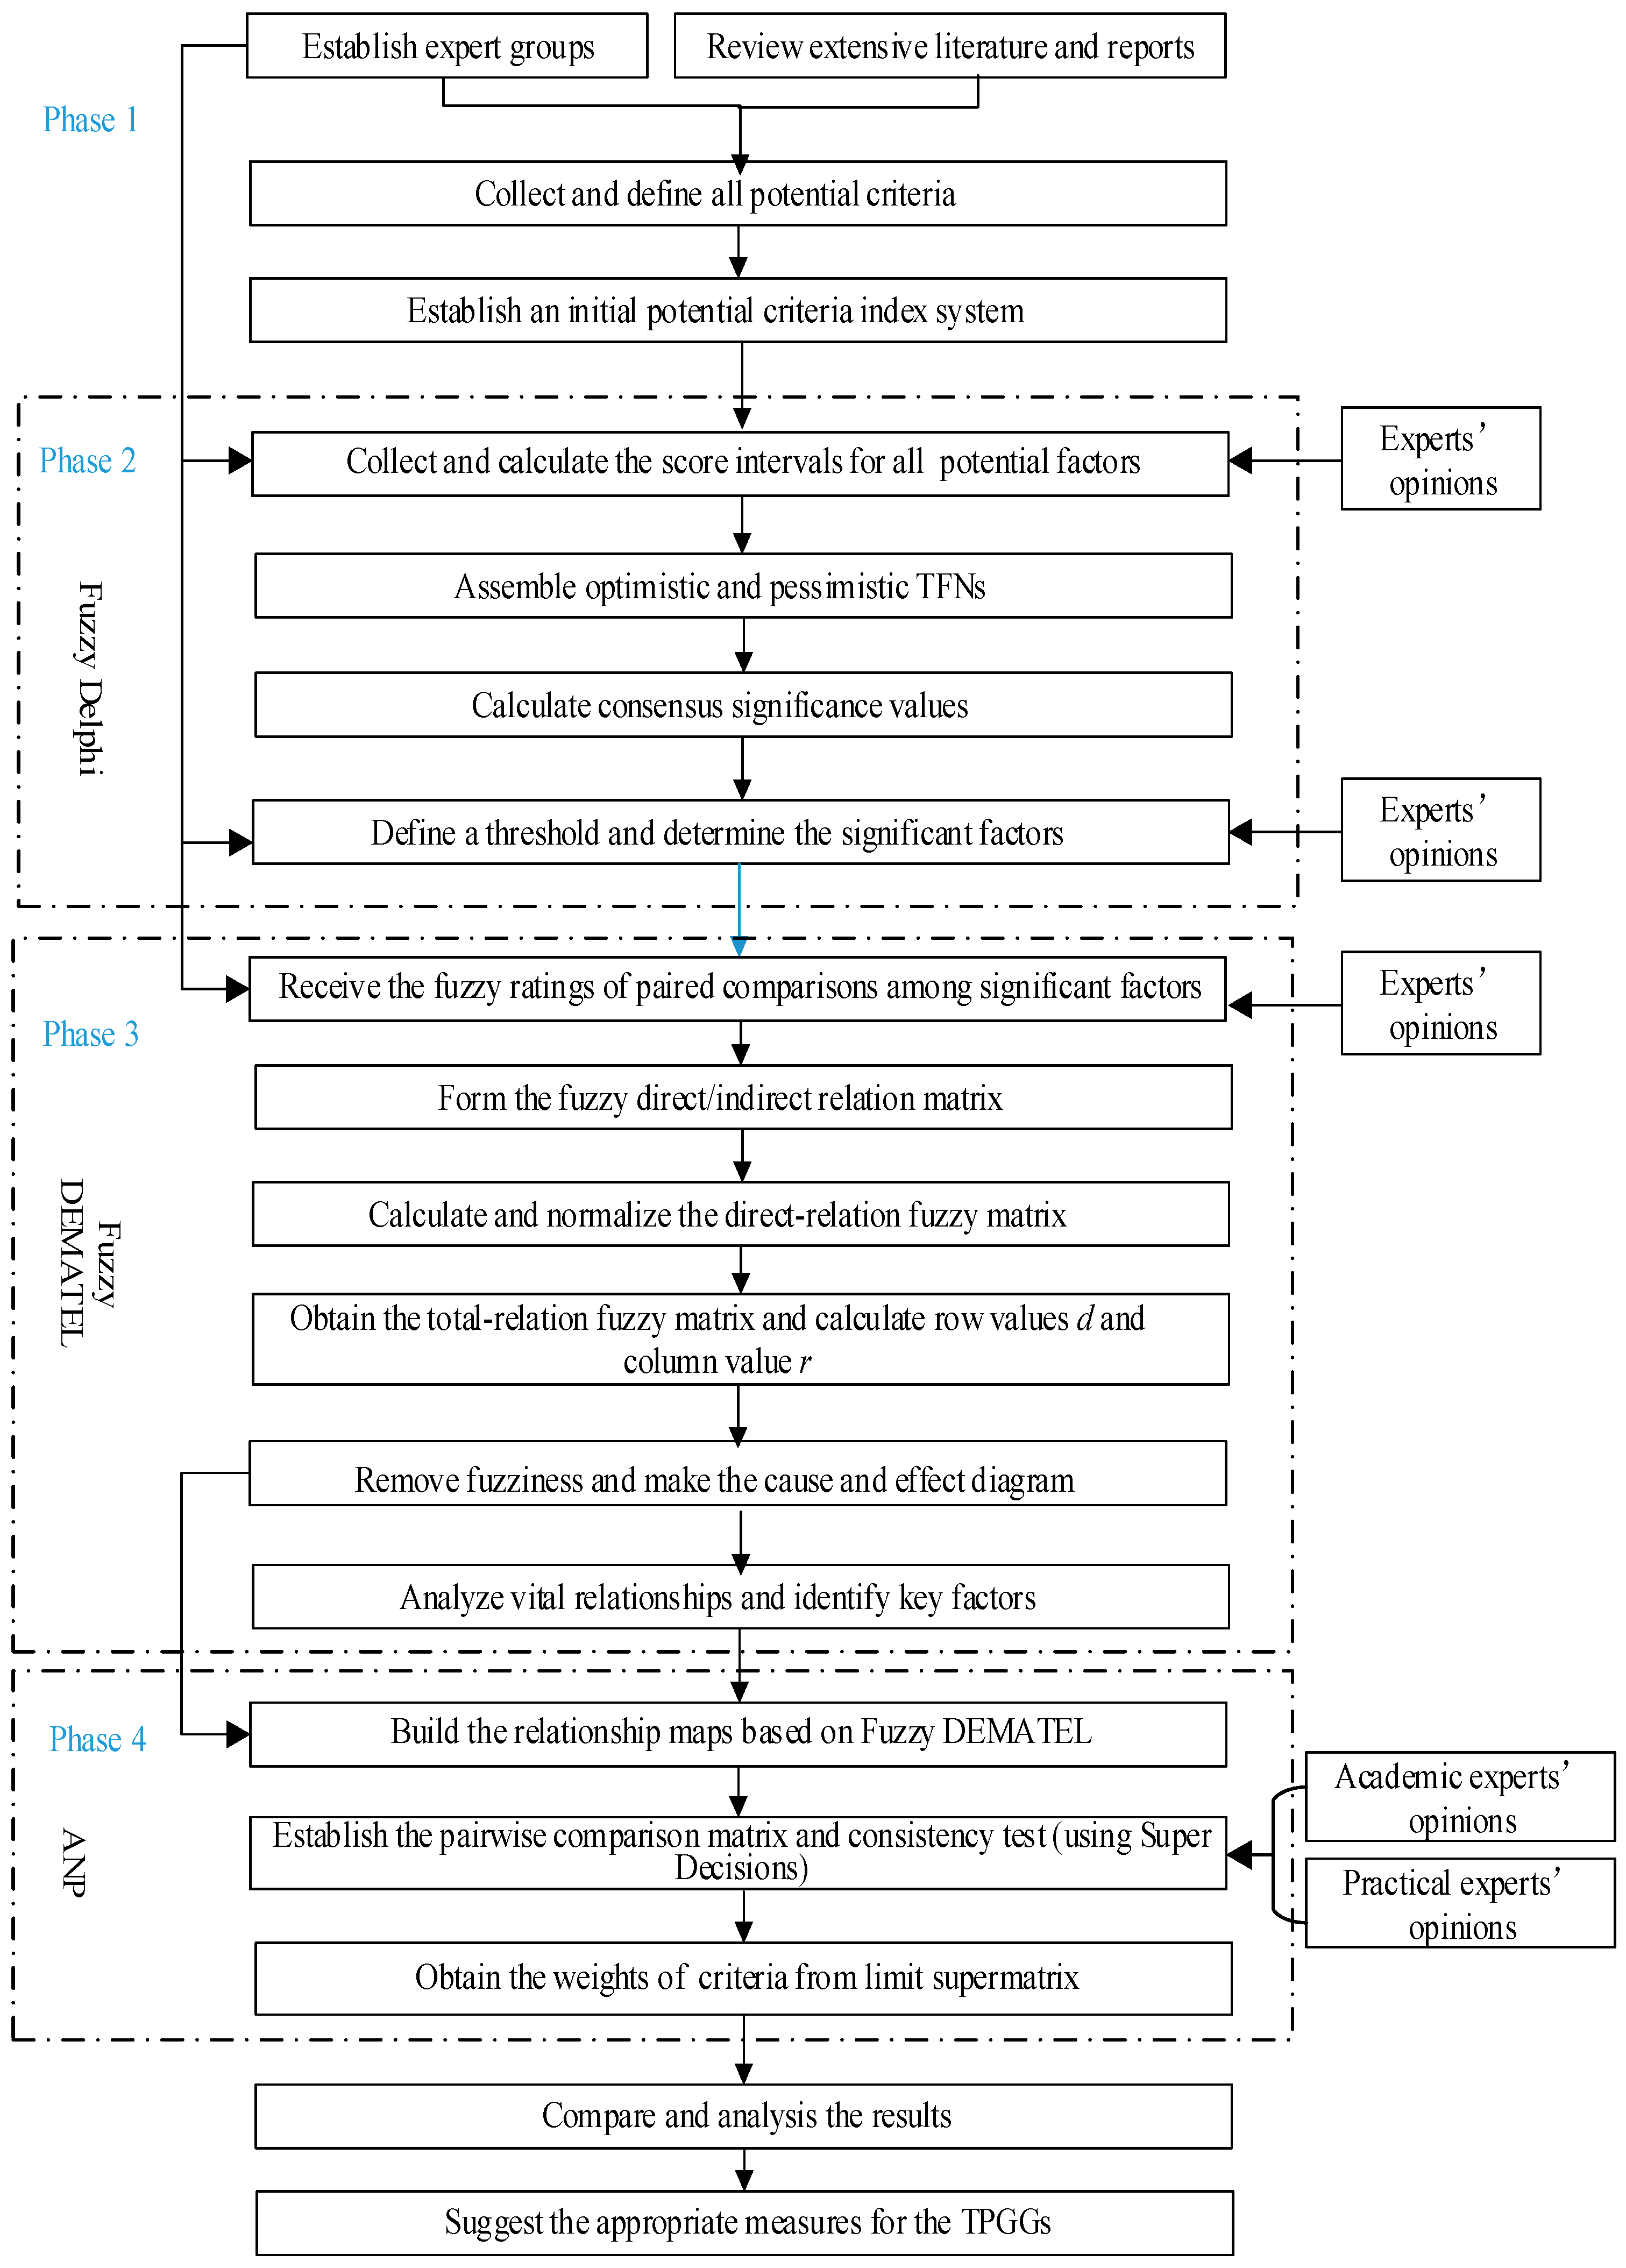
- The fuzzy DEMATEL method functions well in terms of factor identification under obscure circumstances. A novel hybrid MCDM method based on the integration of the fuzzy Delphi method and the fuzzy DEMATEL method into the ANP technique was developed to establish a reasonable index system for identifying the key influencing factors. Moreover, we used triangle fuzzy numbers (TFNs) to process the vague linguistic ratings in this study. Therefore, the application areas of these methods are extended.
- (4)
- In order to recognize the key influencing factors and have a better understanding of their relationships, an analysis of the causal relationship structure was conducted. Moreover, in order to identify the core influencing factors more comprehensively, we used the ANP method to conduct a weight analysis from both an academic and a practical perspective. Finally, a discussion was undertaken based on the calculating results, and several targeted measures were proposed to help TPGGs identify the key factors influencing sustainable development in a new market environment.
2. Overview of the Factors Influencing Sustainable Capability
- (1)
- Society and environmentSocial and environmental perspectives are regarded as critical factors for corporate sustainability in many studies [44]. Government policy, corporate social responsibility, external environment, and so on will cause enterprises to gain sustainable competitive advantage. Moreover, the generation of reliability is essential for power enterprises, particularly for renewable energy generation companies. In this aspect, the “Society and environment” dimension mainly involves corporations’ external public responsibilities including environment protection, social welfare, etc., as well as their internal responsibilities to their own employees.
- (2)
- EconomySome research [45] suggests that indicators of sustainable development should be financial terms. The financial situation of an enterprise directly reflects its sustainable development. Indicators such as generation and integration cost are crucial in actual operations. Also, the profit and risk values are reasonable indictors of the performance of TPGGs in the market environment.
- (3)
- Resources and technologyThe level of resources and technology reflects the strength of a company. In the long run, the technological level of an enterprise indicates its future competitiveness to a certain extent.
- (4)
- Enterprise managementMany studies reveal that corporate culture, a corporate leader’s experiences, and staff abilities have critical impacts on corporate sustainability. In order to better analyze the corporate sustainability, the corporate culture, leadership, and staff attitudes and values as well as the setup of corporate processes and reward system should be considered. It is worth noting that risk management is an indispensable link in enterprise sustainable development.
- (5)
- MarketThe reform of the electricity market in China has brought about great changes to the business environment of TPGGs. Both opportunities and risks have emerged. In addition to the brand effect, market price forecast, competitor analysis, and market strategies are crucial for the future survival of TPGGs.
3. Methodology and Framework
3.1. Fuzzy Set Theory
3.2. Fuzzy Delphi Method
- (1)
- If , and factor satisfies a consensus, the value is:
- (2)
- If , there should be a gray interval calculated via Equations (1) and (2).
- (i)
- If is smaller than the interval , the comments form a consensus.
- (ii)
- If is greater than , the comments on criterion do not reach consistency. New checking for factor should be performed by repeating steps 1 to 3 until all factors satisfy the consistency.
3.3. The Fuzzy Decision-Making Trial and Evaluation Laboratory (DEMATEL)
3.4. The DEMATEL-Based Analytic Network Process (ANP)
3.5. The Proposed Research Framework
4. Research Results and Analysis
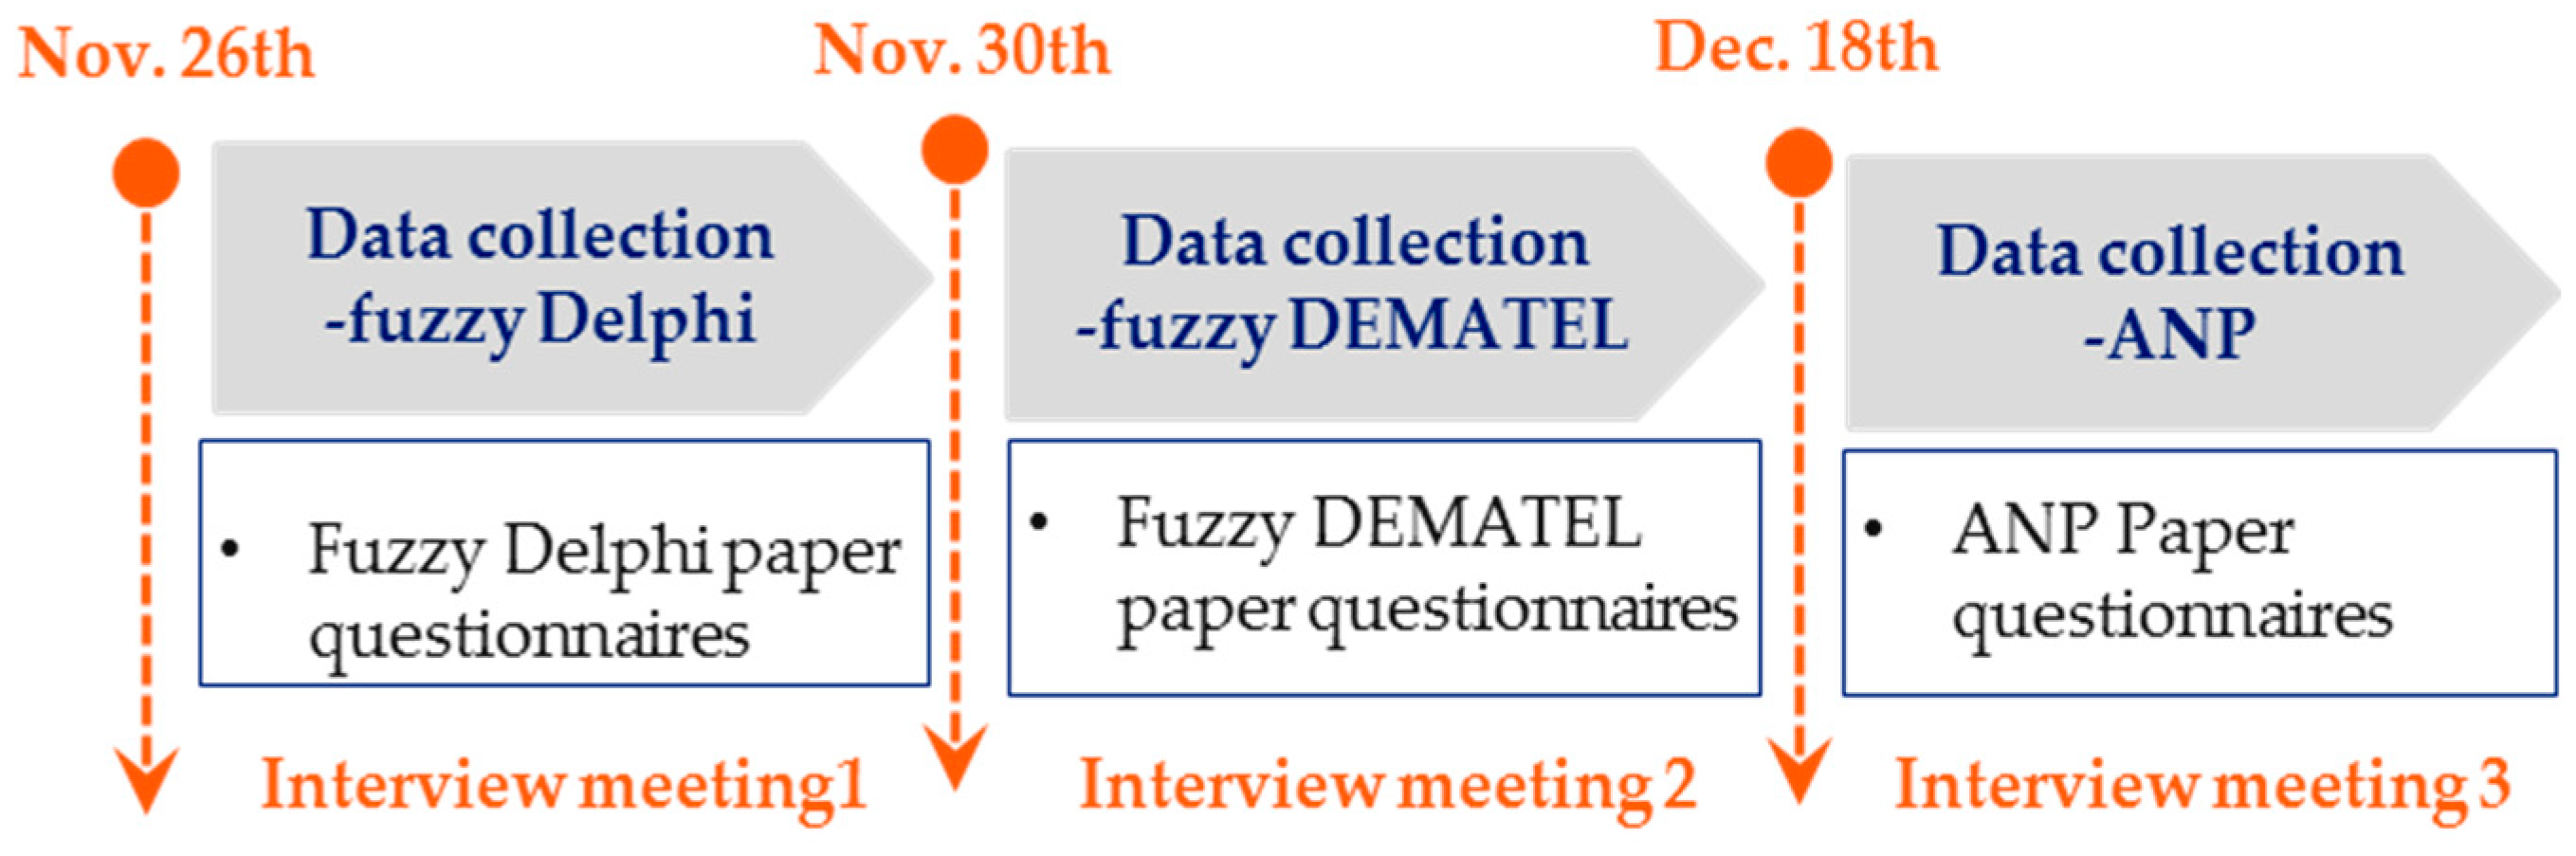
4.1. Introduction of Expert Groups and Data Collection
4.2. Establish the Primary Index System
4.3. Identify the Significant Influencing Factors
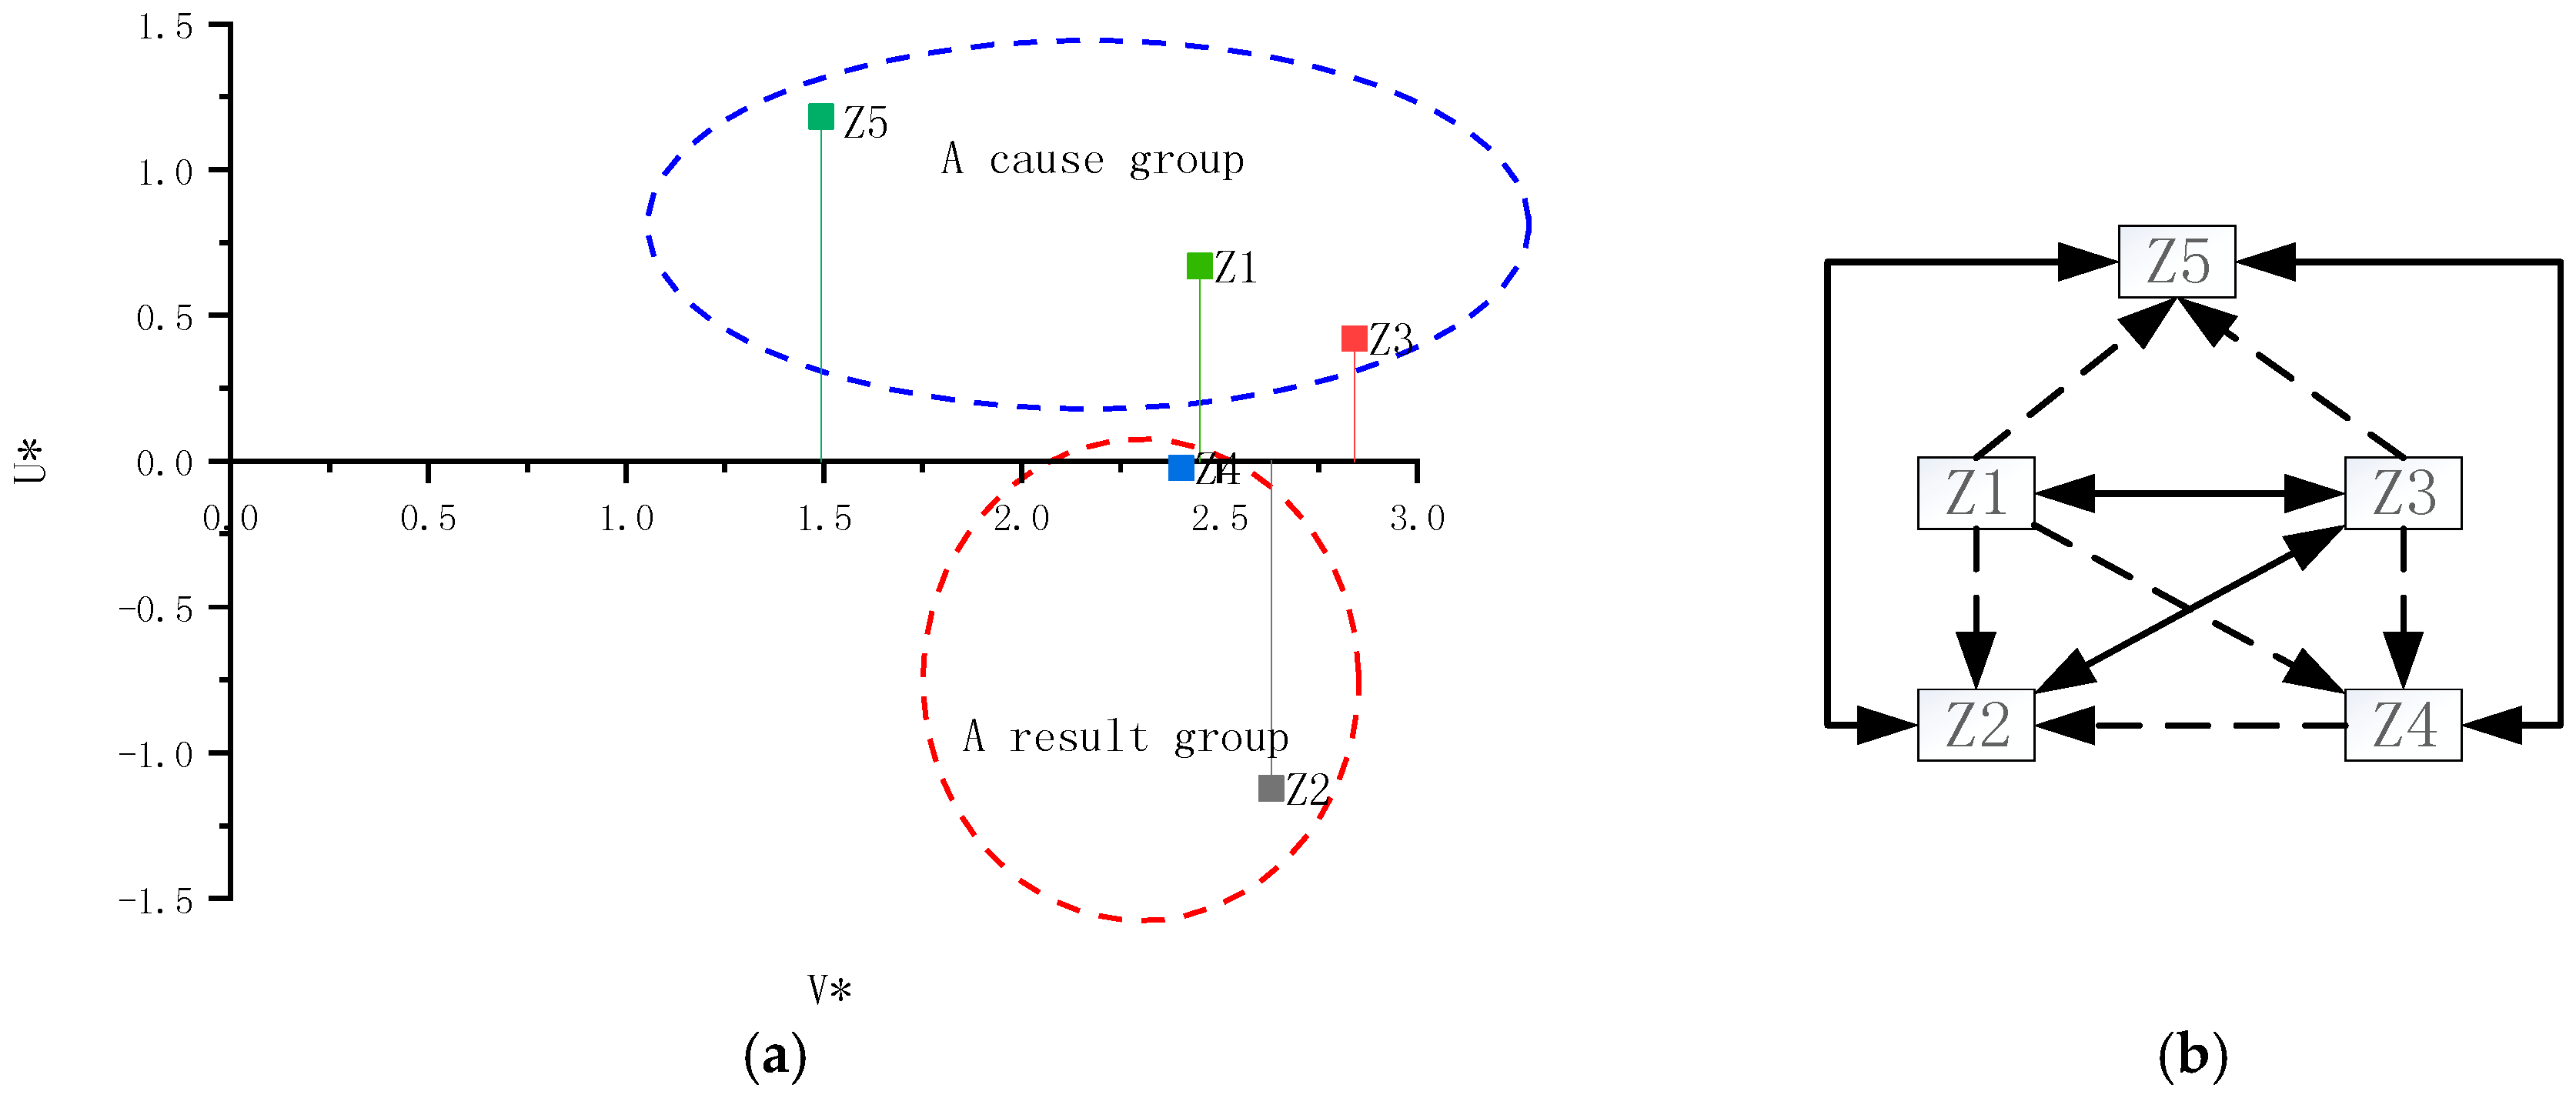
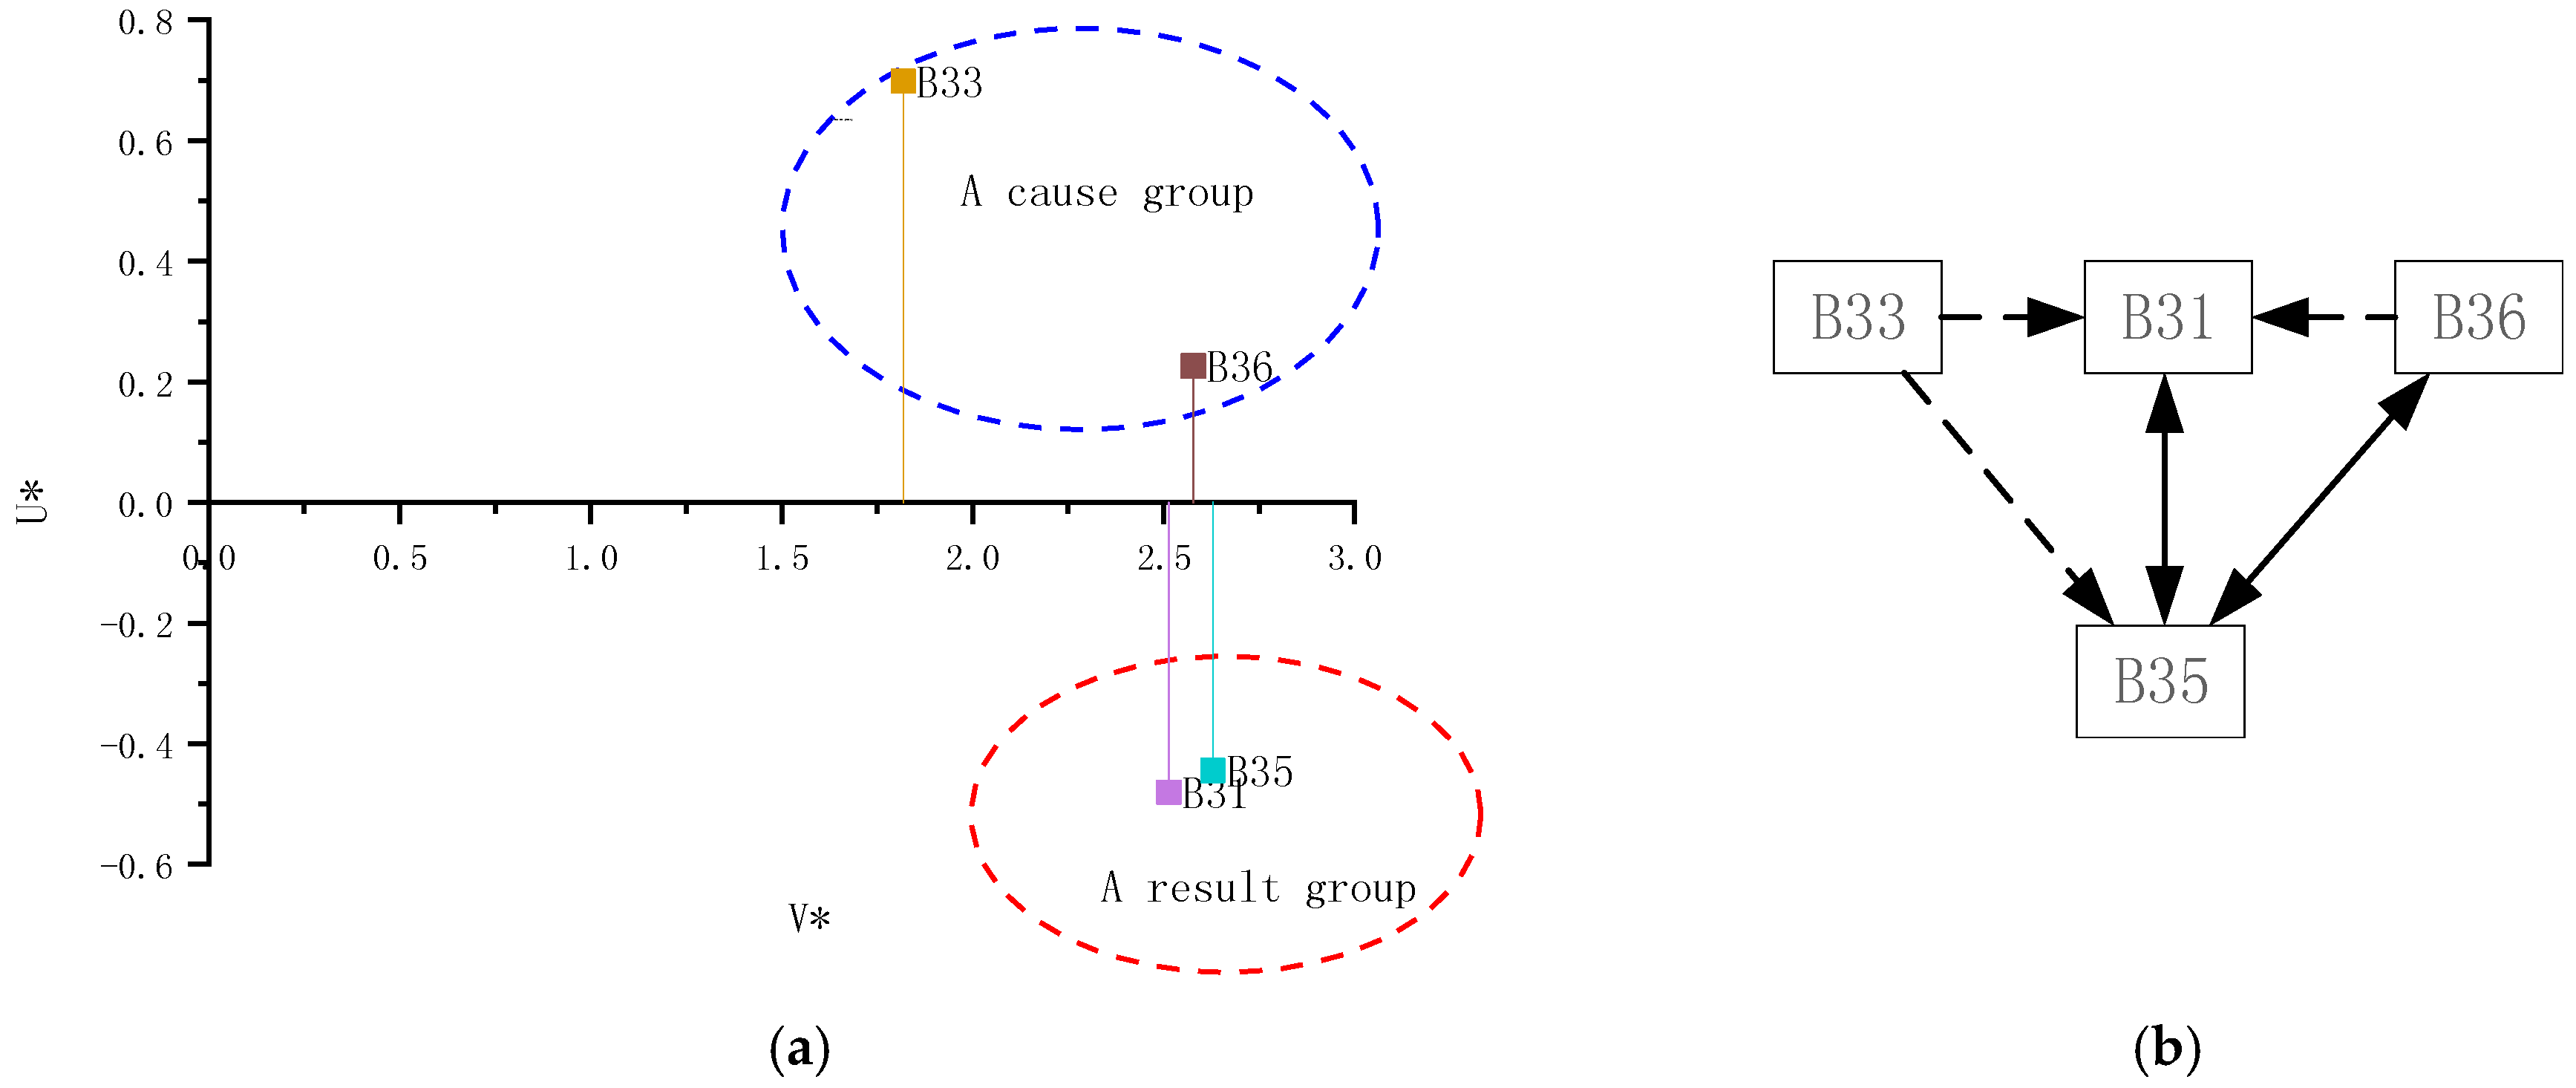
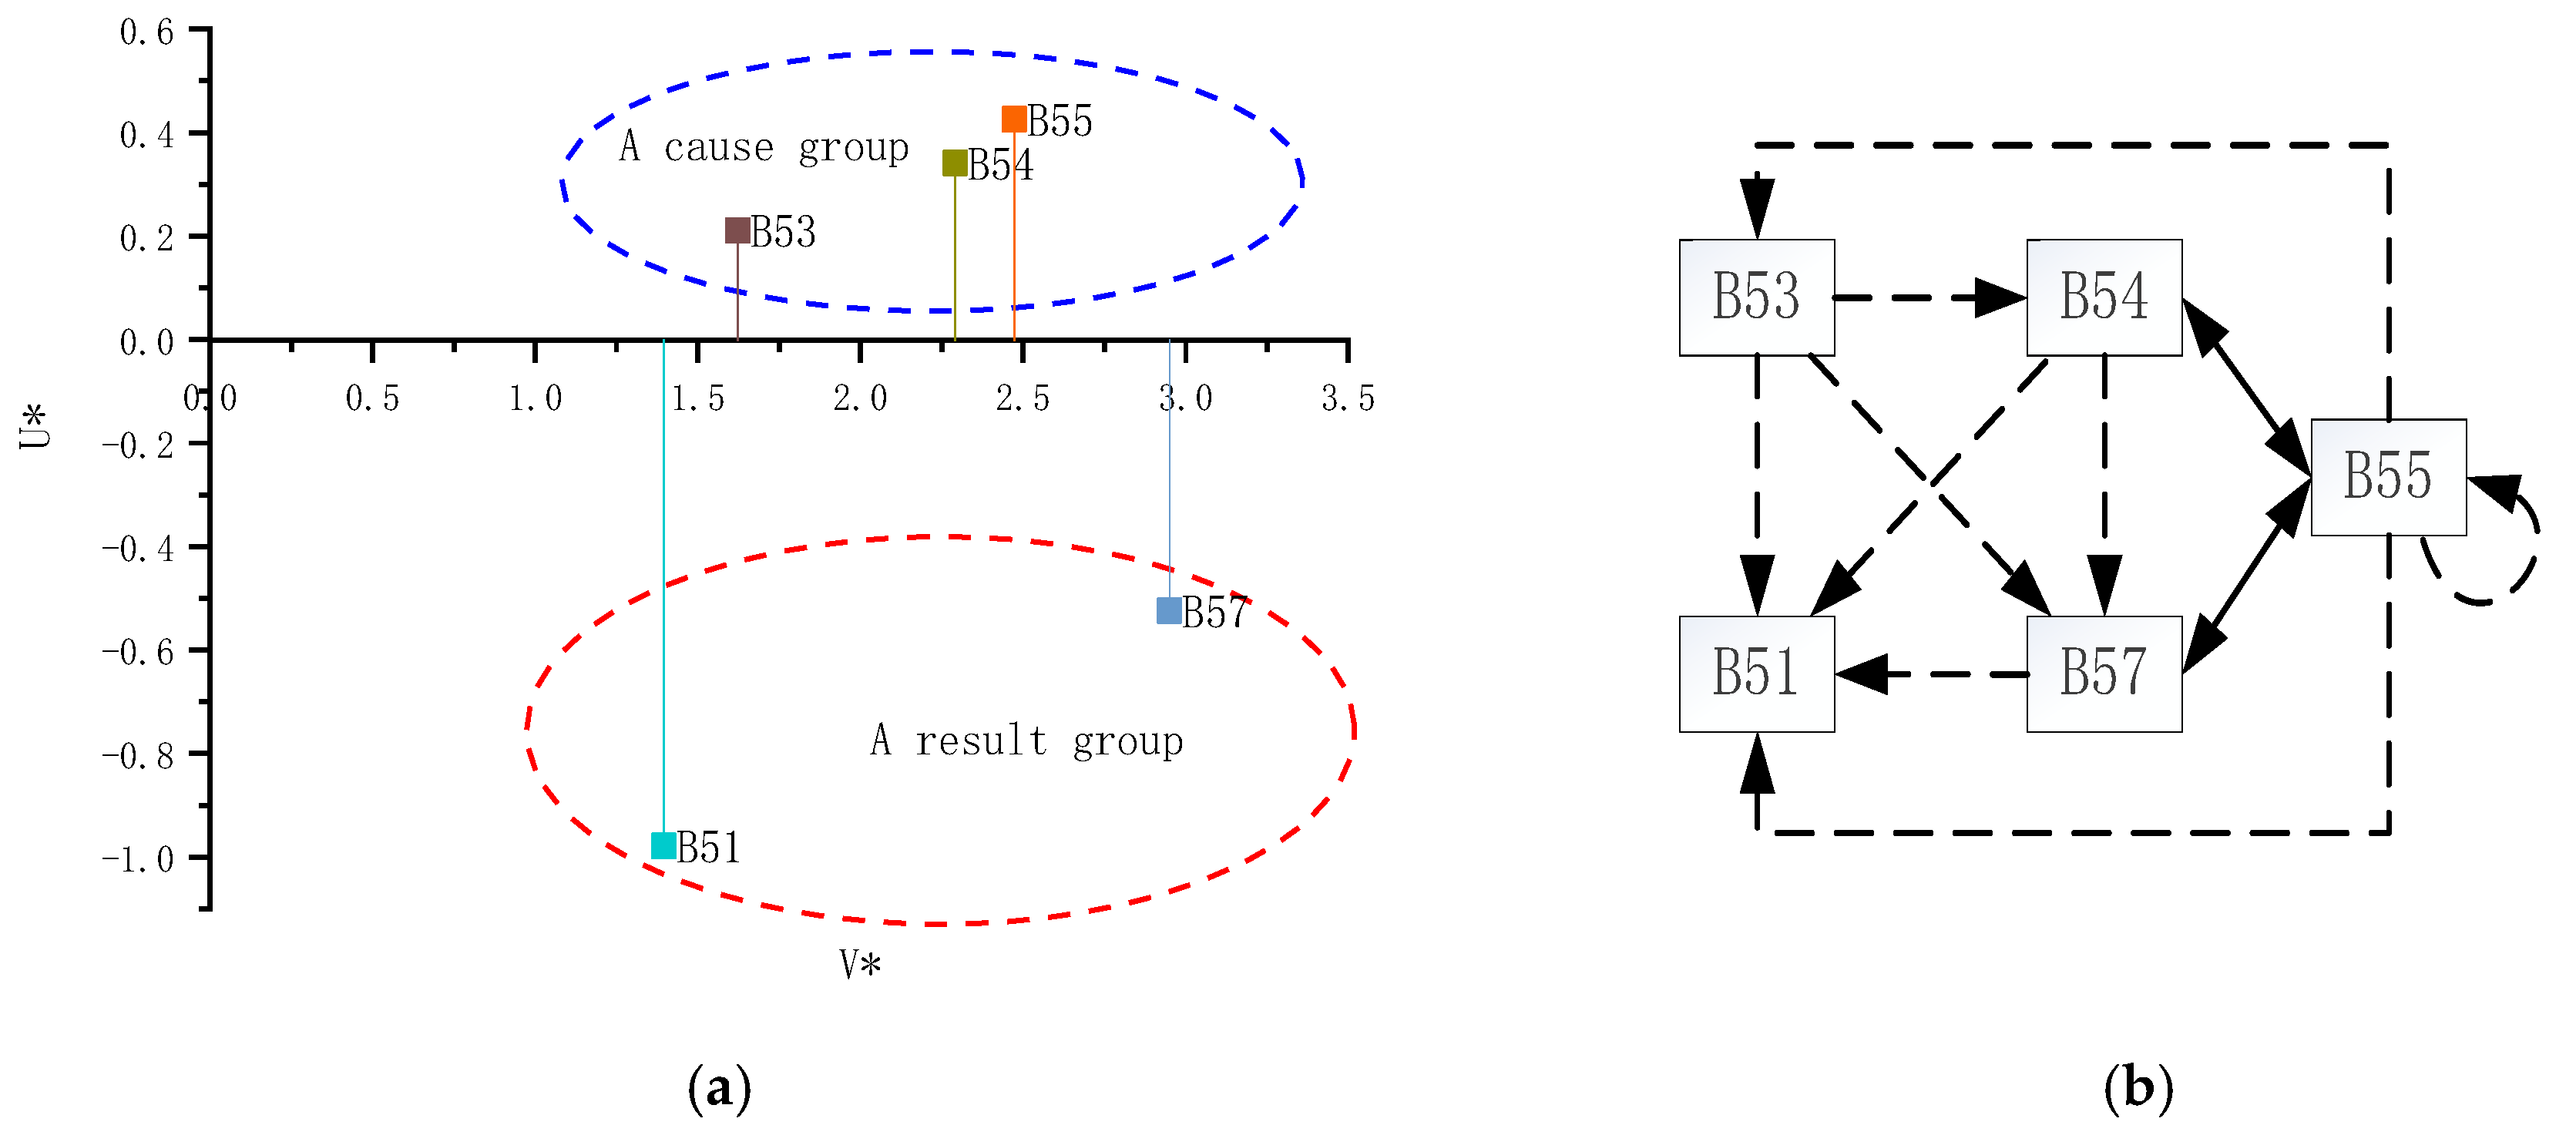
4.4. Establish the Structural Model for Causal Relationships
4.5. Obtain the Weights of Important Factors
5. Discussion and Implications
6. Conclusions
- (1)
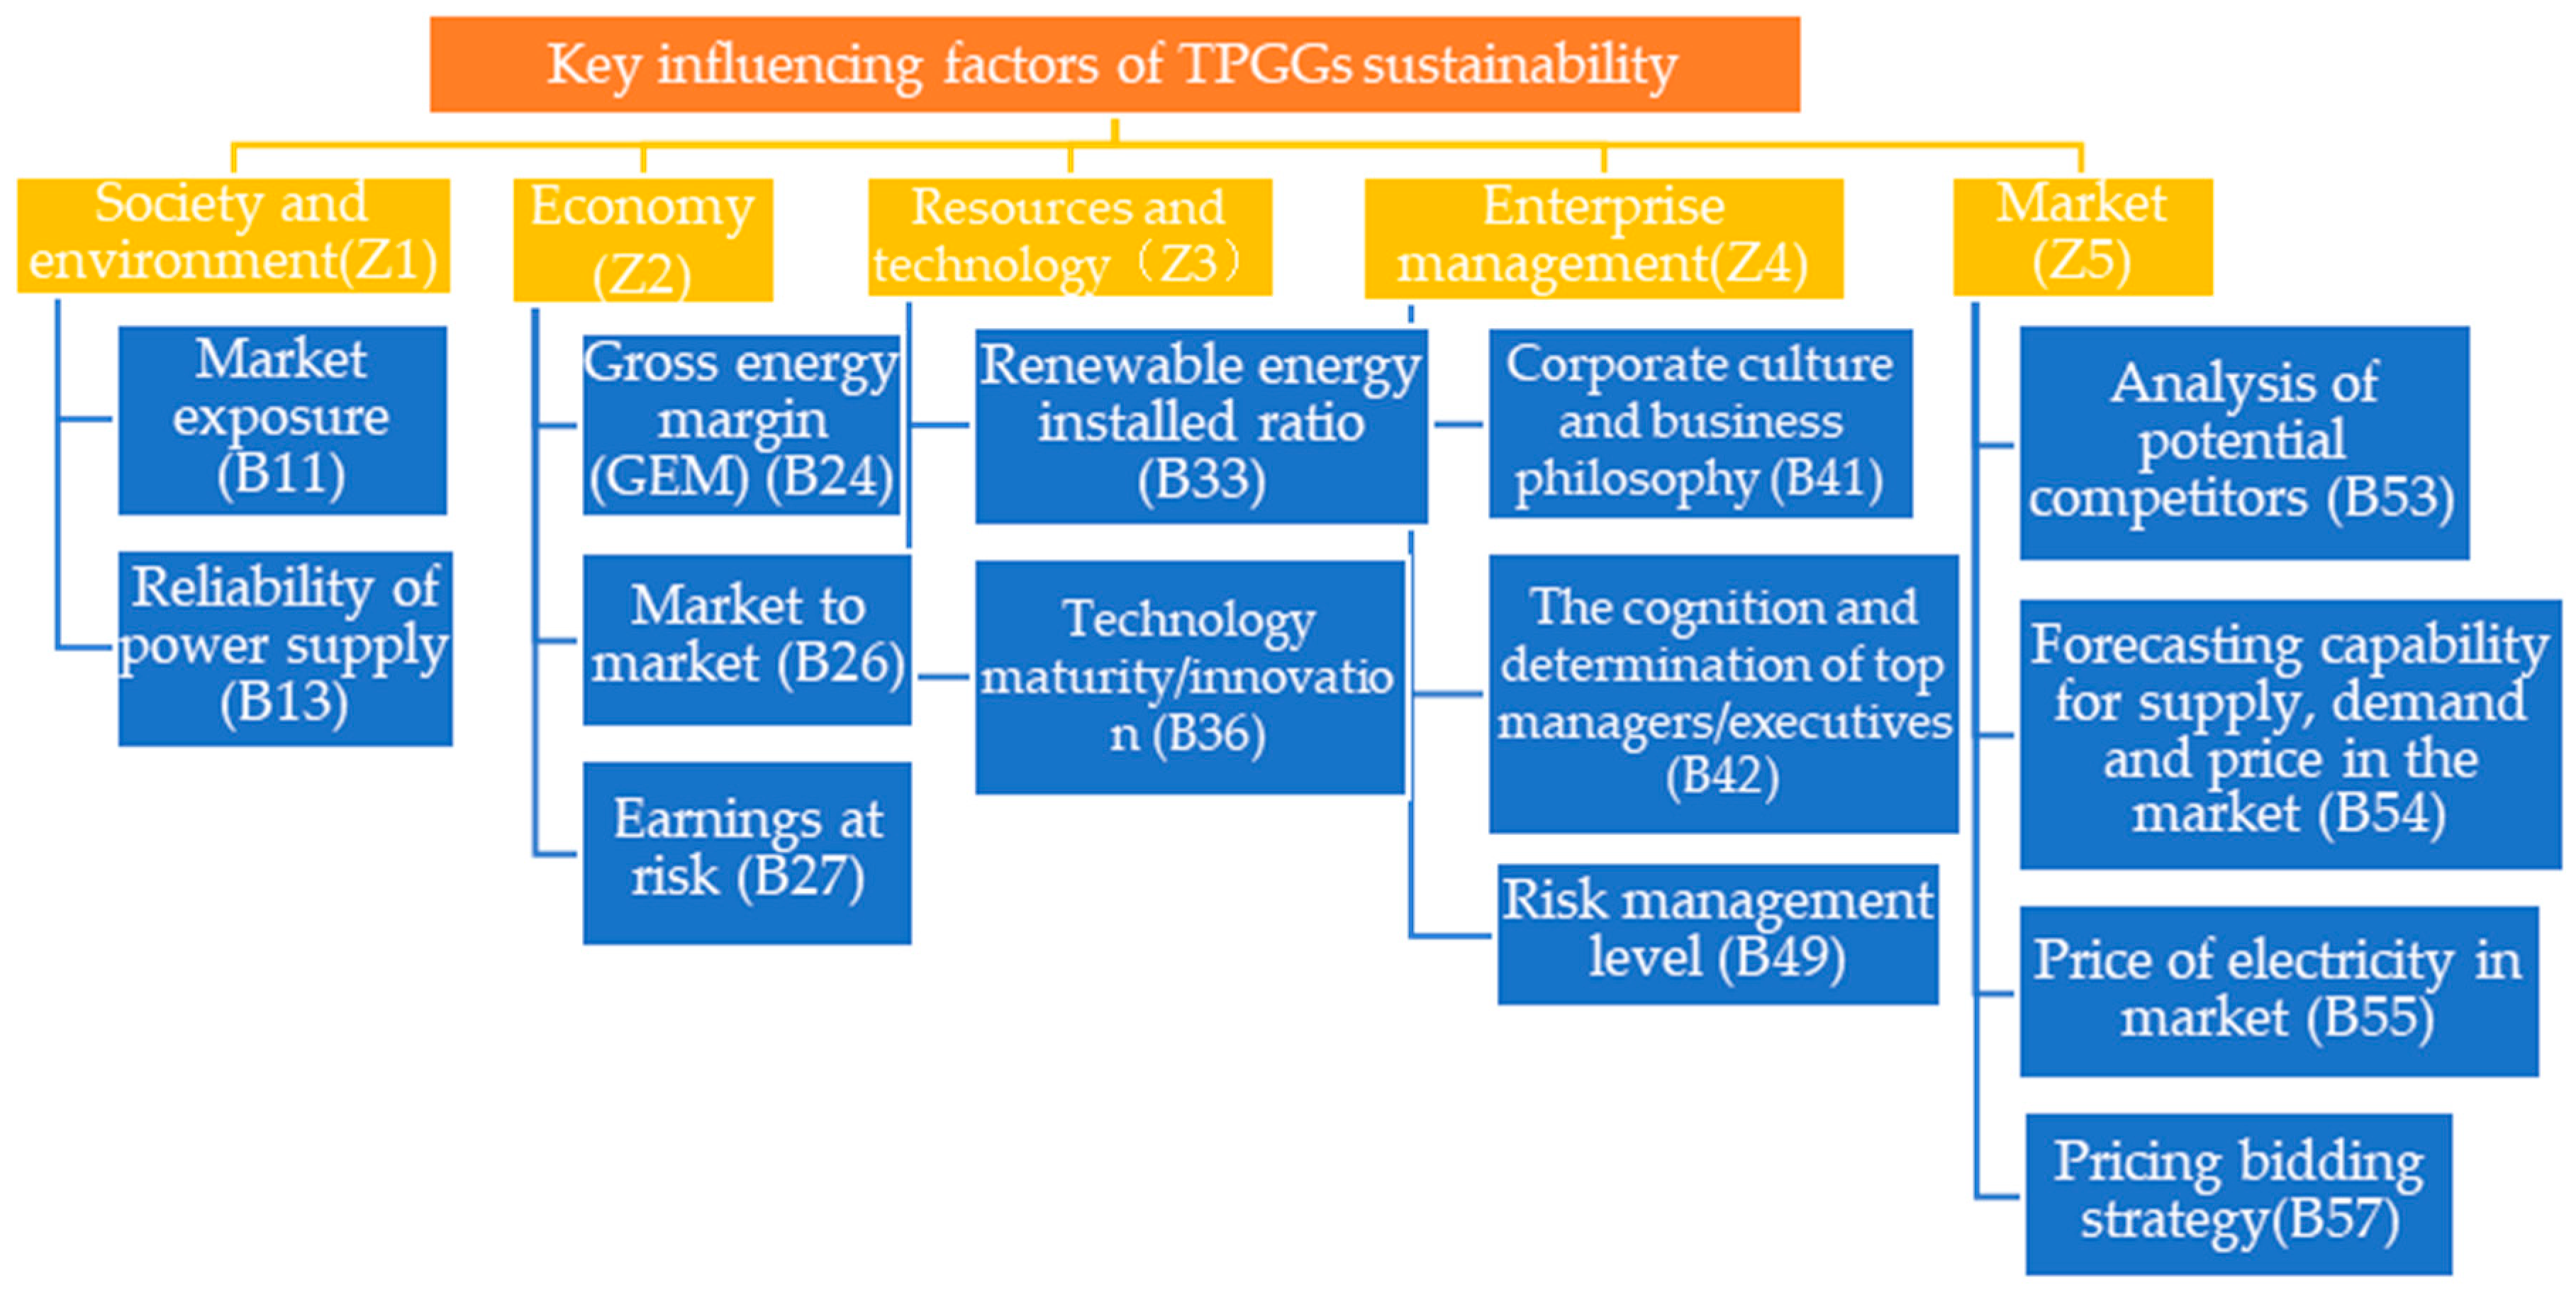
- Five dimensions are considered in recognizing the core factors influencing sustainable development for traditional power generation enterprises, including “society and environment,” “economy,” “resources and technology,” “enterprise management,” and “market.”
- (2)
- A hybrid research framework combining the ANP with fuzzy DEMATEL and fuzzy Delphi methods was established according to the primary index system. Twenty-two significant factors were distinguished with the fuzzy Delphi method. Their causal relationships were shaped using the fuzzy DEMATEL method. In these two processes, the expert groups’ opinions were expressed as linguistic ratings to express the factors’ characteristics. Finally, we identified the final preferences of key influencing factors through the ANP technique. Thus, core influencing factors were effectively recognized after clear computation procedures.
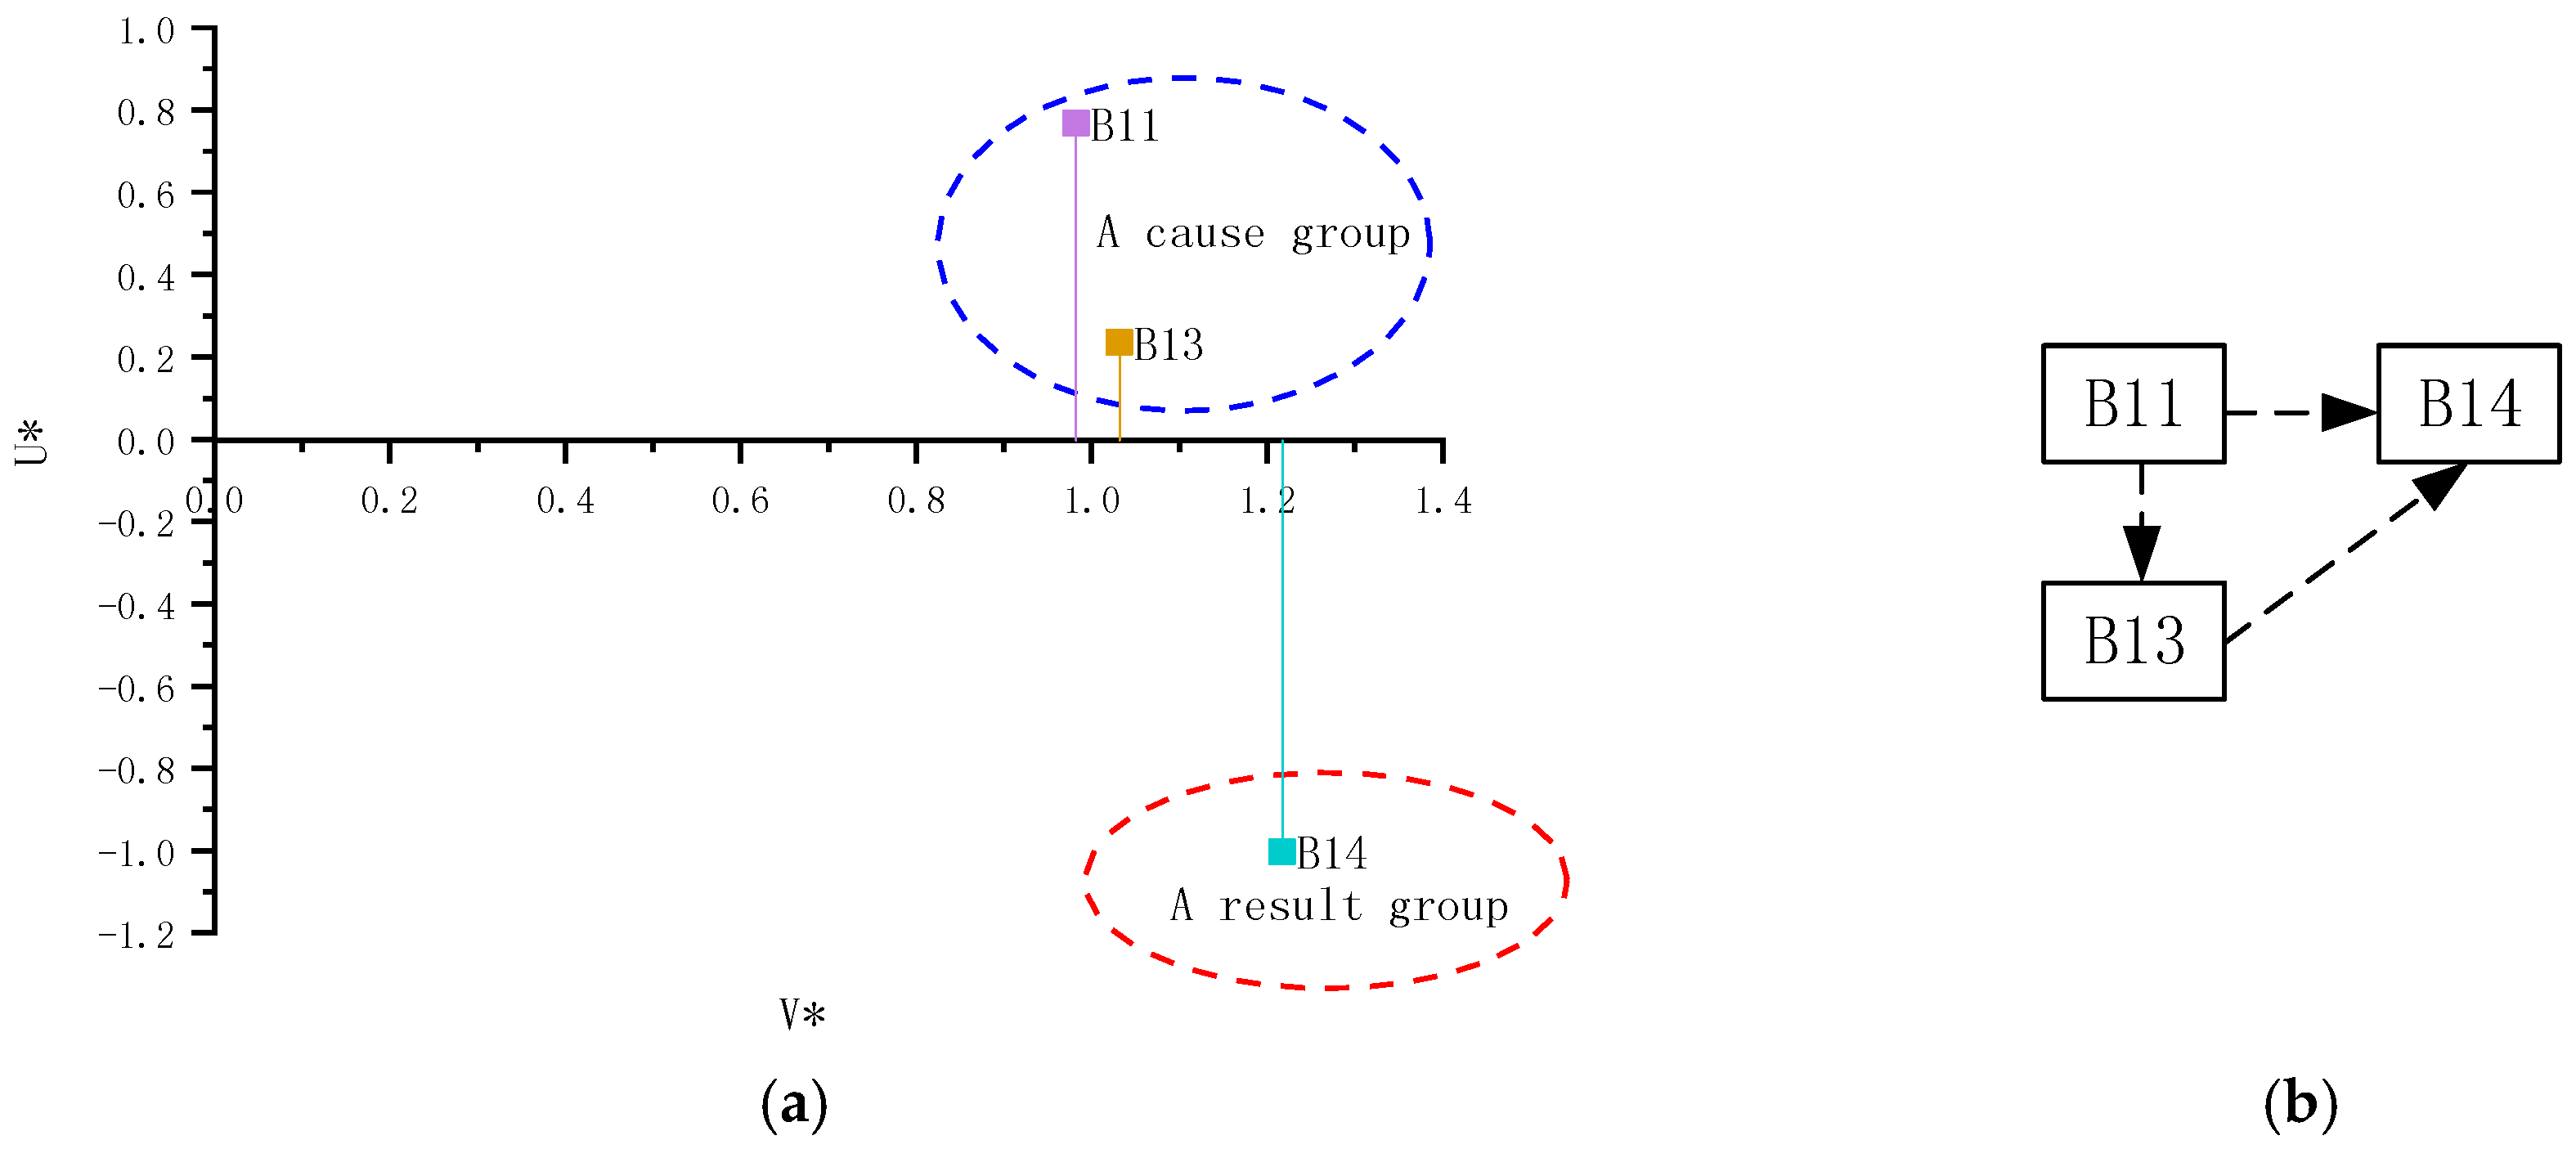
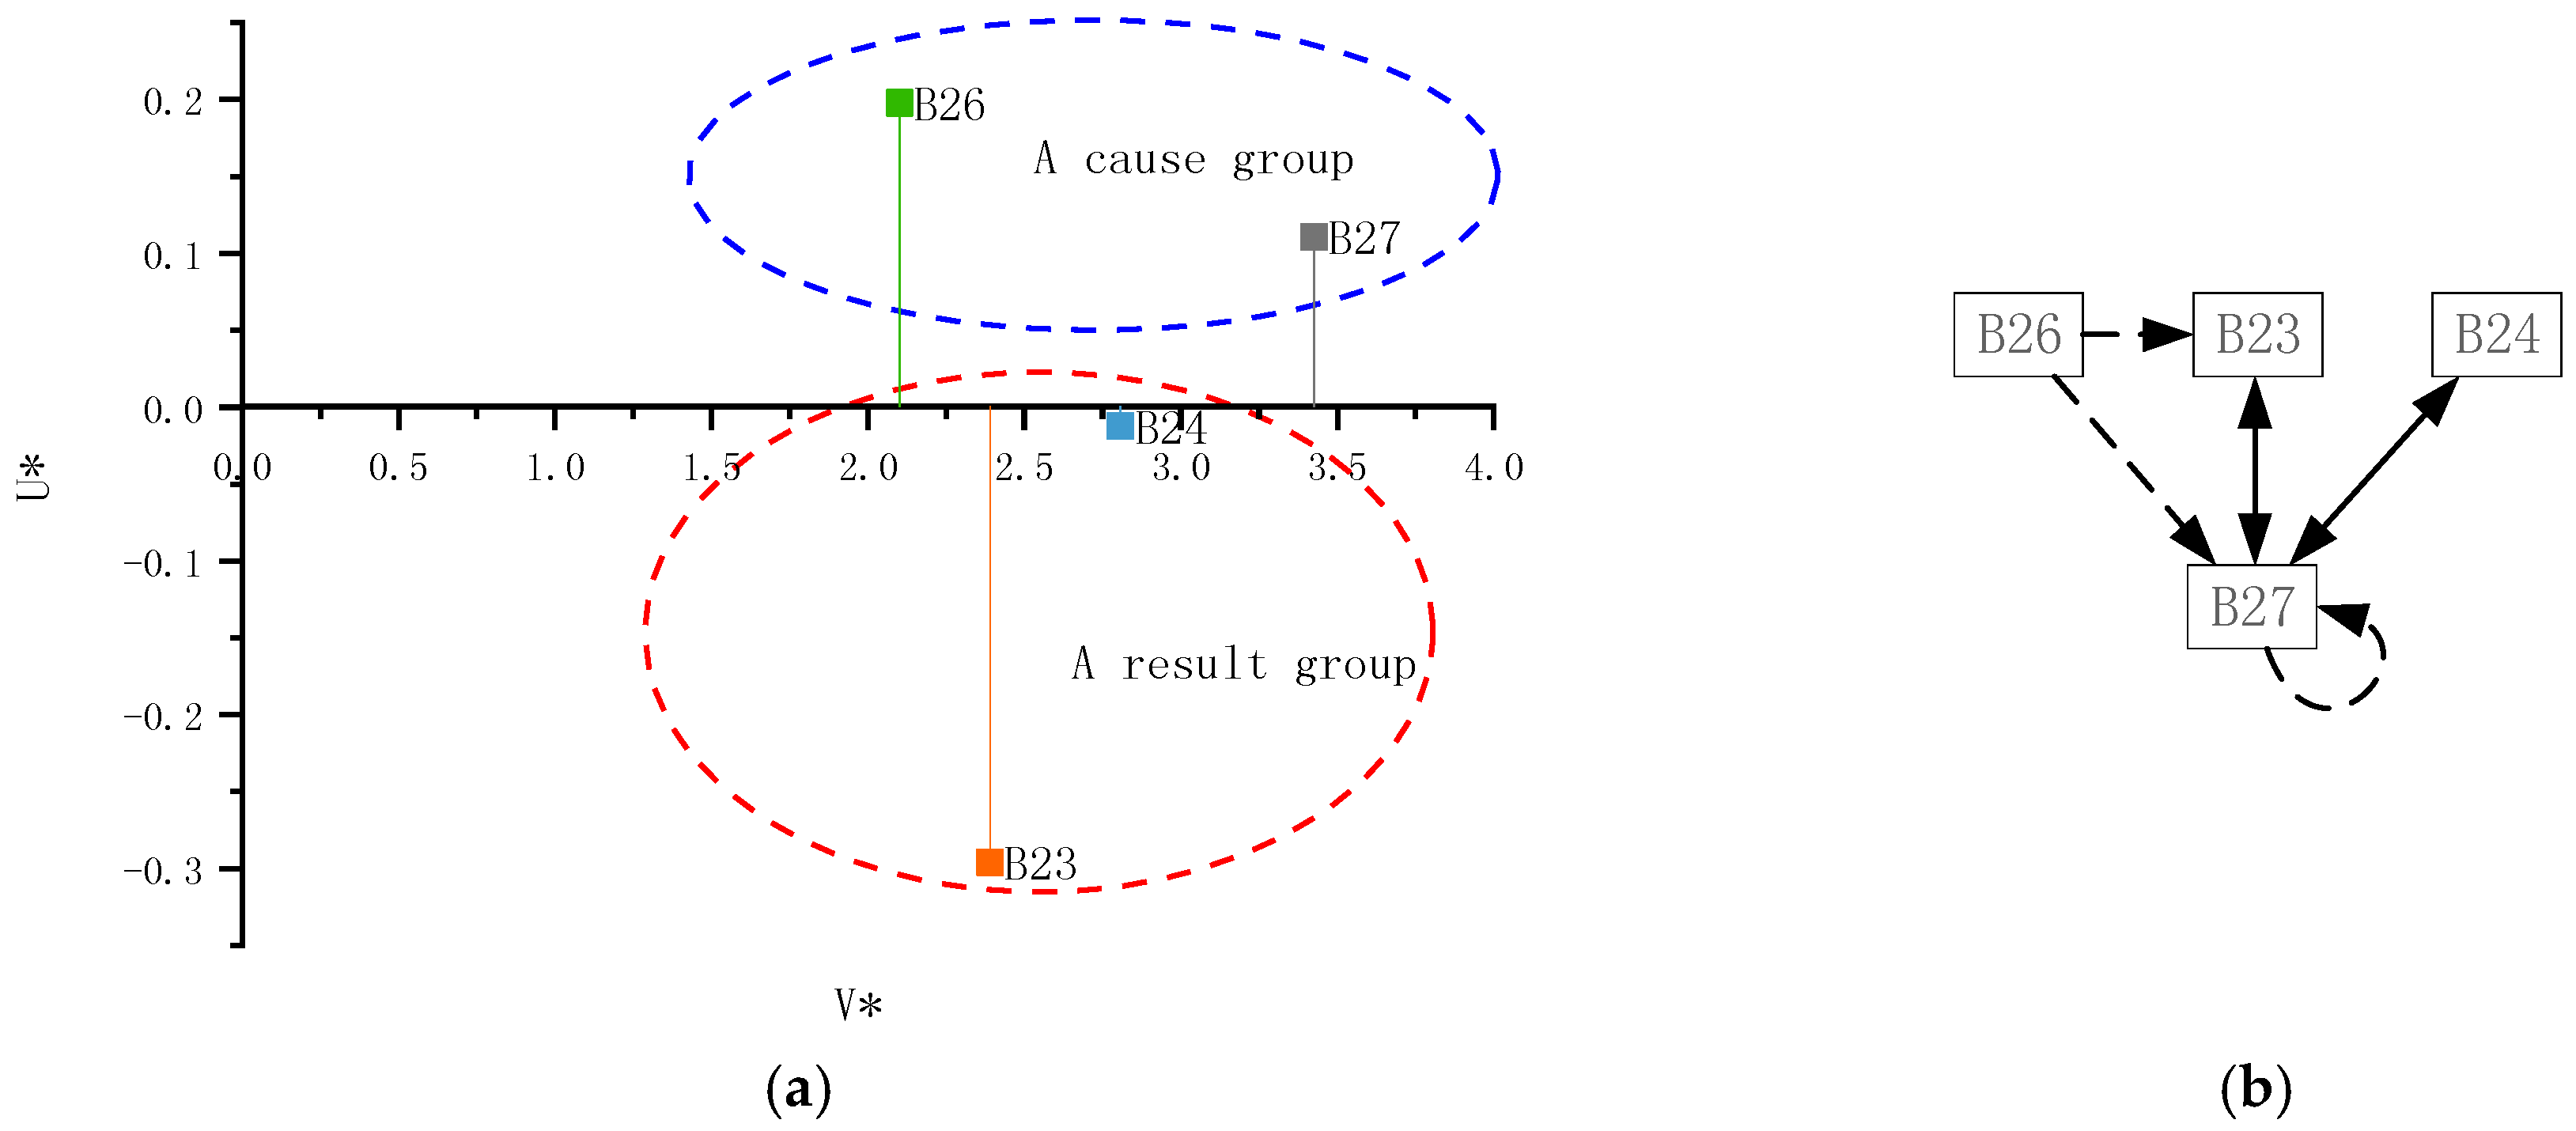
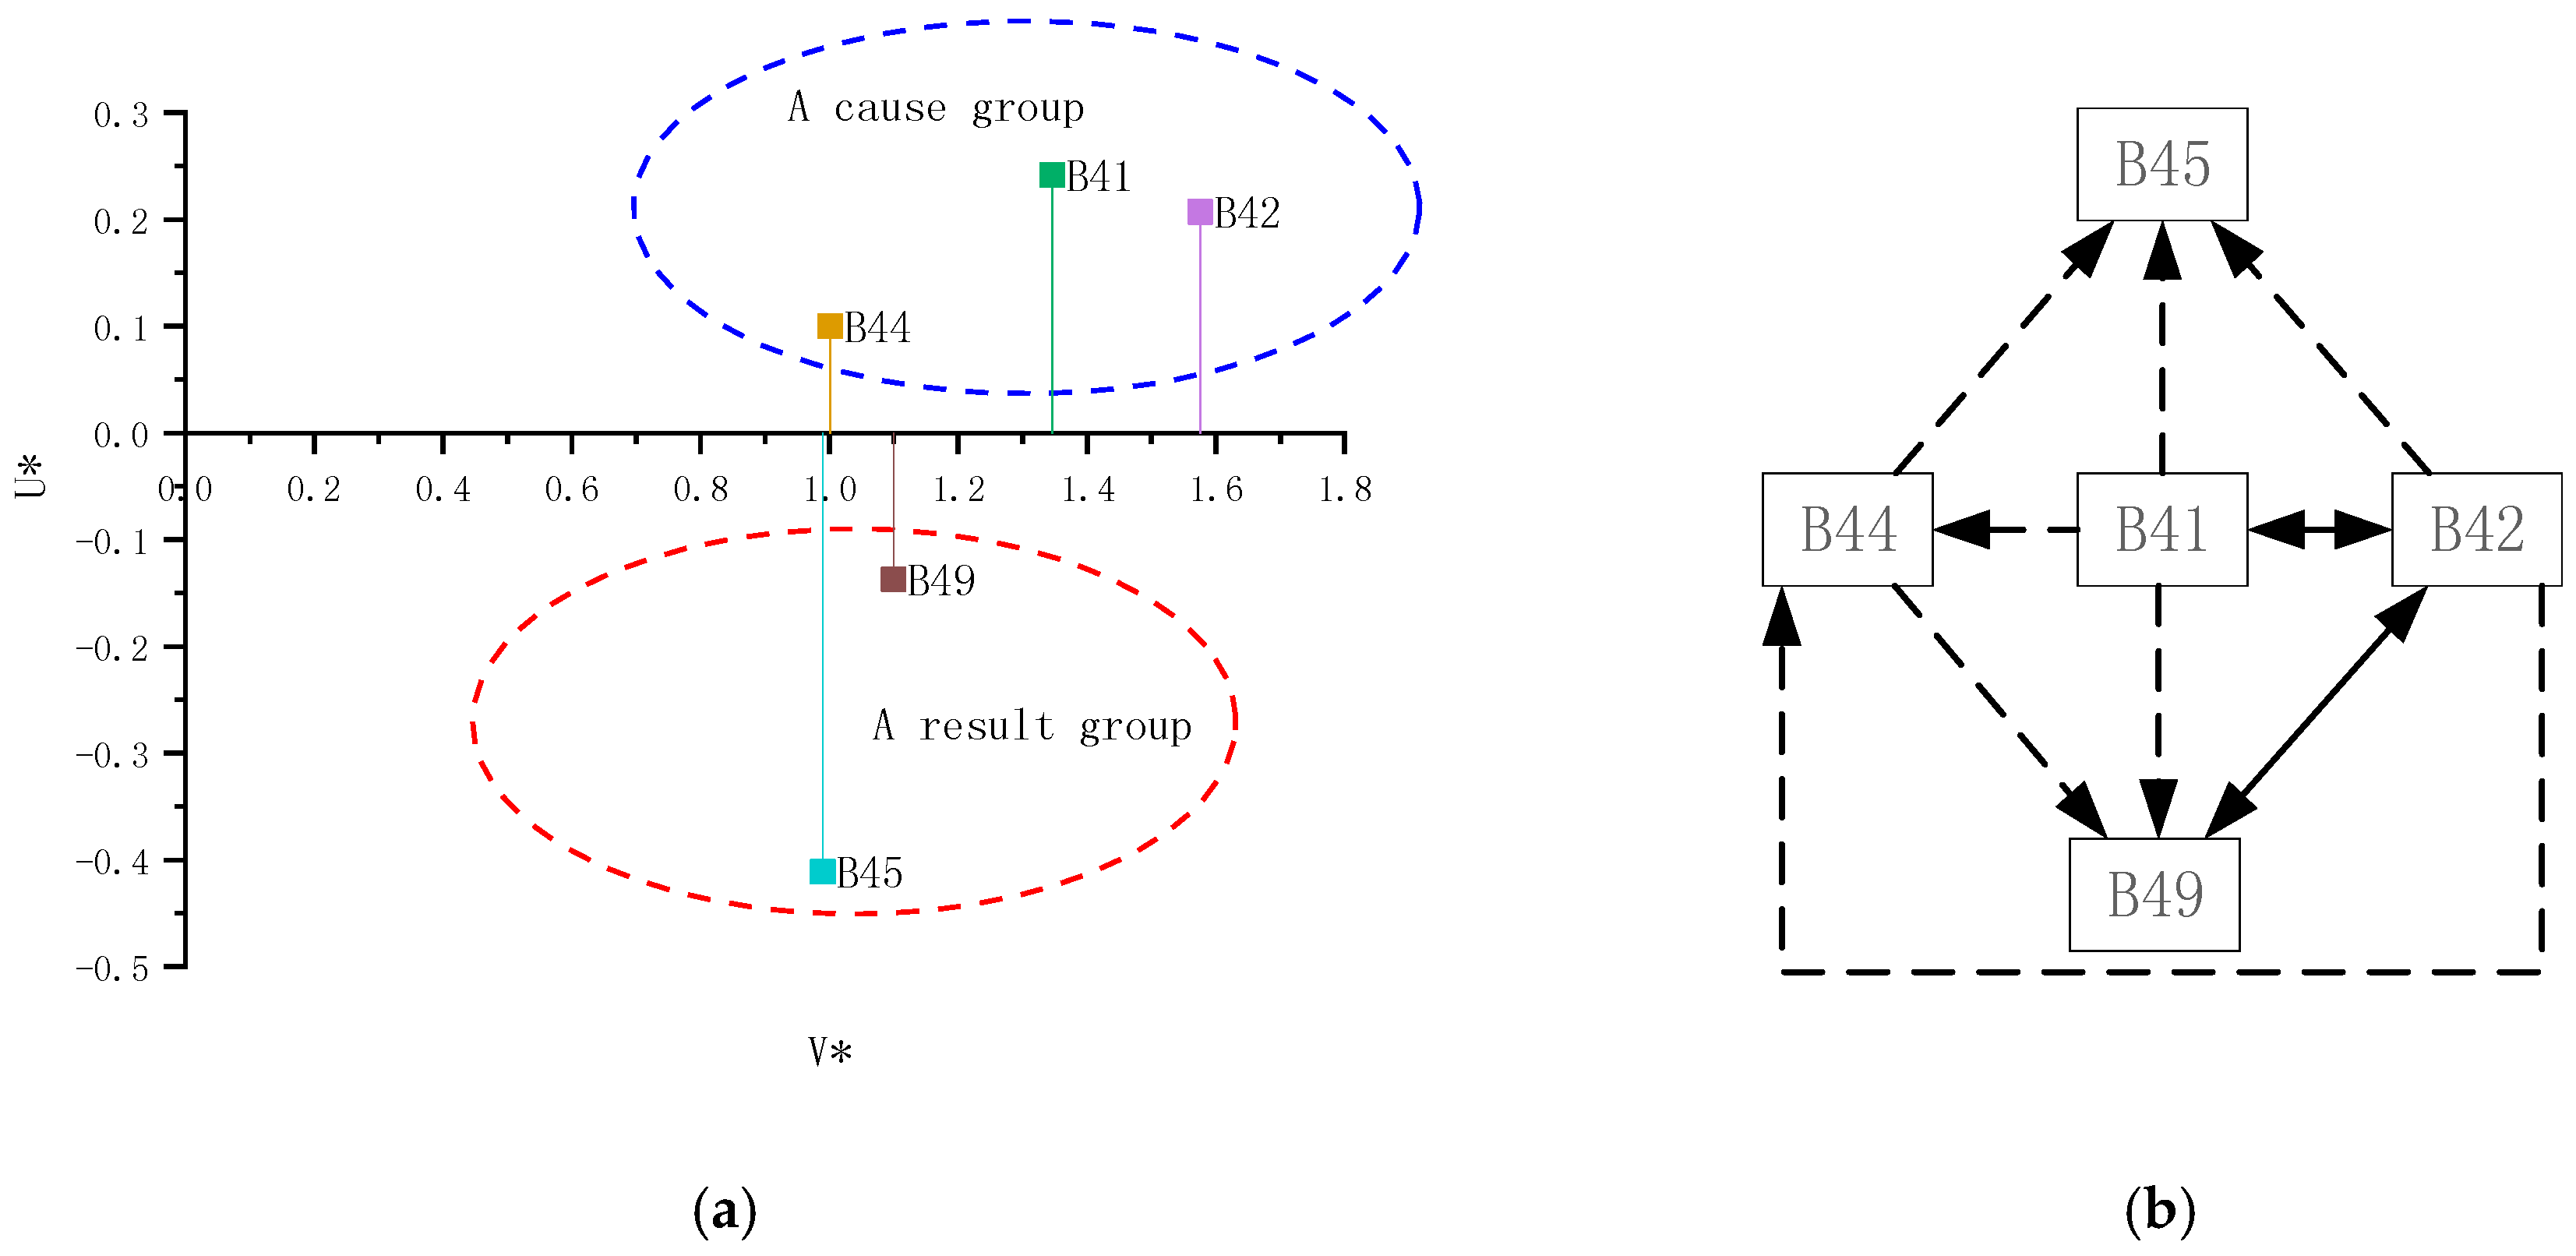
- (3)
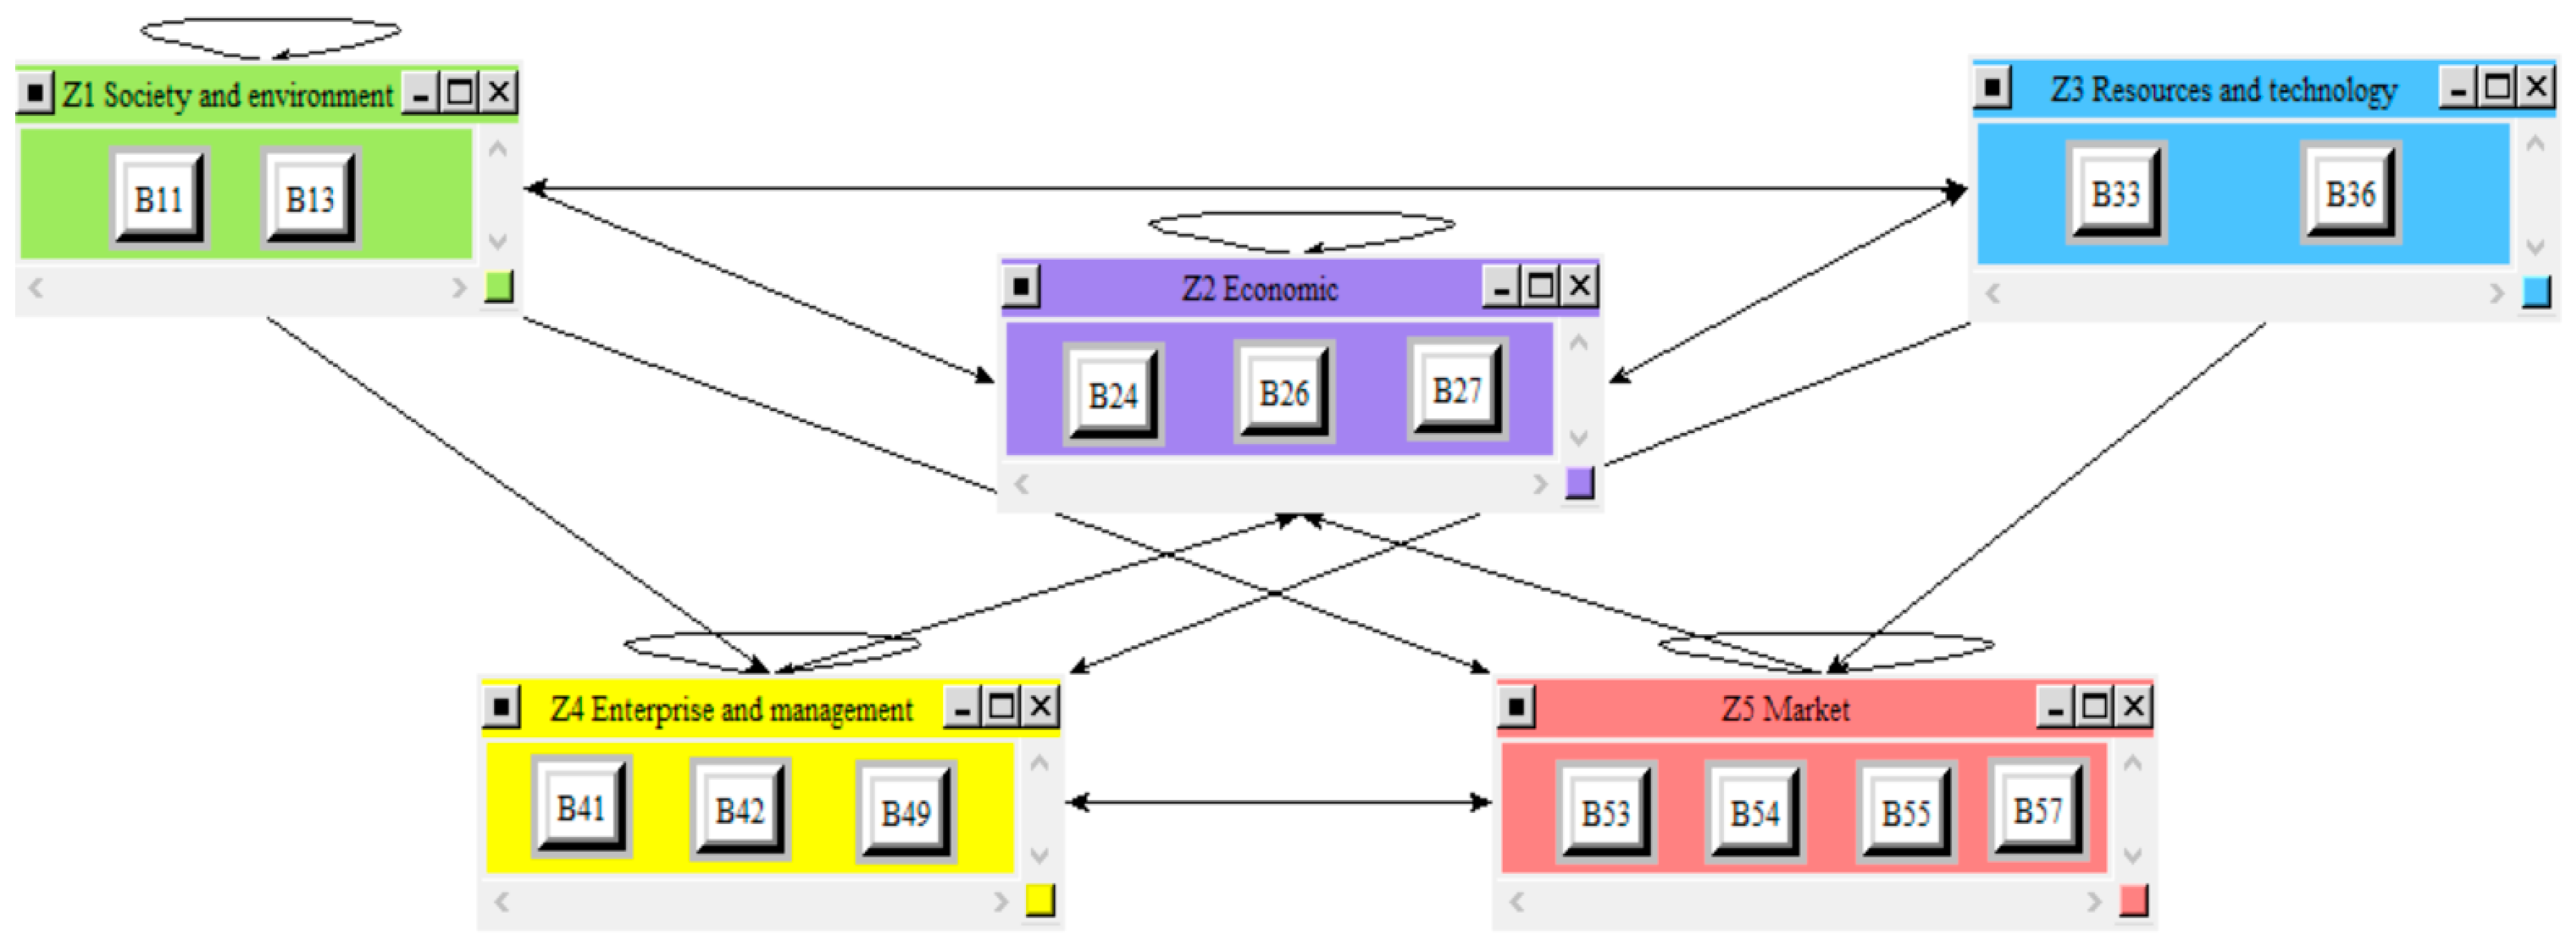
- All causal relationships among different criterion groups were built in Figure 3, Figure 4, Figure 5, Figure 6, Figure 7 and Figure 8. Fourteen criteria were selected as key factors, including “Electricity Market exposure (B11),” “Gross energy margin (B24),” “Market to market (B26),” “Earnings at risk (B27),” “Renewable energy installed ratio (B33),” “Technology maturity (B36),” “Price of electricity in market (B55),” “Pricing bidding strategy (B57),” etc. All of them were listed in Figure 8. Moreover, the final weights of 14 key factors were calculated and analyzed from both an academic and a practical perspective, as shown in Table 14. The views of the core factors from these two groups are basically the same. “Earnings at risk (B27)” and “Gross energy margin (B24)” both attracted more attention than other factors in these two groups. However, “Pricing bidding strategy (B57)” and “Renewable energy installed ratio (B33)” have drawn considerable attention from the academic group. On the other hand, the group of practitioners believes that “Technology maturity (B36)” and “Pricing bidding strategy (B57)” are important.
- (4)
- In order to put the research findings into practice, we gathered a series of suggestions from these expert groups with respect to key factors about actual countermeasures for TPGGs. They are listed in Table 15, including long-term development plan, establishing the trading management information system, developing asset portfolio and risk management tools, etc.
Author Contributions
Funding
Acknowledgments
Conflicts of Interest
References
- Wang, H.; Zhang, Y.; Lu, X.; Nielsen, C.P.; Bi, J. Understanding China’s carbon dioxide emissions from both production and consumption perspectives. Renew. Sustain. Energy Rev. 2015, 52, 189–200. [Google Scholar] [CrossRef]
- Zeng, M.; Yang, Y.Q.; Wang, L.H.; Sun, J.H. The power industry reform in China 2015: Policies, evaluations and solutions. Renew. Sustain. Energy Rev. 2016, 57, 94–110. [Google Scholar] [CrossRef]
- Liu, X.; Liu, G.; Yang, Z.; Chen, B.; Ulgiati, S. Comparing national environmental and economic performances through emergy sustainability indicators: Moving environmental ethics beyond anthropocentrism toward ecocentrism. Renew. Sustain. Energy Rev. 2016, 58, 1532–1542. [Google Scholar] [CrossRef]
- Nikolaou, I.E.; Tsalis, T.A.; Evangelinos, K.I. A framework to measure corporate sustainability performance: A strong sustainability-based view of firm. Sustain. Prod. Consum. 2019, 18, 1–18. [Google Scholar] [CrossRef]
- Fuisz-Kehrbach, S.K. A three-dimensional framework to explore corporate sustainability activities in the mining industry: Current status and challenges ahead. Resour. Policy 2015, 46, 101–115. [Google Scholar] [CrossRef]
- Shad, M.K.; Lai, F.W.; Fatt, C.L.; Klemeš, J.J.; Bokhari, A. Integrating sustainability reporting into enterprise risk management and its relationship with business performance: A conceptual framework. J. Clean. Prod. 2019, 208, 415–425. [Google Scholar] [CrossRef]
- Schulz, K.P.; Finstad-Milion, K.; Janczak, S. Educating corporate sustainability—A multidisciplinary and practice-based approach to facilitate students’ learning. J. Clean. Prod. 2018, 198, 996–1006. [Google Scholar] [CrossRef]
- Moldavska, A.; Welo, T. A Holistic approach to corporate sustainability assessment: Incorporating sustainable development goals into sustainable manufacturing performance evaluation. J. Manuf. Syst. 2019, 50, 53–68. [Google Scholar] [CrossRef]
- Beekaroo, D.; Callychurn, D.S.; Hurreeram, D.K. Developing a sustainability index for Mauritian manufacturing companies. Ecol. Indic. 2019, 96, 250–257. [Google Scholar] [CrossRef]
- Ilinitch, A.Y.; Soderstrom, N.S.; Thomas, T.E. Measuring corporate environmental performance. J. Account. Public Policy 1998, 17, 383–408. [Google Scholar] [CrossRef]
- Butnariu, A.; Avasilcai, S. The assessment of the companies’ sustainable development performance. Procedia Econ. Financ. 2015, 23, 1233–1238. [Google Scholar] [CrossRef]
- Lee, K.H.; Saen, R.F. Measuring corporate sustainability management: A data envelopment analysis approach. Int. J. Prod. Econ. 2012, 140, 219–226. [Google Scholar] [CrossRef]
- Lozano, R.; Carpenter, A.; Huisingh, D. A review of ‘theories of the firm’ and their contributions to Corporate Sustainability. J. Clean. Prod. 2015, 106, 430–442. [Google Scholar] [CrossRef]
- Zhao, Z.Y.; Zuo, J.; Wu, P.H.; Yan, H.; Zillante, G. Competitiveness assessment of the biomass power generation industry in China: A five forces model study. Renew. Energy 2016, 89, 144–153. [Google Scholar] [CrossRef]
- Kumar, S.; Luthra, S.; Haleem, A.; Mangla, S.K.; Garg, D. Identification and evaluation of critical factors to technology transfer using AHP approach. Int. Strateg. Manag. Rev. 2015, 3, 24–42. [Google Scholar] [CrossRef]
- Ghimire, L.P.; Kim, Y. An analysis on barriers to renewable energy development in the context of Nepal using AHP. Renew. Energy 2018, 129, 446–456. [Google Scholar] [CrossRef]
- Rahman, S.; Yang, L.; Waters, S. Factors affecting RFID adoption in Chinese manufacturing firms: An investigation using AHP. IFAC Proc. Vol. 2013, 46, 869–874. [Google Scholar] [CrossRef]
- Sharma, Y.K.; Yadav, A.K.; Mangla, S.K.; Patil, P.P. Ranking the Success Factors to Improve Safety and Security in Sustainable Food Supply Chain Management Using Fuzzy AHP. Mater. Today Proc. 2018, 5, 12187–12196. [Google Scholar] [CrossRef]
- Calabrese, A.; Costa, R.; Levialdi, N.; Menichini, T. Integrating sustainability into strategic decision-making: A fuzzy AHP method for the selection of relevant sustainability issues. Technol. Forecast. Soc. Chang. 2019, 139, 155–168. [Google Scholar] [CrossRef]
- Salari, M.; Rakhshandehroo, G.R.; Nikoo, M.R. Degradation of ciprofloxacin antibiotic by Homogeneous Fenton oxidation: Hybrid AHP-PROMETHEE method, optimization, biodegradability improvement and identification of oxidized by-products. Chemosphere 2018, 206, 157–167. [Google Scholar] [CrossRef]
- Schrippe, P.; Ribeiro, J.L.D. Preponderant criteria for the definition of corporate sustainability based on Brazilian sustainable companies. J. Clean. Prod. 2019, 209, 10–19. [Google Scholar] [CrossRef]
- Lin, X.; Cui, S.; Han, Y.; Geng, Z.; Zhong, Y. An improved ISM method based on GRA for hierarchical analyzing the influencing factors of food safety. Food Control 2018, 99, 48–56. [Google Scholar] [CrossRef]
- Kung, C.Y.; Yang, P.Y.; Jiang, W.L. Applying Grey Relational Analysis to Quality Function Deployment Process-A Case Study of Middle Medical Centers. In Proceedings of the The 11th Grey Theory and Applications Conference, Hsinchu City, Taiwan, 28 October 2006; pp. 7–9. [Google Scholar]
- Hsieh, M.C.; Wang, E.M.Y.; Lee, W.C.; Li, L.W.; Hsieh, C.Y.; Tsai, W.; Liu, T.C. Application of HFACS, fuzzy TOPSIS, and AHP for identifying important human error factors in emergency departments in Taiwan. Int. J. Ind. Ergon. 2018, 67, 171–179. [Google Scholar] [CrossRef]
- Subramaniya, K.P.; Dev, C.A.G.; SenthilKumar, V.S. Critical Success Factors: A TOPSIS approach to increase Agility Level in a Textile Industry. Mater. Today Proc. 2017, 4, 1510–1517. [Google Scholar] [CrossRef]
- Suganthi, L. Multi expert and multi criteria evaluation of sectoral investments for sustainable development: An integrated fuzzy AHP, VIKOR/DEA methodology. Sustain. Cities Soc. 2018, 43, 144–156. [Google Scholar] [CrossRef]
- Gupta, H. Assessing organizations performance on the basis of GHRM practices using BWM and Fuzzy TOPSIS. J. Environ. Manag. 2018, 226, 201–216. [Google Scholar] [CrossRef] [PubMed]
- Zeleny, M. Multiple Criteria Decision Making; McGraw Hill: New York, NY, USA, 1982. [Google Scholar]
- Quezada, L.E.; López-Ospina, H.A.; Palominos, P.I.; Oddershede, A.M. Identifying causal relationships in strategy maps using ANP and DEMATEL. Comput. Ind. Eng. 2018, 118, 170–179. [Google Scholar] [CrossRef]
- Ding, X.F.; Liu, H.C. A 2-dimension uncertain linguistic DEMATEL method for identifying critical success factors in emergency management. Appl. Soft Comput. 2018, 71, 386–395. [Google Scholar] [CrossRef]
- Lin, S.; Li, C.; Xu, F.; Liu, D.; Liu, J. Risk identification and analysis for new energy power system in China based on D numbers and decision-making trial and evaluation laboratory (DEMATEL). J. Clean. Prod. 2018, 180, 81–96. [Google Scholar] [CrossRef]
- Fan, Z.P.; Suo, W.L.; Feng, B. Identifying risk factors of IT outsourcing using interdependent information: An extended DEMATEL method. Expert Syst. Appl. 2012, 39, 3832–3840. [Google Scholar] [CrossRef]
- Gardas, B.B.; Raut, R.D.; Narkhede, B. Evaluating critical causal factors for post-harvest losses (PHL) in the fruit and vegetables supply chain in India using the DEMATEL approach. J. Clean. Prod. 2018, 199, 47–61. [Google Scholar] [CrossRef]
- Mavi, R.K.; Standing, C. Critical success factors of sustainable project management in construction: A fuzzy DEMATEL-ANP approach. J. Clean. Prod. 2018, 194, 751–765. [Google Scholar] [CrossRef]
- Wang, L.; Cao, Q.; Zhou, L. Research on the influencing factors in coal mine production safety based on the combination of DEMATEL and ISM. Saf. Sci. 2018, 103, 51–61. [Google Scholar] [CrossRef]
- Liang, H.; Ren, J.; Gao, Z.; Gao, S.; Luo, X.; Dong, L.; Scipioni, A. Identification of critical success factors for sustainable development of biofuel industry in China based on grey decision-making trial and evaluation laboratory (DEMATEL). J. Clean. Prod. 2016, 131, 500–508. [Google Scholar] [CrossRef]
- Jianfei, S.; Song, X.; Ming, Z.; Yi, W.; Yuejin, W.; Xiaoli, L.; Zhijie, W. Low-carbon development strategies for the top five power generation groups during China’s 12th Five-Year Plan period. Renew. Sustain. Energy Rev. 2014, 34, 350–360. [Google Scholar] [CrossRef]
- Orlitzky, M.; Schmidt, F.L.; Rynes, S.L. Corporate social and financial performance: A meta-analysis. Organ. Stud. 2003, 24, 403–441. [Google Scholar] [CrossRef]
- Zhang, X.; Wu, Z.; Feng, Y.; Xu, P. “Turning green into gold”: A framework for energy performance contracting (EPC) in China’s real estate industry. J. Clean. Prod. 2015, 109, 166–173. [Google Scholar] [CrossRef]
- Hsu, C.H.; Chang, A.Y.; Luo, W. Identifying key performance factors for sustainability development of SMEs–integrating QFD and fuzzy MADM methods. J. Clean. Prod. 2017, 161, 629–645. [Google Scholar] [CrossRef]
- Díaz-García, C.; González-Moreno, Á.; Sáez-Martínez, F.J. Eco-innovation: Insights from a literature review. Innovation 2015, 17, 6–23. [Google Scholar] [CrossRef]
- Rennings, K. Redefining innovation—Eco-innovation research and the contribution from ecological economics. Ecol. Econ. 2000, 32, 319–332. [Google Scholar] [CrossRef]
- Chang, A.Y.; Cheng, Y.T. Analysis model of the sustainability development of manufacturing small and medium-sized enterprises in Taiwan. J. Clean. Prod. 2019, 207, 458–473. [Google Scholar] [CrossRef]
- Carroll, A.B.; Shabana, K.M. The business case for corporate social responsibility: A review of concepts, research and practice. Int. J. Manag. Rev. 2010, 12, 85–105. [Google Scholar] [CrossRef]
- Atkinson, G. Measuring corporate sustainability. J. Environ. Plan. Manag. 2000, 43, 235–252. [Google Scholar] [CrossRef]
- Chofreh, A.G.; Goni, F.A.; Klemeš, J.J. Evaluation of a framework for sustainable Enterprise Resource Planning systems implementation. J. Clean. Prod. 2018, 190, 778–786. [Google Scholar] [CrossRef]
- Zhao, H.; Li, N. Evaluating the performance of thermal power enterprises using sustainability balanced scorecard, fuzzy Delphic and hybrid multi-criteria decision making approaches for sustainability. J. Clean. Prod. 2015, 108, 569–582. [Google Scholar] [CrossRef]
- de Jesus Pacheco, D.A.; Carla, S.; Jung, C.F.; Ribeiro, J.L.D.; Navas, H.V.G.; Cruz-Machado, V.A. Eco-innovation determinants in manufacturing SMEs: Systematic review and research directions. J. Clean. Prod. 2017, 142, 2277–2287. [Google Scholar] [CrossRef]
- Tomšič, N.; Bojnec, Š.; Simčič, B. Corporate sustainability and economic performance in small and medium sized enterprises. J. Clean. Prod. 2015, 108, 603–612. [Google Scholar] [CrossRef]
- Li, R.; Dong, J.; Wang, D. Competition ability evaluation of power generation enterprises using a hybrid MCDM method under fuzzy and hesitant linguistic environment. J. Renew. Sustain. Energy 2018, 10, 055905. [Google Scholar] [CrossRef]
- Matinaro, V.; Liu, Y.; Poesche, J. Extracting key factors for sustainable development of enterprises: Case study of SMEs in Taiwan. J. Clean. Prod. 2019, 209, 1152–1169. [Google Scholar] [CrossRef]
- Klemes, J.J. (Ed.) Assessing and Measuring Environmental Impact and Sustainability; Butterworth-Heinemann: Oxford, UK, 2015. [Google Scholar]
- Ruhang, X.; Zixin, S.; Qingfeng, T.; Zhuangzhuang, Y. The cost and marketability of renewable energy after power market reform in China: A review. J. Clean. Prod. 2018, 204, 409–424. [Google Scholar] [CrossRef]
- Weerts, K.; Vermeulen, W.; Witjes, S. On corporate sustainability integration research: Analysing corporate leaders’ experiences and academic learnings from an organisational culture perspective. J. Clean. Prod. 2018, 203, 1201–1215. [Google Scholar] [CrossRef]
- Leyh, C.; Rossetto, M.; Demez, M. Sustainability management and its software support in selected Italian enterprises. Comput. Ind. 2014, 65, 386–392. [Google Scholar] [CrossRef]
- Witjes, S.; Vermeulen, W.J.; Cramer, J.M. Assessing Corporate Sustainability integration for corporate self-reflection. Resour. Conserv. Recycl. 2017, 127, 132–147. [Google Scholar] [CrossRef]
- ur Rehman, M.H.; Chang, V.; Batool, A.; Wah, T.Y. Big data reduction framework for value creation in sustainable enterprises. Int. J. Inf. Manag. 2016, 36, 917–928. [Google Scholar] [CrossRef]
- Sun, S.; Feng, Y.; Zhou, J. Research on the Influencing Factors of Dynamic Marketing Capability Based on Grounded Theory—Taking IT Industry as an Example. J. Technol. Econ. Manag. 2014, 5, 38–42. [Google Scholar]
- Shi, G.; Han, H. Analysis and Countermeasures of Incentive Factors for New Generation Knowledge Workers. Enterp. Econ. 2014, 11, 62–66. [Google Scholar]
- Albayrak, T. Importance Performance Competitor Analysis (IPCA): A study of hospitality companies. Int. J. Hosp. Manag. 2015, 48, 135–142. [Google Scholar] [CrossRef]
- Zadeh, L.A. Fuzzy sets as a basis for a theory of possibility. Fuzzy Sets Syst. 1999, 100, 9–34. [Google Scholar] [CrossRef]
- Wang, Y.-J. Ranking triangle and trapezoidal fuzzy numbers based on the relative preference relation. Appl. Math. Model. 2015, 39, 586–599. [Google Scholar] [CrossRef]
- Xu, J.; Wan, S.P.; Dong, J.Y. Aggregating decision information into Atanassov’s intuitionistic fuzzy numbers for heterogeneous multi-attribute group decision making. Appl. Soft Comput. 2016, 41, 331–351. [Google Scholar] [CrossRef]
- Liu, H.C.; You, J.X.; You, X.Y.; Shan, M.M. A novel approach for failure mode and effects analysis using combination weighting and fuzzy VIKOR method. Appl. Soft Comput. 2015, 28, 579–588. [Google Scholar] [CrossRef]
- Zadeh, L.A. Fuzzy sets. Inf. Control 1965, 8, 338–353. [Google Scholar] [CrossRef]
- Murray, T.J.; Pipino, L.L.; van Gigch, J.P. A pilot study of fuzzy set modification of Delphi. Hum. Syst. Manag. 1985, 5, 76–80. [Google Scholar]
- Huang, J.; Shen, K.Y.; Shieh, J. Strengthen Financial Holding Companies’ Business Sustainability by Using a Hybrid Corporate Governance Evaluation Model. Sustainability 2019, 11, 582. [Google Scholar] [CrossRef]
- Dalalah, D.; Hayajneh, M.; Batieha, F. A fuzzy multi-criteria decision making model for supplier selection. Expert Syst. Appl. 2011, 38, 8384–8391. [Google Scholar] [CrossRef]
- Singh, R.K.; Benyouce, L. A fuzzy TOPSIS based approach for e-sourcing. Eng. Appl. Artif. Intell. 2011, 24, 437–448. [Google Scholar] [CrossRef]
- Saaty, T.L. Decisions with the Analytic Network Process (ANP); Springer: New York, NY, USA, 2006. [Google Scholar]
- Yunn, W.; Geng, S. Multi-criteria decision making on selection of solar–wind hybrid power station location: A case of China. Energy Convers. Manag. 2014, 81, 527–533. [Google Scholar] [CrossRef]
- Sun, H.; Tian, P.; Wang, L. Network Analytic Hierarchy Process and Decision Science; National Defense Industry Press: Beijing, China, 2011. [Google Scholar]
- Fabjanowicz, M.; Bystrzanowska, M.; Namieśnik, J.; Tobiszewski, M.; Płotka-Wasylka, J. An analytical hierarchy process for selection of the optimal procedure for resveratrol determination in wine samples. Microchem. J. 2018, 142, 126–134. [Google Scholar] [CrossRef]
- Dong, J.; Huo, H.; Liu, D.; Li, R. Evaluating the Comprehensive Performance of Demand Response for Commercial Customers by Applying Combination Weighting Techniques and Fuzzy VIKOR Approach. Sustainability 2017, 9, 1332. [Google Scholar] [CrossRef]
- Şengül, Ü.; Eren, M.; Shiraz, S.E.; Gezder, V.; Şengül, A.B. Fuzzy TOPSIS method for ranking renewable energy supply systems in Turkey. Renew. Energy 2015, 75, 617–625. [Google Scholar] [CrossRef]
- Bourbon, R.; Ngueveu, S.U.; Roboam, X.; Sareni, B. Energy management optimization of a smart wind power plant compaing heuristic and linear programming methods. Math. Comput. Simul. 2019, 158, 418–431. [Google Scholar] [CrossRef]
- Huang, Y.; Zhang, Y.; Li, L. Foreign direct investment and cleaner production choice: Evidence from Chinese coal-fired power generating enterprises. J. Clean. Prod. 2019, 212, 766–778. [Google Scholar] [CrossRef]
- Chan, H.R.; Fell, H.; Lange, L.; Li, S. Efficiency and environmental impacts of electricity restructuring on coal-fired power plants. J. Environ. Econ. Manag. 2017, 81, 1–18. [Google Scholar] [CrossRef]


| Criteria | Sub-Criteria | References |
|---|---|---|
| Society and environment (Z1) |
| [46] |
| [2,47,48,49] | |
| [50] | |
| [49,51] | |
| [47,49,50,52] | |
| [47,49] | |
| Economy (Z2) |
| [46,50,53] |
| [46,53] | |
| [47,50] | |
| [47] | |
| [47] | |
| ||
| ||
| Resources and technology (Z3) |
| [46,51,52] |
| [50,53,54] | |
| [50] | |
| [47] | |
| [46,55,56,57,58] | |
| [46,47,49,52,57] | |
| [47] | |
| Enterprise management (Z4) |
| [49,54] |
| [49,54] | |
| [54,56] | |
| [54] | |
| [49] | |
| [47] | |
| [46,47,49] | |
| [46,49,59] | |
| [46,47] | |
| Market (Z5) |
| [58] |
| [53] | |
| [12,60] | |
| [46] | |
| [53] | |
| ||
| [53] |
| Linguistic Variable | TFNs |
|---|---|
| Very high effects (VH) | (0.75,1,1) |
| High effects (H) | (0.5,0.75,1) |
| Low effects (L) | (0.25,0.5,0.75) |
| Very low effects (VL) | (0,0.25,0.5) |
| No effects (N) | (0,0,0.25) |
| Normalized Eigenvector | ||
|---|---|---|
| Number | Educational Level | Experience | Gender | Age Range | Affiliation | |
|---|---|---|---|---|---|---|
| Male | Female | |||||
| Expert group 1 | Master’s or above | ≥6 | 2 | 2 | 34–60 | Government departments |
| Expert group 2 | Master’s or above | ≥8 | 2 | 2 | 33–56 | Traditional power generation groups |
| Expert group 3 | Bachelor’s or above | ≥8 | 3 | 1 | 32–58 | Mature power groups abroad |
| Expert group 4 | Doctorate | ≥16 | 2 | 2 | 42–56 | Universities |
| Expert group 5 | Bachelor’s or above | ≥8 | 3 | 1 | 45–54 | Enterprises |
| Criteria | Sub-Criteria | Description |
|---|---|---|
| Society and environment (Z1) |
| Requirements for the TPGGs to adapt to the market environment vary from different degree of electricity market openness. |
| Relative laws can support reform policies, which can directly affect the effectives of the power industry reform and the motivation to transform for power enterprises. For example, the “No. 9 Document” and its supporting documents. | |
| The ability of continuous power supply, including average power outage time, average number of power outages and equivalent hours, which indicates the dependability and stability of power generation. | |
| Can provide personalized service to users based on user data, such as payment scheme of electricity, energy consumption analysis. | |
| The pollution that TPGGs causes, such as NOx, fly ash, sulfur dioxide, and industrial soot. | |
| It represents the satisfaction of power grid enterprises, and is also a manifestation of the quality of power service provided by power generation enterprises. | |
| Economy (Z2) |
| Capital costs consists of land cost, necessary equipment for the operation of an enterprise. |
| The operation and maintenance fee in generation. | |
| Reflexes earning ability of TPGGs. | |
| It is to measure the value of an asset portfolio, which is the sum of the discounted cash flows on the energy market over a specified period (revenue of sales – costs of purchase). | |
| Increased value of electricity sale income of power generation enterprises over the last year. It reflects the marketing ability and competitiveness of power generation enterprises to a certain extent | |
| A financial indicator that measures the sum of the discounted unrealized cash flows on the energy market over a specified period. | |
| It is a financial indicator related to risks, which represents the maximum potential loss on the GEM until maturity with a given probability due to the impact of energy market risks (namely price & volume). In an initial market, investment portfolios, market environment and so on will add the uncertainties in profitability, which can influence the sustainable operation of TPGG. | |
| Resources, and technology (Z3) |
| Including capital, generator units, customer resources, brand image and the platform for large-scale deployment of resources. |
| Refers to the total amount of power generation potential of a unit’s produce ability when operated at full capacity, which is closely connected to power generation technology [75]. | |
| Reflects the cleaning energy produce capability. | |
| The ratio of the actual utilization hours of a generator set to the planned utilization hours. It is the technical and economic index that reflects equipment working state and production efficiency. | |
| Advanced and specialized IT applications such as Assistant Decision-Making System, ERP, CRM as well as big data and cloud computing are conduits for enterprises to strengthen the energy trading management. | |
| Technics for power asset portfolio optimization, development of risk management tools, information safety, forecasting method, energy management optimization [76] and so on. | |
| The environment affects the development of enterprises, and investment in green technology can increase the competitiveness [47], such as the investment in desulfurization equipment of coal-fired unit [77,78], upgrade to the cleaner production. | |
| Enterprise management (Z4) |
| Corporate culture and business philosophy such as market oriented, responsive, inclusive, open, innovative, those are essential to a group in the market competition. |
| Only when senior managers recognize the opportunities brought by market and have the determination can the transformation in group be implemented. | |
| Traditional organization structure doesn’t match the new rules in the market environment | |
| The practice of mature power group abroad shows that clear demarcation of department rights and duties is the basis of ensuring good operation of the organization. | |
| The competition between enterprises is the talent competition, talent reserve and training, talents with proficiency of mathematics, electricity market, financial, technology and economics are critical for TPGGs’ development. | |
| It means accidents and injuries in the workplace. Employee accidents could have a huge effect on corporate business, such as reduced productivity, lost sales, lower staff morale, or even closure. | |
| Build a physical and virtual platform for joint client-staff learning, knowledge sharing and innovation can enhance the collective capacity to accelerate the transformation in the reform. | |
| An important part of human resources management, and it’s the factors that can stimulate employees’ behavior and arouse their enthusiasm for work [54]. | |
| Compared with power generation enterprises in a mature market, marketing experience of TPGG is less. The power generation-centric business chain structure is not suitable for the market-oriented business environment. Challenges on financial risks, policy risks, technological risks are huge and complex. It includes the capability to minimize group budget volatility caused by uncertainties in the electricity market, and to minimize group financial performance changes due to fluctuations in fuel futures prices between consecutive group budgeting cycles. | |
| Market (Z5) |
| Power generation enterprises with strong brand effect can attract users more, thus increasing sales revenue in the market environment. |
| Due to the actual situation of electricity market construction in China, different mechanisms will directly affect the decision-making of power groups. | |
| It may help an enterprise to mitigate its sustainability risks [12] to consider competitors’ performance in addition to attribute importance because of the open system characteristics of companies and the intense competition in the marketplace [60]. | |
| Capability of forecasting is the basic for enterprise in the market environment, including medium-and long-term forecasts and short-term forecasts. | |
| Market price is very important for power generation companies, which directly affects their income, profit and later decision. | |
| Consumer resource will be an important possession for power group in the electricity market, especially in the retail market. It needs good management to maintain. | |
| In order to obtain the maximum profit, the enterprise will adjust its quotation strategy according to the market situation, which will affect the market price and their profits. |
| Potential Criteria | Expert Group 1 | Expert Group 2 | Expert Group 3 | Expert Group 4 | Expert Group 5 | ||||||
| Main Criteria | Sub-Criteria | Min | Max | Min | Max | Min | Max | Min | Max | Min | Max |
| Society and environment (Z1) | B11 | 6 | 9 | 6 | 8 | 7 | 9 | 8 | 10 | 6 | 9 |
| B12 | 7 | 9 | 4 | 7 | 5 | 6 | 3 | 5 | 2 | 5 | |
| B13 | 7 | 10 | 8 | 9 | 7 | 9 | 6 | 9 | 8 | 10 | |
| B14 | 7 | 8 | 8 | 9 | 7 | 8 | 4 | 6 | 5 | 7 | |
| B15 | 6 | 7 | 5 | 7 | 5 | 6 | 6 | 7 | 4 | 6 | |
| B16 | 3 | 6 | 4 | 5 | 5 | 8 | 4 | 8 | 5 | 7 | |
| Economy (Z2) | B21 | 2 | 5 | 3 | 7 | 4 | 6 | 5 | 6 | 6 | 7 |
| B22 | 3 | 5 | 2 | 5 | 5 | 7 | 5 | 8 | 3 | 5 | |
| B23 | 7 | 9 | 6 | 7 | 6 | 8 | 7 | 9 | 5 | 7 | |
| B24 | 5 | 8 | 7 | 9 | 6 | 8 | 4 | 7 | 5 | 6 | |
| B25 | 4 | 6 | 5 | 6 | 6 | 8 | 5 | 6 | 5 | 6 | |
| B26 | 5 | 7 | 4 | 7 | 6 | 8 | 7 | 8 | 6 | 9 | |
| B27 | 5 | 6 | 4 | 7 | 7 | 9 | 5 | 6 | 6 | 7 | |
| Resources and technology (Z3) | B31 | 6 | 9 | 5 | 7 | 5 | 7 | 4 | 7 | 4 | 8 |
| B32 | 2 | 4 | 4 | 5 | 3 | 6 | 5 | 7 | 2 | 5 | |
| B33 | 6 | 8 | 7 | 9 | 5 | 8 | 6 | 9 | 6 | 9 | |
| B34 | 2 | 4 | 2 | 3 | 3 | 5 | 3 | 6 | 2 | 4 | |
| B35 | 5 | 7 | 6 | 8 | 6 | 8 | 6 | 8 | 5 | 8 | |
| B36 | 6 | 8 | 5 | 8 | 7 | 9 | 6 | 8 | 7 | 8 | |
| B37 | 5 | 6 | 4 | 6 | 5 | 7 | 5 | 6 | 5 | 9 | |
| Enterprise management (Z4) | B41 | 5 | 6 | 6 | 8 | 7 | 9 | 4 | 6 | 5 | 8 |
| B42 | 7 | 9 | 5 | 8 | 6 | 9 | 4 | 7 | 5 | 7 | |
| B43 | 5 | 6 | 4 | 6 | 6 | 8 | 4 | 6 | 5 | 6 | |
| B44 | 4 | 6 | 4 | 7 | 6 | 7 | 6 | 8 | 6 | 8 | |
| B45 | 5 | 7 | 5 | 7 | 6 | 7 | 6 | 8 | 5 | 7 | |
| B46 | 1 | 4 | 3 | 5 | 2 | 5 | 2 | 5 | 4 | 7 | |
| B47 | 4 | 5 | 3 | 5 | 5 | 6 | 6 | 7 | 5 | 7 | |
| B48 | 3 | 4 | 5 | 7 | 5 | 8 | 6 | 7 | 6 | 8 | |
| B49 | 6 | 8 | 5 | 8 | 7 | 10 | 6 | 9 | 7 | 10 | |
| Market (Z5) | B51 | 6 | 8 | 7 | 8 | 7 | 9 | 7 | 9 | 7 | 8 |
| B52 | 6 | 9 | 7 | 9 | 4 | 6 | 4 | 5 | 3 | 6 | |
| B53 | 4 | 6 | 6 | 7 | 7 | 9 | 6 | 9 | 7 | 10 | |
| B54 | 7 | 10 | 7 | 10 | 7 | 10 | 7 | 9 | 8 | 10 | |
| B55 | 5 | 8 | 6 | 9 | 6 | 8 | 7 | 8 | 6 | 9 | |
| B56 | 3 | 6 | 4 | 5 | 5 | 7 | 5 | 6 | 7 | 9 | |
| B57 | 6 | 9 | 7 | 9 | 7 | 10 | 8 | 9 | 7 | 9 | |
| Potential Factors | Pessimistic TFNs | Optimistic TFNs | Consensus Value | Results | ||||||
|---|---|---|---|---|---|---|---|---|---|---|
| Main Criteria | Sub-Criteria | |||||||||
| Society and environment (Z1) | B11 | 6 | 6.55 | 8 | 8 | 8.98 | 10 | 3.45 | 7.77 | √ |
| B12 | 2 | 3.84 | 7 | 5 | 6.24 | 9 | 3.16 | 5.56 | ||
| B13 | 6 | 7.16 | 8 | 9 | 9.39 | 10 | 3.84 | 8.28 | √ | |
| B14 | 4 | 6.01 | 8 | 6 | 7.53 | 9 | 0.99 | 6.87 | √ | |
| B15 | 4 | 5.14 | 6 | 6 | 6.58 | 7 | 1.86 | 5.86 | ||
| B16 | 3 | 4.13 | 5 | 5 | 6.69 | 8 | 3.87 | 5.41 | ||
| Economy (Z2) | B21 | 2 | 3.73 | 6 | 5 | 6.15 | 7 | 2.27 | 5.34 | |
| B22 | 2 | 3.39 | 5 | 5 | 5.88 | 8 | 4.61 | 4.64 | ||
| B23 | 5 | 6.15 | 7 | 7 | 7.95 | 9 | 2.85 | 7.05 | √ | |
| B24 | 4 | 5.3 | 7 | 6 | 7.53 | 9 | 2.7 | 6.47 | √ | |
| B25 | 4 | 4.96 | 6 | 6 | 6.36 | 8 | 3.04 | 5.66 | ||
| B26 | 4 | 5.5 | 7 | 7 | 7.76 | 9 | 3.5 | 6.63 | √ | |
| B27 | 4 | 5.3 | 7 | 6 | 6.92 | 9 | 2.7 | 6.35 | √ | |
| Resources and technology (Z3) | B31 | 4 | 4.74 | 6 | 7 | 7.56 | 9 | 5.26 | 6.15 | √ |
| B32 | 2 | 2.99 | 5 | 4 | 5.3 | 7 | 3.01 | 4.39 | ||
| B33 | 5 | 5.97 | 7 | 8 | 8.59 | 9 | 4.03 | 7.28 | √ | |
| B34 | 2 | 2.35 | 3 | 3 | 4.28 | 6 | 3.65 | 3.32 | ||
| B35 | 5 | 5.58 | 6 | 7 | 7.79 | 8 | 3.42 | 6.69 | √ | |
| B36 | 5 | 6.15 | 7 | 8 | 8.19 | 9 | 3.85 | 7.17 | √ | |
| B37 | 4 | 4.78 | 5 | 6 | 6.71 | 9 | 5.22 | 5.75 | ||
| Enterprise management (Z4) | B41 | 4 | 5.3 | 7 | 6 | 7.3 | 9 | 2.7 | 6.43 | √ |
| B42 | 4 | 5.3 | 7 | 7 | 7.95 | 9 | 3.7 | 6.63 | √ | |
| B43 | 4 | 4.74 | 6 | 6 | 6.36 | 8 | 3.26 | 5.55 | ||
| B44 | 4 | 5.1 | 6 | 6 | 7.16 | 8 | 2.9 | 6.13 | √ | |
| B45 | 5 | 5.38 | 6 | 7 | 7.19 | 8 | 3.62 | 6.29 | √ | |
| B46 | 1 | 2.17 | 4 | 4 | 5.11 | 7 | 4.83 | 3.64 | ||
| B47 | 3 | 4.48 | 6 | 5 | 5.93 | 7 | 1.52 | 5.38 | ||
| B48 | 3 | 4.86 | 6 | 4 | 6.6 | 8 | 1.14 | 5.39 | ||
| B49 | 5 | 6.15 | 7 | 8 | 8.96 | 10 | 4.85 | 7.56 | √ | |
| Market (Z5) | B51 | 6 | 6.79 | 7 | 8 | 8.39 | 9 | 3.21 | 7.59 | √ |
| B52 | 3 | 4.58 | 7 | 5 | 6.8 | 9 | 2.42 | 5.85 | ||
| B53 | 4 | 5.88 | 7 | 6 | 8.06 | 10 | 3.12 | 6.65 | √ | |
| B54 | 7 | 7.19 | 8 | 9 | 9.79 | 10 | 3.81 | 8.49 | √ | |
| B55 | 5 | 5.97 | 7 | 8 | 8.39 | 9 | 4.03 | 7.18 | √ | |
| B56 | 3 | 4.62 | 7 | 5 | 6.47 | 9 | 2.38 | 5.76 | ||
| B57 | 6 | 6.97 | 8 | 9 | 9.19 | 10 | 4.03 | 8.08 | √ | |
| Main Criteria | Z1 | Z2 | Z3 | Z4 | Z5 |
|---|---|---|---|---|---|
| Z1 | (0,0,0) | (0.6,0.85,0.95) | (0.15,0.4,0.65) | (0.4,0.65,0.85) | (0.6,0.85,1) |
| Z2 | (0,0.05,0.3) | (0,0,0) | (0.6,0.85,1) | (0,0.05,0.3) | (0,0,0.25) |
| Z3 | (0.5,0.75,0.95) | (0.55,0.8,1) | (0,0,0) | (0.3,0.5,0.75) | (0.5,0.75,0.9) |
| Z4 | (0.05,0.2,0.45) | (0.5,0.75,1) | (0.15,0.35,0.6) | (0,0,0) | (0.4,0.65,0.9) |
| Z5 | (0.15,0.35,0.6) | (0.75,1,1) | (0.05,0.2,0.45) | (0.6,0.85,1) | (0,0,0) |
| Main Criteria | Z1 | Z2 | Z3 | Z4 | Z5 |
|---|---|---|---|---|---|
| Z1 | (0,0,0) | (0.152,0.215,0.241) | (0.038,0.101,0.165) | (0.101,0.165,0.215) | (0.152,0.215,0.253) |
| Z2 | (0,0.013,0.076) | (0,0,0) | (0.152,0.215,0.253) | (0,0.013,0.076) | (0,0,0.063) |
| Z3 | (0.127,0.19,0.241) | (0.139,0.203,0.253) | (0,0,0) | (0.076,0.127,0.19) | (0.127,0.19,0.228) |
| Z4 | (0.013,0.051,0.114) | (0.127,0.19,0.253) | (0.038,0.089,0.152) | (0,0,0) | (0.101,0.165,0.228) |
| Z5 | (0.038,0.089,0.152) | (0.19,0.253,0.253) | (0.013,0.051,0.114) | (0.152,0.215,0.253) | (0,0,0) |
| Main Criteria | Z1 | Z2 | Z3 | Z4 | Z5 |
|---|---|---|---|---|---|
| Z1 | (0.019,0.096,0.394) | (0.217,0.423,0.836) | (0.079,0.244,0.621) | (0.136,0.288,0.657) | (0.179,0.33,0.697) |
| Z2 | (0.021,0.073,0.324) | (0.032,0.101,0.39) | (0.159,0.255,0.502) | (0.018,0.075,0.364) | (0.025,0.077,0.367) |
| Z3 | (0.141,0.268,0.61) | (0.213,0.425,0.872) | (0.044,0.158,0.502) | (0.119,0.266,0.66) | (0.166,0.322,0.702) |
| Z4 | (0.026,0.119,0.442) | (0.166,0.336,0.755) | (0.067,0.195,0.547) | (0.025,0.101,0.41) | (0.116,0.244,0.606) |
| Z5 | (0.049,0.155,0.475) | (0.232,0.41,0.769) | (0.057,0.187,0.531) | (0.166,0.295,0.624) | (0.031,0.118,0.432) |
| Main Criteria | ||||
|---|---|---|---|---|
| Z1 | (0.886,2.092,5.45) | (0.374,0.67,0.96) | 2.45 | 0.669 |
| Z2 | (1.151,2.276,5.569) | (−0.605,−1.114,−1.675) | 2.631 | −1.123 |
| Z3 | (1.089,2.478,6.049) | (0.277,0.4,0.643) | 2.842 | 0.42 |
| Z4 | (0.864,2.02,5.475) | (−0.064,−0.03,0.045) | 2.403 | −0.0232 |
| Z5 | (0.566,1.283,3.263) | (0.504,1.047,2.399) | 1.494 | 1.182 |
| Main Criteria | Sub-Criteria | ||||
|---|---|---|---|---|---|
| Z1 | B11 | (0.33,0.845,2.185) | (0.33,0.845,0.895) | 0.983 | 0.768 |
| B13 | (0.487,0.878,2.19) | (0.324,0.203,0.274) | 1.032 | 0.235 | |
| B14 | (0.655,1.047,2.459) | (−0.655,−1.047,−1.169) | 1.217 | −1.002 | |
| Z2 | B23 | (0.373,1.111,9.525) | (−0.195,−0.217,−0.713) | 2.39 | −0.296 |
| B24 | (0.57,1.527,10.158) | (−0.142,−0.013,0.12) | 2.806 | −0.012 | |
| B26 | (0.262,0.882,8.813) | (0.18,0.14,0.449) | 2.101 | 0.198 | |
| B27 | (0.768,2,11.787) | (0.158,0.09,0.145) | 3.426 | 0.111 | |
| Z3 | B31 | (0.777,1.851,6.9) | (−0.228,−0.436,−0.909) | 2.514 | −0.48 |
| B33 | (0.443,1.212,5.62) | (0.247,0.653,1.33) | 1.819 | 0.698 | |
| B35 | (0.916,2.016,6.797) | (−0.153,−0.398,−0.92) | 2.63 | −0.444 | |
| B36 | (0.914,1.969,6.681) | (0.135,0.181,0.499) | 2.579 | 0.226 | |
| Z4 | B41 | (0.586,1.15,2.89) | (0.056,0.244,0.418) | 1.346 | 0.242 |
| B42 | (0.757,1.381,3.175) | (0.098,0.209,0.307) | 1.576 | 0.207 | |
| B44 | (0.415,0.8,2.395) | (0.083,0.101,0.113) | 1.001 | 0.1 | |
| B45 | (0.392,0.788,2.40) | (−0.233,−0.413,−0.582) | 1.0 | −0.411 | |
| B49 | (0.439,0.913,2.51) | (−0.005,−0.141,−0.257) | 1.1 | −0.137 | |
| Z5 | B51 | (0.423,0.889,4.397) | (−0.423,−0.889,−1.894) | 1.396 | −0.979 |
| B53 | (0.48,1.089,4.903) | (0.052,0.191,0.453) | 1.623 | 0.211 | |
| B54 | (0.854,1.714,6.039) | (0.152,0.309,0.659) | 2.291 | 0.341 | |
| B55 | (0.875,1.875,6.467) | (0.22,0.389,0.783) | 2.474 | 0.426 | |
| B57 | (1.263,2.311,7.198) | (−0.127,−0.388,−1.467) | 2.951 | −0.524 |
| Main Criteria | Z1 | Z2 | Z3 | Z4 | Z5 |
|---|---|---|---|---|---|
| Z1 | 0.133 | 0.458 * | 0.279 * | 0.324 * | 0.366 * |
| Z2 | 0.106 | 0.138 | 0.28 * | 0.114 | 0.117 |
| Z3 | 0.304 * | 0.464 * | 0.196 | 0.307 * | 0.359 * |
| Z4 | 0.157 | 0.378 * | 0.232 | 0.14 | 0.283 * |
| Z5 | 0.191 | 0.44 * | 0.223 | 0.328 * | 0.156 |
| Items | B11 | B13 | B24 | B26 | B27 | B33 | B36 | B41 | B42 | B49 | B53 | B54 | B55 | B57 |
|---|---|---|---|---|---|---|---|---|---|---|---|---|---|---|
| Academic Ranks | 14 | 10 | 2 | 13 | 1 | 4 | 5 | 12 | 9 | 8 | 11 | 7 | 6 | 3 |
| Practical Ranks | 14 | 9 | 2 | 10 | 1 | 5 | 3 | 13 | 12 | 6 | 11 | 7 | 8 | 4 |
| Cause | √ | √ | - | √ | √ | √ | √ | √ | √ | - | √ | √ | √ | - |
| Result | - | - | √ | - | - | - | - | - | - | √ | - | - | - | √ |
| Dimensions | Sub-Criteria | Suggested Measures |
|---|---|---|
| Z1 | B11 | As the market opening process is largely guided by the government’s policy, TPGGs need to (a) track the policy issues of electricity market, such as the degree of openness, the transaction rules, whether power grid companies participate in electricity sales, dispatching and the degree of independence of trading institutions; (b) improve its adaptability, be able to predict the policy orientation, prepare in advance and respond in time. |
| B13 | Improve the automation level of the control system, simplify the operation procedures of the equipment, and improve the reliability and economy of the generator equipment.To forecast the load peak and trough, check the running state of the unit frequently, ensure the fuel supply, check the unit frequently and ensure the normal processing of the units. | |
| Z2 | B24 | A long-term development plan should be established to assure margins. The marketing plan should be explicit. The price quoting strategies and techniques should be mastered. For example, investment in future market can be used as a hedging tool. However, the spot market is risky and profitable. Besides, China is now carrying out pilot market of ancillary services. Compensation for ancillary services will make power generation enterprises more profitable in a certain period. |
| B26 | ||
| B27 | TPGGs should improve their ability in managing risk through a serious of technological means, including a deep knowledge of derivatives assets valuation and market risk management theories; tools to simulate electricity market prices scenarios and tools to compute risk indicators to measure hedging strategies’ effectiveness. | |
| Z3 | B33 | Since the majority of clean energy power investment in China has been made by TPGGs, risks such as high generation cost, mismatch between capacity and generation, deficient policy and so on should be considered in an initial market. Therefore, rational allocation of renewable energy and full play to the advantages of renewable energy power generation are critical. |
| B36 | On the one hand, TPGGs should develop enterprise marketing management system, market transaction simulation system, and other systems with the practical needs. On the other hand, TPGGs should develop medium- and long-term electricity price forecast, asset portfolio optimization and risk control tools to provide strong technical R&D support for marketing business | |
| Z4 | B41 | Combining corporate culture with corporate strategy, corporate culture penetrates into enterprise management thinking, organizational structure and other aspects. As for business philosophy, renew the concept of enterprise development, that is, from planning to market, from a single power grid to many customers. |
| B42 | In terms of personal leadership, change the concept of leadership management, constantly learn and accumulate practical experience, and constantly improve reflection. In terms of organization, the leadership decision-making mechanism of senior managers of TPGGs should be optimized to form a scientific and institutionalized leadership style and pay attention to creating a positive and harmonious enterprise culture to enhance the team influence of managers. | |
| B49 | Grasp a deep knowledge of derivatives assets valuation and market risk management theories; develop tools for assets valuation, taking into account their dynamic operating constraints (minimum and maximum load constraints, ramp-up and down power constraint, starting costs, minimum run time) and storages; develop tools to compute risk indicators and provide a consistent set of compatible tools for risk managers, from price modelling to hedging strategies. | |
| Z5 | B53 | Collect the market data and detect the competitor’s information by data mining. |
| B54 | Establish a database of market supply and demand, market quotation and results, and periodically analyze historical transaction data, which can contribute to the accurate prediction. | |
| B55 | As market price is affected by quotations from market participants, while the price itself also affects the quotations of participators in return, TPGGs should learn to analyze the game behavior among the market subjects, and reasonably predict the market price. | |
| B57 | In order to optimize investment choices, it is necessary to build economic projections far beyond market horizons. Therefore, it is necessary to construct price scenarios over several decades, with different assumptions, using supply-demand equilibrium models. Moreover, it must be done for each province where the company expands business. |
© 2019 by the authors. Licensee MDPI, Basel, Switzerland. This article is an open access article distributed under the terms and conditions of the Creative Commons Attribution (CC BY) license (http://creativecommons.org/licenses/by/4.0/).
Share and Cite
Dong, J.; Liu, D.; Wang, D.; Zhang, Q. Identification of Key Influencing Factors of Sustainable Development for Traditional Power Generation Groups in a Market by Applying an Extended MCDM Model. Sustainability 2019, 11, 1754. https://doi.org/10.3390/su11061754
Dong J, Liu D, Wang D, Zhang Q. Identification of Key Influencing Factors of Sustainable Development for Traditional Power Generation Groups in a Market by Applying an Extended MCDM Model. Sustainability. 2019; 11(6):1754. https://doi.org/10.3390/su11061754
Chicago/Turabian StyleDong, Jun, Dongran Liu, Dongxue Wang, and Qi Zhang. 2019. "Identification of Key Influencing Factors of Sustainable Development for Traditional Power Generation Groups in a Market by Applying an Extended MCDM Model" Sustainability 11, no. 6: 1754. https://doi.org/10.3390/su11061754