Solar PV Grid Power Flow Analysis


1
Department of Electrical Power and Mechatronics, Tafila Technical University, At-Tafilah 66110, Jordan
2
Sabbatical leave at Energy Engineering Departments, College of Engineering, Al Hussein Technical University, Amman 25175, Jordan
3
Communications Engineering Department, King Abdullah II School of Engineering, Princess Sumaya University for Technology PSUT, Amman 11941, Jordan
4
Department of Electrical Engineering, University of Engineering & Technology, Peshawar 814, Pakistan
5
School of Electrical Engineering, University of Ulsan, Ulsan 44610, Korea
*
Author to whom correspondence should be addressed.
Sustainability 2019, 11(6), 1744; https://doi.org/10.3390/su11061744
Submission received: 10 February 2019
/
Revised: 12 March 2019
/
Accepted: 14 March 2019
/
Published: 22 March 2019
Abstract
:As the unconstrained integration of distributed photovoltaic (PV) power into a power grid will cause changes in the power flow of the distribution network, voltage deviation, voltage fluctuation, and so on, system operators focus on how to determine and improve the integration capacity of PV power rationally. By giving full consideration to the static security index constraints and voltage fluctuation, this paper proposes a maximum integration capacity optimization model of the PV power, according to different power factors for the PV power. Moreover, the proposed research analyzes the large-scale PV grid access capacity, PV access point, and multi-PV power plant output, by probability density distribution, sensitivity analysis, standard deviation analysis, and over-limit probability analysis. Furthermore, this paper establishes accessible capacity maximization problems from the Institute of Electrical and Electronics Engineers (IEEE) standard node system and power system analysis theory for PV power sources with constraints of voltage fluctuations. A MATLAB R2017B simulator is used for the performance analysis and evaluation of the proposed work. Through the simulation of the IEEE 33-node system, the integration capacity range of the PV power is analyzed, and the maximum integration capacity of the PV power at each node is calculated, providing a rational decision-making scheme for the planning of integrating the distributed PV power into a small-scale power grid. The results indicate that the fluctuations and limit violation probabilities of the power system voltage and load flow increase with the addition of the PV capacity. Moreover, the power loss and PV penetration level are influenced by grid-connected spots, and the impact of PV on the load flow is directional.
1. Introduction
In recent years, photovoltaic (PV) power generation has developed rapidly, and the proportion of PV installed capacity in the power grid is increasing. It is estimated that by the end of 2020, the total globally installed capacity of PV power generation will reach 303 GW [1,2,3,4]. Like the wind power system, the scalability of PV power generation causes a large-scale grid connection, which will change the system power flow distribution, and even reverse the power flow. Moreover, it will bring voltage fluctuations or voltage over-limits, which will be on the grid. At present, research on the impact of wind power grid-connected power systems is relatively mature, but research on the impact of PV grid-connected power systems is still relatively under evolution. Most of the existing research work is on the impact of distributed PV access on the distribution network [5,6,7,8,9], and on the impact of large-scale centralized PV grid-connected systems. With the construction of hundreds of megawatt-scale or even gigawatt-scale PV power plants in various countries, centralized grid-connected PV power generation has become a hot issue of research and the main direction of development [10]. Therefore, it is necessary to study the impact of a large-scale PV grid connection on the power system.
As conventional energy supply conditions become more severe, PV power generation has become an alternative energy source for scholars. In traditional power distribution networks, PV power sources are often accessed by distributed generation (DG), but they are subject to illumination and climatic conditions. PV power supplies have large fluctuations in active power output, and high-permeability PV power sources will have a large impact on the distribution network’s power flow, which causes voltage quality problems such as voltage deviation and voltage fluctuation [11,12,13]. Therefore, considering the random nature of the PV output, it is of great significance to reasonably constrain its accessible capacity.
PV grid-connecting mainly affects the grid power flow distribution, power quality, and dynamic characteristics. The authors of [5,6,7] used the deterministic load flow (DLF) to study the grid-connected power flow problem, and proposed a distributed power access processing method. However, the output of the PV power generation is randomly determined by the real-time light intensity. The deterministic power flow calculation method cannot fully reflect and evaluate the influencing factors and extents.
Probabilistic load flow calculation methods include the Monte Carlo simulation method [11,12,13], semi-invariant and Gram–Charlier series expansion [9,14], and point estimation method [15,16]. Among them, the authors of [12] proposed the system voltage evaluation index with PV, but only considered the impact of a single PV power station. The authors of [13] calculated the distributed PV capacity, as the radial distribution network can be accepted under the condition of satisfying the voltage constraint, where the PVs are located in the grid end. The authors of [14] studied the influence of distributed PVs on the distribution network. The authors of [14] also concluded that a PV grid connection is conducive to improving voltage quality, and this is not necessarily true for centralized PV grid integration. The authors of [15] analyzed the probabilistic density function (PDF) after the PV grid connection, but ignored the correlation between random variables. The authors of [17] considered the mutual constraints of the wind speed interval and illumination intensity interval. The authors of [18] studied the joint probability distribution of the PV unit’s on–off time. The authors of [19] considered the correlation between the branches and characteristics of the voltage distribution, but the above effects of the PV grid connection on the power of the system branch were not considered.
The new energy power system is experiencing a dual technological revolution. The optimal operation mode of interaction between the supply and demand groups was proposed for the power system planning, decision-making, and safe operation [20,21,22,23,24,25]. The interaction between the supply and demand groups means relying on the benign and orderly interaction between the supply side and the demand side in order to optimize the system operation, to achieve the best safety, economic, and environmental benefits. In [26], a two-layer optimal scheduling model was established for the intelligent industrial park, in order to participate in the system operation. The scheduling strategy of the source-charge coordinated operation in the smart industrial park was studied, and the active participation of the load in the system operation was realized. The authors of [27] studied the fuzzy opportunity scheduling model of the power system with wind farms, which showed that the model can achieve good energy saving, emission reduction, and safety economic benefits. From the perspective of supply and demand, in particular, the emergence of a flexible load greatly enhances the interaction between the demand side and the grid, but also increases the risk during the operation of the power system [28]. Probabilistic currents can reflect the impact of this uncertainty on the operation of the system, and are an important basis for solving the weak links in the power grid. The authors of [29] proposed a probabilistic power flow calculation method by combining a semi-invariant and Gram–Charlier series expansion. In the literature [30], a probabilistic power flow algorithm based on a stochastic configuration point method was proposed based on the uncertainty quantization theory. In the literature [31], the Monte Carlo method was used as the reference value, and the power system with wind and PV power generation was considered as the analysis object. The accuracy of the calculation results of the lower-invariant method for different potentials was compared.
The accessible capacity of the distributed PV power source indicates the maximum capacity of the PV power supply to access the network under the constraints of various technical indicators of the power system [32]. The present research on the accessible capacity of the distributed power sources has yielded certain results. The authors of [33] proposed a method for calculating the admission capacity based on the dynamic load security domain, and analyzed the impact of different load levels and of the location of the distributed power grids on the accessible capacity. The authors of [34] established a distributed power supply capacity optimization model considering the current protection constraints of the distribution network, and made an intelligent algorithm to solve the model. In the literature [35], based on the voltage-adjusted maximum admission capacity calculation method, a voltage control strategy was proposed in order to improve the operating state and the PV penetration rate. The output fluctuation of the PV power supply causes node voltage fluctuations. The existing literature is mostly limited to the static safety index constraints, such as voltage deviation and network power flow, while research on the voltage fluctuation constraints is relatively rare. The literature [36,37] has pointed out that voltage waves should be considered when calculating DG accessible capacity dynamic impact, but there is still a lack of analysis for the impact of different power factors on the accessible capacity of PV power.
In this paper, the steady-state model of the PV power generation system is established. Quantitative research is carried out by considering the correlation of the PV power plant output from the perspectives of PV access capacity and PV access point, based on the Institute of Electrical and Electronics Engineers (IEEE) 14-node system and on two provincial-level power grids in Pakistan. The impact of the large-scale centralized PV grid is also studied when the grid is connected to the system node voltage and branch current. The accessible capacity maximization problems of the distributed PV power supply are established by taking into account the voltage fluctuations of each node of the distribution network, as well as the traditional static safety index constraints. Based on the genetic algorithm, to solve the model, we consider the different power factor operating conditions of the PV power supply, analyze the impact of the output fluctuation on the accessible capacity, and provide a reasonable decision-making scheme for the access planning of the distributed PV power supply in the small-scale power grid. Moreover, this paper establishes a maximum integration capacity optimization model of the PV power, according to the different power factors for the PV power. Moreover, the proposed research analyzes the large-scale PV grid access capacity, PV access point, and multi-PV power plant output by probability density distribution, sensitivity analysis, standard deviation analysis, and over-limit probability analysis.
The rest of the paper is organized as follows. Section 2 provides the PV power flow calculation modeling. Section 3 gives the analytical calculations of the probabilistic modeling of the PV grid and its impact on the system performance. Section 4 gives the voltage characteristics analysis. Section 5 provides the simulation results and analysis, while Section 6 concludes the paper.
2. PV Power Flow Calculation Modeling
2.1. The Composition of the Power Flow Calculation Model of the PV Power Generation System
PV power generation units mainly include PV cell arrays, control modules, inverters, and other parts. In the trend impact analysis, the modeling of the PV power generation unit does not need to consider the dynamic characteristics of the control system adjustment process, and only needs to care about its steady-state output result. The characteristics and converter configuration give the corresponding electric power output sequence. The steady state model has the following three characteristics:
- (1)
- The inverter appears as a power balance equation on the AC and DC side in the PV steady state model;
- (2)
- From the implementation of the maximum power point tracking (MPPT) control [38], the active output of the steady-state model is approximately equal to the current illumination intensity and the maximum PV power (except for the limited power control);
- (3)
- Each closed-loop control adjustment process is not considered in the steady-state modeling.
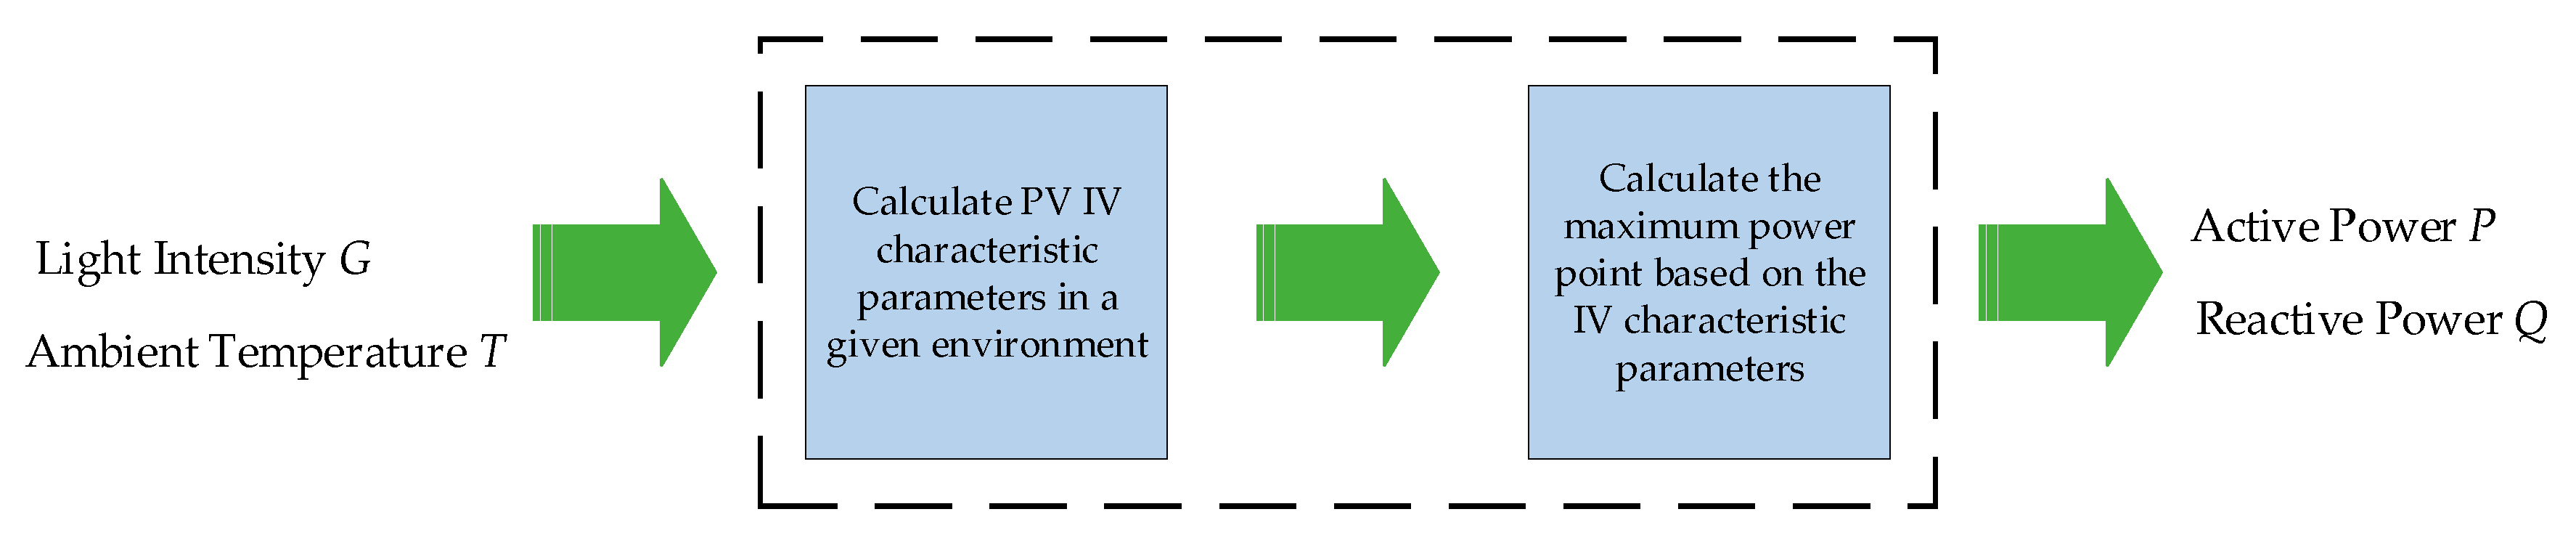
Therefore, the steady-state model of PV power generation includes two parts in the dotted line box in Figure 1. The active power actually injected into the grid by the PV power generation system is always maintained at the maximum power point, which is guaranteed by its MPPT control, and the system is used for power flow calculation [39,40,41,42,43]. The PV power generation system model is shown as follows:
where is the active power actually injected into the grid by the PV unit, is the active-voltage relationship (P–V characteristic) of the PV array, is the converter conversion efficiency, and is the limit output command value of the grid dispatch. In the power flow calculation, the PV grid-connected node is treated as a active reactive power (PQ) node, and the reactive power output of the PV power plant is set to zero.
It can be known from Equation (1) that the active output of the PV system is an optimization problem, and the P–V characteristics of the PV array are required in the power flow calculation.
2.2. Power Flow Calculation of the PV Power System Based on the MPPT Control Model
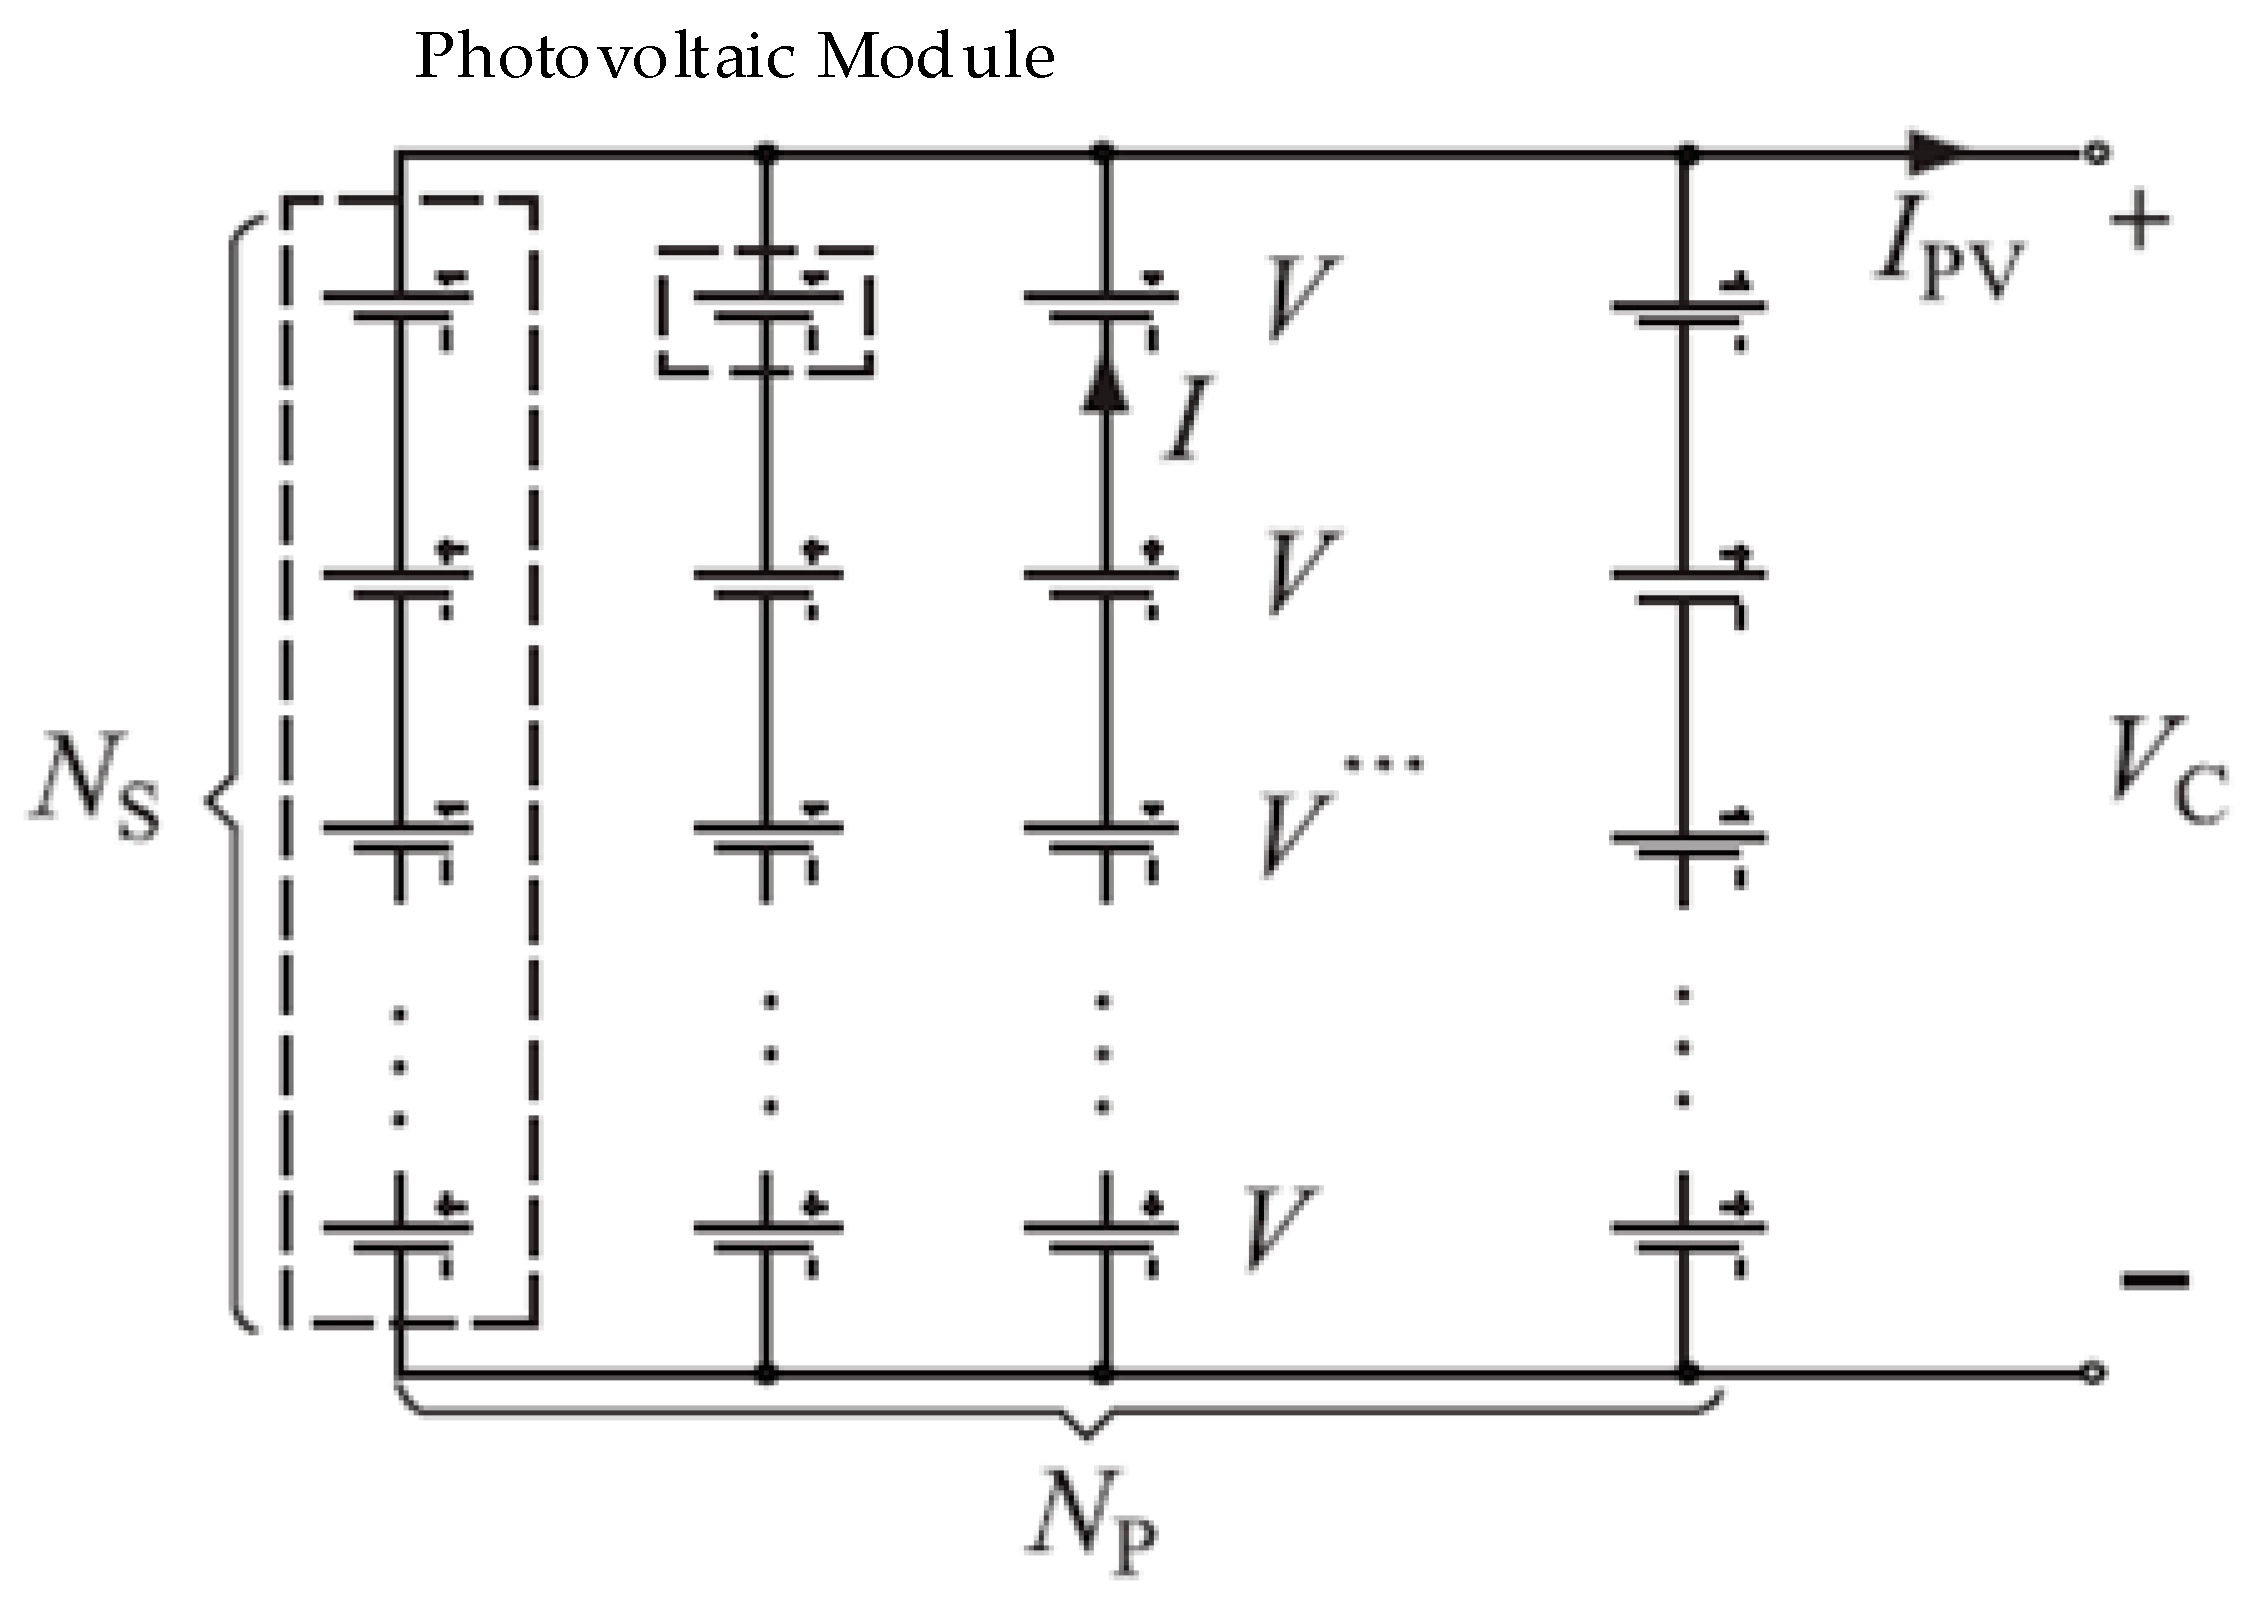
In practice, the output voltage of a single PV cell is low and the output power is small. To match the input voltage requirement of a large-capacity converter, it is generally necessary to connect a large number of PV cells in series to form a PV module in order to increase its output voltage. The PV cell array structure is shown in Figure 2, which is used to increase the capacity utilization of the inverter. For the purpose of a unified MPPT control and mitigating the hot spot effect, the PV cells with the same PV array are required to be as similar as possible in the characteristics, so the difference can be neglected in the modeling. The output current and of the PV array are shown as follows:
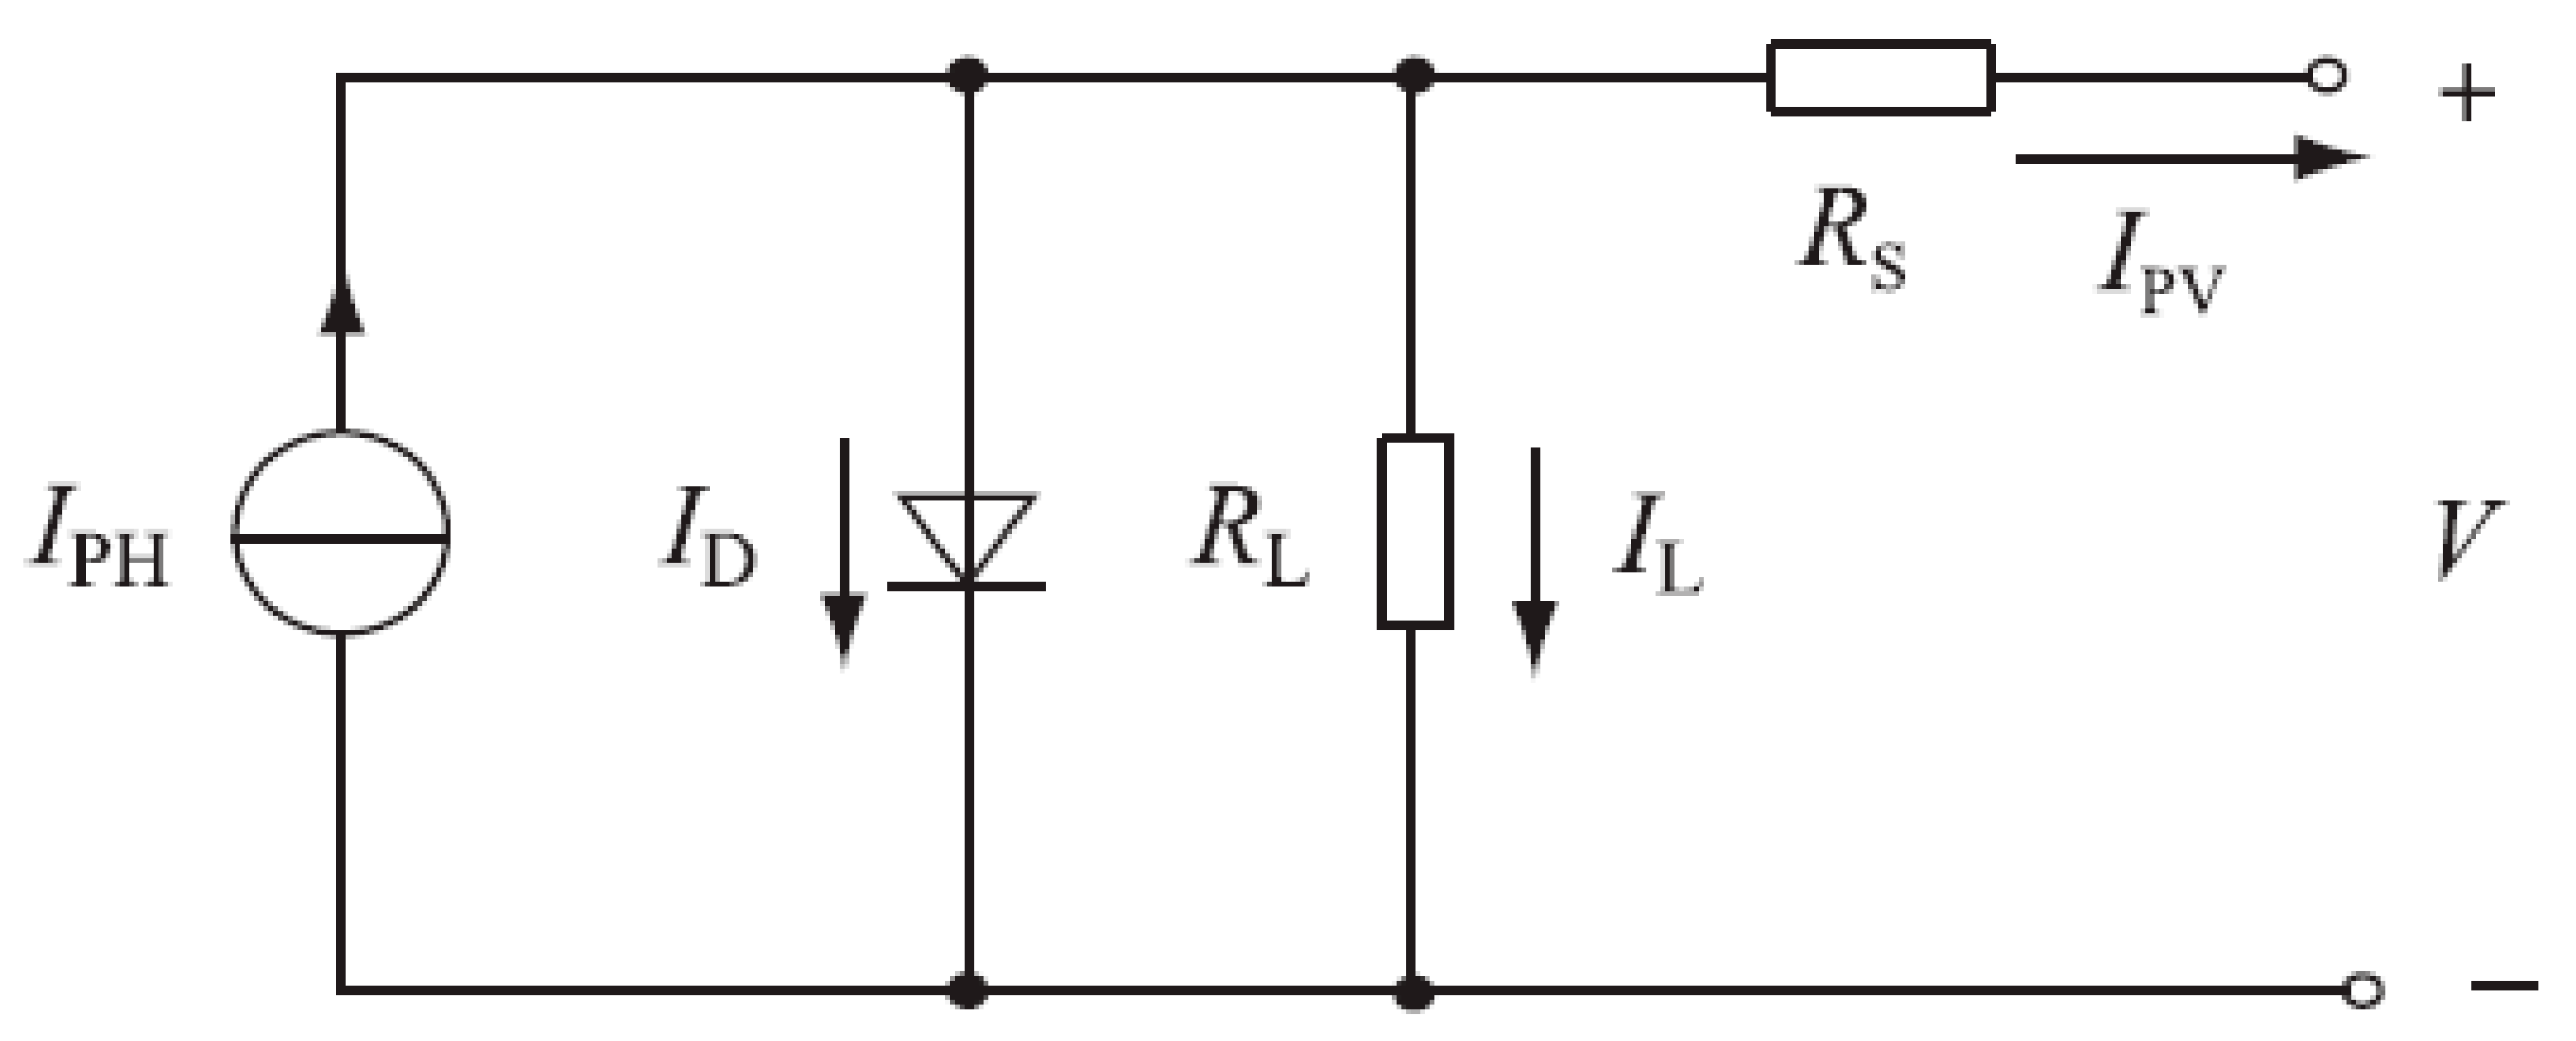
where , , , and denote the number of parallel connections, the number of serial PV cells, the output current of the PV cell, and the output voltage of PV cell, respectively. Based on the above structure, the steady state construction of the PV cell is used in this paper, for which the analog equivalent circuit is shown in Figure 3, where is the photo-generated current of the semiconductor PN junction, is PN junction forward conduction current, and are the leakage resistance and contact resistance between the electrodes on both sides of the PN junction, and is the inter-electrode leakage current.
The characteristic function is a single exponential equivalent model [29,30], as follows:
where is the diode reverse saturation current, is the charge of the element, is the Boltzmann constant, is the diode constant, and is the ambient temperature.
Some physical quantities of Formula (3) are not easy to obtain in an engineering application. The more common parameters are short circuit currents (), open circuit voltage (), maximum the power voltage (), and maximum power current (), which are provided by the manufacturer under rated light intensity () and temperature () conditions. The characteristic quantity (standard condition defines the temperature is 25 °C, the light intensity is 1000 W/m2), and the variation of these characteristic quantities can be calculated according to Formula (4), under the condition of any light intensity () and temperature (), deviating from the rated condition, wherein are the compensation coefficients, and is the base of the natural logarithm. In this paper, , , and are approximated in the modeling, so that the external characteristics of the PV cell are simplified to Formula (5), and the relationship between parameters and the respective feature quantities, is as shown in Formula (6).
By substituting Equation (2) into Equation (5), the I–V relationship of the PV array is obtained, and the P–V characteristic of the PV array can be obtained as shown in Equation (7), which is a single peak function. According to Equation (1), the output of the PV power generation is the maximum value of the PV relationship. Therefore, Equation (7) is derived and the derivative function is 0. The only zero point is the maximum power point of PV, as shown in Equation (8).
The actual grid-connected PV power station consists of a large number of PV power generation units connected in parallel, and the existing research is simulated by multiplying the output of a single PV power generation unit.
3. Probabilistic Power Flow Calculation with PV Power Generation and Its Impact of Power Grid
3.1. Overview of Probabilistic Power Flow Calculation with PVs
The power flow calculation is essentially solving two nonlinear equations, as in Equation (9), where is the node injection power; is the grid state quantity, which includes the node voltage amplitude and phase angle; and is the power flow calculation result. The output variable is usually selected among the branch current, network loss, and node voltage amplitude.
The probabilistic load flow calculation mainly considers the randomness of some variables in the injected power vector (). The purpose is to solve the probability distribution of the system state variable () and the output variable () by the statistical characteristics of the random variable.
For the PV probability model, the authors of [9] and [18] considered that the light intensity obeys the Beta distribution and the normal distribution, respectively. A large number of measured data show that the Beta distribution can better describe the light intensity distribution characteristics, and the probability density function of the illumination intensity () can then be described as follows:
where is the illumination peak, and are the Beta distribution fitting parameters.
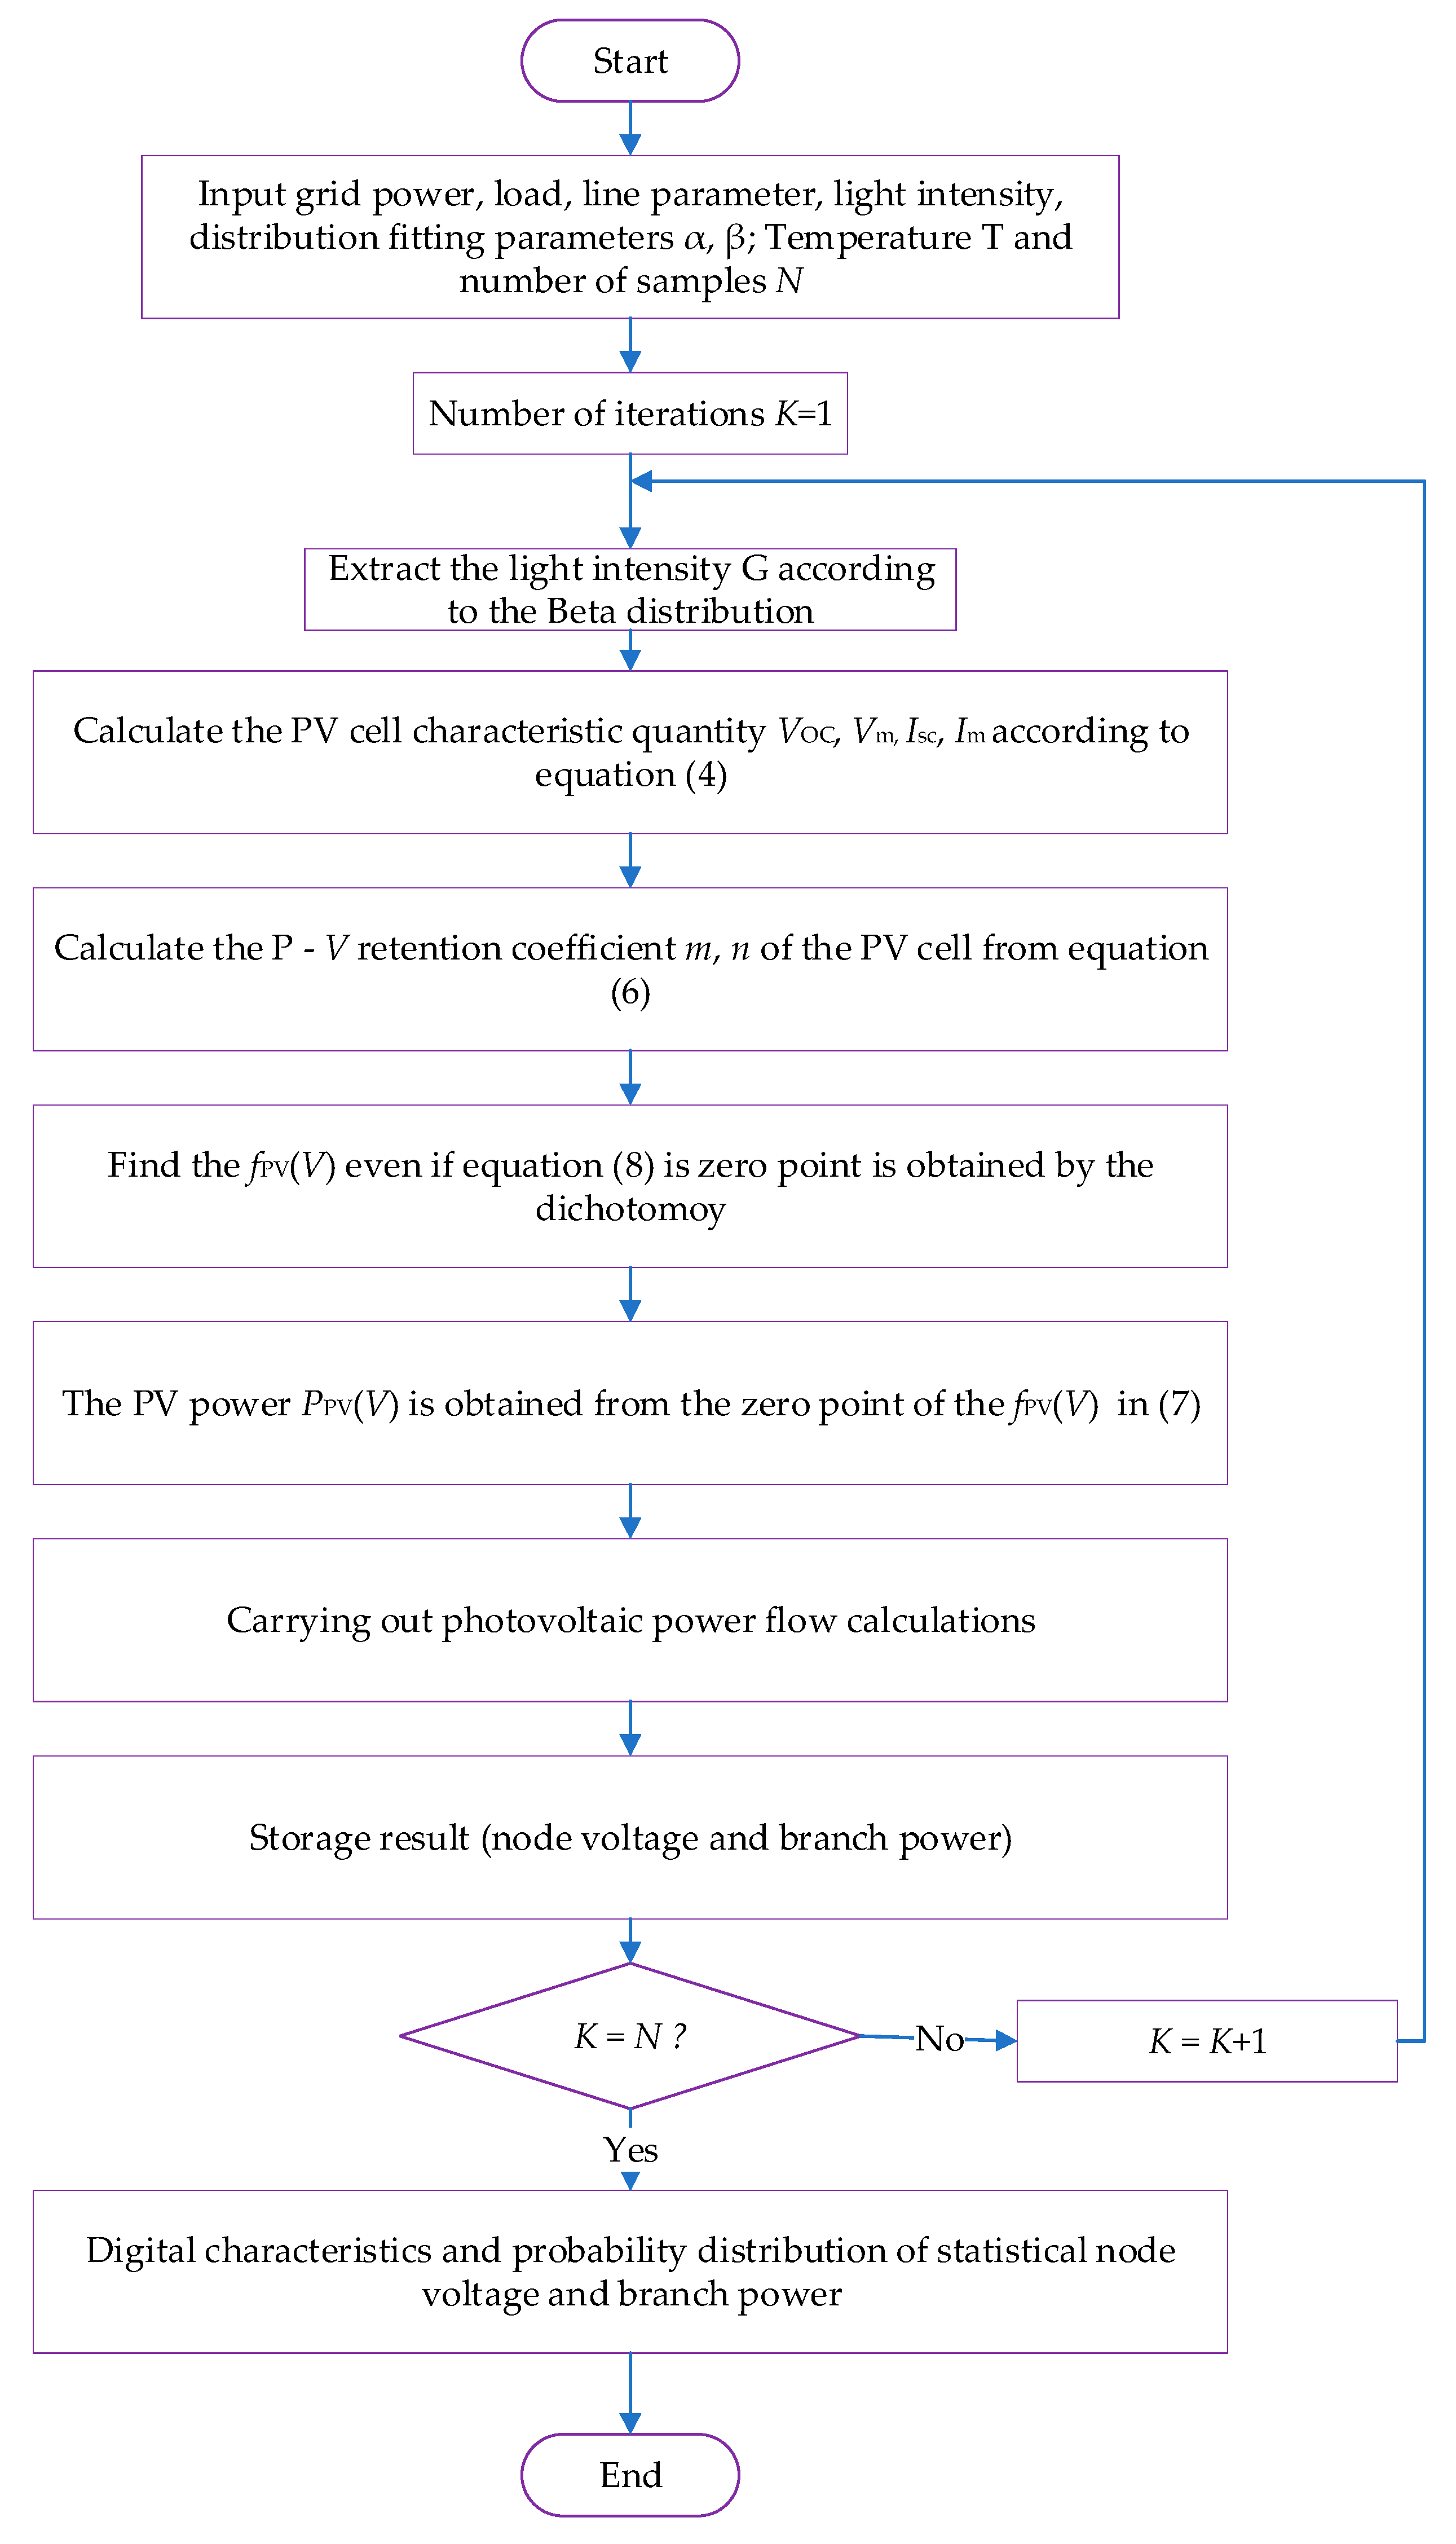
In this paper, when we study and analyze the influence of grid-connected PV power plants on the power flow of the system, the output power of PV power generation varies randomly with the light intensity, and the output reactive power is constant at zero. Considering the accuracy of the calculation results, the non-sequential Monte Carlo method is used to calculate the probabilistic load flow. The process of calculating the probability flow using PVs is shown in Figure 4.
3.2. Probabilistic Power Flow Calculation from the Correlation of PV Power Plant Output
Because the PV output is mainly affected by the light intensity, the solar-terrestrial movement is considered. Therefore, when considering the calculation of the power flow of multiple PV power plants connected to the power grid, the output of the PV power plants with similar geographical locations tends to have a strong correlation. In this paper, the Monte Carlo sampling method is still used in the calculation of probabilistic tidal currents, and samples are generated by the Latin Hypercube-Cholesky Decomposition technique for considering correlation [37,38,39,40,41,42].
Taking the consideration of three PV power plant accesses as an example, given the Spearman rank correlation coefficients of the outputs, , , and , the correlation coefficient matrix can be formed as Equation (11).
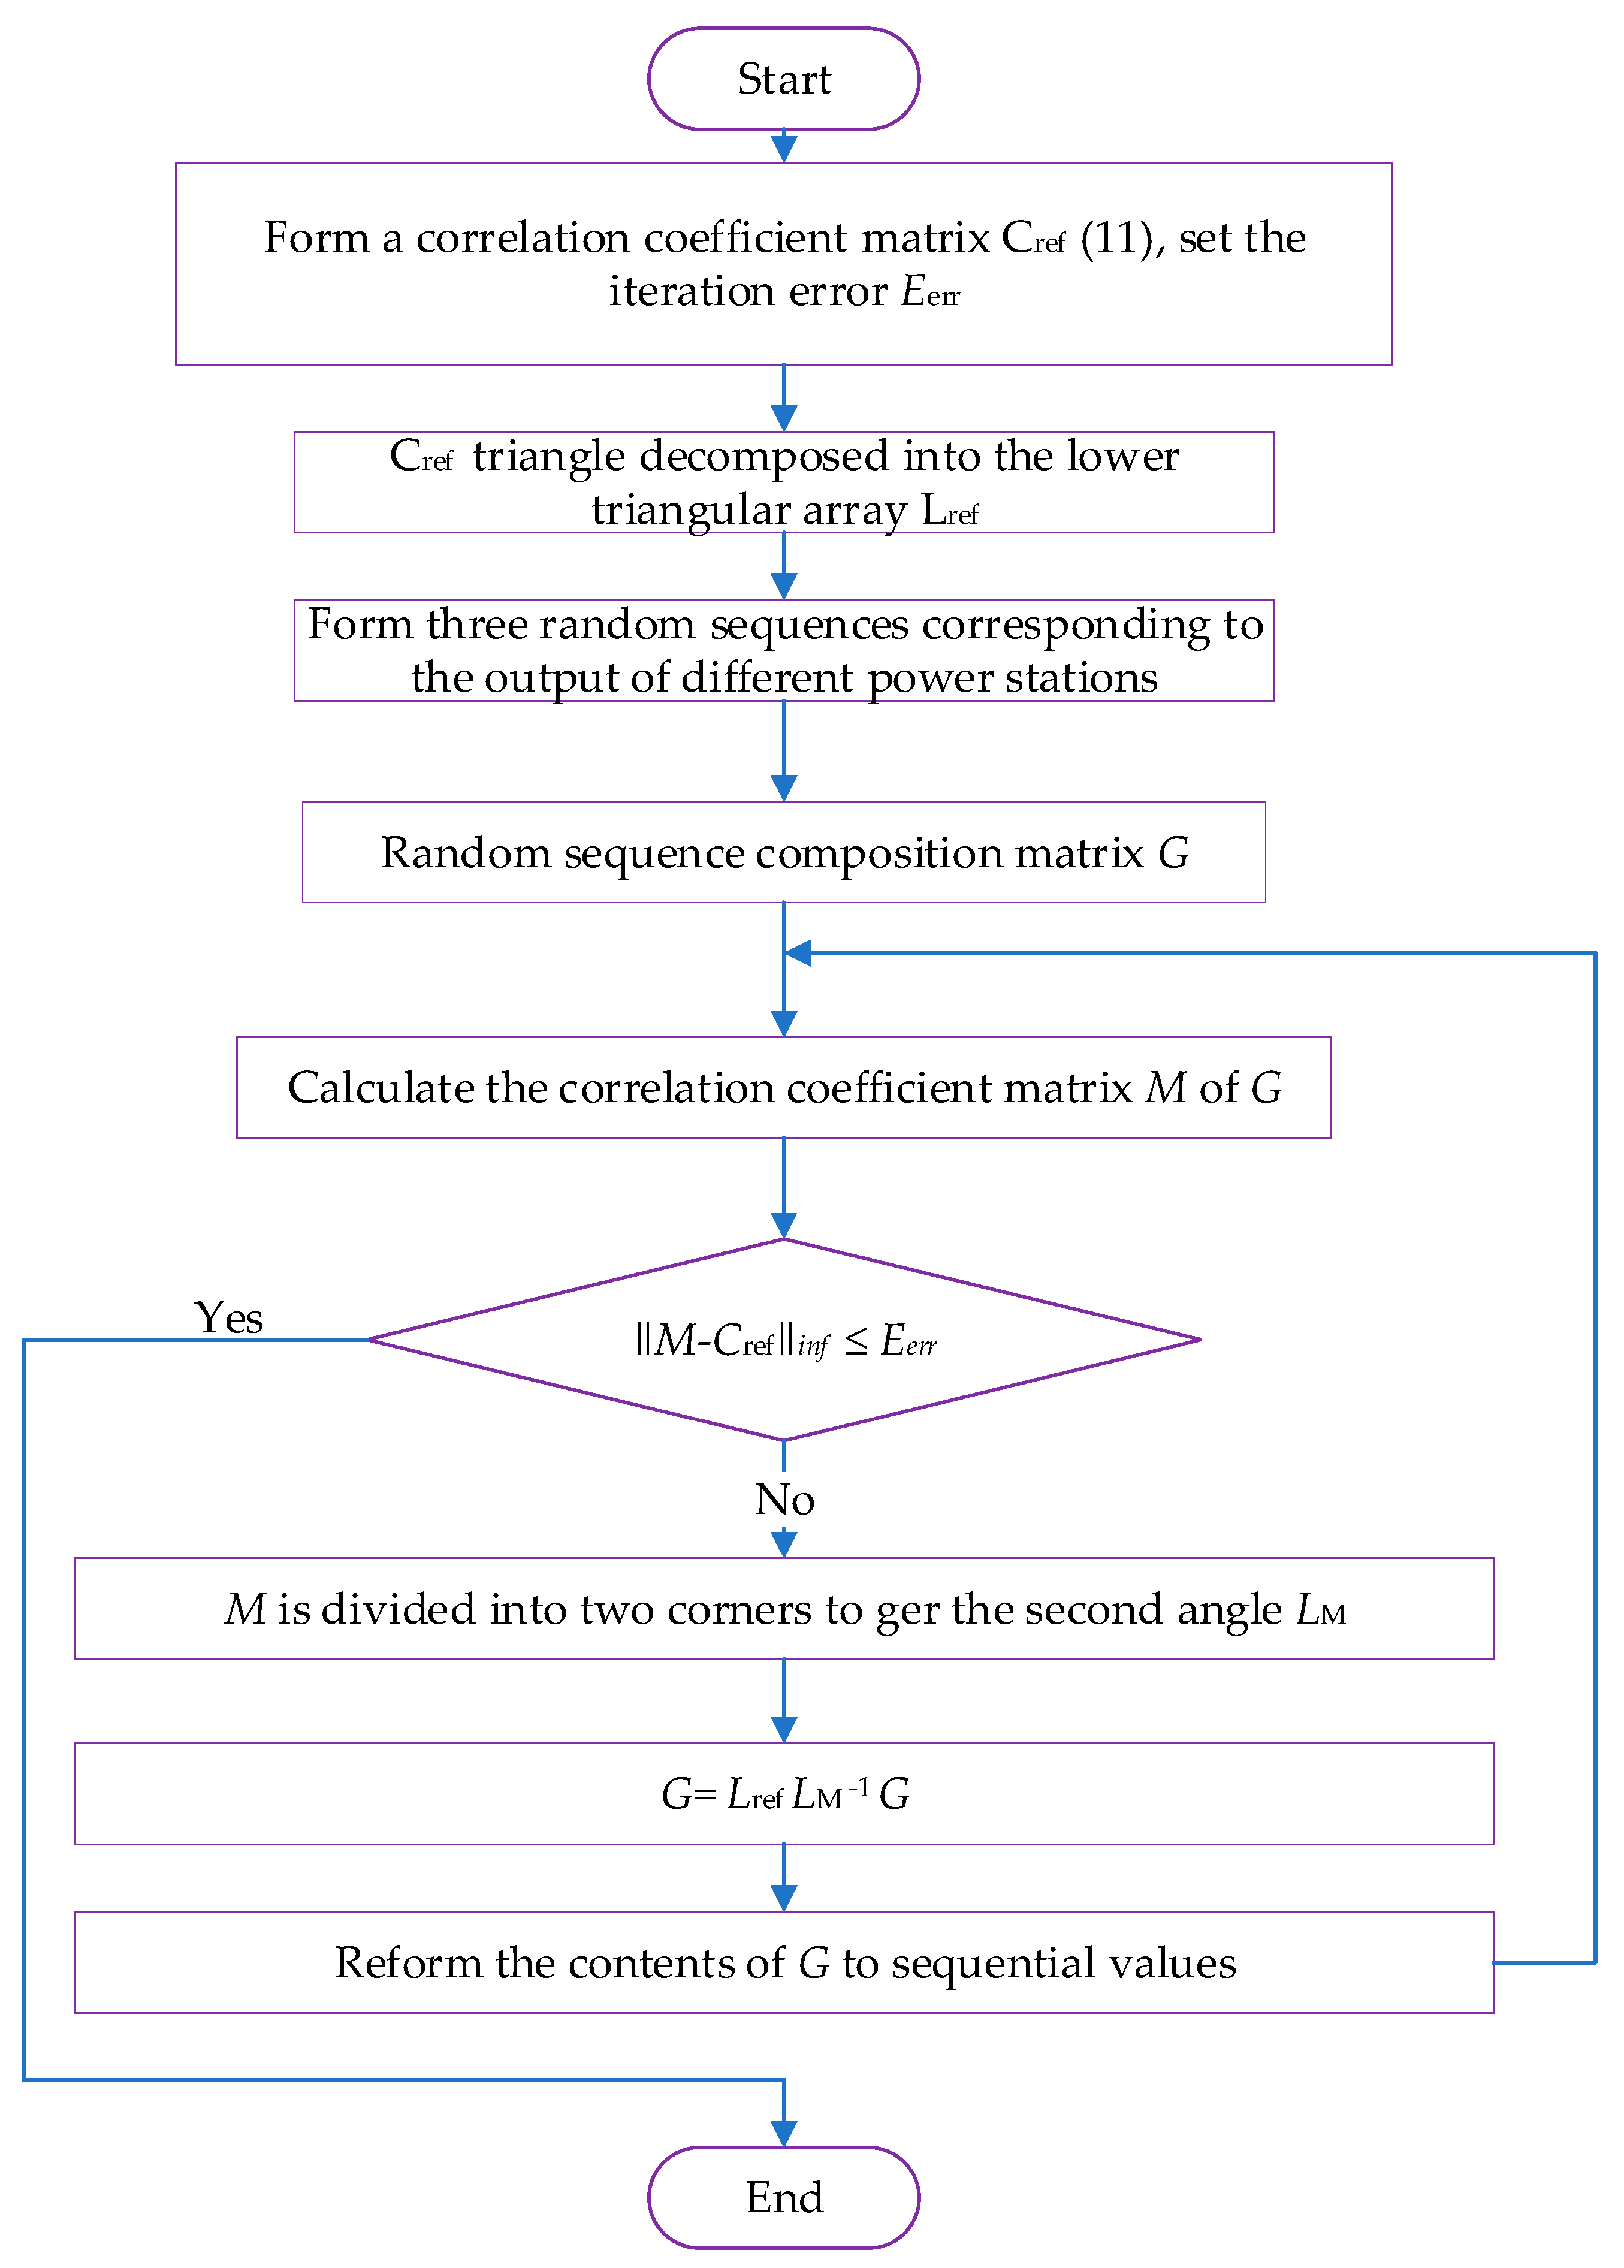
The principle is applied to the sampling links in the Latin hypercube method, to generate a set of PV power plant output sequences reflecting their respective edge distributions. The correlation coefficient information is introduced into the sorting step in the cubic method, by continuously adjusting the order of each sequence data, in order to conform to the specified cross-correlation [40,41,42,43]. Therefore, it can be ensured that the generated samples are consistent with the respective edge distributions of the PV powers of different power stations, and the samples also meet the power-related correlation between power stations. The algorithm flow for adjusting the sequence of random output sequences is shown in Figure 5.
The order value in the flow refers to the sorted position value of the actual value in the sequence (both in ascending order), and the Spearman rank correlation coefficient is only related to the sequence of sequential values, regardless of the size of the actual value.
3.3. Analysis of the Influence of Large-Scale PV Grid-Connected Power Flow
The influence of a large-scale PV grid-connected grid power flow mainly includes the influence on the node voltage and branch power. The following influencing factors—PV access capacity, PV access points, and PV output correlation—can comprehensively analyze the impact of a large-scale PV grid-connected on system power flow.
- (1)
- PV access capacity is used to calculate the probability density distribution of the voltage and power under different PV access capacity. In addition, to further analyze and compare the influence degree of the PV grid-connected on each branch tidal current, the branch power is calculated by the probabilistic power flow and the original when there is no PV grid connection. The standard deviation of the ratio of the branch power is used as an indicator to measure the degree of active power dispersion of each branch. Under different PV access conditions, the probability of an over-limit is calculated and is further explained by sensitivity analysis.
- (2)
- PV access points are used to calculate the expected value of the system network loss under different PV access points, analyze the characteristics of the system power flow distribution when the PV access point changes, and give a reference basis for selecting the PV network location.
- (3)
- According to the correlation degree of the PV power plant output, the correlation of the PV output is divided into three levels—high correlation, medium correlation, and low correlation. The PV output correlation is also used to calculate the probability density distribution of the voltage and power under different correlation coefficients, to analyze the fluctuation range, and to obtain the influence of the PV output correlation on grid power flow.
4. Voltage Characteristics Analysis
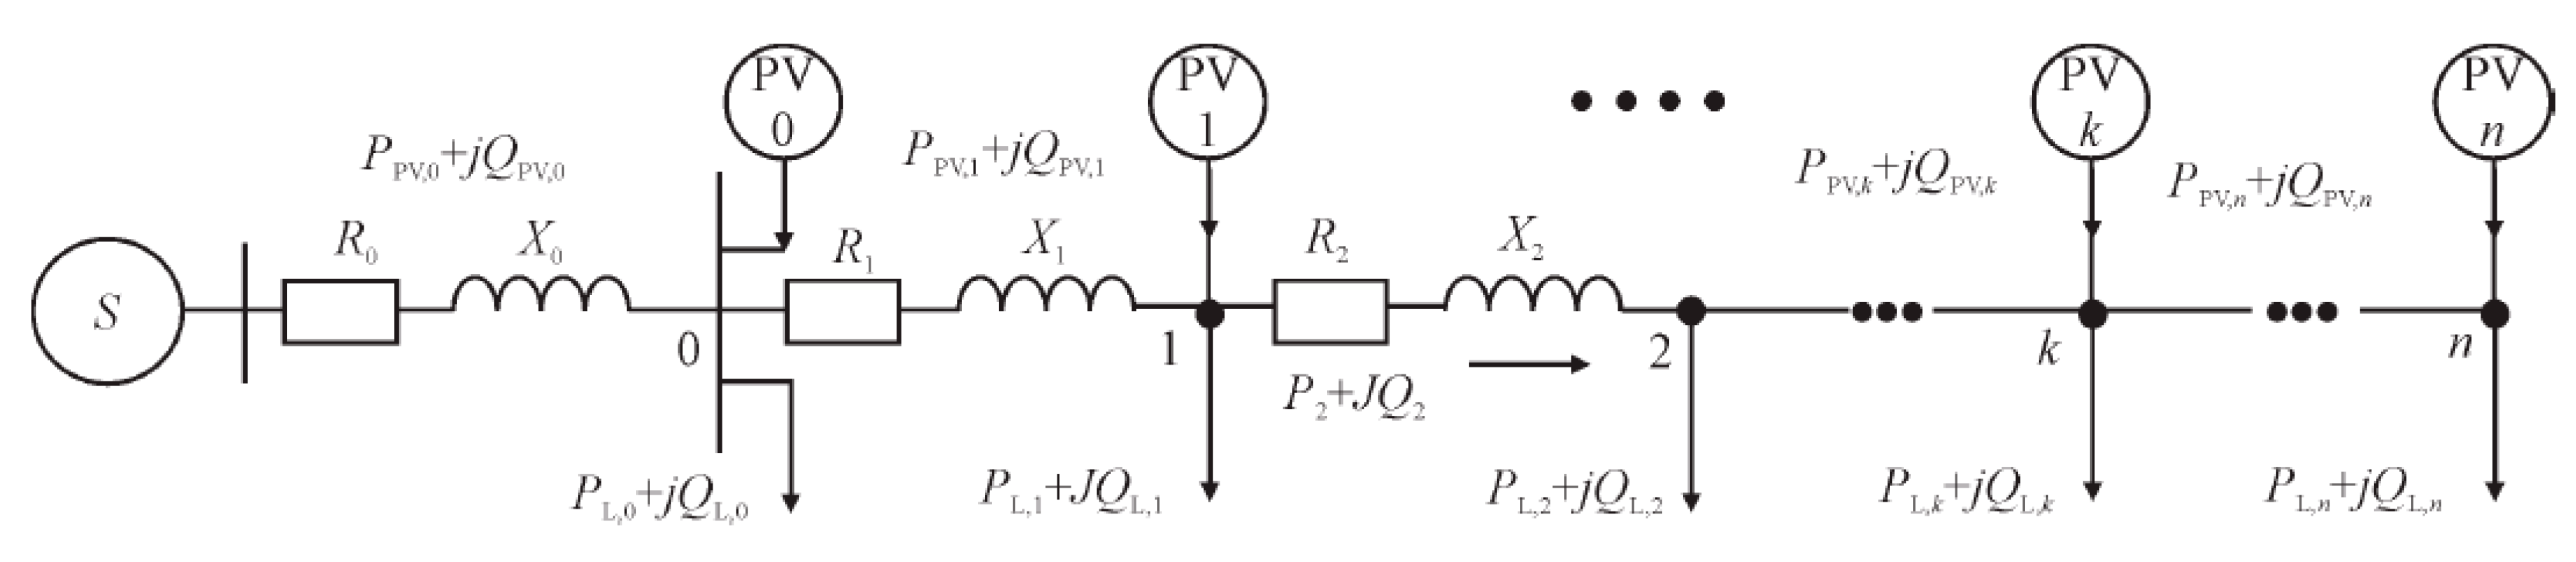
The traditional distribution network is generally an open-loop operation, and the single-supply radial structure network shown in Figure 1 can be used to equilibrate the normal operation of the distribution network [12]. As the feeder line length in the low-voltage distribution network is usually short, the feeder can be ignored. At the same time, it is considered that the PV power supply distributed to the distribution network often relies on the user’s roof construction, and the capacity is small. It is reasonable to assume that it does not have a pressure regulation capability.
In Figure 6, the feeder has a total of nodes. Node 0 represents the bus of the distribution network, which is the common connection point with the upper network. Nodes 1 to represent the other nodes in the distribution network. If its power value is set to 0, it means that there is no PV power or load on the node. and represent the equivalent impedance of the th feeder and the power flowing through the feeder, respectively. and represent the PV power output at node and the load power, respectively.
According to the power system analysis theory [11], when the distributed PV power source is not connected, the voltage deviation of the node at the feeder is given as follows:
After the PV power source is connected to the feeder node, the output current direction is opposite to the load. The voltage deviation of node after accessing the PV power source can be expressed as follows:
Voltage fluctuations are generally based on time-domain simulation analysis. Let be the instantaneous change of electromagnetic power output from the PV power supply at node . Then, when , the approximate numerical calculation method of the voltage fluctuation is given as follows:
where represents the voltage fluctuation value at node caused by DG power fluctuations.
The fluctuation of the PV power output produces significant voltage fluctuations. Let be the PV power supply power fluctuation coefficient, which is the instantaneous change of the output electromagnetic power, and that accounts for the rated power. Then, the ratio is calculated by the approximation of the voltage fluctuation as follows:
4.1. Accessible Capacity Optimization Model
In this paper, the PV maximum access capacity optimization model is established. In addition to the common static safety index constraints, the voltage fluctuation index is not limited. The genetic algorithm and Newton–Raphson algorithm are used to calculate the power flow.
4.1.1. Objective Function
Assuming that the PV of the access node is operating at its rated power, then the PV accessible capacity is expressed as the sum of the rated power of the grid-connected PV units. Based on this, the objective function of the accessible capacity maximization problem is given as follows:
where is the rated power of the node and is the number of PV units.
4.1.2. Restrictions
In addition to the static safety constraints, such as the common voltage deviation constraints and line thermal constraints, the mathematical model can be expressed as follows:
where and represent the upper and lower limits of the node voltage, respectively; represents the upper limit of the voltage fluctuation; represents the maximum power of the PV power source; and and are the line active power amplitude and the maximum allowable power value of the line, respectively.
4.2. Model Solving
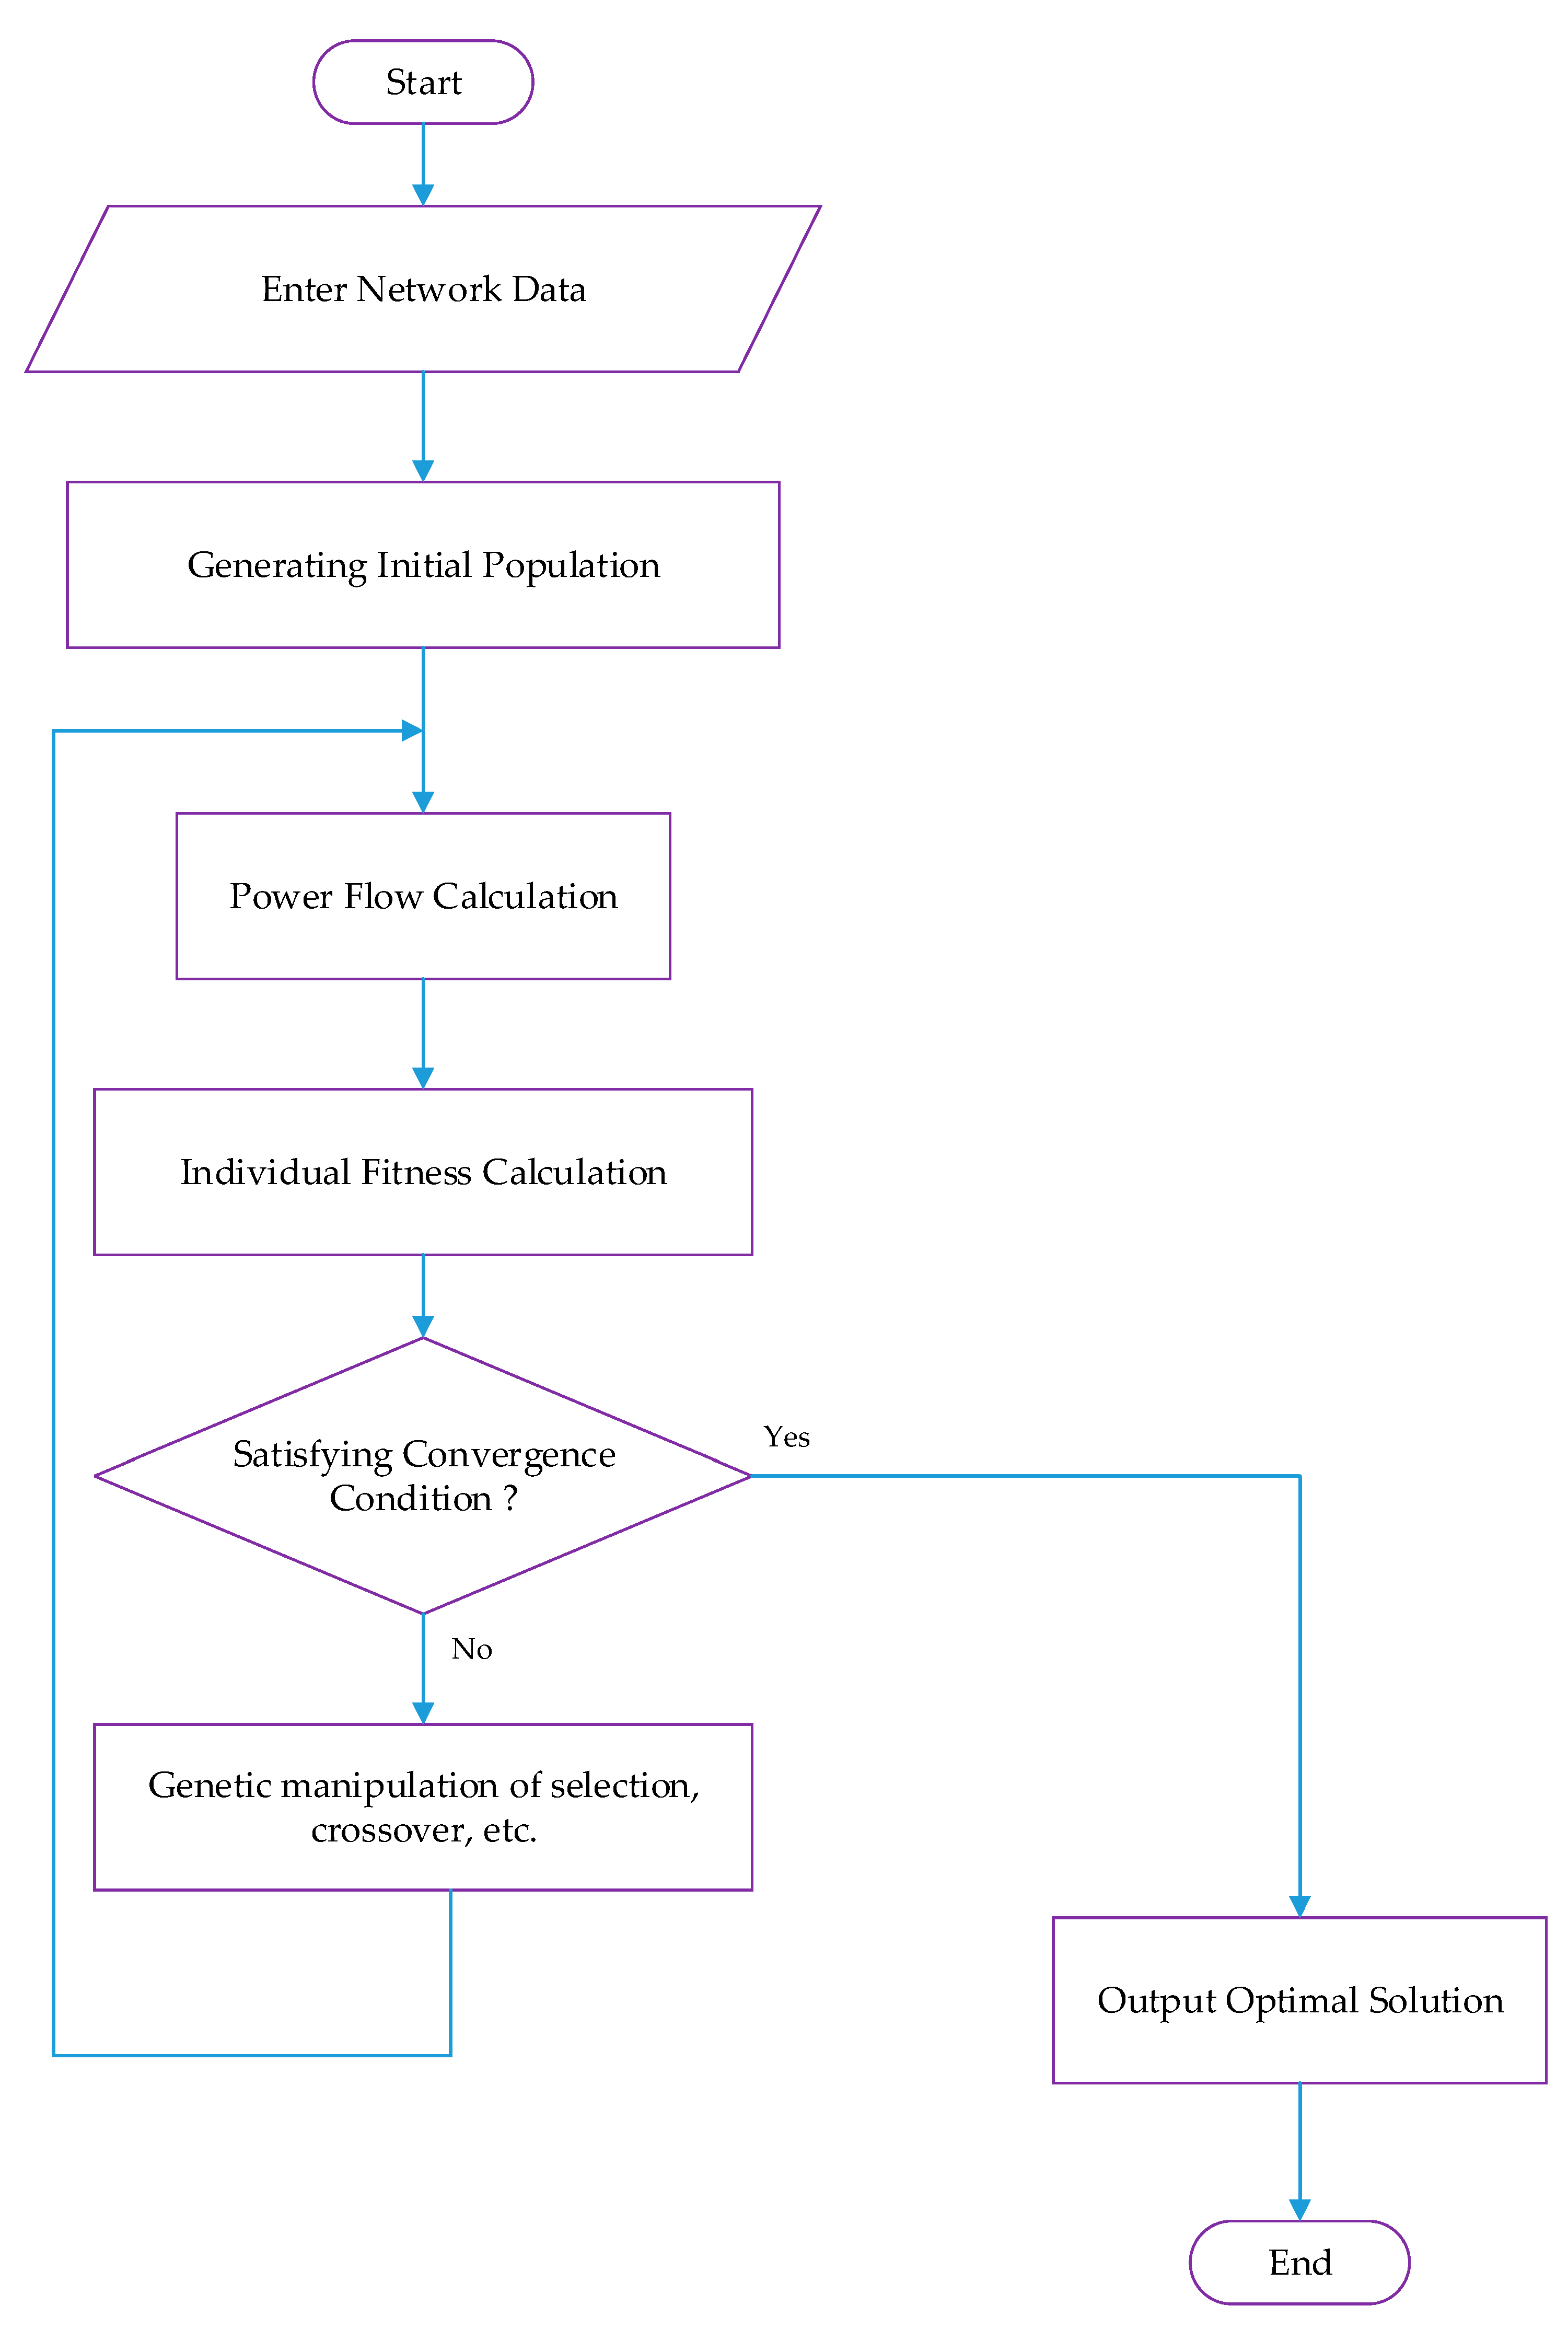
A large number of studies have shown that genetic algorithms can successfully deal with optimization problems [13]. When solving the accessible capacity optimization model, the Newton–Raphson algorithm has been used to solve the power flow and make the individual satisfy the constraints expressed by Equations (6)–(9). The conditions and calculation principles are shown in Figure 7.
5. Simulation Results and Analysis
Based on the IEEE 14-node system and a provincial-level power grid system in Pakistan, the probabilistic power flow calculation with PV is carried out using the MATLAB platform. According to the ideas and methods described in Section 3.3, the influence of a large-scale PV grid-connected on system power flow is studied.
5.1. Example 1—IEEE 14 Node System
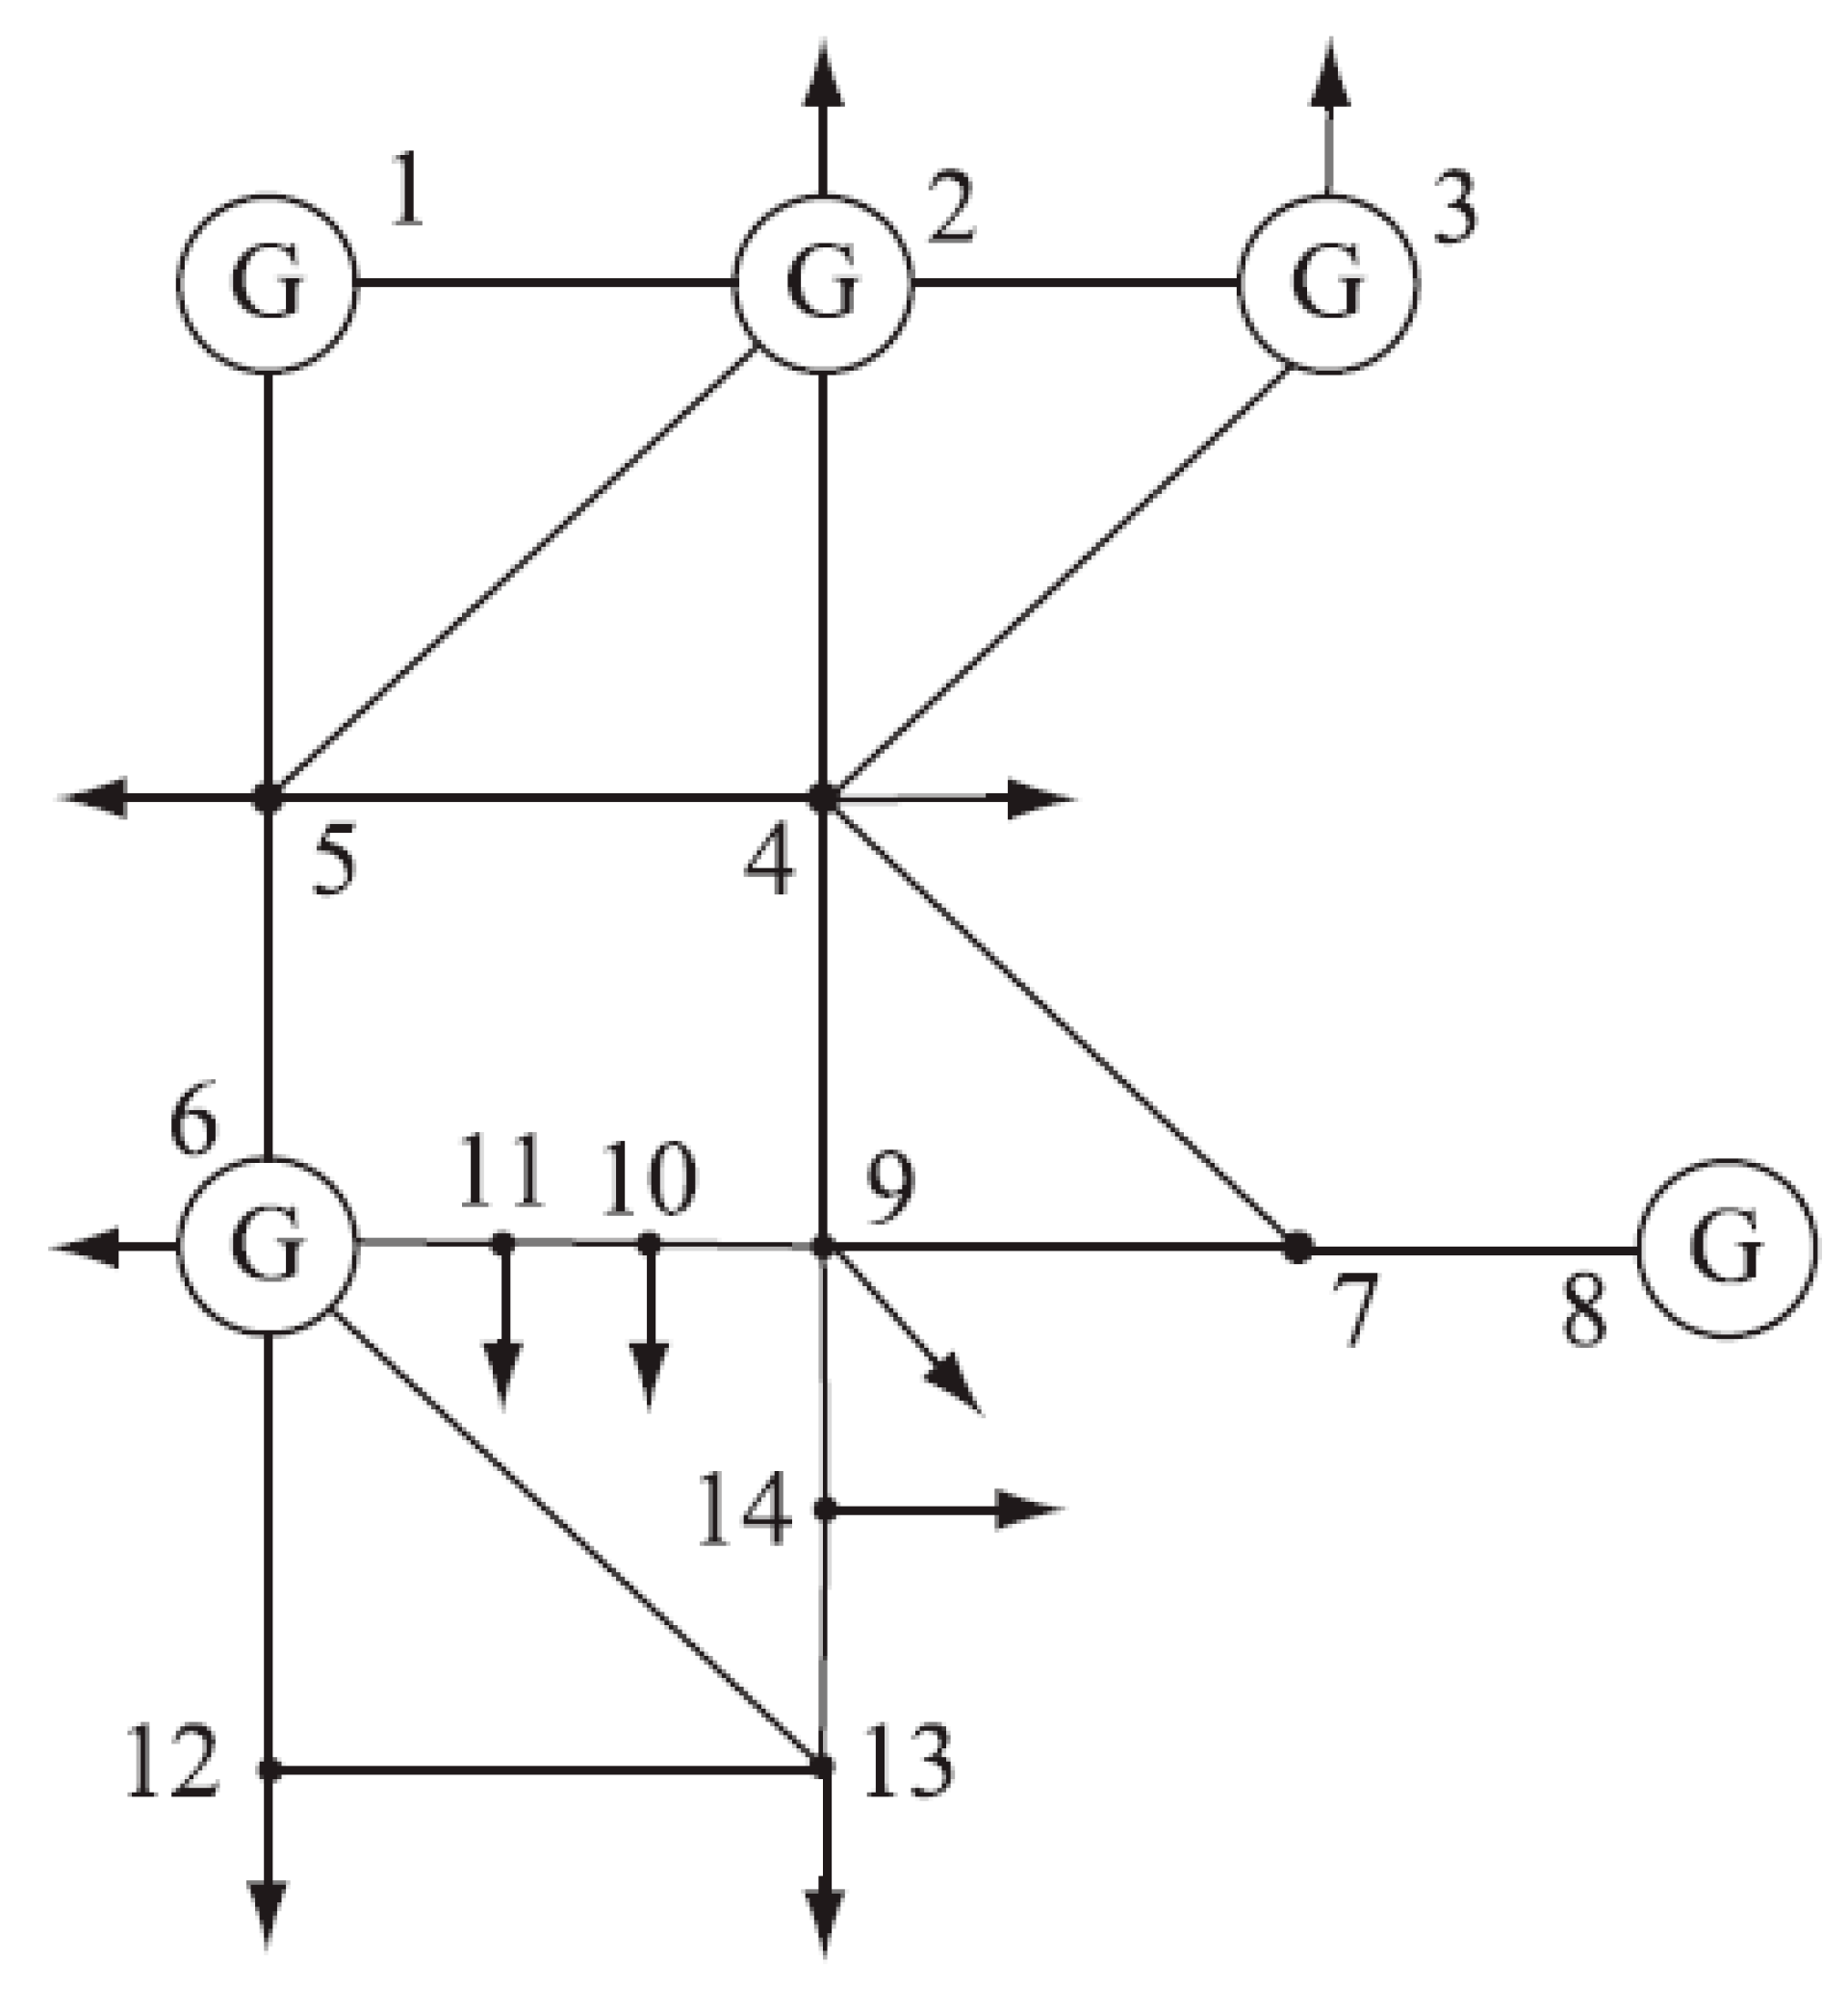
Taking the IEEE 14-node system shown in Figure 8 as an example, the influence of a PV grid-connected on system node voltage and branch current flow is analyzed. The Monte Carlo simulation method used in this example has a sampling scale of 5000 times. A total of five generators are connected to nodes 1, 2, 3, 6, and 8, respectively, where node 1 is used as a balancing machine, and the total system load is Pload = 259 MW. The characteristic parameters of the PV cells used in the examples are shown in Table 1.
To take the light intensity characteristics of three regions in Germany as an example, a pseudo-flow calculation using PVs is carried out. The fitting parameters of the light intensity Beta distribution in each region are shown in Table 2.
5.1.1. The Effect of PV Grid Connection on Node Voltage
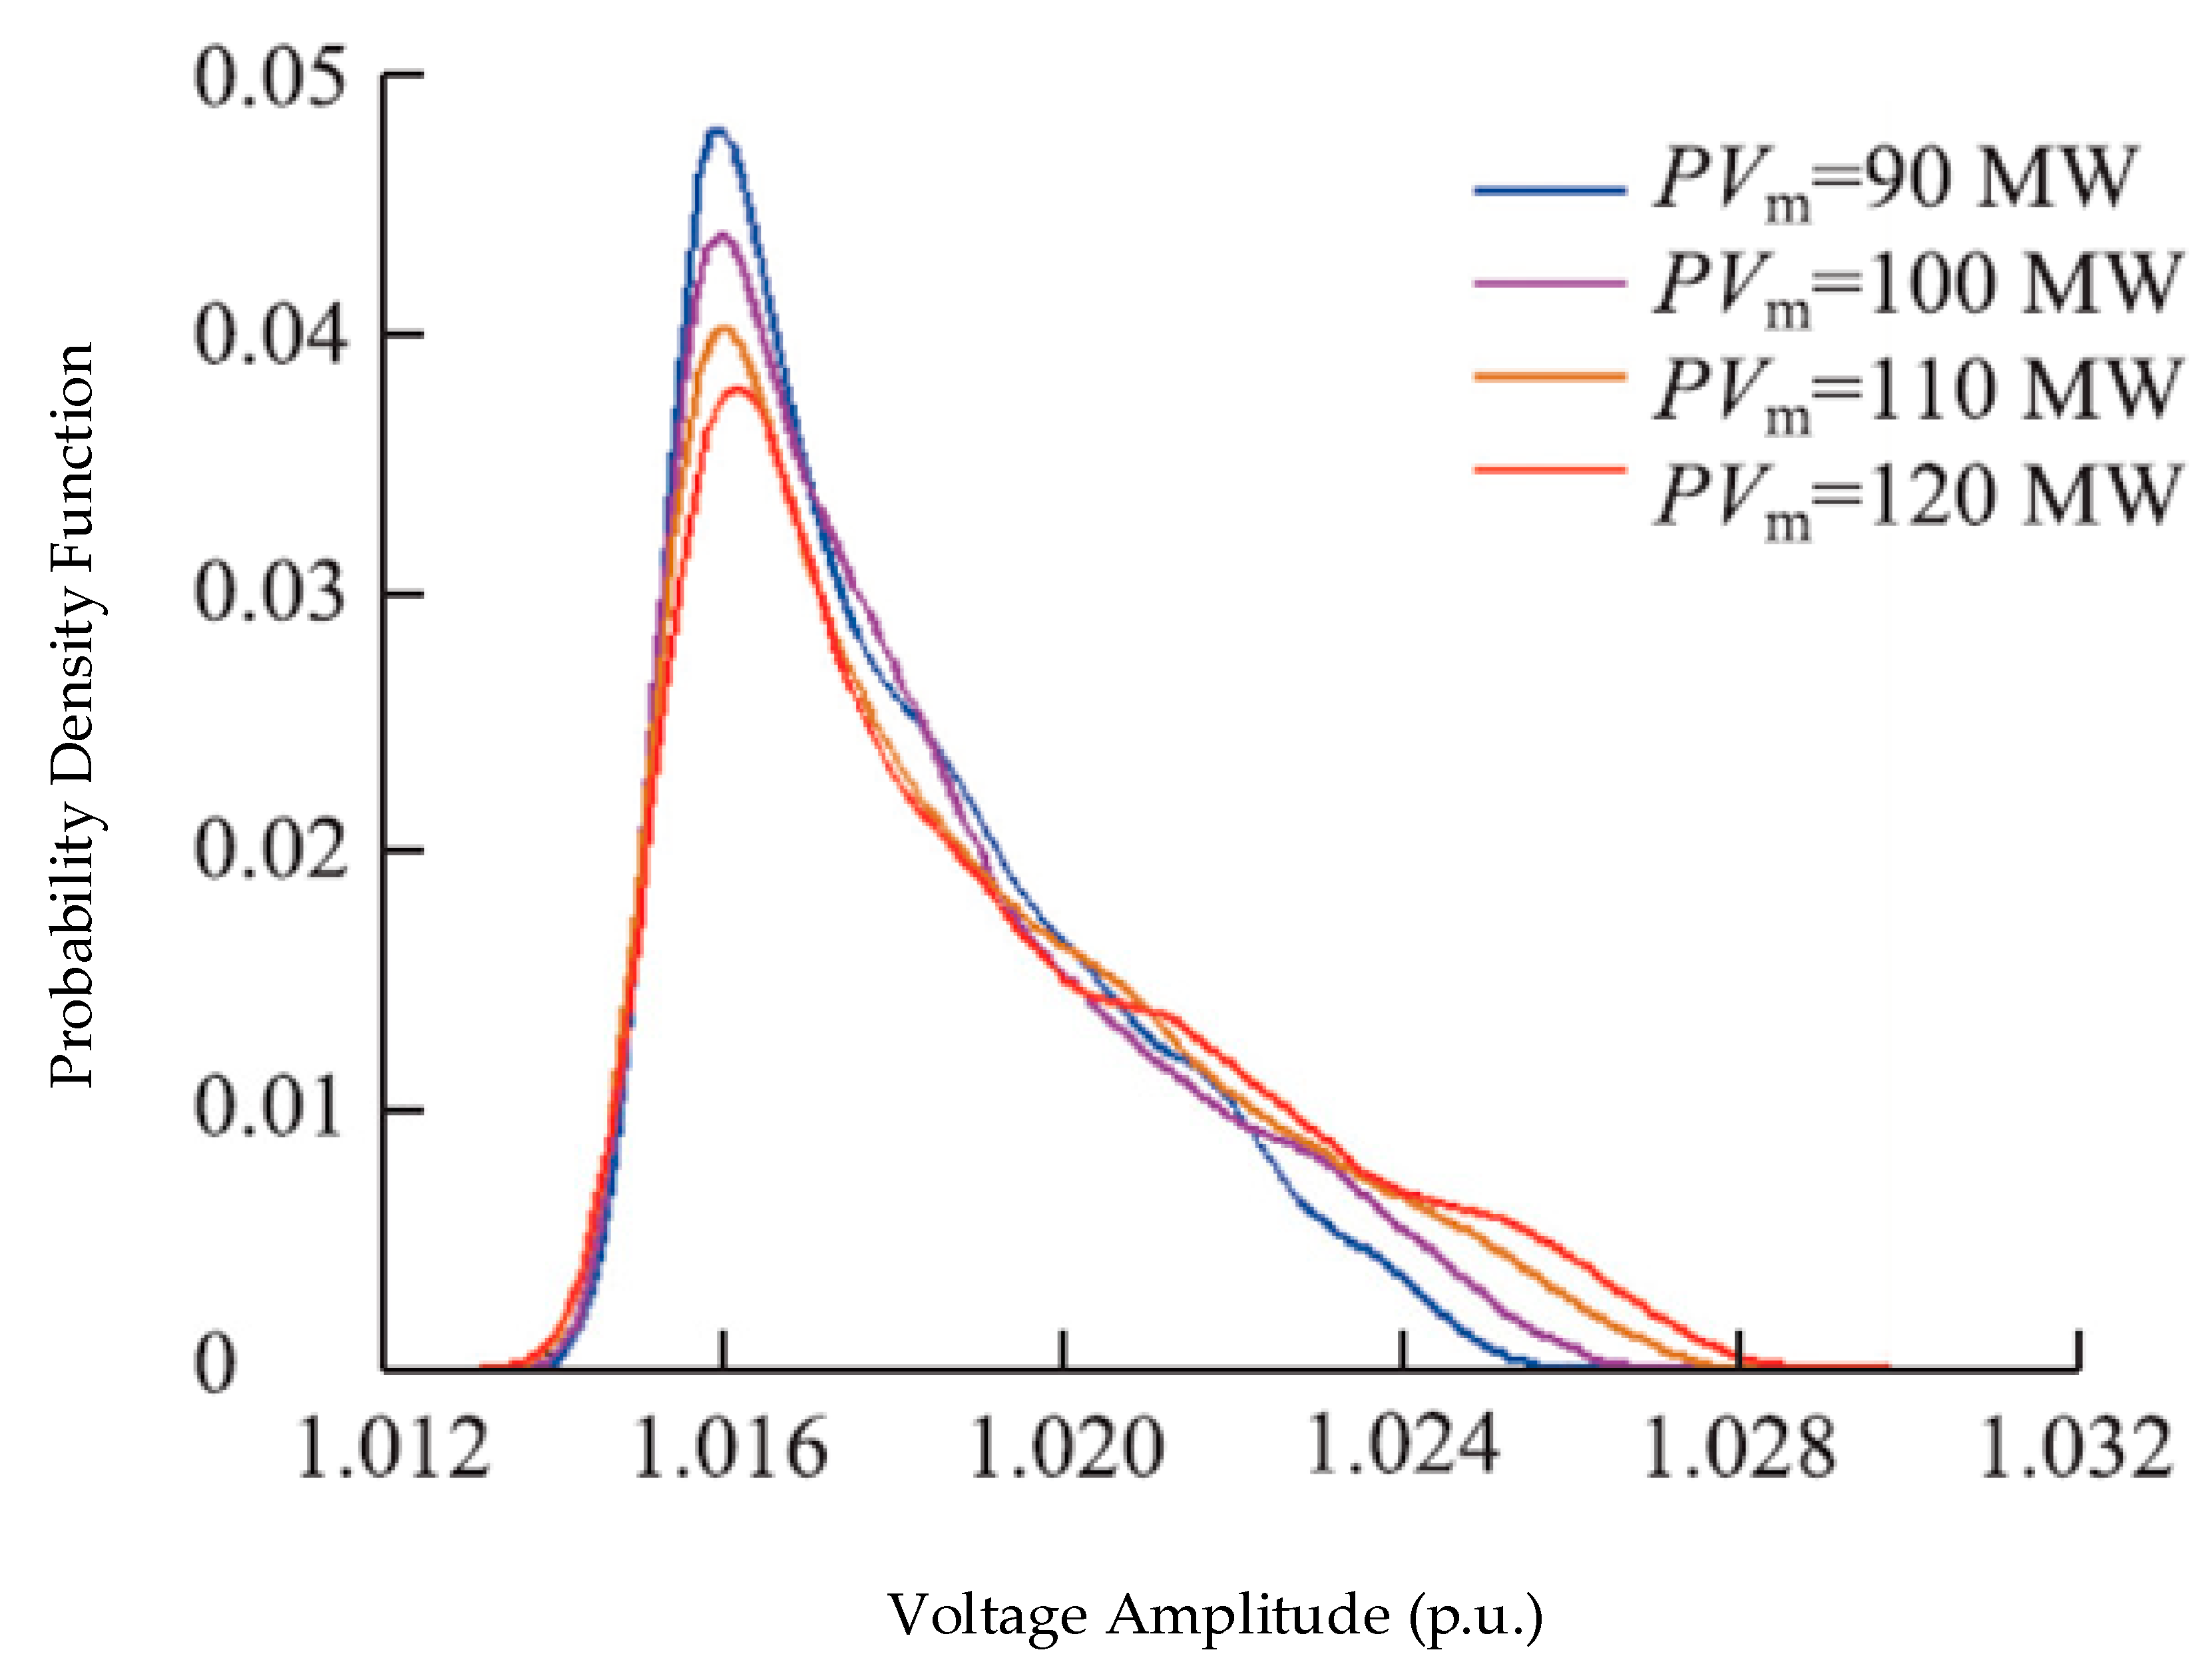
Assume that the PV power plant PV1 is connected to the system node 4, and the probability density distribution function of the voltage amplitude is calculated by taking node 5 when the PV access capacity is 90 MW, 100 MW, 110 MW, and 120 MW. The probability density function analysis of this case is shown in Figure 9.
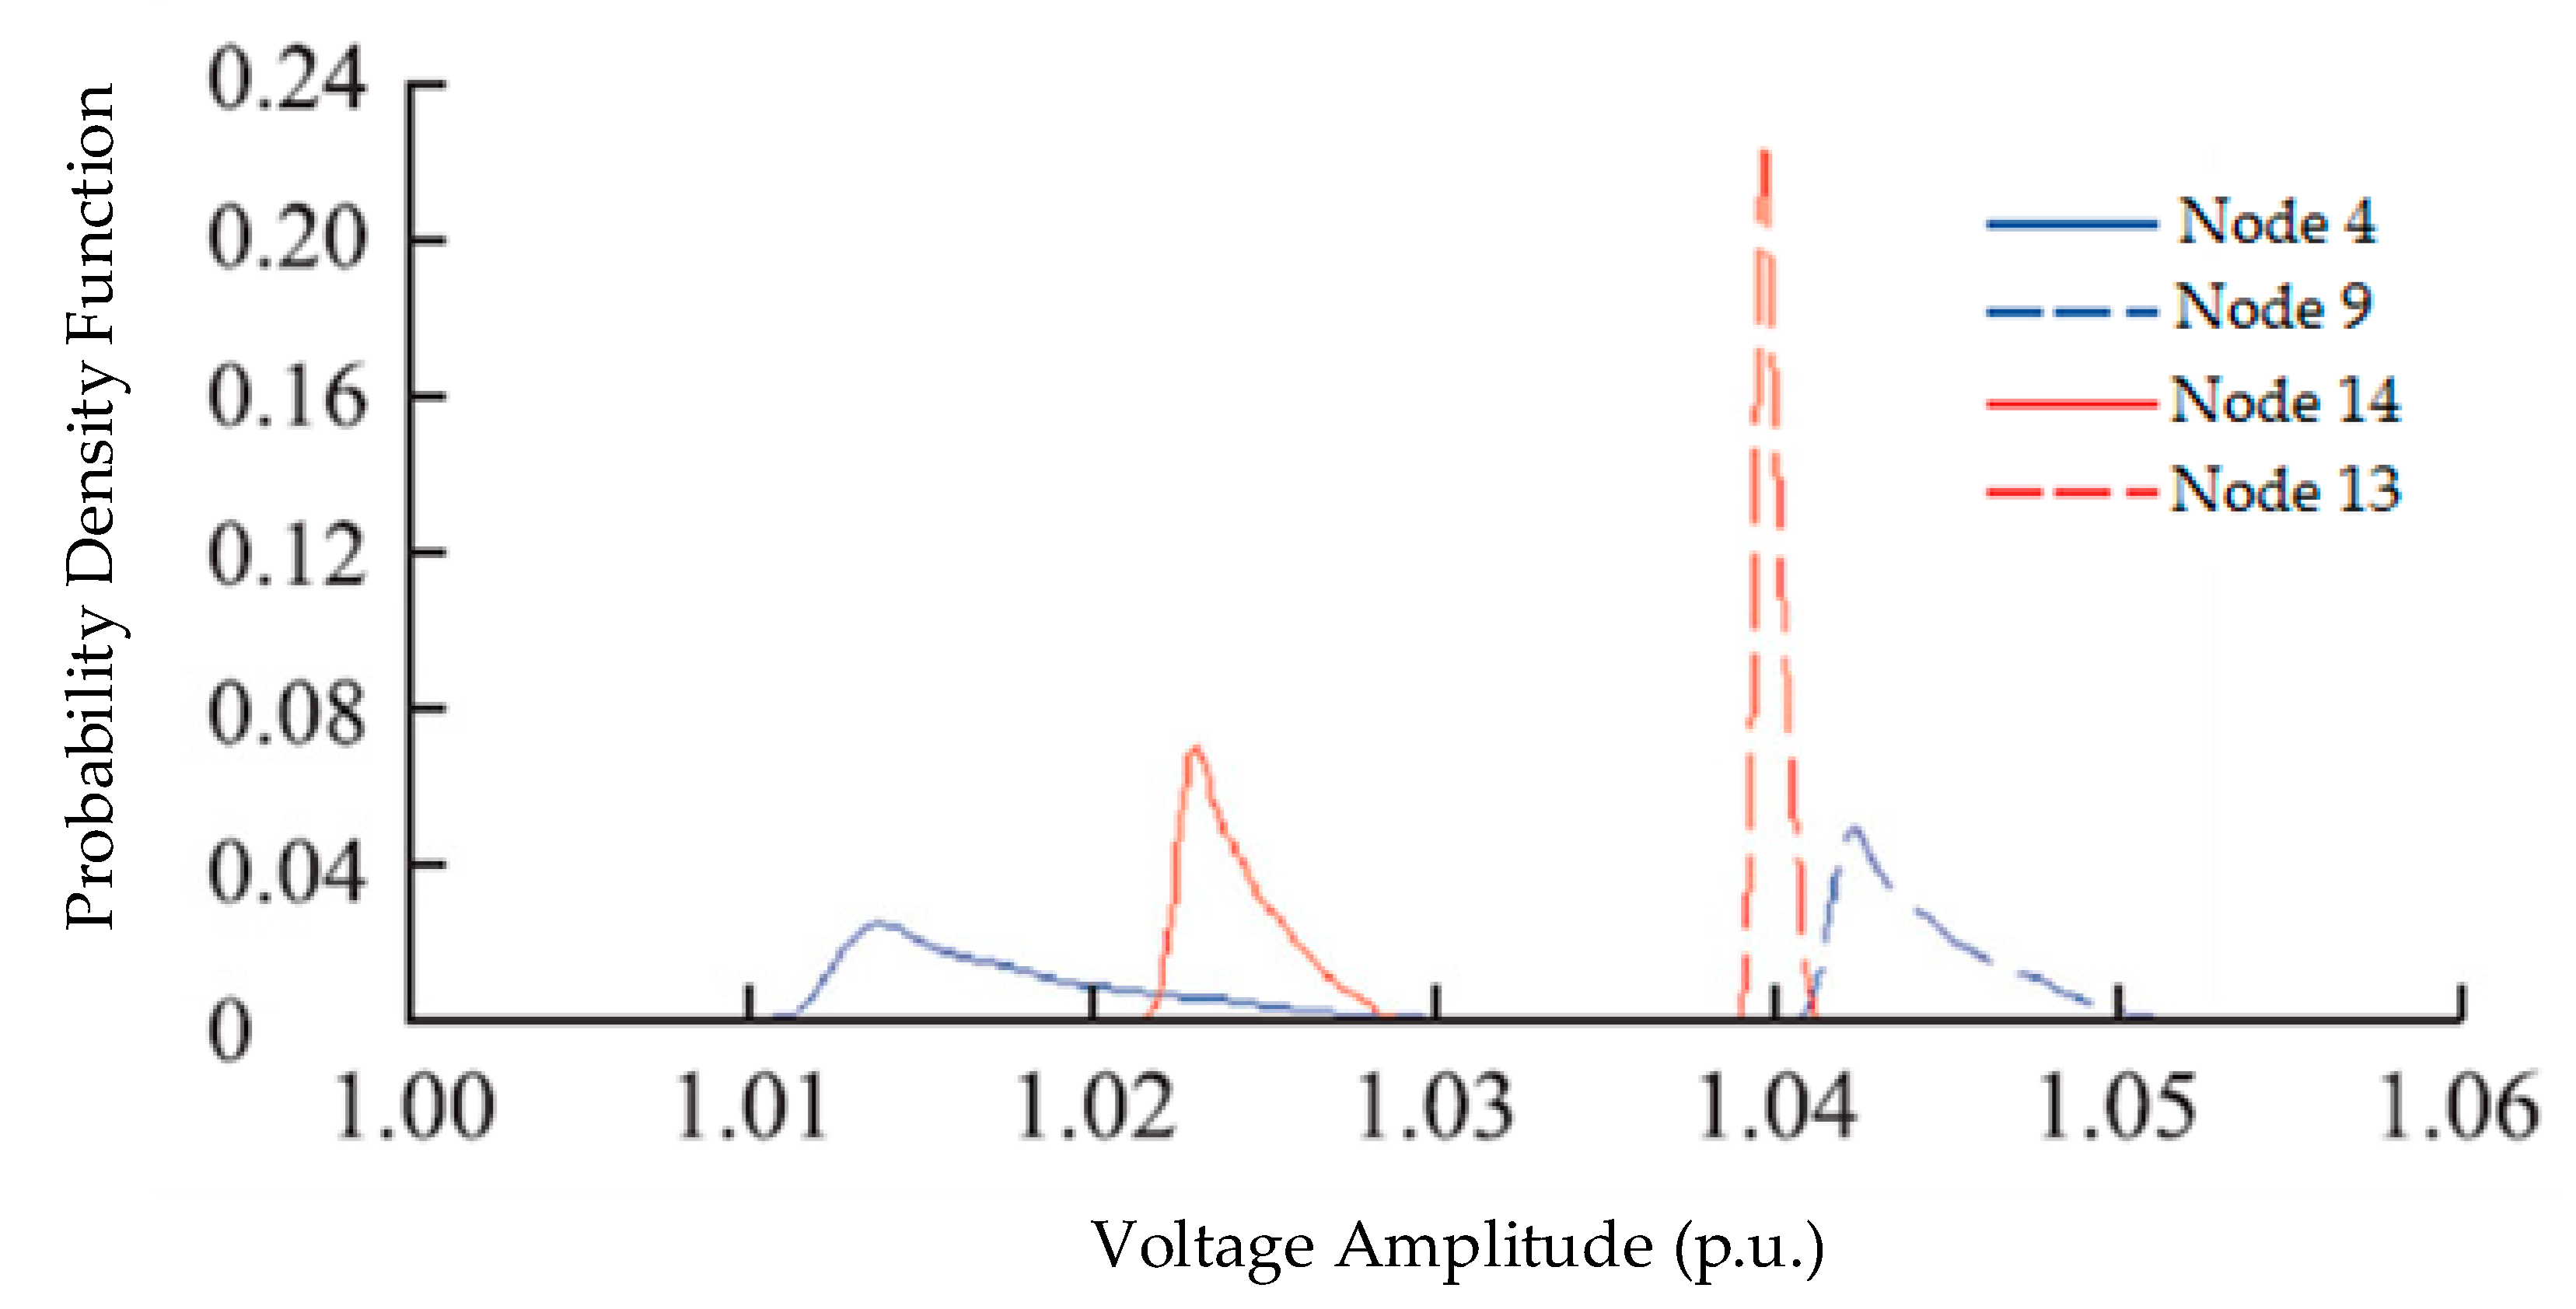
The fixed PV access capacity is 120 MW, and the voltage amplitude probability density distribution function of node 4, node 9, node 14, and node 13 are shown in Figure 10.
It can be seen from Figure 9 that as the PV access capacity increases, the node voltage probability distribution becomes more dispersed and the voltage volatility becomes greater. Excessive voltage fluctuations may cause the node voltage to exceed the limit, which will adversely affect the safe and stable operation of the power grid. Nodes 4, 9, 14, and 13 are gradually increased from the PV access point. As shown in Figure 8 and Figure 10, the closer the PV access point is, the larger the voltage amplitude fluctuation range is.
5.1.2. Influence of PV Grid-Connected on Branch Flow
For the branch flow, a similar trend can be obtained for the PV access capacity. The more distributed the tidal current distribution is, the greater the volatility is. The standard deviation of the active power of the branch under the condition that the PV access capacity varies from 80 to 150 MW. It was found that the standard deviation of the relative power values of each branch is approximately linear with the grid-connected PV capacity, and the increase of the PV grid-connected capacity does not change the order of influence of each line.
According to the results of the probabilistic power flow calculation, the trend of all of the branches is over-limit. Some of the results are shown in Table 3 (more than 15% of the absolute value of the non-PV branch flow is considered to be exceeded). It can be seen from the results that branch 3–4 and 9–10 exhibit a very high probability of exceeding the limit. Branch 9–14 may have a limit when the PV grid-connected capacity exceeds 100 MW, but the probability is low.
A line with a large fluctuation range after a PV grid connection does not necessarily accommodate to exceed the limit. The reason is that the power fluctuation of the branch caused by the PV grid connection is usually obviously directional. Only when the direction of power fluctuation is exactly the same as the direction of the transmission power of the branch without PV, the PV grid connection will threaten the safe operation of the line. On the contrary, if the fluctuation range is large for line 4–5, it will not cause a line overload.
The injection power of node 4 is adjusted in steps of 10 MW in the range of 0 to 200 MW. The ratio of the sensitivity coefficient to the original branch current is shown in Table 4. The results of branch 3–4, branch 9–10, and branch 9–14 are positive and the absolute values are large. These results indicate that the change of power flow caused by changing the unit injection power is the largest. Therefore, when the statistical transmission power exceeds the probability of three branches, this is the greatest risk, and these results are in complete agreement with the previous conclusions.
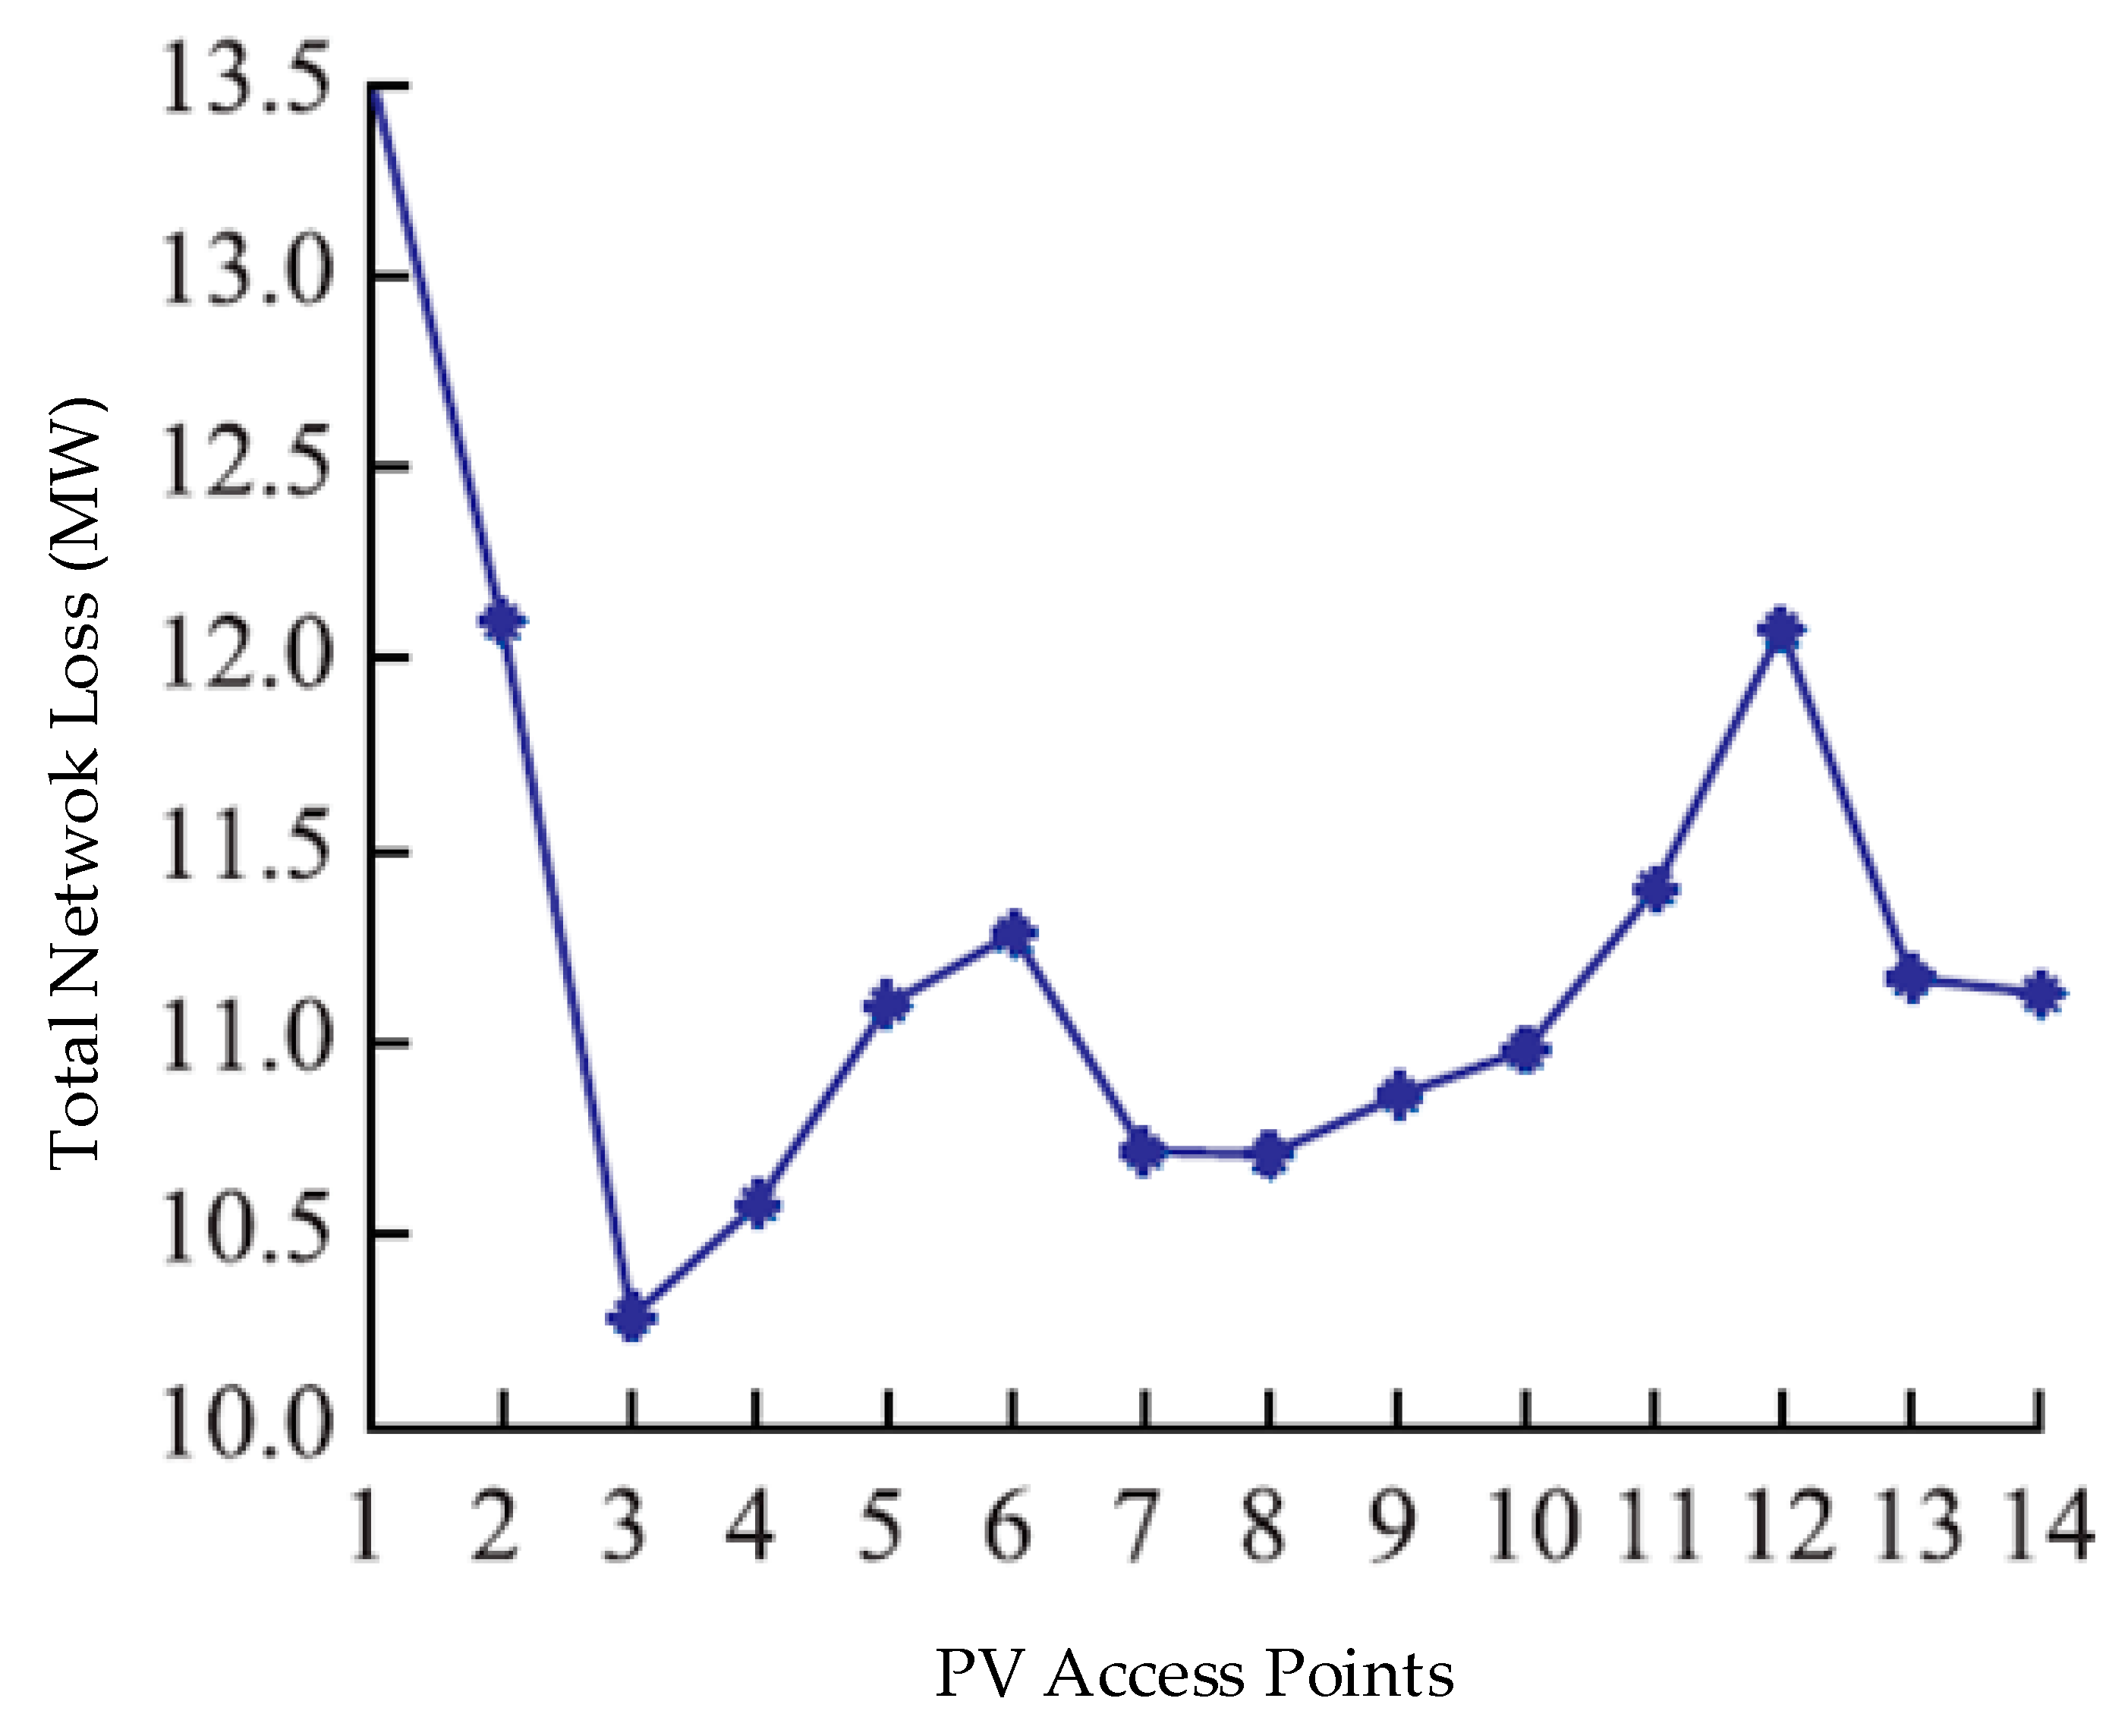
If the PV power plant access capacity is unchanged at 120 MW, and Monte Carlo sampling is used to calculate the total network loss of the system under different access points, then, the network loss of the system is shown in Figure 11.
The results from Figure 11 can be analyzed, and the conclusions are as follows:
- (1)
- The original system power is mainly sent out by node 1 and node 2. The integration of the PV into any position, except nodes 1 and 2, is obviously beneficial in order to balance the active power flow distribution, to reduce the system network loss, to select the heavy load node, and to obtain the minimum expected loss of the network loss. From the perspective of improving the network loss, the PV grid connection point should be selected at the power receiving end of the system.
- (2)
- If the output line of the PV grid-connected point is a low-voltage line with a high resistance value, such as node 12, and the PV output cannot be locally absorbed, then the system network loss improvement effect is poor.
5.2. Example 2—Actual Provincial Grid System
The actual provincial power grid system is located in the northern region and has abundant sunshine. It is suitable for establishing a centralized large-scale grid-connected PV power generation system and for directly accessing the transmission network. The simulation analysis shows that the influence of the grid connection of a single PV power station on the system node voltage and branch power flow is consistent with the conclusion of Example 1. It is limited to the length, and will not be discussed here. According to the planned total installed capacity of the grid in the region, it will reach 1500 MW. Based on the grid structure of the current power grid, it is difficult to achieve the planned scale of the single PV power grid. Therefore, adopting multiple PV power plant access systems to increase the PV installed capacity of the grid as much as possible is considered.
5.2.1. The Influence of PV Output Correlation on Grid Power Flow
As a result of the different grid structures, line parameters, reactive power compensation, and power generation and load, the maximum PV access capacity of the different PV grid-connected systems is quite different. Among the location of the PV Internet access and the proportion of output, four nodes are selected for the PV grid connection, so that the total installed capacity can meet the planning requirements. As shown in Table 5, the measured power flow is calculated by using the measured data of the PV power station in the region. In this example, the Monte Carlo probability flow calculation method is used based on Latin hypercube sampling, and the sampling scale is 1000 times.
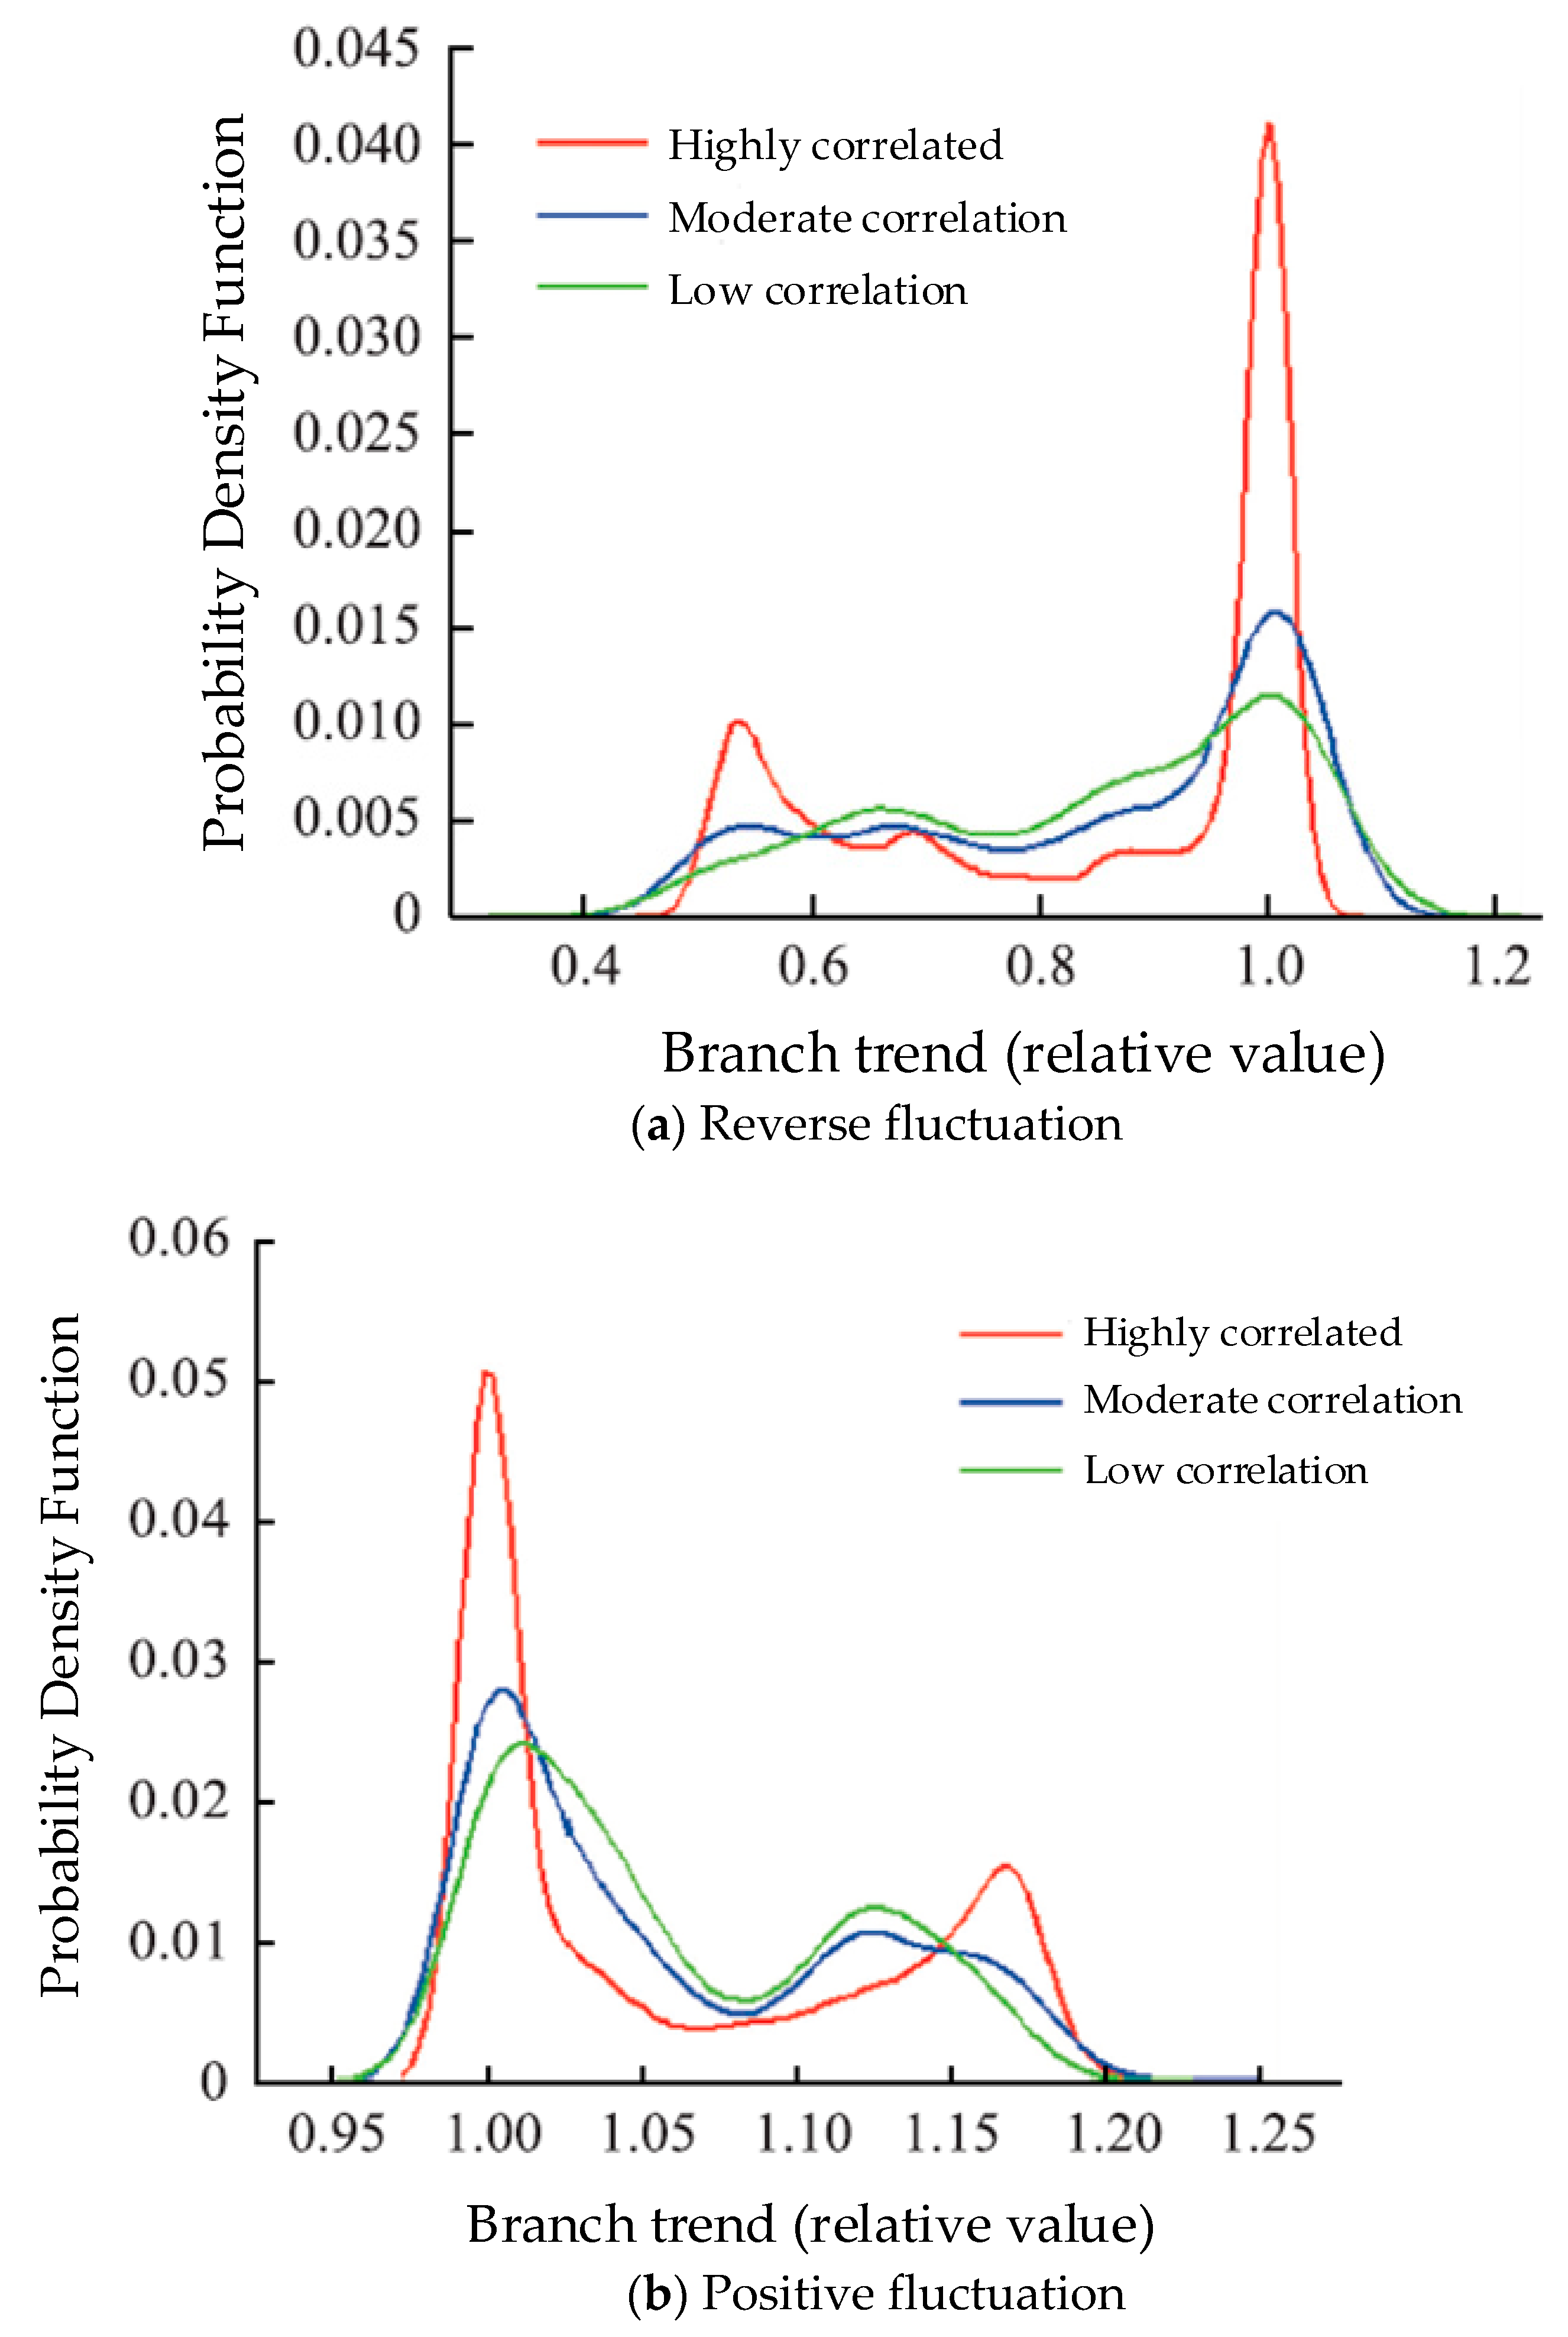
The correlation coefficients according to three coefficient settings (high, moderate, and low correlation) are shown in Table 6. The results of the calculation of the probability density distribution of the relative values of the branches under different correlation coefficients are shown in Figure 12 (based on the original power flow without PV).
It can be seen from Figure 12 that the larger the correlation coefficient of the output of the PV power station becomes, the more concentrated the distribution of the tidal current becomes, and the smaller the fluctuation range becomes. As the branch flow fluctuation caused by the PV grid connection has directionality, the power flow may fluctuate positively or reversely after the grid connection. If the fluctuation is opposite to the direction of the current when there is no PV, the flow will decrease. The fluctuation with an opposite direction does not affect the safe operation of the grid, as shown in Figure 12a. If the fluctuation is the same as the original flow direction, as shown in Figure 12b, it is possible to cause the trend to exceed the limit. Under the higher correlation coefficient, the probability density distribution exhibits the characteristics of a peak and thick tail, and the tail probability is larger. It can be seen from Figure 12b that, although the fluctuation range is small, the probability of the tidal limit may be greater (still based on 15% of the original trend as a basis for judgment). Therefore, when studying the influence of the PV grid connected on the system currents, the correlation of the multi-power station output cannot be ignored. For the node voltage, there are similar conclusions, which are not repeated here.
5.2.2. Analysis of the Trend Factors Restricting PV Grid-Connected Capacity
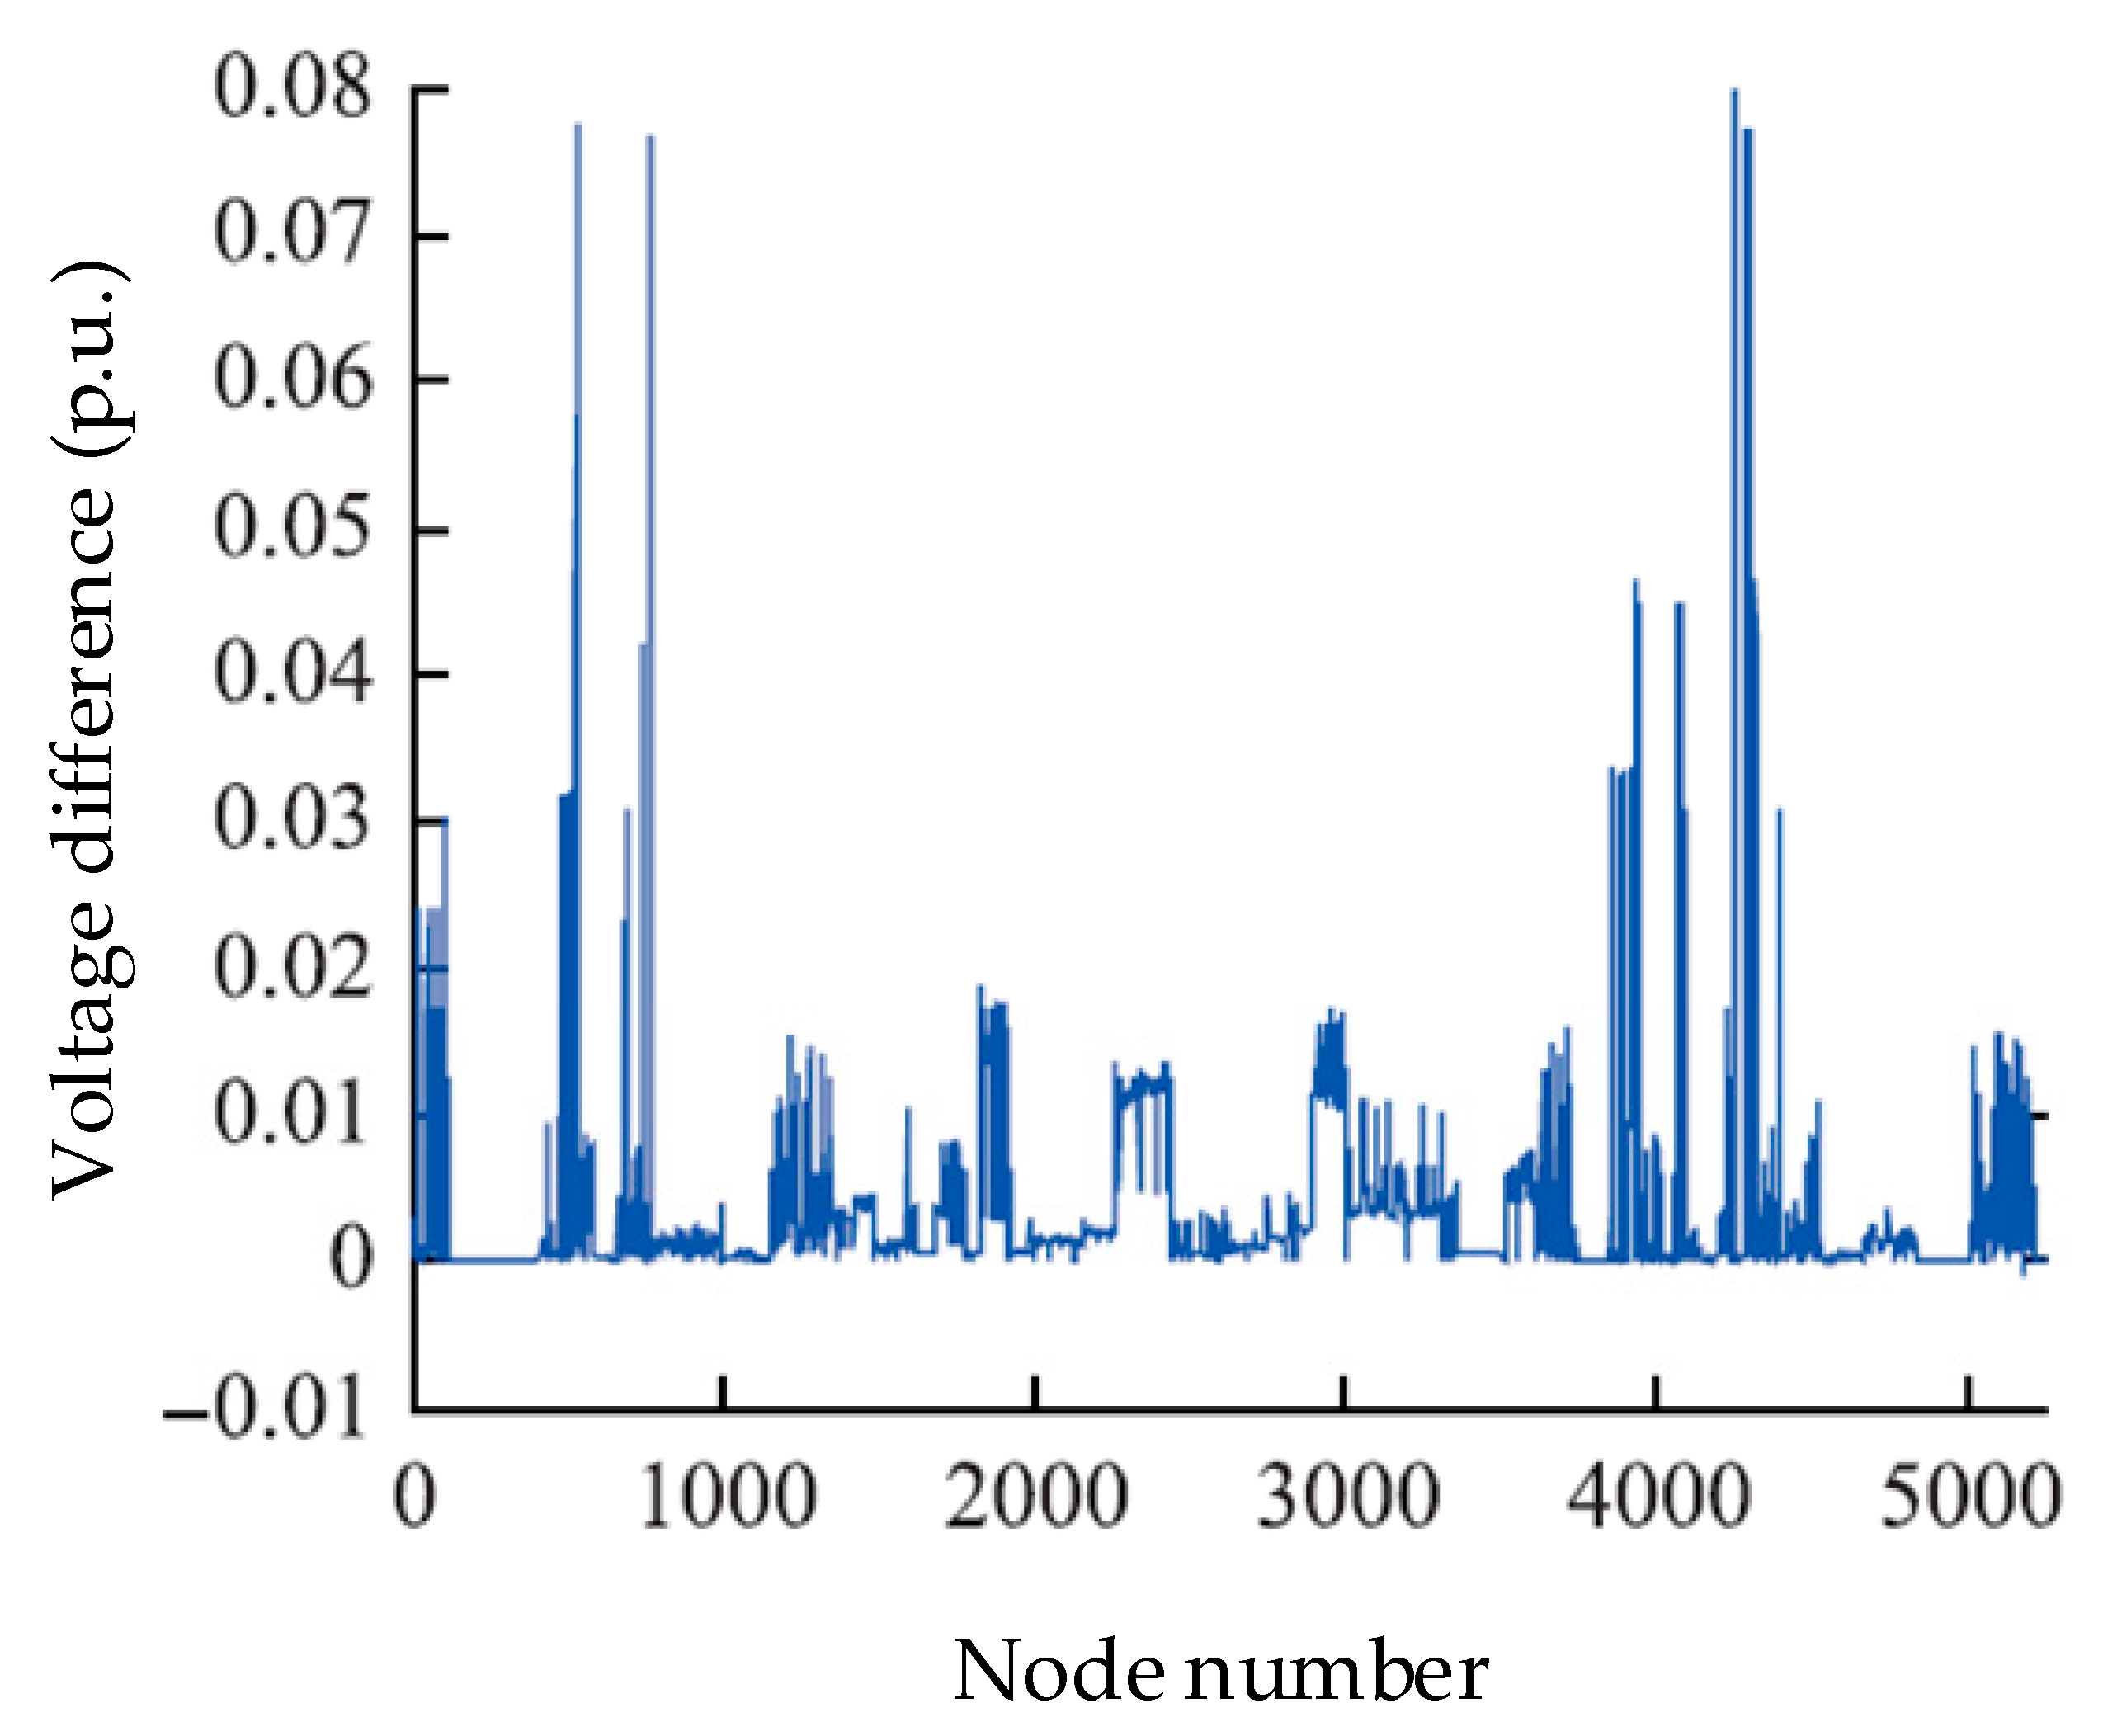
As the capacity of the network increases in the calculation of the power flow of the PV systems, there may be a phenomenon that the power flow calculation does not converge. This paper uses the MATLAB interface program to call PSASP 6.282 for calculation, to select a 110 KV bus as the PV access point, and to obtain the PV critical installed capacity when the power flow calculation does not converge, which is defined as the PV and network capacity limit. The voltage changes of each node are shown in Figure 13, and the nodes with the most obvious voltage drop are examined in Table 7.
After the PV grid connection, the most obvious point of voltage drop is the 110 KV busbar near the grid connection point or its transformer low-voltage side busbar. The main reason for reaching the grid-connected limit is that when the PV grid-connected capacity is too large, the system’s reactive power compensation is insufficient, and the voltage near the grid is insufficient to support it.
In addition, the type of PV grid-connected busbar also affects the PV systems. The changes of the PV access point bus and the limit capacity of PV access are shown in Table 8.
For the PV nodes, there is enough adjustable reactive capacity to maintain a given voltage amplitude. At this time, the PV can have the largest grid-connected capacity. If the node is a PV-to-PQ type node and the reactive power capacity upper limit is reached, the PV node starts to convert to the PQ node and the PV grid-connected limit is reduced. When the grid-connected point is the PQ node, the power is fixed and there is no reactive power adjustment capacity and responsiveness to the voltage changes. Therefore, when selecting a PV access point, from the perspective of voltage control, it is better to select a node with a strong reactive power adjustment capability and an automatic voltage regulating device in order to improve the PV receiving capability of the system.
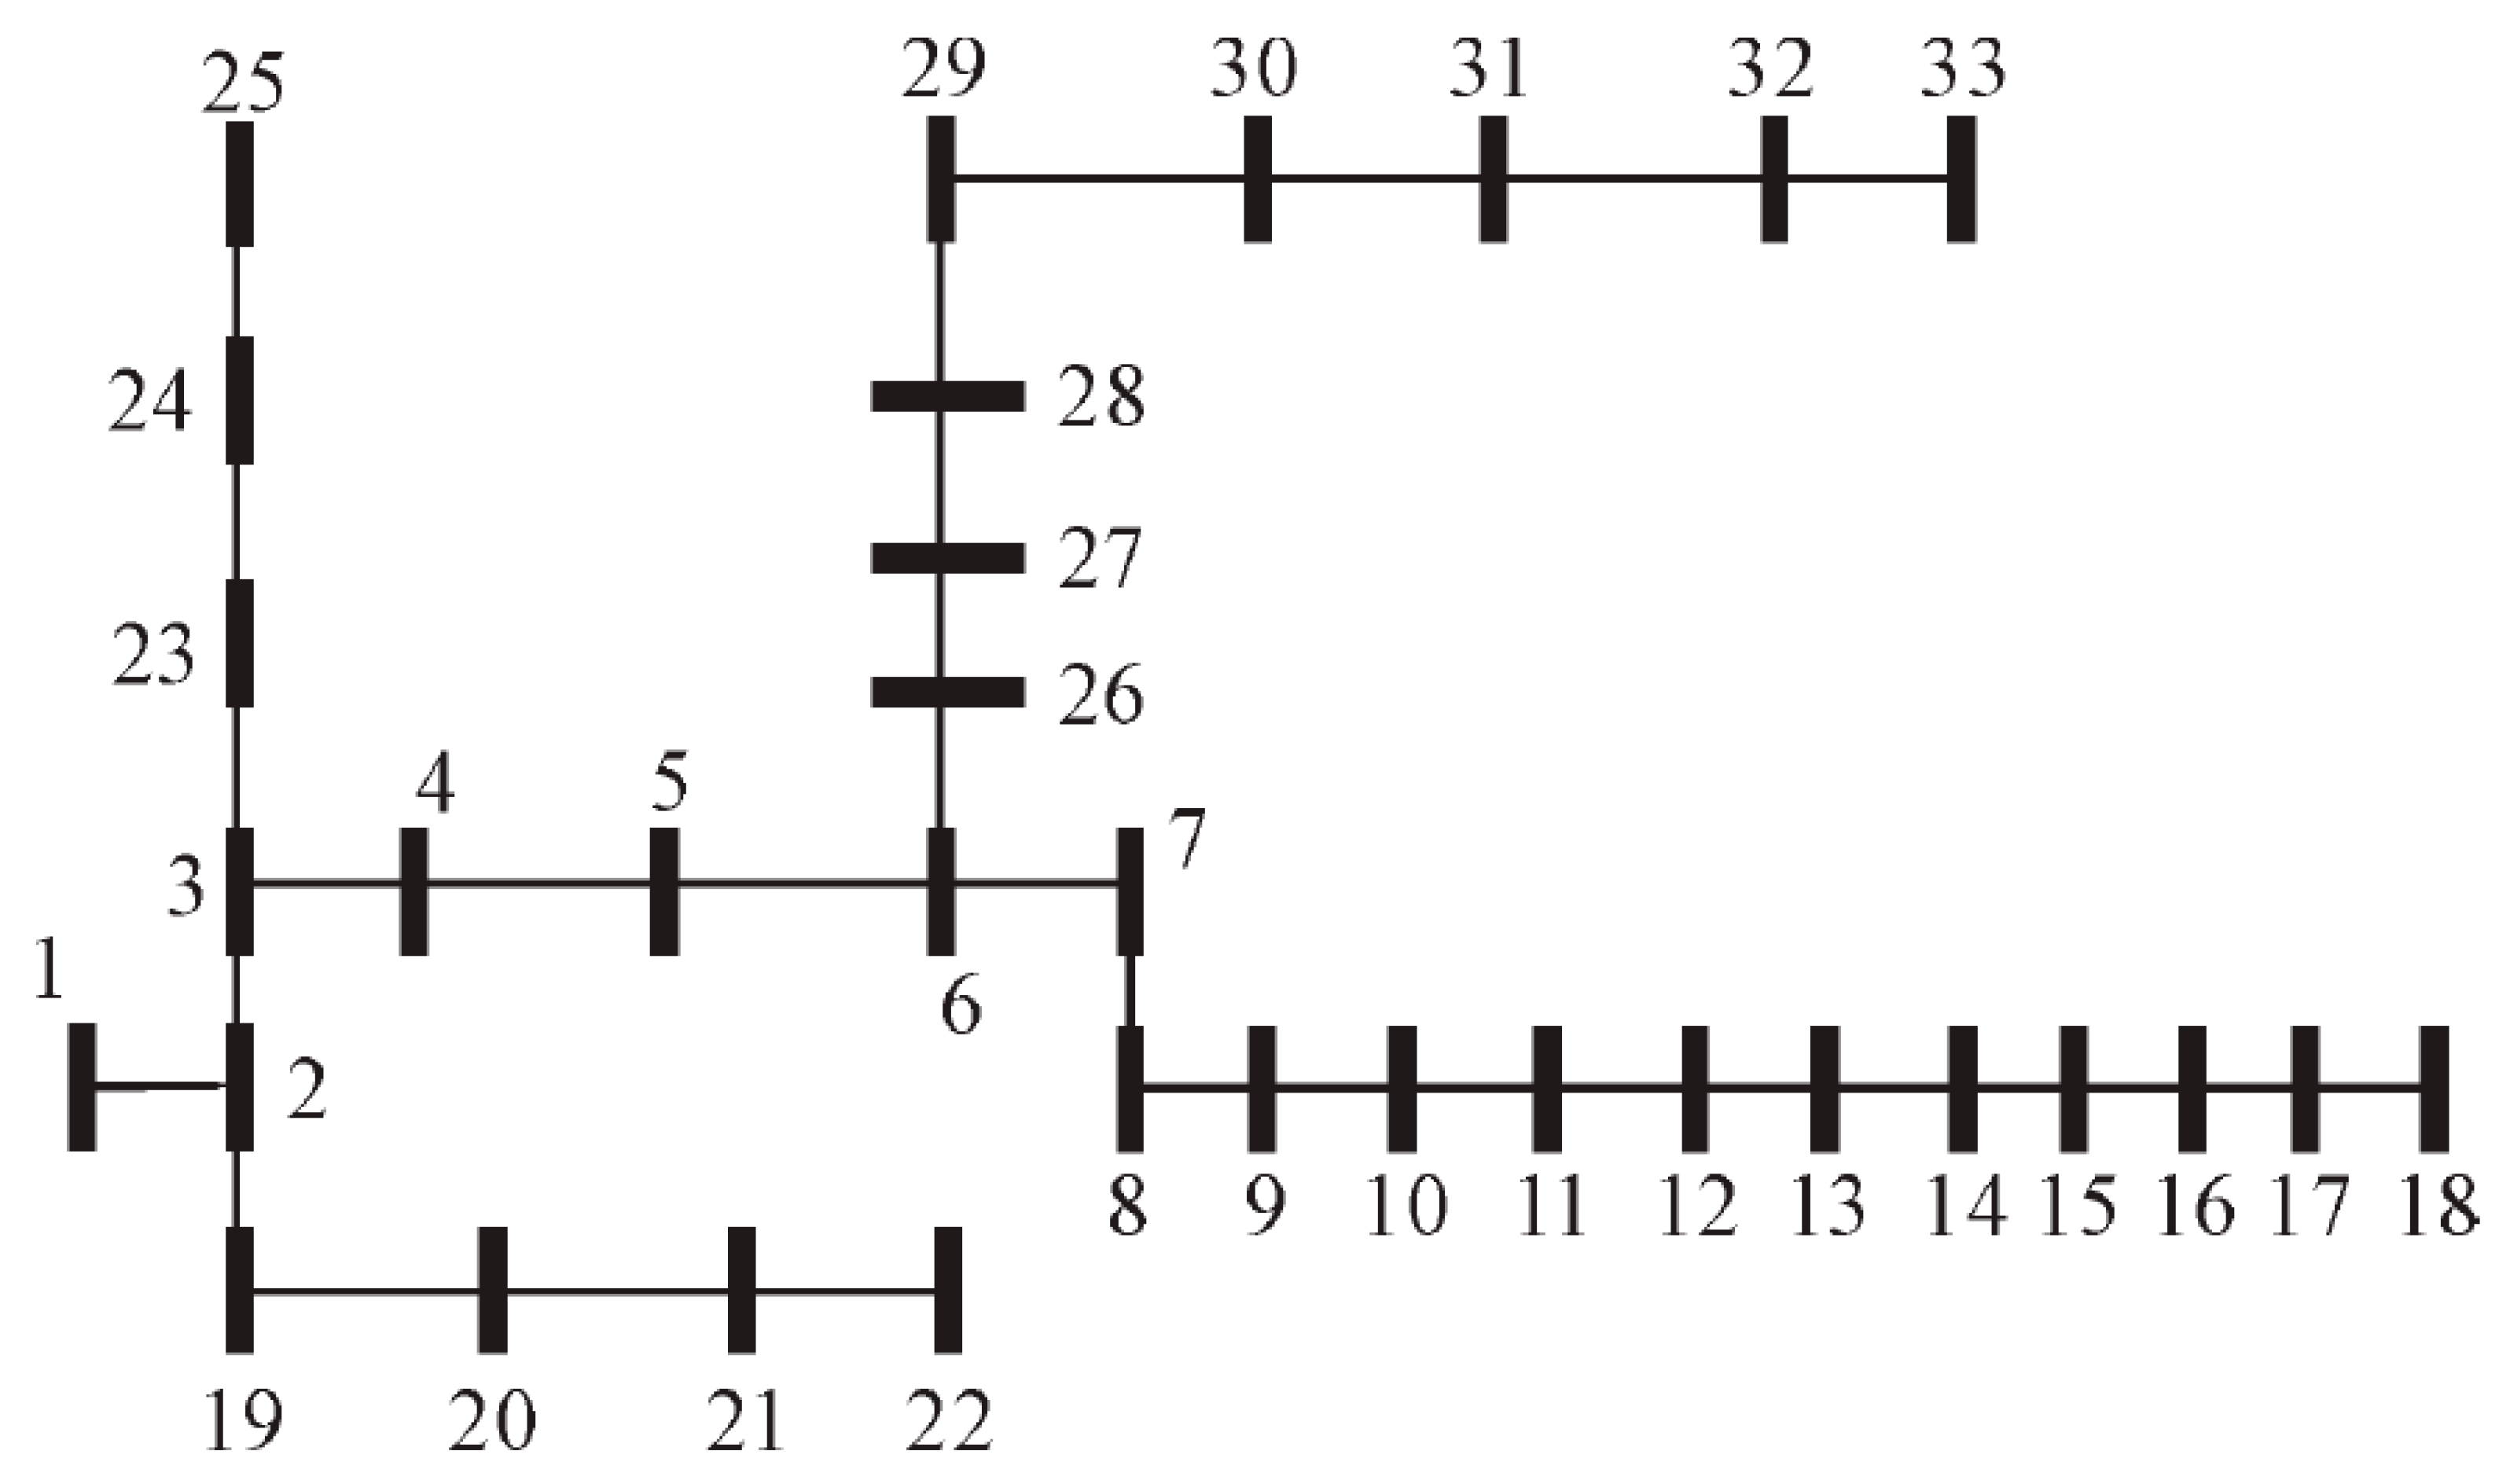
5.3. Distribution Network Model
One example of the IEEE 33-node distribution network standard is shown in Figure 14 [11]. The total active load of the distribution network model is 3.5 MW, the load power factor is 0.9, the busbar rated voltage is 12 KV, the node 1 is the balance node, the other nodes are the nodes, and the feeders are all LGJ-240 standard overhead lines. According to the provisions of GB/T12325-2008 and GB/T12326-2008 [15,16], the constraint of the voltage deviation in the optimization calculation is ±7% and the voltage fluctuation constraint is ±3%.
5.3.1. Voltage Characteristic Analysis
(1) Voltage deviation
When the PV power supply is centrally connected to node 17, the power is available for 1 MW, and the power factor cos is φ = 1, the voltage level of the feeder part node is shown in Table 9.
In Table 9, the node voltage rise is taken as a positive value. It can be seen that the PV power supply has good voltage support capability for the distribution network node, so a reasonable allocation is needed. The access node of the PV power source can be used to improve the voltage distribution of the small-scale power grid.
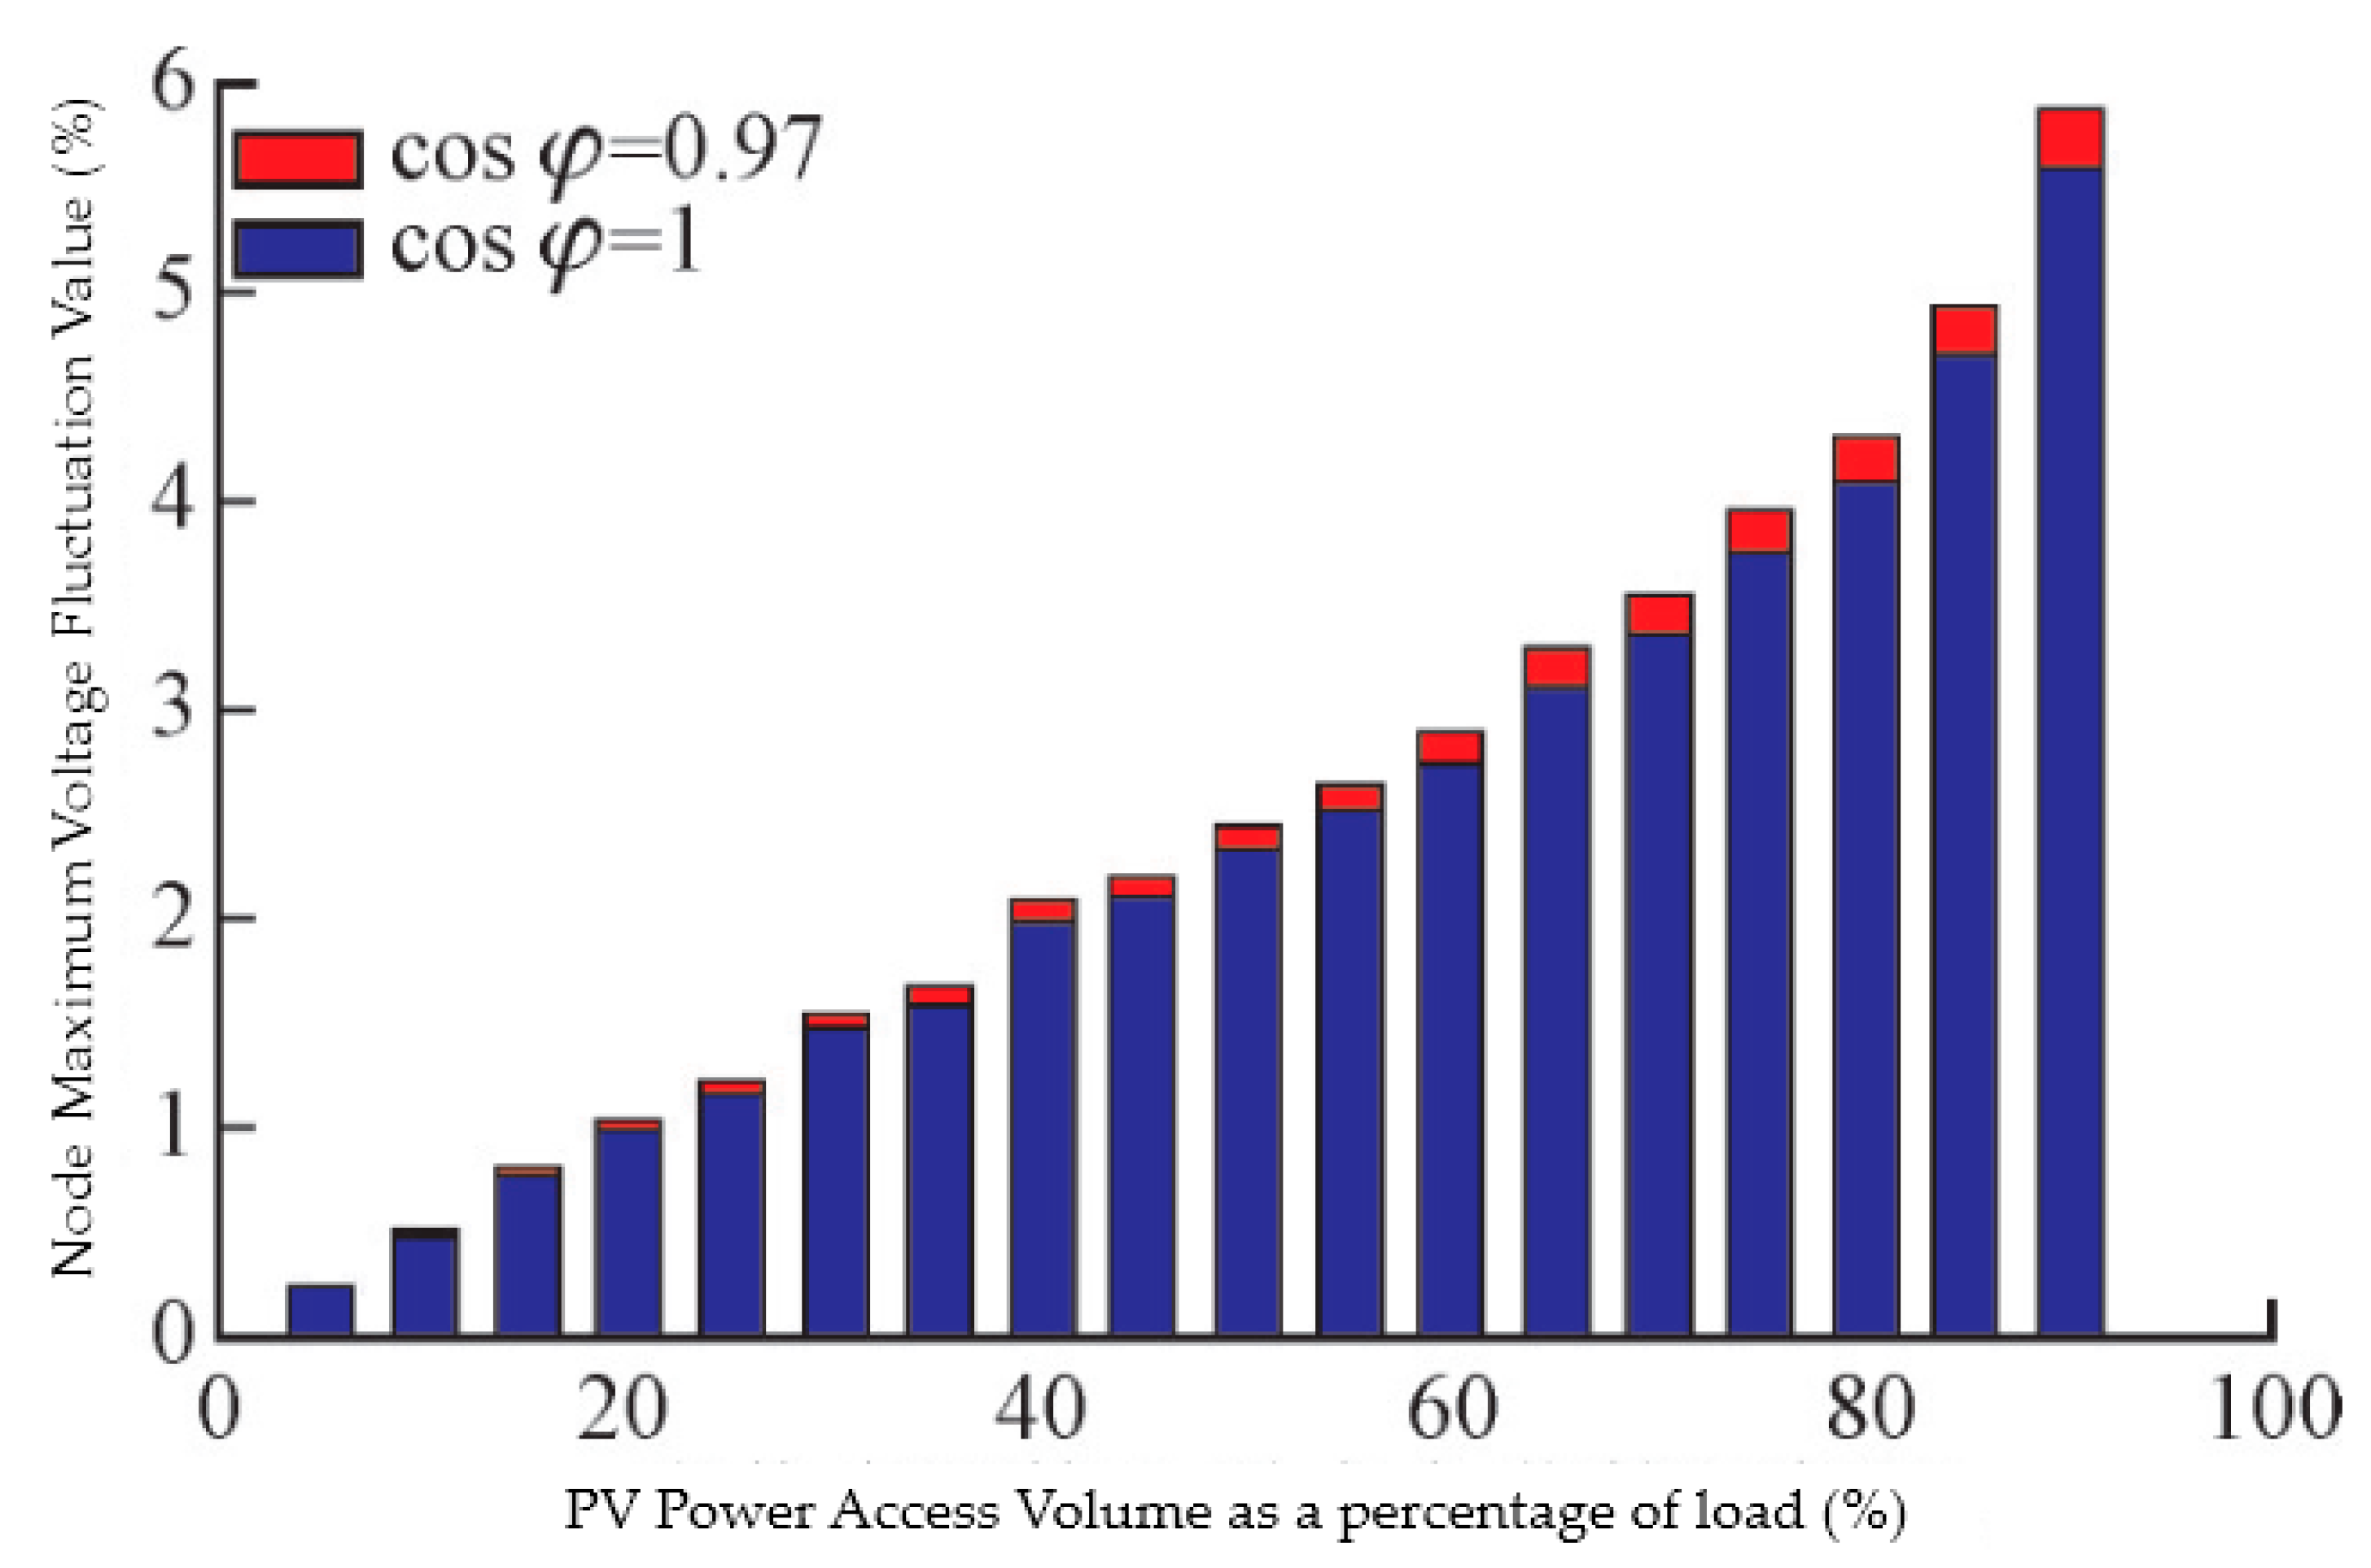
(2) Voltage fluctuations
When the PV power supply is connected to node 17 for = 0.5, the PV power supply can be considered in different power factors of cos φ = 1 and 0.95. The maximum voltage fluctuation value of the node is shown in Figure 15. It can be seen from Figure 15 that as the capacity of the PV power supply to the distribution network increases, the voltage fluctuation value of the feeder node also increases, possibly exceeding the voltage fluctuation limit. At the same time, when the PV power factor is higher, then the reactive power output and the impact on the grid voltage fluctuation become smaller. Therefore, in actual operation, the PV power supply should be operated as a unit of power factor.
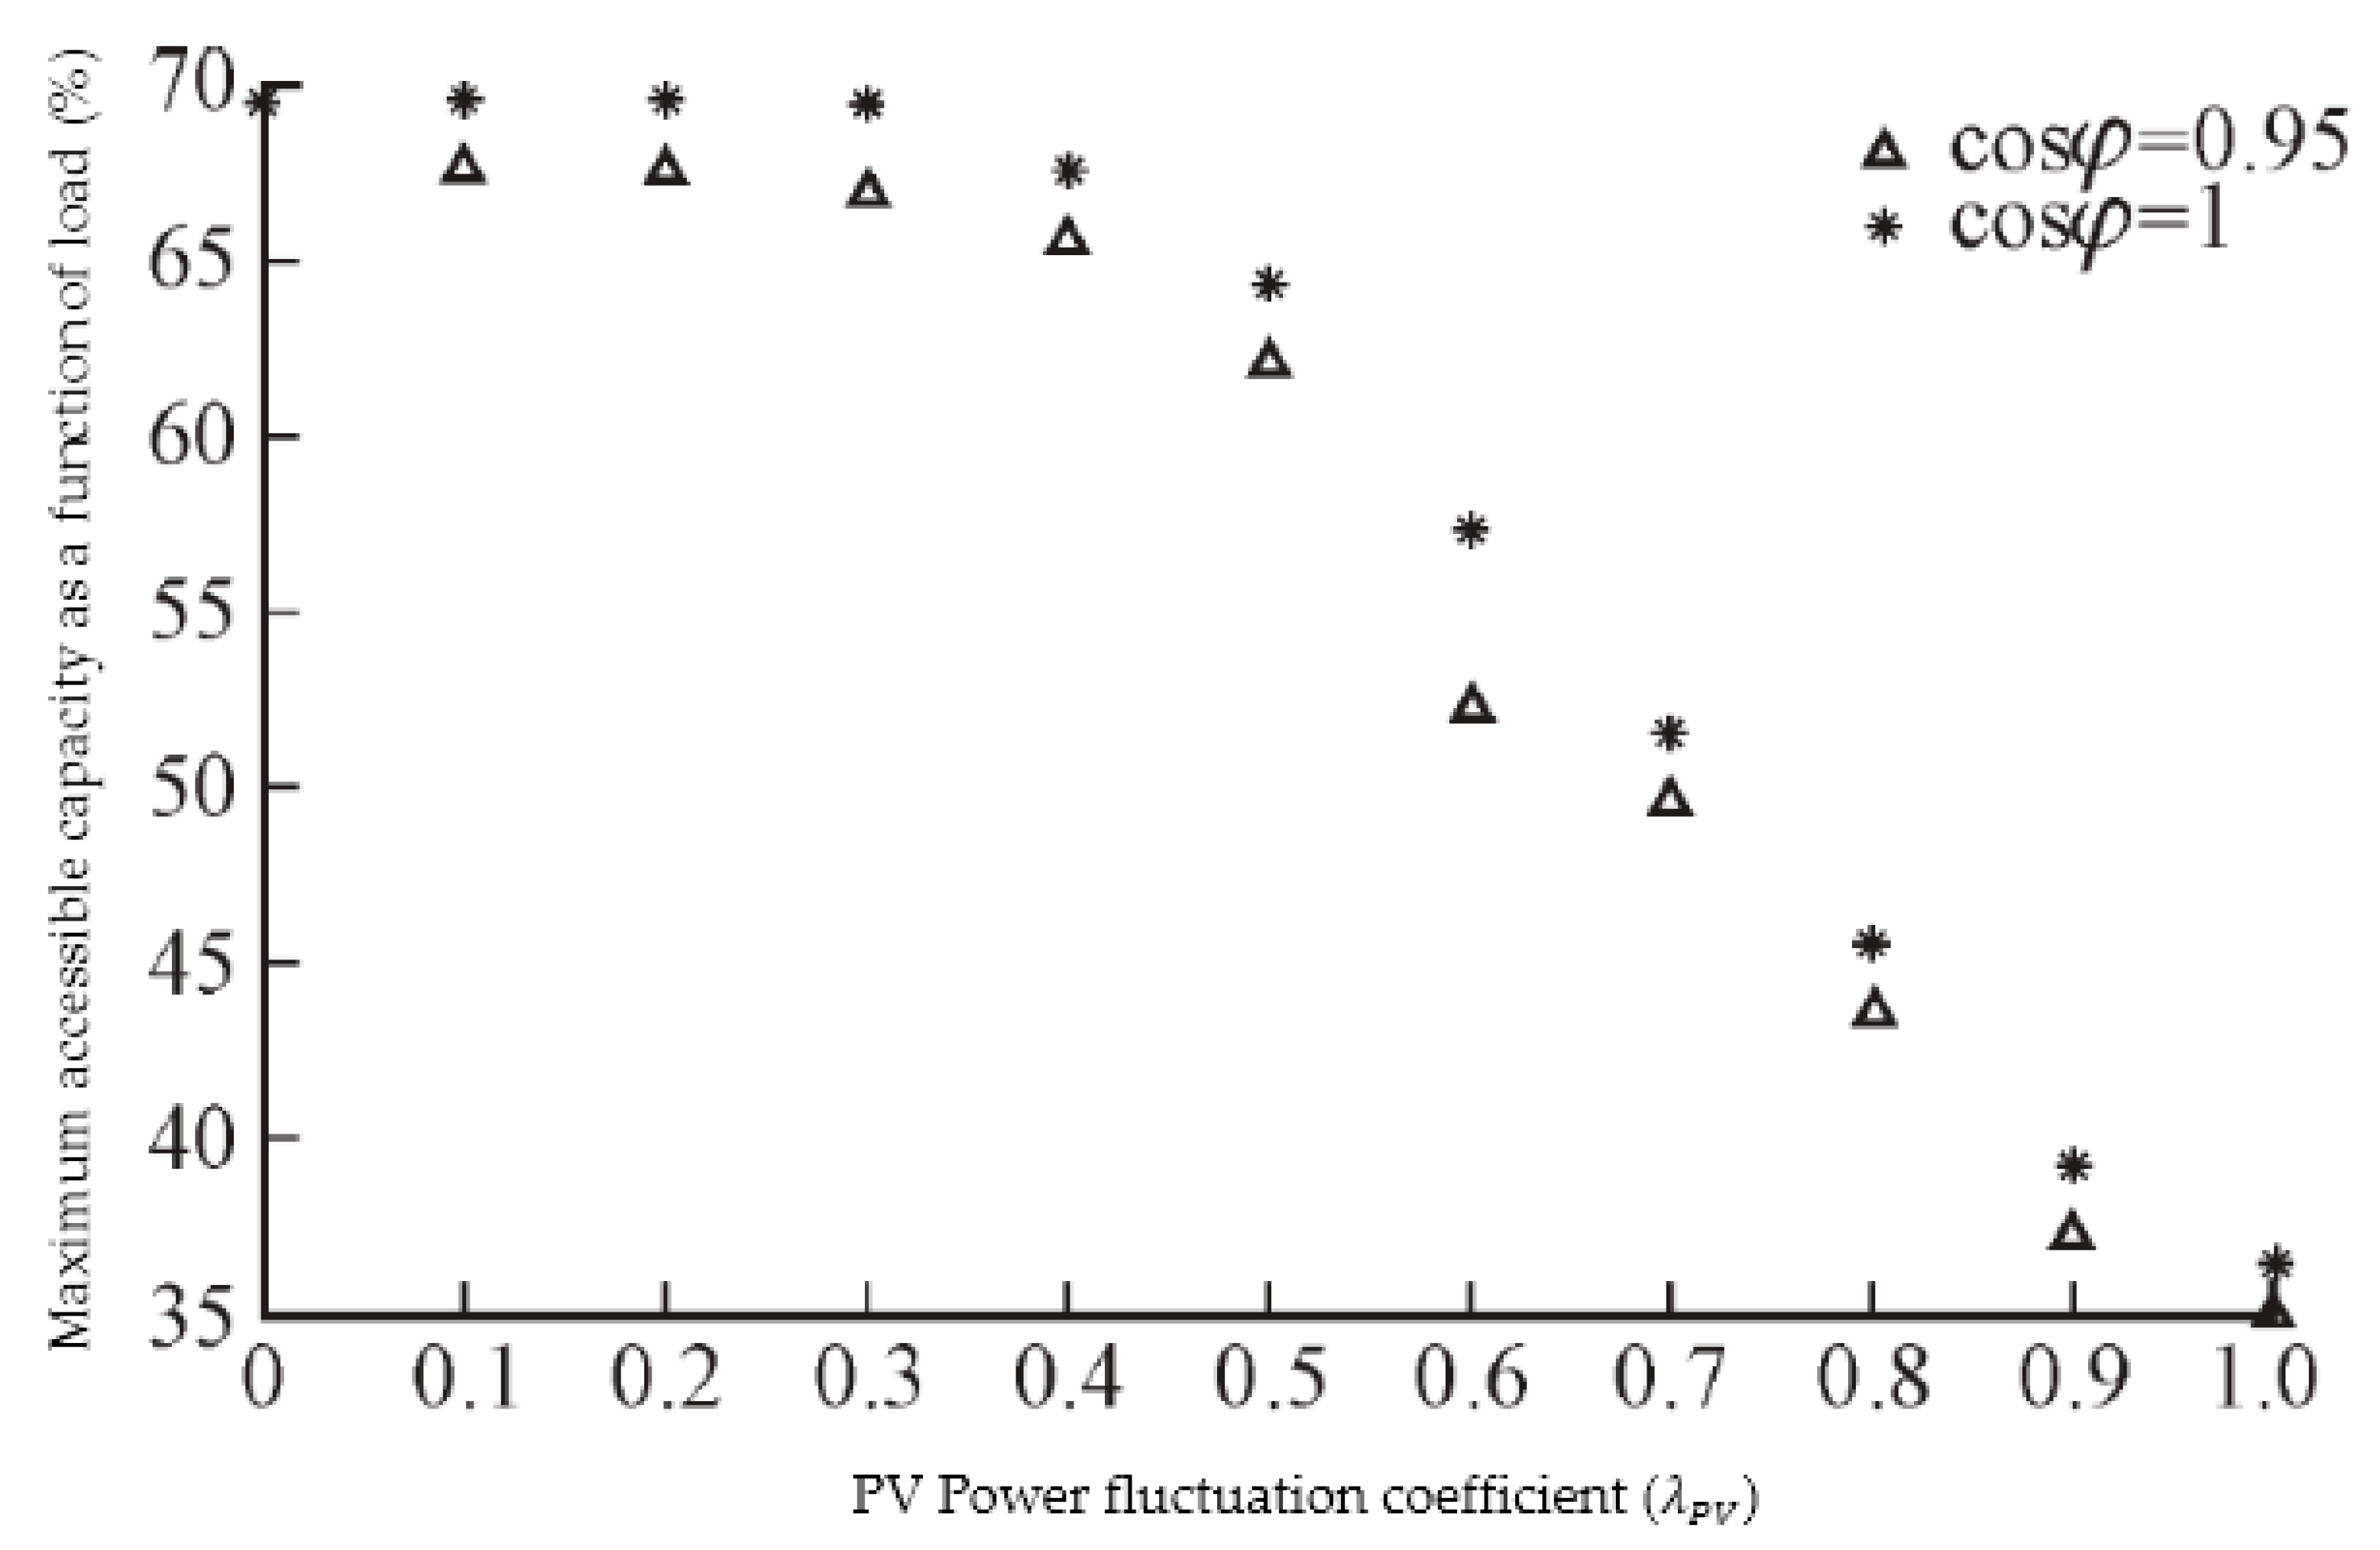
5.3.2. Maximum Accessible Capacity Calculation
To examine the relationship between the fluctuation coefficient value and the constant volume problem of PV power supply access, it is considered that the PV power sources can access 3, 6, 14, 16, 18, 20, 23, 25, 26, and 28 nodes, and the PV power factor cos φ can takes 1 and 0.95. The genetic algorithm is used to optimize the maximum accessible capacity model, and the relationship between the power fluctuation of the PV power source and the maximum accessible capacity is obtained in Figure 16.
It can be seen from Figure 16 that under the same power fluctuation coefficient, the PV power supply access capacity is closely related to the power factor. As the power factor becomes higher, the accessible capacity becomes higher. For the unit power factor cos φ = 1, when the PV power supply power fluctuation coefficient < 0.3, the maximum accessible capacity of DG remains basically unchanged, and the voltage deviation constraint is limited. The main reason for the increase in the capacity of the PV power supply is that the maximum accessible capacity of PV is 2.6148 MW. When the PV power active power fluctuation coefficient ≥ 0.4, the PV power output fluctuation amplitude has a negative correlation with the maximum accessible capacity of the PV. The voltage fluctuation constraint is the main reason for limiting the allowable ratio of the PV power supply.
The optimal access capacity calculation results of each node are listed in Table 10. These results may be installed as the capacity planning of distributed PV power supplies and provide a reasonable decision-making plan. At the same time, according to different power fluctuation coefficients, the optimal accessibility can be calculated for each node of the distribution network, similar to Table 10. Therefore, from these results, an offline optimal access capacity countermeasure tables can be generated, and under different illumination conditions (corresponding to different power fluctuation coefficients), the PV power supply can be used to improve the grid’s ability to dissipate the distributed power.
6. Conclusions
This paper analyzes the large-scale PV access capacity, PV access point, and multi-PV power plant output by probability density distribution, sensitivity analysis, standard deviation analysis, and over-limit probability analysis. The correlation of the PV power plant output from the perspectives of PV access capacity and PV access point, based on the IEEE 14-node system and two provincial-level power grids, are used to produce quantitative research. From the perspective of improving the network loss, the PV access point should take the heavy-duty node. When the PV grid-connected capacity is large, the PV access point should be connected to the high-voltage network and sent out through the low-resistance line. From the perspective of voltage control, it is necessary to choose a strong reactive power adjustment node or to configure an automatic voltage regulator. The simulation experiment was carried out from the examples of the IEEE 33-node distribution network standard, and the following conclusions were obtained: (1) The distributed PV power supply can effectively support the voltage level of the distribution network node, but may cause voltage deviation and voltage fluctuation, which can exceed the limit. (2) The accessible capacity of the PV power sources is closely related to its power fluctuation coefficient. When the output electromagnetic power fluctuation amplitude is small under the same power factor, the voltage deviation is the main factor affecting the accessible capacity. When the fluctuation amplitude is large, the voltage fluctuation index becomes the main influencing factor; at the same time, the power factor of the PV power source can be lowered. (3) According to the optimization model proposed in this paper, the offline maximum access capacity countermeasure table is generated, which provides scientific decision-making schemes for the grid-connected capacity of the PV power sources under different illumination conditions, in order to improve the grid’s consumption of distributed power sources. This paper deploys limited power electronics technologies that have improved on the power efficiency and simple hardware design of the PV standards. Recent trends focus on more efficient and limited power electronics technologies in this field. In the future, various influencing factors should be considered comprehensively, the capacity of PV power plants should be properly allocated, and the ability of the grid to absorb intermittent power sources can be improved, so that centralized large-scale PV power generation can become a reality.
Author Contributions
All of the authors contributed equally to this work.
Funding
This research was funded by the Research Program through the National Research Foundation of Korea grand number NRF-2016R1D1A1B03934653, NRF-2019R1A2C1005920.
Conflicts of Interest
The authors declare no conflict of interest.
References
- Wang, J.; Yang, C.; Liu, F.; Meng, X.; Wang, J.; Liu, J. The development and utilization of new clean energy. In Proceedings of the IEEE International Conference on Power and Renewable Energy, Shanghai, China, 21–23 October 2016; pp. 639–643. [Google Scholar]
- Alsafasfeh, M.; Abdel-Qader, I.; Bazuin, B.; Alsafasfeh, Q.; Su, W. Unsupervised Fault Detection and Analysis for Large PV Systems using Drones and Machine Vision. Energies 2018, 11, 2252. [Google Scholar] [CrossRef]
- Louy, M.; Tareq, Q.; Al-Jufout, S.; Alsafasfeh, Q.; Wang, C. Effect of Dust on the 1-MW Photovoltaic Power Plant at Tafila Technical University. Available online: https://ieeexplore.ieee.org/abstract/document/7926032 (accessed on 20 March 2019).
- Al-Soud, M.S.; Alsafasfeh, Q.H. Economical Evaluation for Various Renewable Energy Products in Jordan. Available online: https://ieeexplore.ieee.org/abstract/document/7110970 (accessed on 20 March 2019).
- Balamurgan, K.; Srinivasan, D. Review of Power Flow Studies on Distribution Network with Distributed Generation. In Proceedings of the IEEE 9th International Conferences on Power Electronics and Drive Systems (PEDS), Singapore, 5–8 December 2011; pp. 411–417. [Google Scholar]
- Xu, M.; Ren, Z.; Xiao, Y.; Bai, Y.; Wen, X.; Zhang, J.; Bo, Z. Influence of distributed generation on distribution system voltage stability. In Proceedings of the 5th International Conference on Electric Utility Deregulation and Restructuring and Power Technologies (DRPT), Changsha, China, 26–29 November 2015; pp. 2352–2355. [Google Scholar]
- Liu, L.; Zhao, Y.; Zhang, T.Y. Study on Influence of Inserted PV Power Station to Voltage Distributing of Distribution Network. In Proceedings of the IEEE Innovative Smart Grid Technologies—Asia (ISGT Asia), Tianjin, China, 21–24 May 2012; pp. 21–24. [Google Scholar]
- Lucas, A. Single-Phase PV Power Injection Limit due to Voltage Unbalances Applied to an Urban Reference Network Using Real-Time Simulation. Appl. Sci. 2018, 8, 1333. [Google Scholar] [CrossRef]
- Liu, W.; Xu, H.; Niu, S.; Xie, J. Optimal Distributed Generator Allocation Method Considering Voltage Control Cost. Sustainability 2016, 8, 193. [Google Scholar] [CrossRef]
- Limsakul, C.; Songprakorp, R.; Sangswang, A.; Parinya, P. Impact of PV grid-connected power fluctuation on system frequency deviation in contiguous power systems. In Proceedings of the IECON 2015—41st Annual Conference of the IEEE Industrial Electronics Society, Yokohama, Japan, 9–12 November 2015; pp. 3236–3241. [Google Scholar]
- Swief, R.A.; Salam, T.S.A. PV impact on distribution system performance following the grey wolf algorithm. In Proceedings of the Nineteenth International Middle East Power Systems Conference (MEPCON), Cairo, Egypt, 19–21 December 2017; pp. 437–444. [Google Scholar]
- Bayer, B.; Matschoss, P.; Thomas, H.; Marian, A. German experience with integrating PV systems into the low-voltage grids. Renew. Energy 2018, 119, 129–141. [Google Scholar] [CrossRef]
- Freitas, S.; Santos, T.; Brito, M.C. Impact of large scale PV deployment in the sizing of urban distribution transformers. Renew. Energy 2018, 119, 767–776. [Google Scholar] [CrossRef]
- Guo, L.; Bai, H. Method for Determining the Maximum Allowable Capacity of Wind Farm Based on Box Set Robust Optimization. Math. Probl. Eng. 2015, 2015, 790974. [Google Scholar] [CrossRef]
- El-Mubarak, Y.S.; Ponnambalam, K. Stochastic Analysis of a Local Distribution Company Voltage Profile Under Uncertain Energy Supply from a PV System. In Proceedings of the 7th International Conference on the European Energy Market, Madrid, Spain, 23–25 June 2010; pp. 1–7. [Google Scholar]
- Conti, S.; Raiti, S. Probabilistic Load Flow for Distribution Networks with PV Generators Part 1: Theoretical Concepts and Models. In Proceedings of the International Conference on Clean Electrical Power, Capri, Italy, 21–23 May 2007; pp. 132–136. [Google Scholar]
- Rodriguez, F.J.R.; Hernandez, J.C.; Jurado, F. Probabilistic Load Flow for Radial Distribution Networks with PV Generators. IET Renew. Power Gener. 2012, 6, 110–121. [Google Scholar] [CrossRef]
- Zhang, Z.; Li, G.; Wang, S.; Wang, J.; Wang, Z. Stochastic Evaluation of Voltage in Distribution Networks Considering the Characteristic of Distributed Generators. In Proceedings of the 4th International Conference on Electric Utility Deregulation and Restructuring and Power Technologies, Weihai, China, 6–9 July 2011; pp. 1132–1137. [Google Scholar]
- Anandraj, J.E. Point Estimate Method of Load Flow for Distribution Network with PV Generators. In Proceedings of the International Conference on Energy-Efficient Technologies for Sustainability, Nagercoil, India, 10–12 April 2013; pp. 24–29. [Google Scholar]
- Parhizi, S.; Lotfi, H.; Khodaei, A.; Bahramirad, S. State of the Art in Research on Microgrids: A Review. IEEE Access 2015, 3, 890–925. [Google Scholar] [CrossRef]
- Ren, Z.Y.; Yan, W.; Zhao, X. Probabilistic Power Flow for Distribution Networks with PV Generators. In Proceedings of the IEEE Power and Energy Society General Meeting, Vancouver, BC, Canada, 21–25 July 2013; pp. 1–5. [Google Scholar]
- Dong, L.; Lao, L.; Yang, Y.; Luo, J. Probabilistic Load Flow Analysis Considering Power System Random Factors and their Relevance. In Proceedings of the Asia—Pacific Power and Energy Engineering Conference, Wuhan, China, 23–28 March 2011; pp. 1–4. [Google Scholar]
- Zhang, X.; Guo, Z.; Chen, W. Probabilistic Power Flow Method Considering Continuous and Discrete Variable. Energies 2017, 10, 590. [Google Scholar] [CrossRef]
- Ahadi, A.; Aval, S.M.; Hayati, H. Generation capacity adequacy evaluation of large-scale, grid-connected PV systems. J. Front. Energy 2016, 10, 308–318. [Google Scholar] [CrossRef]
- Da Silva, A.M.; Sales, W.S.; da Fonseca Manso, L.A.; Billinton, R. Long-Term Probabilistic Evaluation of Operating Reserve Requirements with Renewable Sources. IEEE Trans. Power Syst. 2010, 25, 106–116. [Google Scholar] [CrossRef]
- Deng, X.; He, J.; Zhang, P. A Novel Probabilistic Optimal Power Flow Method to Handle Large Fluctuations of Stochastic Variables. Energies 2017, 10, 1623. [Google Scholar] [CrossRef]
- Blaauwbroek, N.; Nguyen, P.; Slootweg, H. Data-Driven Risk Analysis for Probabilistic Three-Phase Grid-Supportive Demand Side Management. Energies 2018, 11, 2014. [Google Scholar] [CrossRef]
- Ren, Z.; Li, W.; Billinton, R.; Yan, W. Probabilistic Power Flow Analysis Based on the Stochastic Response Surface Method. IEEE Trans. Power Syst. 2016, 31, 2307–2315. [Google Scholar] [CrossRef]
- Alsafasfeh, Q.; Saraereh, O.A.; Khan, I.; Kim, S. LS-Solar-PV System Impact on Line Protection. Electronics 2019, 8, 226. [Google Scholar] [CrossRef]
- Liu, J.; Hao, X.; Cheng, P.; Fang, W.; Niu, S. A Parallel Probabilistic Load Flow Method Considering Nodal Correlations. Energies 2016, 9, 1041. [Google Scholar] [CrossRef]
- Staffel, L.; Pfenninger, S. The increasing impact of weather on electricity supply and demand. Energy 2018, 145, 65–78. [Google Scholar] [CrossRef] [Green Version]
- Abdelaziz, A.Y.; Hegazy, Y.G.; El-Khattam, W.; Othman, M.M. A Multi-Objective Optimization for sizing and placement of voltage-controlled Distributed Generation using Supervised Big Bang-Big Crunch Method. TF Electr. Power Compon. Syst. 2014, 43, 105–117. [Google Scholar] [CrossRef]
- Hossain, E.; Tür, M.R.; Padmanaban, S.; Ay, S.; Khan, I. Analysis and Mitigation of Power Quality Issues in Distributed Generation Systems Using Custom Power Devices. IEEE Access 2018, 6, 16816–16833. [Google Scholar] [CrossRef]
- Yu, W.; Liu, D.; Huang, Y. Operation Optimization Based on the Power Supply and Storage Capacity of an Active Distribution Network. Energies 2013, 6, 6423–6438. [Google Scholar] [CrossRef] [Green Version]
- Rasmussen, T.B.; Guangya, Y.A.; Nielsen, A.H.; Zhaoyang, D.O. Effects of centralized and local PV plant control for voltage regulation in LV feeder based on cyber-physical simulations. J. Mod. Power Syst. Clean Energy 2018, 6, 979–991. [Google Scholar] [CrossRef]
- Aziz, T.; Ketjoy, N. PV Penetration Limits in Low Voltage Networks and Voltage Variations. IEEE Access 2017, 5, 16784–16792. [Google Scholar] [CrossRef]
- Liu, S.; Bi, T.; Liu, Y. Theoretical Analysis on the Short-Circuit Current of Inverter-Interfaced Renewable Energy Generators with Fault-Ride-Through Capability. Sustainability 2017, 10, 44. [Google Scholar] [CrossRef]
- Laowanitwattana, J.; Uatrongjit, S. Probabilistic power flow analysis based on arbitrary polynomial chaos expansion for networks with uncertain renewable sources. IEEJ Trans. Electr. Electron. Eng. 2018, 13, 1754–1759. [Google Scholar] [CrossRef]
- Liang, H.; Zhuang, W. Stochastic Modeling and Optimization in a Microgrid: A Survey. Energies 2014, 7, 2027–2050. [Google Scholar] [CrossRef]
- Ndawula, M.B.; Djokic, S.Z.; Gil, J.H. Reliability Enhancement in Power Networks under Uncertainty from Distributed Energy Resources. Energies 2019, 12, 531. [Google Scholar] [CrossRef]
- Tobón, A.; Peláez-Restrepo, J.; Villegas-Ceballos, J.; Serna-Garcés, S.; Herrera, J.; Ibeas, A. Maximum Power Point Tracking of PV Panels by Using Improved Pattern Search Methods. Energies 2017, 10, 1316. [Google Scholar] [CrossRef]
- Li, J.; Xu, H.; Zhao, H.; Peng, Y. Dynamic Modelling and Simulation of the Grid-Connected PV Power Station. In Proceedings of the International Conference on Smart City and Systems Engineering (ICSCSE), Hunan, China, 25–26 November 2016; pp. 346–349. [Google Scholar]
- Cai, L.; Dai, N.; Tan, Z. Research on a mathematical model and calculation simulation of wireless sensor solar cells in the Internet of Things. Eurasip J. Wirel. Commun. Netw. 2018, 2018, 116. [Google Scholar] [CrossRef]
Figure 1.
Steady state model of the solar photovoltaic (PV) power system.

Figure 2.
PV cell array structure.

Figure 3.
Single-index equivalent model of the PV cells.

Figure 4.
Probabilistic power flow calculation process with PV.

Figure 5.
Sequence adjustment algorithm flow.

Figure 6.
PV distribution system model.

Figure 7.
Flowchart for integration capacity determination.

Figure 8.
Institute of Electrical and Electronics Engineers (IEEE) 14-node system.

Figure 9.
Probability density function analysis for node 5 versus per unit (p.u) voltage amplitude.

Figure 10.
Node voltage probability density function for different buses versus per unit (p.u) voltage amplitude.
Figure 10.
Node voltage probability density function for different buses versus per unit (p.u) voltage amplitude.

Figure 11.
Network loss expectation of systems under different PV access points.

Figure 12.
Influence of different correlation coefficients on system branch currents.

Figure 13.
The voltage difference between nodes.

Figure 14.
IEEE 33-node standard system deployment.

Figure 15.
Impact of PV power on voltage fluctuation.

Figure 16.
Distributed PV power system maximum accessible capacity versus power fluctuation coefficient.
Figure 16.
Distributed PV power system maximum accessible capacity versus power fluctuation coefficient.


Table 1.
Photovoltaic (PV) cell characteristic parameter table.
| Parameter | Value |
|---|---|
| (A) | 4.9 |
| (V) | 43.2 |
| (A) | 4.51 |
| (V) | 34.4 |
| 0.0025 | |
| 0.0005 | |
| 0.00288 |
Table 2.
PV power plant light intensity distribution parameters.
| PV Power Station | Region | Light Intensity Beta Distribution Parameter | |
|---|---|---|---|
| PV1 | Pak-Power Plant | 0.7155 | 1.8612 |
| PV2 | Liberty Power Plant | 0.5416 | 1.4527 |
| PV3 | Quaid-e-Azam Power Plant | 0.6332 | 1.7952 |
Table 3.
Influence of PV access capacity on the probability of branch flow exceeding the limit.
| Branch | PV Access Capacity (MW) | |||||||
|---|---|---|---|---|---|---|---|---|
| 80 | 90 | 100 | 110 | 120 | 130 | 140 | 150 | |
| 3–4 | 0.37 | 0.40 | 0.44 | 0.47 | 0.50 | 0.52 | 0.54 | 0.56 |
| 9–10 | 0.20 | 0.24 | 0.28 | 0.31 | 0.34 | 0.37 | 0.40 | 0.42 |
| 9–14 | 0.00 | 0.00 | 0.00 | 0.01 | 0.02 | 0.03 | 0.05 | 0.07 |
Table 4.
Power flow of each branch for the node 4 injection power sensitivity (relative value).
| Branch | Sensitivity Coefficient |
|---|---|
| 1–2 | −0.0044 |
| 2–3 | −0.0021 |
| 2–5 | −0.0048 |
| 4–5 | −0.0082 |
| 4–9 | −0.0008 |
| 6–11 | −0.0028 |
| 6–13 | −0.0006 |
| 7–9 | 0.0008 |
| 9–14 | 0.0015 |
| 12–13 | −0.0017 |
| 1–5 | −0.0046 |
| 2–4 | −0.0057 |
| 3–4 | 0.0065 |
| 4–7 | 0.0008 |
| 5–6 | −0.0008 |
| 6–12 | −0.0004 |
| 7–8 | 0.0000 |
| 9–10 | 0.0040 |
| 10–11 | −0.0052 |
| 13–14 | −0.0023 |
Table 5.
PV access points and grid-connected capacity (MW).
| PV Grid Connection | Grid Capacity |
|---|---|
| PV1 [9] | 150 |
| PV2 [13] | 450 |
| PV3 [29] | 300 |
| PV4 [34] | 600 |
Table 6.
PV power plant output correlation coefficient setting.
| (a) High correlation | ||||
| Spearman Correlation Coefficient | PV1 | PV2 | PV3 | PV3 |
| PV1 [9] | 1.0000 | 0.8167 | 0.8078 | 0.7476 |
| PV2 [13] | 0.8167 | 1.0000 | 0.8116 | 0.7566 |
| PV3 [29] | 0.8078 | 0.8116 | 1.0000 | 0.7302 |
| PV4 [34] | 0.7476 | 0.7566 | 0.7302 | 1.0000 |
| (b) Moderate correlation | ||||
| Spearman Correlation Coefficient | PV1 | PV2 | PV3 | PV3 |
| PV1 [9] | 1.0000 | 0.4886 | 0.4280 | 0.3226 |
| PV2 [13] | 0.4886 | 1.0000 | 0.4720 | 0.4001 |
| PV3 [29] | 0.4280 | 0.4720 | 1.0000 | 0.3242 |
| PV4 [34] | 0.3226 | 0.4001 | 0.3242 | 1.0000 |
| (c) Low correlation | ||||
| Spearman Correlation Coefficient | PV1 | PV2 | PV3 | PV3 |
| PV1 [9] | 1.0000 | 0.0939 | 0.0495 | 0.0106 |
| PV2 [13] | 0.0939 | 1.0000 | 0.0627 | −0.0019 |
| PV3 [29] | 0.0495 | 0.0627 | 1.0000 | 0.0289 |
| PV4 [34] | 0.0106 | −0.0019 | 0.028 | 1.0000 |
Table 7.
Maximum voltage drops at node.
| Node | |
|---|---|
| 4291 | 0.0800 |
| 4337 | 0.0769 |
| 785 | 0.0769 |
| 538 | 0.0774 |
| 4338 | 0.0769 |
| 783 | 0.0766 |
Table 8.
PV limit access capacity for different bus types (MW).
| Bus Type | Maximum Grid Capacity |
|---|---|
| Active Reative Power (PQ) | 90 |
| PV-to-PQ | 120 |
| PV | 195 |
Table 9.
Partial node voltage deviation value.
| Node | Voltage Deviation (p.u.) |
|---|---|
| 1 | 0.000 |
| 3 | 0.005 |
| 5 | 0.012 |
| 7 | 0.017 |
| 9 | 0.021 |
| 11 | 0.031 |
| 13 | 0.037 |
| 15 | 0.041 |
| 17 | 0.042 |
| 18 | 0.042 |
| 19 | 0.001 |
| 21 | 0.002 |
| 23 | 0.002 |
| 25 | 0.006 |
| 27 | 0.013 |
| 29 | 0.019 |
| 31 | 0.018 |
| 33 | 0.018 |
Table 10.
PV power system optimal accessible capacity at each node ().
| Node | Installed Capacity (MW) |
|---|---|
| 3 | 0.2237 |
| 6 | 0.2435 |
| 14 | 0.1923 |
| 16 | 0.1835 |
| 18 | 0.1263 |
| 20 | 0.1633 |
| 23 | 0.1752 |
| 25 | 0.5362 |
| 26 | 0.1343 |
| 28 | 0.1604 |
© 2019 by the authors. Licensee MDPI, Basel, Switzerland. This article is an open access article distributed under the terms and conditions of the Creative Commons Attribution (CC BY) license (http://creativecommons.org/licenses/by/4.0/).
Share and Cite
MDPI and ACS Style
Alsafasfeh, Q.; Saraereh, O.A.; Khan, I.; Kim, S. Solar PV Grid Power Flow Analysis. Sustainability 2019, 11, 1744. https://doi.org/10.3390/su11061744
AMA Style
Alsafasfeh Q, Saraereh OA, Khan I, Kim S. Solar PV Grid Power Flow Analysis. Sustainability. 2019; 11(6):1744. https://doi.org/10.3390/su11061744
Chicago/Turabian StyleAlsafasfeh, Qais, Omar A. Saraereh, Imran Khan, and Sunghwan Kim. 2019. "Solar PV Grid Power Flow Analysis" Sustainability 11, no. 6: 1744. https://doi.org/10.3390/su11061744
Note that from the first issue of 2016, this journal uses article numbers instead of page numbers. See further details here.