Highlights
- (1)
Analyzing the present situation and spatial correlation of SO2 in 30 provinces of Chinese mainland.
- (2)
Conducting a research on the influencing factors of environmental pollution based on the extended STIRPAT model and Spatial econometric model.
- (3)
Analyzing the impact of seven socioeconomical factors and seven policy tools on air pollution.
- (4)
Selecting environmental regulatory tools and constructing the supervision mechanism.
1. Introduction
With the accelerated development of industrialization and urbanization processes, air pollution has become a global problem, which has seriously affected the life and health of human beings. In May 2015, the World Health Organization unanimously adopted a resolution on air pollution and health, calling for the inclusion of health issues into national, regional and local policies on air pollution. According to the latest report issued by WHO, there is a high concentration of pollutants in the air breathed by 9 in every 10 people around the world. Air pollution is not only an environmental issue but also a social problem. Like many other public problems, air pollution will hinder national economic and social development [
1]. While accelerating industrialization, developing countries are facing more severe environmental problems, especially in developing countries with large populations, such as China and India. In recent years, China’s air pollution has become very serious, and needs to greatly improve for the sustainable development of the economy and society. However, China is a country with vast territory and numerous provinces. The geographical characteristics, social and economic development levels and spatial distribution of cities are obviously different. Air pollution in different provinces and regions also has certain differences [
2]. In economically developed areas, such as the Beijing–Tianjin–Hebei region, Yangtze River Delta region, Pearl River Delta region and Shandong urban agglomeration, fine particulate matter, ozone and other atmospheric environment problems are very prominent. These complex pollution areas are identified as key control areas. With this in mind, it is necessary and meaningful to study the spatial and temporal distribution characteristics, as well as the influencing factors and supervision mechanisms relating to atmospheric pollution in various provinces of China.
Since the beginning of the 21st century, the Chinese government has paid highly attention to the problem of controlling air pollution. The Law on the Prevention and Control of Atmospheric Pollution, revised April 29, 2000, established a variety of regulatory means at the legal level. In 2007, in the Eleventh Five-Year Plan for Environmental Protection, the control target for sulfur dioxide emissions of major atmospheric pollutants was determined. At the end of 2008 and 2010, the implementation of the “planning” stage was evaluated in an interim and the final assessment, and the assessment and results were taken as an important part of evaluating the performance of local peoples’ governments at all levels. In 2012, China’s State Council approved the Twelfth Five-Year Plan for the Law on the Prevention and Control of Atmospheric Pollution in Key Areas, setting out 13 key areas for the prevention and control of air pollution. The work of prevention and control of air pollution has gradually transformed from the target-oriented total control of air pollution, to the target-oriented improvement of environmental quality. This planning takes into account the air pollutant transmission characteristics and ambient air quality in the region, and establishes the control targets of sulfur dioxide, nitrogen oxides, industrial smoke dust and other air pollutants combined with administrative divisions and urban space distribution.
In June 2013, the State Council of China determined 10 measures to prevent and control air pollution, including reducing pollutant discharge; the strict control of newly increased energy consumption (EC) in industries with high energy consumption and high pollution; the vigorous promotion of clean production; speeding up the adjustment of energy structures; strengthening the constraint of the energy conservation and environmental protection index; the implementation of a new mechanism for energy conservation and emission reductions with both incentives and constraints; and an increase in the collection of pollutant discharge fees. In September 2013, the State Council issued the Action Plan for Atmospheric Pollution Prevention to establish the control objectives of inhalable particles (PM10) and fine particles (PM2.5). They encouraged macro planning in the aspects of improving laws and regulations, improving environmental supervision capacity, strengthening environmental information disclosure, and so on. As a result, it is of great significance to study the effects of various regulations and their control over different pollutants. Since 2006–2015 was the implementation period of China’s Eleventh Five-Year Plan (2006–2010) and Twelfth Five-Year Plan (2011–2015), during which China’s economy entered a stage of rapid development, the strength of environmental supervision gradually increased. Therefore, this paper will use the panel data of 2006–2015 to analyze the time-space distribution characteristics of air pollutants in 30 provinces of China, and study the effectiveness of various supervision modes. This research will not only grasp the evolution trend of atmospheric pollution in various regions of China, but also provide some suggestions for the future of pollution control work.
2. Literature Review
2.1. Air Pollution and Its Influencing Factors
There have been many studies on the status of atmospheric pollution by scholars in the past, but there are few studies on its influencing factors. What’s more, it is mainly energy consumption and social economic factors that are studied. He et al. conducted a regression analysis on panel data to explore the impact of urbanization on industrial SO
2 emissions and found that, compared with rural areas, the air pollution in small- and medium-sized cities is more serious, and urbanization is a major factor that aggravates air pollution [
3]. Guan et al. found that population density was significantly related to smoke and dust in East China, India, North America and North Africa [
4]. Li and Sun used a STIRPAT model to study the atmospheric pollution situation in Beijing from 1990 to 2013, and through empirical analysis they found that social and economic factors such as population, urbanization and industry structure have an impact on atmospheric pollutants [
5]. Yang et al. studied the impact of energy consumption, energy structure, and treatment technology on SO
2 based on the LMDI decomposition method [
6]. Generally speaking, there are two common research methods for studying the factors that influence air pollution: the STIRPAT method and the LMDI method. Tursun H. et al. used these two methods respectively to study the influencing factors such as population, affluence and technology on industrial COD and SO
2, they found that the analysis results of the two methods were consistent, water pollution and air pollution were both influenced by population, economic development and technical progress [
7]. Previous scholars have paid more attention to population, urbanization, economic development, technical progress and other social economic factors during the analysis of influencing factors, whereas few scholars pay attention to government supervision (GR) factors. In a centralized country like China, environmental pollution control is under strong supervision of the government. Therefore, it is very necessary to study the impact of environmental regulation tools on atmospheric pollution. In this context, this paper will comprehensively analyze the influence of economic and social factors and government supervision factors on atmospheric pollution by expanding the STIRPAT model.
2.2. Classification of Government Supervision and Its Governance Effect
The government carries out environmental regulation through a very diverse set of tools. Environmental regulatory tools can be divided into three types: economic incentives, legal tools and information tools [
8]. Huang et al. [
9] divided environmental regulation tools into three types: command control (CC) type, market incentive (MI) type and public participation (PP) type. Michael [
10] divides the tools of environmental regulation into four types: information environmental regulation (persuasive environmental regulation), cooperative environmental regulation, regulatory environmental regulation and economic environmental regulation. Wang [
11] classifies environmental regulation tools into four types: command control type, market incentive type, public participation type and voluntary action type. The command control tool refers to the direct management and compulsory supervision of the production behavior by the state administration department through the formulation and implementation of relevant standards. For example, the production conditions of an enterprise must be shut down if the production conditions are not up to the relevant national sewage technical standards. If investment project design standards do not meet the national basic environmental protection technical standards, a permit to start construction will be denied. The market incentive tool provides explicit economic incentives that charge or subsidize the promotion of enterprises forced to choose between the cost and income of pollution discharge independently, and to determine the level of production technology and the amount of sewage discharge based on those incentives. The tools of public participation are mainly focused socially on public opinion, moral pressure, persuasion and other measures to indirectly promote the implementation and enforcement of relevant environmental laws and regulations and technical standards. Voluntary action tools mainly refer to a series of voluntary environmental protection actions used to reduce the consumption and waste of natural resources in production and daily life by the enterprises of residents and civil organizations according to their own understanding of sustainable development. Different environmental regulatory tools have different mechanisms. The command control environmental regulation tool has the characteristics of easy operation, quick effect and so on, but the implementation cost is relatively high [
12]. Malueg et al. [
13] found that market-oriented environmental regulation tools can avoid information asymmetry and reduce regulatory costs. Tietenberg [
14] believes that the establishment of emission trading systems can encourage enterprises to reduce emissions and achieve good governance outcomes.
In Chinese mainland, laws and legislations are the top-level macro regulatory tools. The Environmental Protection Law 2014 (EPL) makes up for the earlier inadequacy of China’s environmental public-interest litigation (ENVPIL). In recent years, a number of rules and regulations have been made by the State Council and local NPC and government [
15]. Command and control tools mainly include the environmental standard system, “three simultaneity” project, emissions permit system and so on. Market incentive tools mainly include punitive measures for imposing fines for polluting and positive incentives for compensating and subsidizing ecological and environmental protection projects. Public participation tools include the release of environmental monitoring information by the government, the conduct of public hearings to listen to public opinions and the public themselves through letters and visits, social media and other ways to reflect their environmental needs [
16]. The resource action tools mainly include the standard environmental management system, which is sponsored by social public welfare organizations and industry associations, such as the environmental label, the ISO14000 environmental management system certification and so on. In processing environmental controls, the Chinese government has also invested a lot of manpower, material resources and financial resources directly, so the investment in environmental control will also directly affect the change of air pollution [
17]. In addition, the CPPCC and NPC, as two political organizations with Chinese characteristics, will also play an important role in the process of environmental governance [
18]. Therefore, this paper will focus on the impact of environmental governance investment, command control, market incentives, public participation, legal regulation, political advice (PA), third-party supervision (TS) and other environmental regulatory tools.
In recent years, coal has remained the top energy consumption method in China, meaning that air pollutants are mainly dust and SO2. Due to the great harm of SO2, the Assessment Method for Emissions Reduction of Major Pollutants was issued as early as the data were available to support it (in 2007). The Chinese government has increased the task of reducing SO2 emissions in the assessment of environmental protection in each province. Therefore, of all atmospheric pollutants, SO2 is under the strongest government supervision. In this context, this paper takes SO2 emissions as an index by which to measure atmospheric pollution, and studies it as a dependent variable.
To sum up, in the process of analyzing the factors that influence air pollution, this paper extends the model of IPAT. On the basis of analyzing population, affluence and level of technology (PAT), seven social and economic factors and seven government regulation factors were added to the model. This variable model is shown in
Figure 1.
3. Research Design
3.1. Descriptive Statistics Method
Descriptive statistics is the method of summarizing data from a sample using indexes such as the mean or standard deviation. In this paper, we will calculate the mean, standard deviation, minimum and maximum values of SO
2 emissions in each province firstly. In accordance with the convention, 30 provinces are divided into eastern, central and western regions [
2], and the mean, standard deviation, minimum and maximum values of each region are calculated.
3.2. Exploratory Spatial Data Analysis (ESDA)
A geographical or economic attribute value of one region is generally related to the same attribute value of its adjacent region. Spatial autocorrelation analysis using the exploratory spatial data analysis (ESDA) method can quantitatively measure the correlation of air pollution in each region following the spatial evolution process. This mainly includes global spatial autocorrelation analysis, as well as local spatial autocorrelation analysis. The global Moran’s I index can reflect the average spatial correlation degree of air pollutants in each province. The formula is as follows:
In this formula,
,
, N represents the number of provinces,
represents the SO
2 emissions in each province,
is an element of the spatial weight matrix, representing the geographical relationship between two provinces (if the two regions are adjacent, then the
value is 1, otherwise the
value is 0). In this paper, the nearest K-point relation method is used to determine the spatial weight and the K value is 4, which ensures that each province has at least one adjacent region [
19]. The range of Moran’s I index is [−1,1]. Moran’s I < 0 indicates that there is a negative spatial correlation between air pollution in different provinces. When Moran’s I > 0, it indicates that there is a positive spatial correlation, while Moran’s I = 0 indicates that there is no spatial correlation. In this paper, the significance level of the global Moran’s I index is measured by measuring the standardized Z value. The formula is as follows:
Where E (I) and VAR (I) represent the expected value and variance of Moran’s I index, respectively. Because the critical value of the normal distribution function is 1.96 at 0.05 level, if |Z| ≥ 1.96 and p < 0.05, there is significant spatial autocorrelation between regions. If |Z| ≥ 2.58 and p < 0.01, there is a significant spatial autocorrelation between the regions.
The local spatial autocorrelation analysis is to further reveal the correlation degree and distribution pattern of air pollution in the local spatial position. In this paper, the local index (local indicator of spatial association, of spatial relation. LISA) is used to measure the spatial concentration of air pollution in each province and its surrounding provinces [
20], and the local Moran’s I scatter plot is drawn with the help of Geoda software. The formula is
Where X represents the amount of SO
2 emissions from each province. The positive value of
indicates that the pollution level of the province is similar to that of the neighboring province (when the value is “high–high” (H–H) or “low–low” (L–L)). If
is negative, it indicates that the pollution situation of the province is not similar to that of the neighboring province (“high–low” (H–L) or “low–high” (L–H)). The scatter diagram of Moran’s I consists of four quadrants, which correspond to the four partial spatial connection forms between one space unit and its adjacent units. The first quadrant is the H–H quadrant, indicating that the surrounding areas are provinces with serious water pollution. The second quadrant is the L–H quadrant, which means that provinces with a low pollution degree are surrounded by provinces with a high pollution degree. The third quadrant is the L–L quadrant, indicating that the surrounding areas are provinces with a low pollution degree. The fourth quadrant is the H–L quadrant, which means provinces with a high pollution degree are surrounded by provinces with a low pollution degree (
Table 1).
3.3. Extension of STIRPAT Model
The IPAT identity has been widely used to measure the effects of population growth, economic development and scientific and technological progress on environmental pressure [
21]. Using the original IPAT model, Dietz and Rosa [
22] constructed a stochastic regression-influencing factor model of environmental pressure, the STIRPAT model, with the following formula:
where
I represents environmental pressure (impact, which in this paper is measured by the amount of SO
2 emissions),
P denotes population,
A represents the degree of economic development (affluence) and
T represents the level of technology.
i and
t represent provinces and years, respectively,
a is the coefficient of the equation;
b,
c and
d are the exponents of population, affluence and technology, respectively; and
is the error term. In this paper, socioeconomic (SE) factors and government supervision (GR) factors are added to the STIRPAT model to extend and improve the model. The expression can be written as
For the extended STIRPAT model, Formula (6) is used to log the two sides of Formula (5). Among them,
is the random error item,
is a constant term, and
,
, …,
are elastic coefficients representing the change in SO
2 emissions caused by each unit of change in various influential factors.
In the process of spatial metrological analysis, social and economic factors include: total energy consumption (EC), industrial development level (ID), industrial structure (IS), urbanization level (UL), foreign direct investment (FDI), fixed assets investment (FAI) and market degree (MD). Government regulatory factors include: environmental governance input (input), command control (CC), market incentive (MI), public participation (PP), law regulation (law), political advice (PA) and third-party supervision (TS). The codes and measurements of the research variables are listed in
Table 2 below. The figures are extracted from the official statistics yearbooks published by the Chinese government.
4. Data Analysis Results
4.1. Temporal–Spatial Characteristics of Atmospheric Pollution
Table 3 shows the province with the largest emissions is Shandong, while the province with the smallest emissions is Hainan. Both provinces are located in the eastern region, but the difference of the average value of emissions over the 10-year period is very large—Shandong is 59 times that of Hainan. In the western region, the highest amount of emissions are from Inner Mongolia, and the lowest from Qinghai, with the mean difference between them 1,248,300 tons. In the central region, the largest discharge is Henan and the smallest is Jilin, with the mean difference of the two being 973,900 tons. On the whole, the average value of SO
2 emissions in the eastern region is the smallest, followed by the average value in the western, the average value in central regions is the largest. However, the standard deviation of the eastern region is much larger than that of the western and central regions, which indicates that there are obvious differences in the emissions of provinces in the eastern region. According to the calculation, the overall average value of the 30 provinces in China is 732,800 tons, and the overall standard error of the whole country is larger than that of the western and central regions, and less than that of the eastern region, which further shows that the difference among the provinces in the eastern regions is the most obvious.
Figure 2 shows the overall change trend of SO
2 emissions in each province during 2006–2015, which is consistent with the province codes used in
Table 3 (1 represents Beijing, 2 represents Tianjin...30 represents Xinjiang). In terms of quantity, there is an obvious difference in the amount of emissions from each province. From the perspective of the time-change trend, SO
2 emissions in most provinces showed a fluctuating trend towards decline. This indicates that, on the whole, China’s air pollution treatment is still effective and SO
2 emissions are effectively being controlled. However, the evolution trend of atmospheric pollution in different provinces and regions in China has some spatial heterogeneity. This requires us to further carry out spatial correlation analysis to know whether the air pollution in each province is geographically related, and to analyze the influencing factors so as to provide targeted countermeasures and suggestions for future management and supervision work. In some provinces, SO
2 emissions reveal a sharp decrease in 2010, and a sharp increase in 2011. This is probably because 2010 was the last year of the Eleventh Five-Year Plan and 2011 was the first year of the Twelfth Five-Year Plan [
23]. The year 2010 was the last of China’s central government realizing “Eleventh Five-Year” energy conservation and emission reduction targets. Some provinces have made great efforts to reduce SO
2 emissions in order to achieve the assessment objectives.
4.2. Spatial Correlation Analysis of Atmospheric Pollution
4.2.1. Global Spatial Autocorrelation Analysis
Geoda software was used to conduct global spatial autocorrelation analysis of SO
2 emissions in 30 provinces, and the global Moran’s I index of each year was obtained as shown in
Table 4. On the whole, the global Moran’s I index is positive, which indicates that air pollution in all provinces of China showed obvious positive spatial correlations from 2006 to 2015. That is, areas with high pollution degrees and areas with high pollution degrees gathered together in space. Space dependence and spillover effects are very obvious. The value and significance of the global Moran’s I in these 10 years decreases year by year, which indicates that the degree of the spatial set gradually decreases.
4.2.2. Local Spatial Autocorrelation Analysis
Figure 3 is the Moran scatter diagram of SO
2 emissions in 2006 and 2015. The picture shows that most of China’s provinces are located in the first quadrant (H–H) and the third quadrant (L–L). This indicates that the SO
2 emissions of most provinces in China show similar characteristics with their neighboring provinces. The provinces with a high degree of air pollution are surrounded by the neighboring provinces with large amounts of SO
2 emissions, and the provinces with low degrees of air pollution are often surrounded by neighboring provinces with small amounts of SO
2 emissions. As the number of provinces in the first and third quadrant was reduced, the degree of aggregation also decreased gradually, which is consistent with the analysis results in
Table 3.
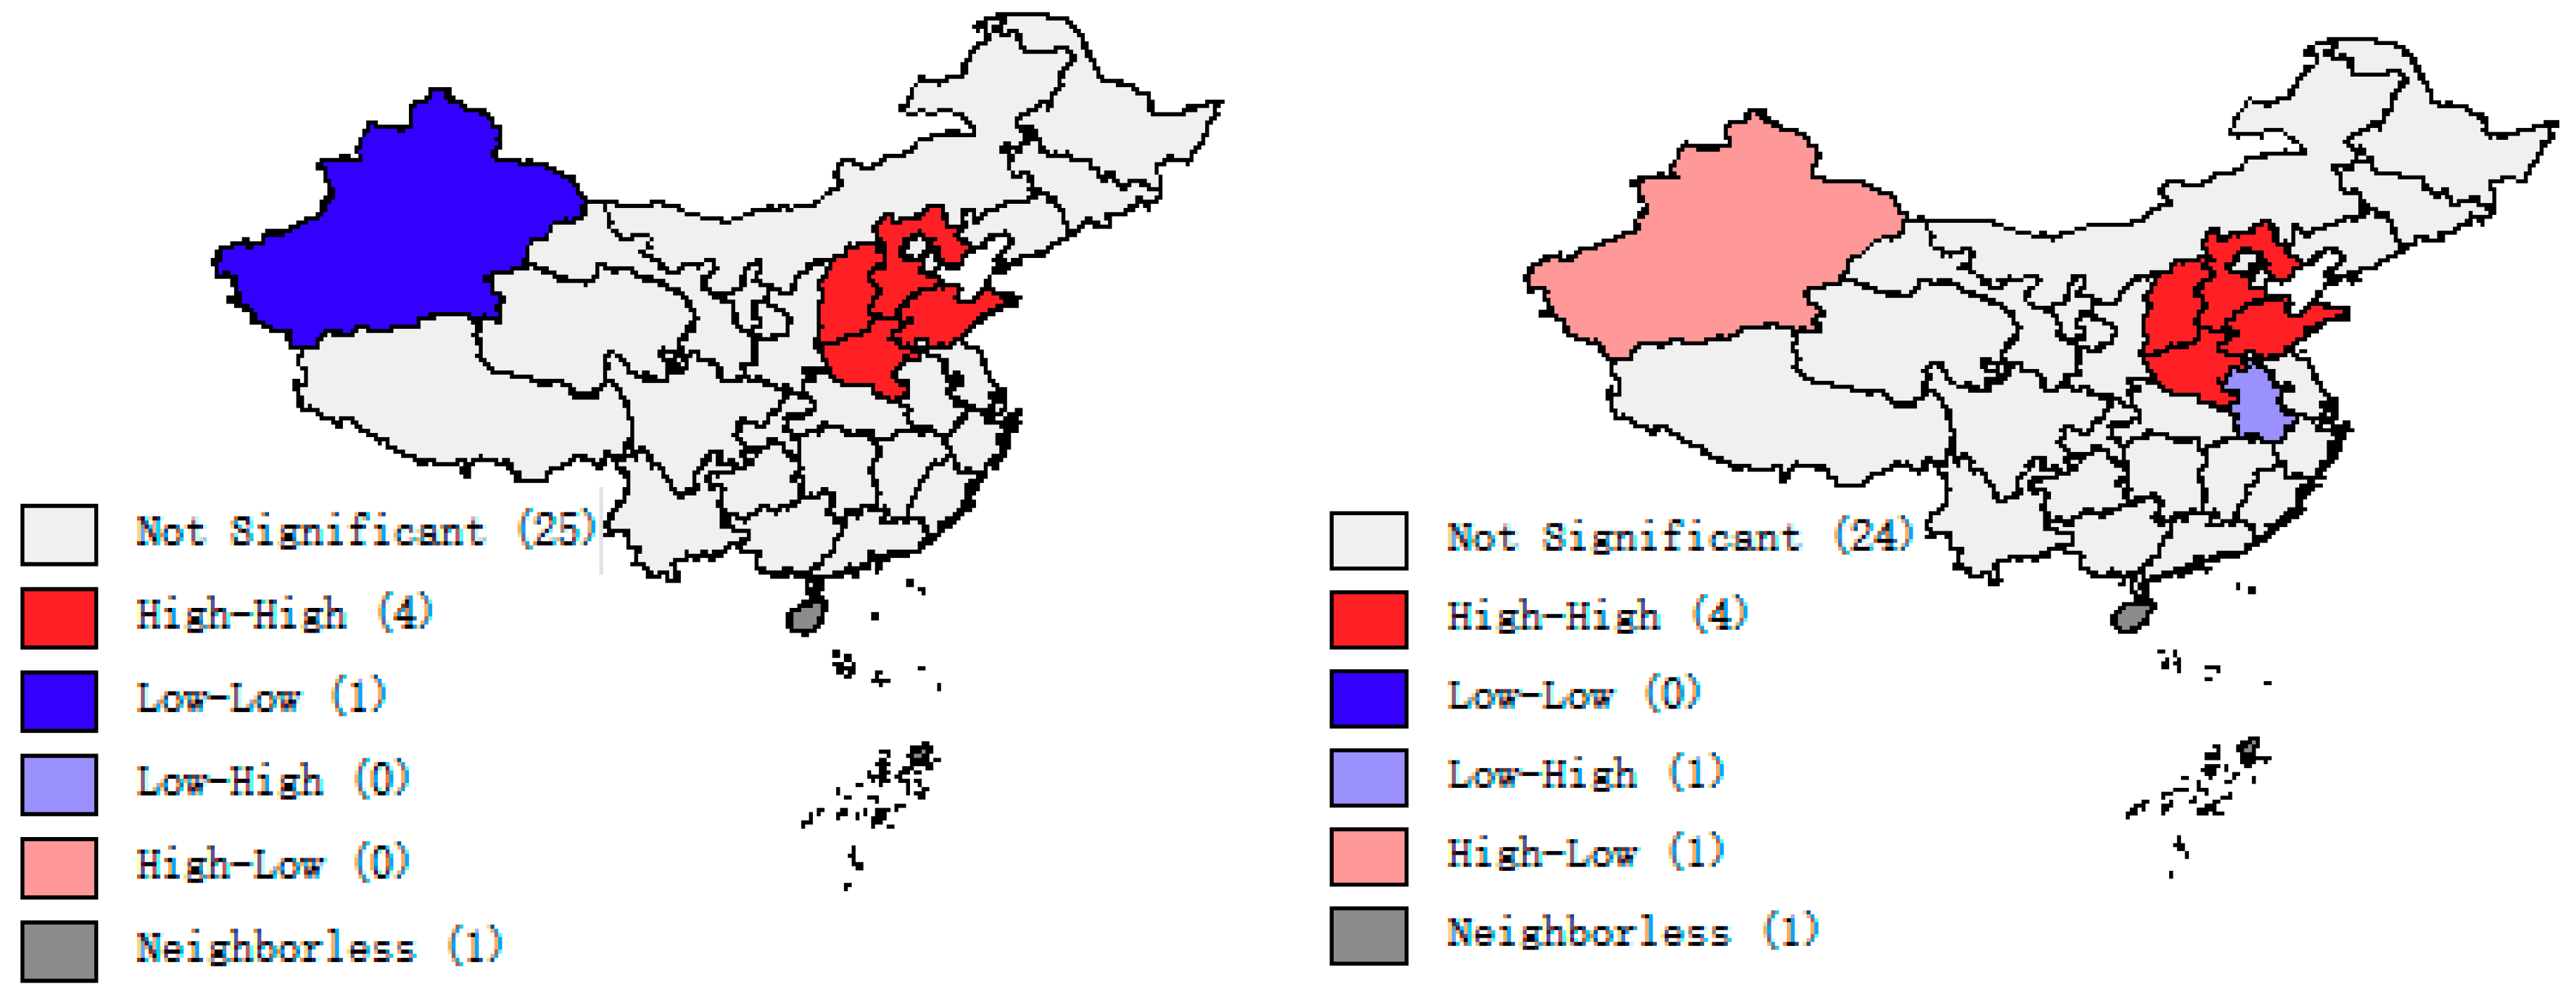
Figure 4 reflects the space–time transition matrices of air pollution in 2006 and 2015. In 2006 and 2015, the same four provinces showed significant H–H agglomeration, namely Shandong, Hebei, Henan and Shanxi. These provinces are located in the eastern and central regions, where there are a large number of urban populations and industrial bases. The rapid development of industry, the increase in people’s living needs and the massive use of coal and other fuels have all led to severe atmospheric pollution. In 2006, Xinjiang showed remarkable L–L type agglomeration characteristics, and its air pollution level was relatively low compared with the surrounding provinces, but in 2015 it showed a significant H-L characteristic, at which time its air pollution level was higher than the surrounding provinces. This phenomenon has a strong correlation with Xinjiang’s economic development, energy development and industrialization. Xinjiang has developed rapidly in recent years and its energy consumption is dominated by traditional fossil energy, which has led to an increase in atmospheric pollution. In 2006, there was no L–H type of province, but by 2015, Anhui Province showed significant L–H characteristics, indicating that the air pollution in Anhui Province was well controlled.
4.3. Influencing Factors and the Effectiveness of Various Supervisory Methods
There is a significant spatial autocorrelation in air pollution in 30 provinces and regions as shown in the results of the exploratory spatial data analysis (ESDA). Therefore, in the process of analyzing influencing factors, the traditional panel data regression analysis method is not used in this paper, and more-suitable spatial measurement models are adopted—the spatial lag model (SLM) and the spatial error model (SEM). Firstly, a Hausman test is carried out with Stata software, and the result P = 0.347, so the stochastic effect model cannot be rejected. In a spatial dependency test, if Lm-error is more statistically significant than Lm-lag, and Robust Lm- error is significant Robust Lm-lag, the spatial error model should be used. Conversely, then the spatial lag model should be used. The spatially correlated Lagrange multiplier (LM) test results in
Table 5 show that Lm-lag was significant, Lm-error was not significant, Robust Lm-lag was significant and Robust Lm- error was not significant. Therefore, the SLM model is more appropriate than SEM model.
In this paper, the SLM model is used to analyze the influencing factors of air pollution. The estimated results are shown in
Table 6. The value of the spatial lag model is positive and significant, which shows that the spatial dependence and the positive spatial spillover effect of air pollution is formed in China. Empirical results show that both population and economic development lead to an increase in SO
2 emissions, and that technology can effectively reduce them, but that the significance and coefficient of economic development are higher than the technical level. This shows that China’s current technological progress has not been able to effectively eliminate air pollution in the process of economic development. Among the seven socioeconomic factors, energy consumption, industrial development level, industrial structure, urbanization level and marketization level all have significant positive effects on SO
2 emissions. The significance of industrial development level, industrial structure, urbanization is higher than that of energy consumption and marketization. This indicates that the process of industrialization and urbanization will continue to accelerate the extent of atmospheric pollution.
Among the seven government supervision factors, only the investment amount of environmental governance, three-simultaneous project qualification rate, amount of the enterprise pollutant discharge fee and quantity of local environmental protection laws and regulations have significant negative impacts on SO2 emissions, which indicates that only environmental investment, command control means. market incentive supervision tools and legal regulation are obvious to the treatment effect of air pollution at present, but the other three supervision methods do not have significant effects. The obvious supervision method of administrative control is higher than that of the market incentive mode, which means that China’s air pollution treatment is always dependent on strong governmental intervention. Public participation and third-parties still have weak power, so the impact on air pollution control is not obvious. There is no significant impact on the number of environmental protection proposals by the NPC and CPPCC, because many environmental protection proposals can’t be substantially responded and replied to, and some good suggestions can’t be implemented. It can be seen that China’s air pollution control is mainly promoted by the government using powerful administrative means, while the public’s power has not been effectively exerted.
5. Conclusion, Discussion and Environmental Supervision Mechanism Construction
- (1)
China’s air pollution shows obvious positive spatial correlation, so it is necessary to establish regional cooperative governance mechanism.
Although there are some differences in air pollution among different provinces in China, SO2 emissions and space–time variation in each province have their own characteristics. Yet, on the whole there are strong spatial overflow effects and spatial accumulation characteristics. In areas with high industrial output value, the “high contamination–high contamination” aggregation characteristic is shown, and in areas with low industrial output value, the “low contamination–low contamination” aggregation characteristic is shown. Therefore, it is necessary to carry out environmental controls according to the current situation of air pollution in each province and region, and to focus on constructing regional cooperative control systems. In areas with heavy pollution, treatment should be intensified so as to prevent the spread of air pollution to other areas. Emphasis should be placed on strengthening cooperation among provinces and establishing an effective mechanism for competition and cooperation.
- (2)
Air pollution is closely related to various social and economic factors, and the external social environment needs to be taken into consideration in the process of governance.
Apart from the scale of population, the degree of economic development and the level of technology, atmospheric pollution can be also affected by a variety of socioeconomic factors. Areas with a large number of people, large economic scale, high industrial output value and high urbanization rate are often areas where air pollution is relatively serious. At present, China is in a period of social transformation, and with increasing population, growth of the total economy and an acceleration of industrialization and urbanization, pollution treatment faces more and more severe challenges. With that said, the improvement of technology can suppress the aggravation of air pollution to a certain extent. Therefore, in the future, a green economy can be developed by optimizing the industrial structure and upgrading the technical level, so that emissions of atmospheric pollutants can be reduced and the sustainable development of the economy and society can be realized.
- (3)
The current air pollution control in China is mainly driven by the command-control policy tools, and the regulatory mechanism need to be improved.
The results of empirical analysis show that in the process of governing air pollution in China, the effects of market-motivated supervision have become far less than that of the legal regulation type and administrative order type. China’s SO2 emission reductions are largely driven by the use of a large number of powerful administrative order-based regulatory measures. Air pollution governance is like a government-led political movement, the strength of market is weak, and social power has not yet been effectively used. In the future, multiple regulatory tools should be used together to establish comprehensive supervision mechanisms, encourage public participation, strengthen third-party supervision and effectively play the role of market and society. This will make the work of atmospheric pollution control a social activity engaged by the whole nation, to establish a diversified and comprehensive regulatory system.
Author Contributions
Conceptualization, R.Y. and W.C.; Methodology, R.Y.; Software, R.Y.; Validation, R.Y.; Formal Analysis, R.Y.; Investigation, R.Y.; Resources, R.Y.; Data Curation, R.Y.; Writing—Original Draft Preparation, R.Y.; Writing—Review & Editing.
Funding
This research was funded by the National Social Science Foundation of China (Grant No. 2014B1-0130) and the National Natural Science Foundation of China (Grant No. 71373173). The corresponding author Ruoyu Yang especially wishes to thank her mother Juan Wang and her father Qi Yang, whose encouragement has given her powerful spiritual support in her life.
Conflicts of Interest
The authors declare no conflicts of interest.
References
- Yang, R.; Liao, Z. PM2.5 with five pollutants, Environmental Management, and Tuberculosis: Evidence from Four Chinese Municipalities. Boletín de Malariología y Salud Ambiental 2017, 57, 58–70. [Google Scholar]
- Chen, W.; Yang, R. Evolving Temporal–Spatial Trends, Spatial Association, and Influencing Factors of Carbon emissions in Mainland China: Empirical Analysis Based on Provincial Panel Data from 2006 to 2015. Sustainability 2018, 10, 2809. [Google Scholar] [CrossRef]
- He, Z.; Shi, X.; Wang, X.; Xu, Y. Urbanisation and the geographic concentration of industrial SO2 emissions in China. Urban Stud. 2017, 54, 3579–3596. [Google Scholar] [CrossRef]
- Guan, X.; Huang, J.; Zhang, Y.; Xie, Y.; Liu, J. The relationship between anthropogenic dust and population over global semi-arid regions. Atmos. Chem. Phys. 2016, 16, 5159–5169. [Google Scholar] [CrossRef] [Green Version]
- Li, W.; Sun, S. Air pollution driving factors analysis: Evidence from economically developed area in China. Environ. Prog. Sustain. Energy 2016, 35, 1231–1239. [Google Scholar] [CrossRef]
- Yang, X.; Wang, S.; Zhang, W.; Li, J.; Zou, Y. Impacts of energy consumption, energy structure, and treatment technology on SO2 emissions: A multi-scale LMDI decomposition analysis in China. Appl. Energy 2016, 184, 714–726. [Google Scholar] [CrossRef]
- Tursun, H.; Li, Z.; Liu, R.; Li, Y.; Wang, X. Contribution weight of engineering technology on pollutant emissions reduction based on IPAT and LMDI methods. Clean Technol. Environ. Policy 2015, 17, 225–235. [Google Scholar] [CrossRef]
- Bemelmans-Videc, M.L.; Rist, R.C.; Vedung, E.O. (Eds.) Carrots, Sticks, and Sermons: Policy Instruments and Their Evaluation; Transaction Publishers: Piscataway, NJ, USA, 2011. [Google Scholar]
- Huang, Q.; Gao, M.; Wu, Y. Impact of Environmental Regulation Tools on the Economic Growth of China—Threshold Effect Analysis based on Environmental Decentralization. J. Beijing Inst. Technol. 2017, 19, 33–42. [Google Scholar]
- Böcher, M. A theoretical framework for explaining the choice of instruments in environmental policy. Forest Policy Econ. 2012, 16, 14–22. [Google Scholar] [CrossRef]
- Wang, H. Comparison and selection of environmental regulation policy in China: Based on Bayesian model averaging approach. China Popul. Resour. Environ. 2016, 26, 132–138. [Google Scholar]
- Tietenberg, T.H.; Lewis, L. Environmental Economics and Policy; Pearson Addison Wesley: Boston, MA, USA, 2004. [Google Scholar]
- Managi, S.; Kaneko, S. Economic growth and the environment in China: An empirical analysis of productivity. Int. J. Glob. Environ. Issues 2006, 6, 89–133. [Google Scholar] [CrossRef]
- Tietenberg, T. The tradable-permits approach to protecting the commons: Lessons for climate change. Oxf. Rev. Econ. Policy 2003, 19, 400–419. [Google Scholar] [CrossRef]
- Wang, H.; Wang, Z. The Comparison and Selection of Policy Instrument of Environmental Governance-in case of governance of Beijing’s PM2.5. Chin. Public Adm. 2016, 8, 126–131. [Google Scholar]
- Gong, G.; An, R. Progress and Obstacles in Environmental Public-Interest Litigation under China’s New Environmental Law: An Analysis of Cases Accepted and Heard in 2015. Clim. Law 2017, 7, 185–208. [Google Scholar] [CrossRef]
- Cheng, Z.; Li, L.; Liu, J. The emissions reduction effect and technical progress effect of environmental regulation policy tools. J. Clean. Prod. 2017, 149, 191–205. [Google Scholar] [CrossRef]
- Xie, L.; Van Der Heijden, H.A. Environmental movements and political opportunities: The case of China. Soc. Mov. Stud. 2010, 9, 51–68. [Google Scholar] [CrossRef]
- Xu, H. Spatial and Econometric Analysis of Spatial Dependence, Carbon emissions and Per Capita Income. China Popul. Resour. Environ. 2012, 22, 149–157. [Google Scholar]
- Anselin, L. Local indicators of spatial association—LISA. Geogr. Anal. 1995, 27, 93–115. [Google Scholar] [CrossRef]
- Ehrlich, P.R.; Holdren, J.P. Impact of Population Growth. Science 1971, 171, 1212–1217. [Google Scholar] [CrossRef]
- Dietz, T.; Rosa, E.A. Rethinking the Environmental Impacts of Population, Affluence and Technology. Hum. Ecol. Rev. 1994, 2, 277–300. [Google Scholar]
- Zheng, Y.; Yang, R. Determining the efficiency of investments and evolving temporal-spatial trends in environmental governance using the stochastic frontier analysis (SFA) model. Environ. Eng. Manag. J. (EEMJ) 2018, 17, 2767–2779. [Google Scholar]
© 2019 by the authors. Licensee MDPI, Basel, Switzerland. This article is an open access article distributed under the terms and conditions of the Creative Commons Attribution (CC BY) license (http://creativecommons.org/licenses/by/4.0/).


