Article

Analysis and Optimization Strategy of Travel System for Urban Visually Impaired People

1
School of Architecture, Tianjin University, Tianjin 300072, China
2
School of Earth and Environmental Sciences, The University of Queensland, Brisbane 4072, Australia
3
Institute of Regional and Urban-Rural Development, Wuhan University, Wuhan 430072, China
*
Authors to whom correspondence should be addressed.
The correspondence authors contributed equally to this work.
Sustainability 2019, 11(6), 1735; https://doi.org/10.3390/su11061735
Submission received: 25 February 2019 / Revised: 16 March 2019 / Accepted: 17 March 2019 / Published: 22 March 2019
(This article belongs to the Special Issue Accessibility and Transportation Equity)

Abstract

:
The urban transportation system should meet the requirements of various social groups and be fair and comprehensive. In China, it is rare to see disabled people use public transportation facilities to travel. In this research, we have selected visually impaired people as the research object and taken the central urban area of Tianjin as the research area. First, through questionnaires, this paper analysed the travel methods of visually impaired people through four aspects: destinations, transportation, walking ability and blind sidewalk system. Second, a travel system for visually impaired people was established based on ArcGIS and analysed by network service area analysis. Finally, a discussion of the research and suggestions for improving the travel system were presented. From the results, it can be concluded that visually impaired people have a clear travel purpose, and it is, in turn, most important to focus on disabled service centres, urban parks, hospitals, restaurants and so on. The blind sidewalk system in the research area is low-density and has a weak correlation with travel destinations, etc., which cannot guarantee the success of the travel of visually impaired people. Data from this paper can provide a reference for other cities in China to carry out research work for the equity of disabled people using transportation.

1. Introduction

According to China’s sixth census, in 2010, there were approximately 85 million disabled people [1]; with the aging society and the increase in the total population, it is predicted that by 2020, the total number of disabled people in China will be close to 100 million. According to relevant research, the participation of disabled people in public activities in China is low, and they are “afraid to go out and cannot go out” [2]. In this research, visually impaired people and the urban blind sidewalk system were selected as the research objects. This paper analyses the relationship between the existing conditions of urban blind sidewalk system construction and the travel demands of visually impaired people and discusses the problems of the urban traffic system in the travel of the disabled.
Traffic equity is an important part of social equity. It has not been put forward for a long time in the field of transportation, and there are few related studies on the travel equity of disabled people. On the whole, the research on traffic equity mainly focuses on traffic mode equity, traffic policy equity, traffic facilities allocation equity and various traffic equity indicators [3,4,5,6]. In a regional or urban area, the analysis of traffic facilities allocation equity is often combined with spatial accessibility. In 1999, Thomas used the regression model to study the relationship between employment and public transport in Atlanta and Portland and drew the conclusion that the accessibility of public transport was significantly related to the employment rate [7]; in 2002, Litman made a comprehensive interpretation of traffic equity, including three aspects—horizontal equity, vertical equity considering different social strata and income differences and vertical equity considering differences in transport capacity and demand—to propose barrier-free transport services for the disabled groups [8]. In 2011, Fang Chen studied the impact of traffic policy on the development of traffic equity and the corresponding equity assessment [9]. In 2013, Timothy analysed the relationship between the distribution of public transportation network accessibility and the distribution of subsidized housing in Baltimore, and the results showed that the subsidized housing area enjoyed the same public transportation accessibility as other urban areas [10]. Most studies on the travel habits of visually impaired people are based on walking ability. In 1983, Pearson investigated the walking speed of visually impaired people, the elderly and the wheelchair-bound disabled in the residential environment [11]. In 1986, Clark-Carter investigated the relationship between the complexity of the external environment and the evacuation speed of visually impaired people and found that the complexity of the environment was inversely proportional to the evacuation speed [12]. From 1993 to 1999, Shields and Boyce investigated the evacuation speed of visually impaired, hearing-impaired and limb-impaired people in different functional buildings and found that under the same conditions, the evacuation speed of visually impaired and hearing-impaired people was not significantly lower than that of normal people [13,14,15]. In China, there are approximately 13 million people with visual impairment (statistics from 2010), but the research in this field was started relatively late. In 2009, Chuansheng Jiang investigated and analysed the movement speed of the physically disabled and the elderly through practical exercise experiments [16]. In 2016, Hongwei Qian evaluated the effectiveness of diversified rescue management technology for vulnerable groups in earthquake rescue [17]. In 2017, Sen Zhang summarized the walking speed and emergency response characteristics of visually impaired people through social investigation and experiments [18]. At the same time, there are some studies that evaluate the quality of medical treatment and the working environment of visually impaired people through acoustic environment analysis [19]. It can be seen from the literature review that the research on visually impaired people was focused mainly on the walking speed and response characteristics, but there were few studies related to urban transportation.
China is in a stage of rapid urbanization. Urban construction is changing with each passing day. As an important part of the urban barrier-free facilities system and public transportation system, the blind sidewalk system can provide indispensable help for the safe travel of visually impaired people. Due to the lack of corresponding planning and design guidance in the early stage of urban planning and the lack of relevant data on the activity characteristics of visually impaired people, the distribution of the blind sidewalk system is unreasonable, and it is often occupied [20]. This fact, coupled with the imperfect supervision system [21], means the blind sidewalk system cannot achieve the connection with various urban public service facilities and cannot effectively provide help for visually impaired people. At the same time, the basic research on the disabled groups in China has been carried out relatively late; thus, the blind sidewalk system design standards and norms have been mostly formulated on the basis of relevant references from other countries. After years of development, due to the differences in national conditions and social and cultural backgrounds, these data may be inappropriate. Based on these, this paper, on the one hand, carried out the basic data research on the behavioural characteristics of visually impaired people in China and, on the other hand, explored the problems of the state of China’s urban transportation system in terms of disabled groups, summarized the objective laws, put forward solutions, and provided a reference for the relevant research and construction in other cities.

2. Data and Methods

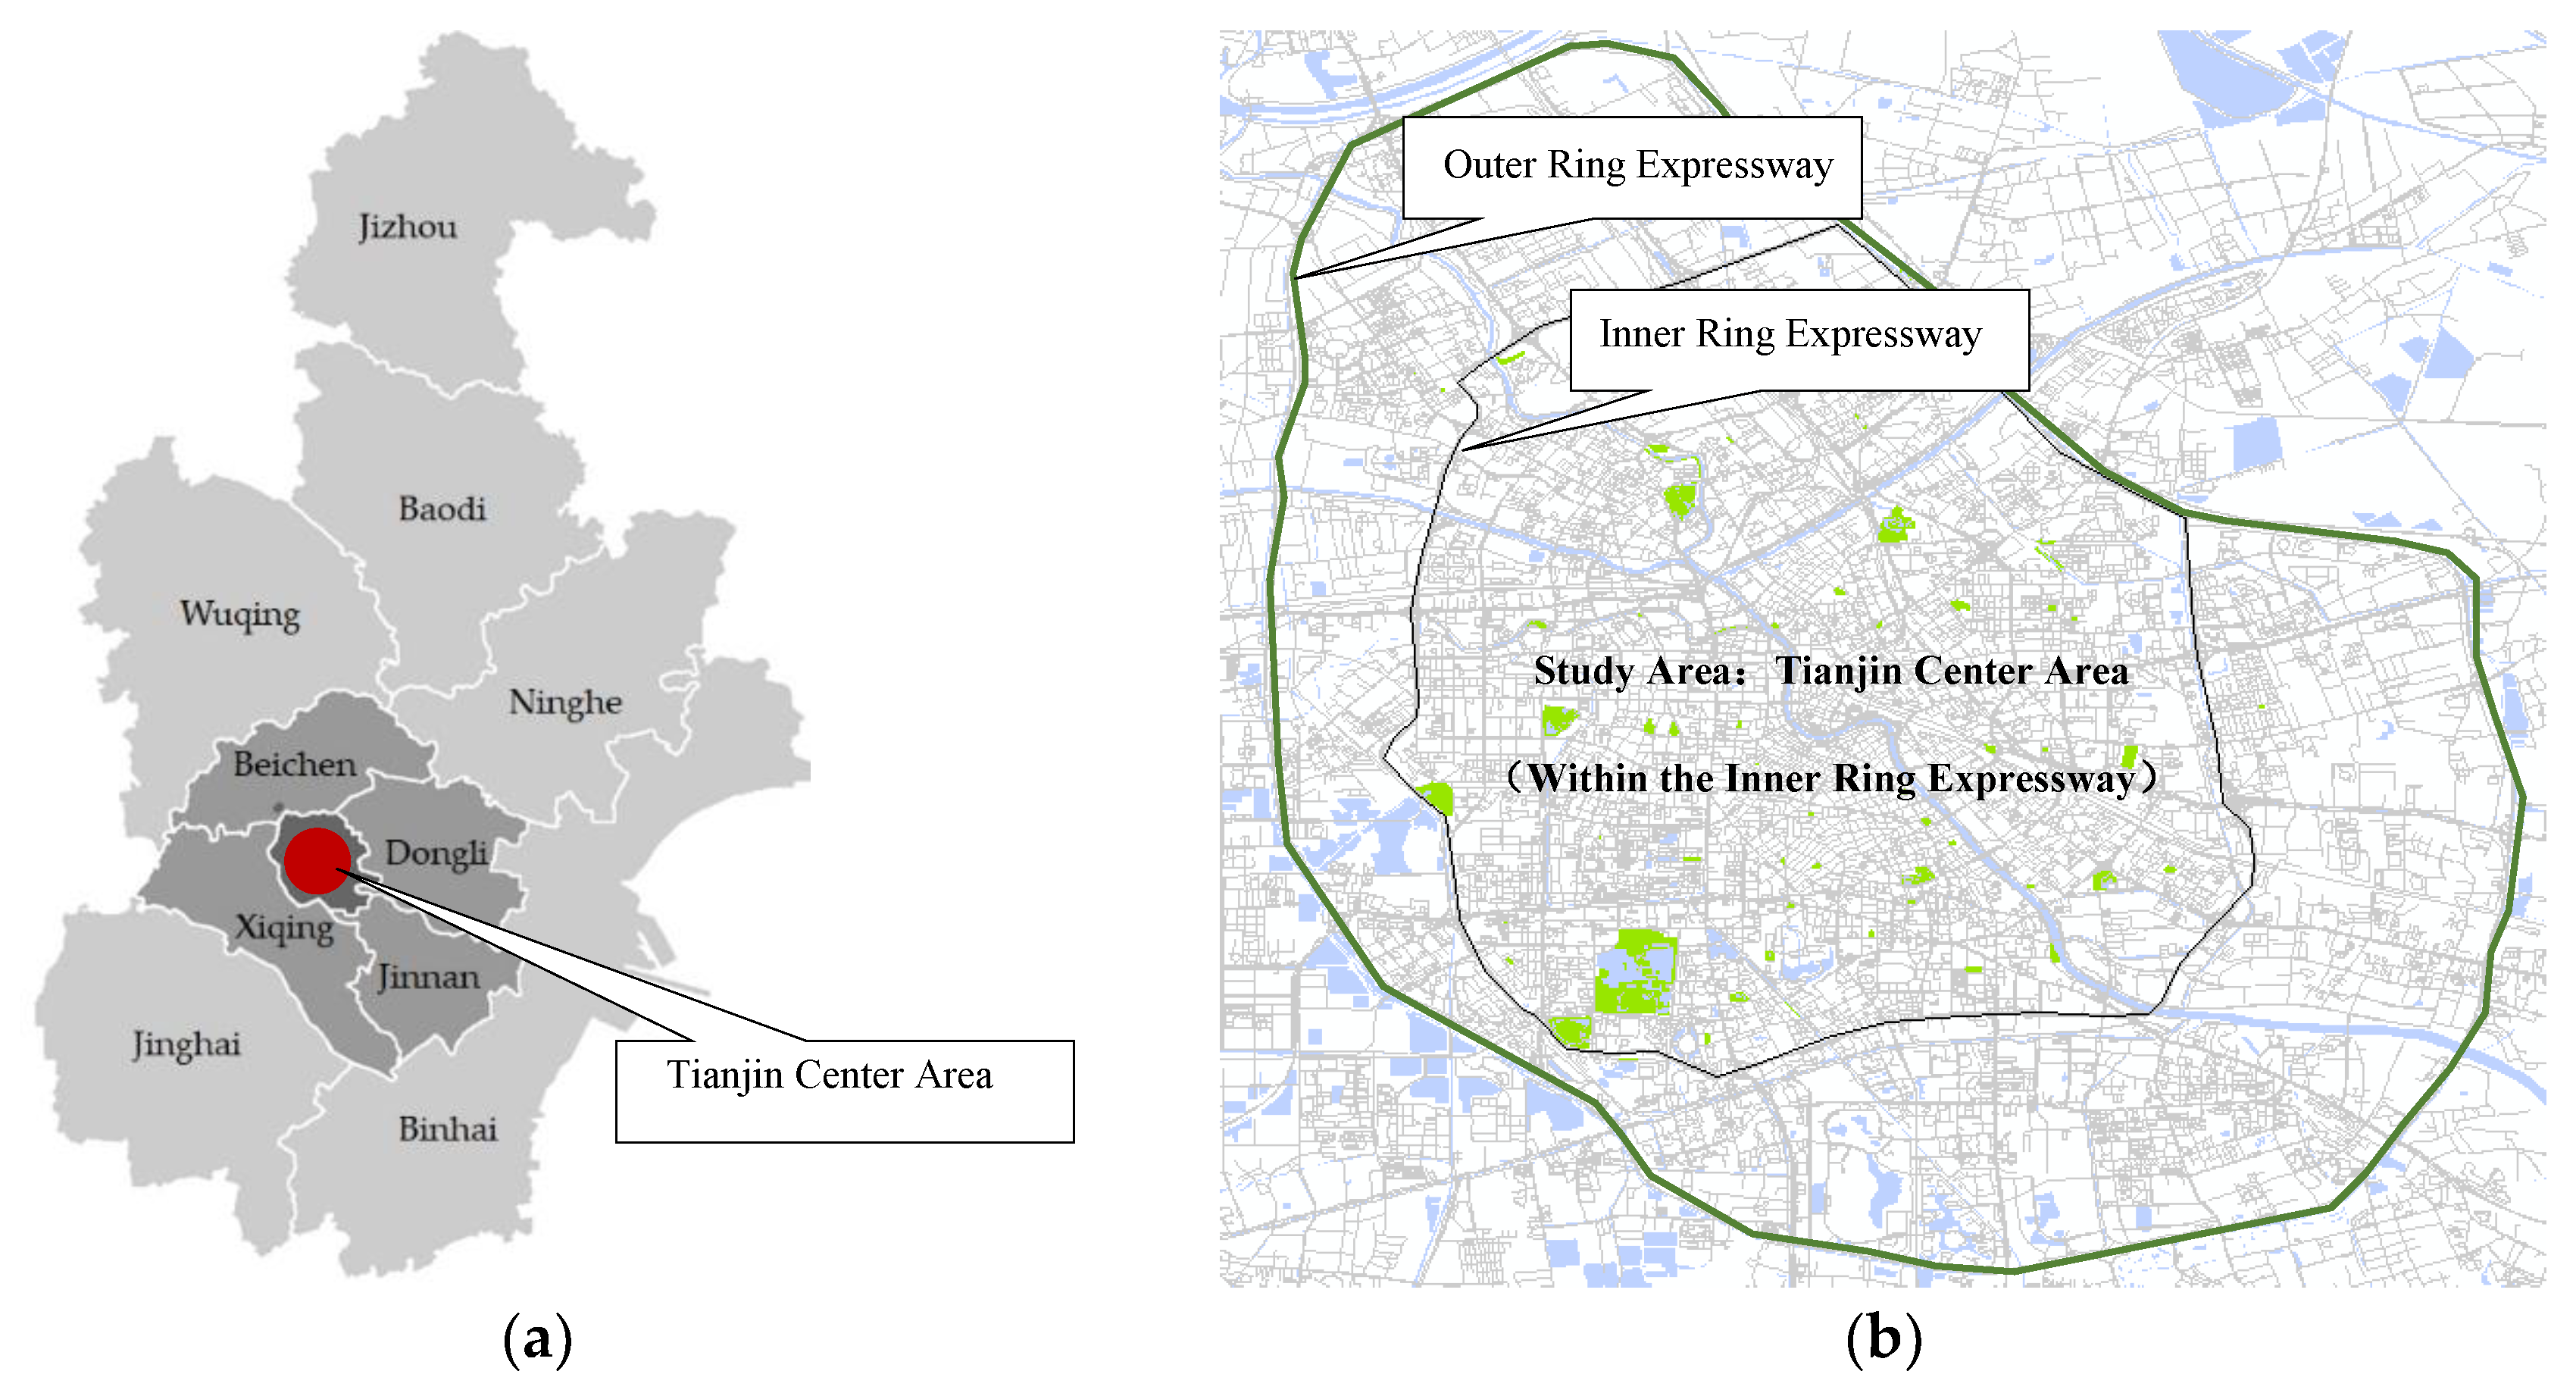
2.1. Research Area and Research Object

The central urban area of Tianjin is selected as the research area, as shown in Figure 1. Tianjin is one of the four municipalities directly under the Central Government of China, with a resident population of approximately 15.6 million, and belongs to a mega-city. The research area, which is 175.8 km2, is densely populated, with a resident population of approximately 4.5 million to 5 million [22]. According to the national statistical results, the proportion of visually impaired people in the total population is approximately 1–1.5%. From this calculation, the number of visually impaired people in this research area is approximately 45,000–50,000 people.
Ninety-five participants with visual impairment, aged between 35–60 years old, with a range of vision loss (based on visual acuity) <0.05, were selected in this research. In accordance with China’s national standard “Chinese disabled persons practical evaluation standard (trial)” and “Standard logarithmic visual acuity table (GB11533-2011)”, these participants belong to grade I and II blindness and rely on blind sticks or the guidance of members to carry out daily activities.

2.2. Research Methods

The research was divided into three parts. The first part involved creating a questionnaire for visually impaired people, collecting basic data including travel destination, modes of travel, and walking ability and then through site investigation, using ArcGIS to construct the map of the travel destinations and existing conditions of the blind sidewalks system in the research area. In the second part, based on the ArcGIS network service area analysis, the service area of travel destinations was analysed, and the existing problems were summarized. In the third part, according to the results of the service area analysis, the improvement strategies of the travel system of visually impaired people were put forward, and the planning of further research was discussed.

2.2.1. Investigation

Questionnaires were distributed to the visually impaired people in the form of point-to-point manual reading to ensure that the participants could successfully complete the survey. Ninety-five questionnaires were sent out to investigate travel destinations, mode of travel, walking ability and other related questions, and 95 completed questionnaires were effectively received with an effective recovery of 100%.
The questionnaire consists of three parts, as shown in Appendix A and Figure 2. The first part mainly investigates the basic personal information of visually impaired people, including gender, age, educational background and occupation. The second part is the core part, which has designed questions related to the daily travel of visually impaired people, including travel destinations, mode of travel, walking ability, usage frequency of barrier-free facilities, response to emergency disasters and other related questions. The third part is about the social needs of visually impaired people.

2.2.2. ArcGIS Network Service Area Analysis

Network service area analysis based on ArcGIS was used to analyse the service area of travel destinations for visually impaired people. Network service area analysis is a process of geographic analysis and modelling based on the geographic network and traffic network. This analysis solves for the optimization of network structure and its resources by studying the state of the network and simulating and analysing the flow and distribution of resources in the network. The theoretical basis of network analysis is graph theory and operational research, which arrange the operation of various elements from the perspective of statistics to make full use of their respective roles, such as the optimal allocation of resources and the search for the shortest path [23,24,25,26]. When visually impaired people travel alone, the blind sidewalk system is their direct traffic system. The distribution of the blind sidewalk system directly determines the effect of visually impaired people travelling in urban settings. The blind sidewalk system is regarded as the traffic network for visually impaired people. Based on that, various travel destinations were analysed by using the network service area function to estimate whether the accessibility of the urban traffic system meets the travel requirements of visually impaired people.

3. Results

3.1. Results of Questionnaire

3.1.1. Travel Destinations

According to the results of the questionnaire, as shown in Figure 3, the travel destinations mainly include disabled service centres, urban parks, hospitals, restaurants and other relevant public service facilities. First, the number of people choosing disabled service centres was the largest. Disabled service centres are the primary destination for travel, and such destinations are special places that provide public activities and services for the disabled and, therefore, have the closest relationship with them, followed by urban parks, which are outdoor places for the visually impaired people to enjoy leisure and entertainment in daily life, mainly for exercise; then, according to priority, the hospitals, restaurants and other places followed. Based on the statistical results, it can be seen that visually impaired people have a clear travel purpose, and they mainly concentrate on two types of travel destinations: disabled service centres and urban parks.

3.1.2. The Mode of Travel

In interviews with visually impaired people, it was found that based on the existing conditions of the traffic system in the research area, it was difficult for them to travel independently. Most of them were not satisfied with the barrier-free public transport facilities in Tianjin and said that such facilities were difficult to find or use. According to the statistical results of transportation choice (multiple choices were available), 90 people chose to walk, 81 people chose to take private cars, only 14 people chose to take buses, and 5 people chose to take the subway. In the choice of travel mode, 93 people needed to be accompanied by someone, only 32 people chose to travel alone, and a small number of people chose to travel with guide dogs. The results are shown in Figure 4.
Table 1 is a combination of travel mode and transportation choice for visually impaired people. In terms of individual travel, the first choice was to walk, followed by the subway and bus, and guide dogs were the last consideration. In terms of accompanied travel, the first choice was to take private cars, and the second was to take a mode of public transport such as the bus, subway or other public transportation. It can be seen from the statistical results that most visually impaired people chose to walk or take private cars, the public transport system has not become the primary choice for the visually impaired people to travel in daily life, and guide dogs, which are quite popular in European and American countries, have not been widely popularized in China.

3.1.3. Walking Ability

The walking ability of visually impaired people is an important standard for calculating their travel distance, including travel time and walking speed. In the walking ability statistics, the duration of travel time was investigated first, and 47% of visually impaired people chose to walk within 10 min, 25% of them chose to walk within 10 to 20 min, 13% of them chose to walk within 20 to 30 min, 9% of them chose to walk within 30 to 60 min, 9% of them chose to walk within 60 min or more. According to relevant studies, the average walking speed of visually impaired people is approximately 0.72 m/s [27], and the travel distance was calculated based on their walking speed, as shown in Table 2.
It can be seen from Table 2 that within 10 min, the minimum travel distance of visually impaired people was approximately 288 m, the maximum was approximately 666 m, and the average was approximately 432 m. Within 20 min, the minimum travel distance was approximately 576 m, the maximum was approximately 1332 m, and the average travel distance was approximately 864 m. According to our investigation, considering the actual situation, the maximum travel time of visually impaired people in this research was assumed to be 30 min, and the travel distance corresponds to 400 m, 800 m and 1000 m.

3.2. Results of Site Investigation

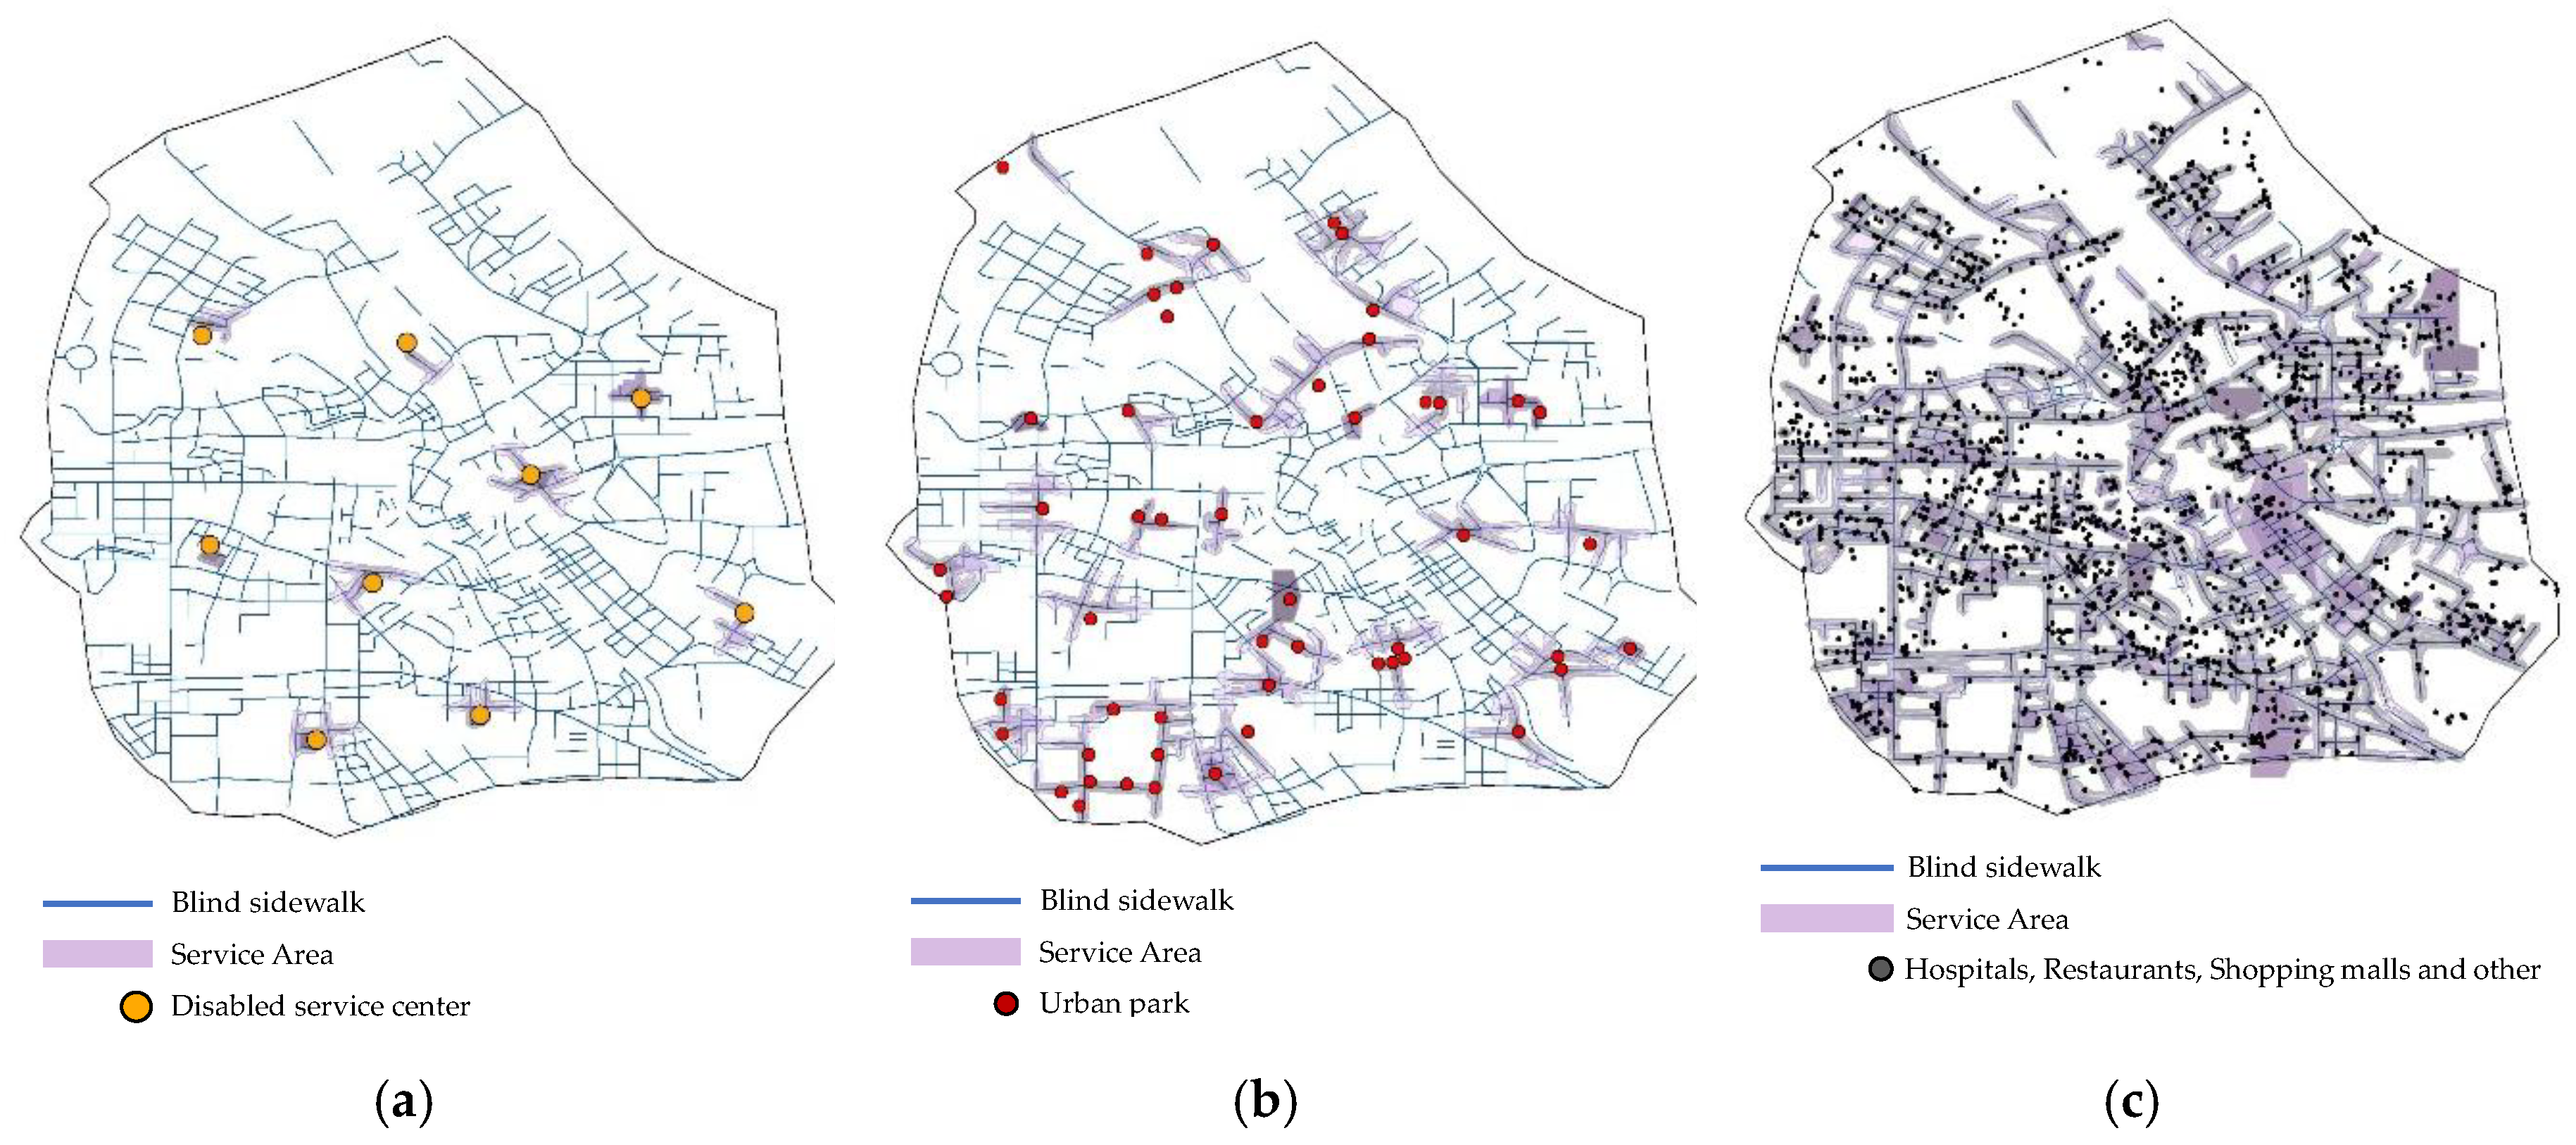
3.2.1. Distribution of Travel Destinations

According to the results of the questionnaire, the travel system for visually people was investigated by an on-site survey and city street view map of Google from 2017 to 2018, including the blind sidewalk system and travel destinations, as shown in Figure 5.
Because it was difficult to count the distribution of residential areas for visually impaired people, this research assumed that the probability of visually impaired people across these residential areas was the same, the yellow area is the current residential land distribution map according to the “master planning of Tianjin (2005–2020)”. The current residential area in the research area was 69.3 km2.
In the analysis of the travel destinations of visually impaired people, according to the statistical results, it could be seen that they have different choices of travel destinations. The first choice was to go to disabled service centres and urban parks to participate in various activities; the second choice was to go to hospitals, restaurants and other urban public service facilities. According to the above travel demand selection, the relevant facilities in the research area were investigated, as shown in Figure 2. The red dots represent the disabled service centres, the green areas are the distribution of urban parks, and the other dots represent the distribution of hospitals, restaurants, shopping malls and other destinations. The survey statistics are shown in Table 3.

3.2.2. Distribution of the Blind Sidewalk System

According to the results of the site investigation, the total length of the blind sidewalk is 439,429 m, and the length of the blind sidewalk laid on the urban expressway is approximately 41,184 m, accounting for 9.4% of the total length; the length of the blind sidewalk laid on the urban arterial road is approximately 179,053 m, accounting for 40.7%; the length of the blind sidewalk laid on the urban secondary trunk road is approximately 181,490 m, accounting for 41.3%; and the length of the blind sidewalk laid on the urban branch road is approximately 37,702 m, accounting for 8.6% of the total length.
Based on the analysis of the existing conditions, as shown in Figure 5, blind sidewalks are concentrated on the urban arterial roads and less distributed in urban branch roads. Meanwhile, the distribution of blind sidewalks in the residential areas (yellow areas in Figure 5) lacks a systematic quality, and the overall distribution density is low. Urban arterial roads are mostly traffic roads, which are not closely connected with residential areas and public service facilities. Urban secondary trunk roads and branch roads are closely related to various residential areas, urban functional areas, urban parks and so on. The absence of blind sidewalks on urban branch roads has a great impact on the travel of visually impaired people, especially from home to their travel destinations. The existing conditions of the blind sidewalk system in the research area cannot provide effective help for the travel of visually impaired people. It can be seen that the problem of visually impaired people being “afraid to go out and cannot go out” may be related to the distribution of blind sidewalks.

3.3. Results of Network Service Area Analysis

The network service area analysis is used to analyse and evaluate the service area of travel destinations. According to the results of walking ability investigation, the service area of the blind sidewalk system is divided into three service radiuses: 400 m, 800 m and 1000 m.
Figure 6a shows the service coverage area of the disabled service centres; from the results, as shown in Table 4, it can be seen that the service area of the current disabled service centres is from 1.5 km2 to 4.8 km2, and the maximum service ratio is 2.7%, which can only cover the limit areas around them. From Table 4, it can be seen that the service area of the urban park is from 9.2 km2 to 29.2 km2, and the maximum service ratio is 2.7%. As shown in Figure 6b, the current urban parks have a good correlation with the blind sidewalk system, and almost all the parks are accessible by blind sidewalks, which are very beneficial to the travel of visually impaired people. However, the overall distribution of urban parks is not balanced. Most of the large-scale parks are concentrated in the southwest of the research area and are less distributed in the central and northern areas. Figure 6c shows the results of the service area analysis of the hospitals, shopping malls and restaurants. The service area is from 37.9 km2 to 94.3 km2 and can cover approximately 21.6–53.6% of the research areas (as shown in Table 4), which indicates that only almost half of visually impaired people can use the current blind sidewalk system to reach these destinations.
Through the analysis results of the network service area of travel destinations, it can be seen that there were some problems as follows. From Figure 5 and conversations with visually impaired people, it can be seen that the current blind sidewalk system is in a state of random distribution, and there is no planning arrangement according to the travel demand of the visually impaired. Most of the existing blind sidewalk systems are distributed in urban arterial roads and urban secondary trunk roads, and most of them cannot connect to the entrances and exits of residential areas, which may have a great impact on the travel of visually impaired people. It can be seen from Figure 6 and Table 4 that the service areas of various travel destinations were small, from the lowest, 0.9%, to the highest, 53.6%. Through site investigation, it can be seen there is no special emergency shelter for visually impaired people, and the existing urban-level or community-level shelters lack a connection with the blind sidewalk and relevant indication systems. In emergencies, it may be difficult for visually impaired people to use these facilities to reach safe areas.

4. Discussion

It can be seen from the previous studies that when visually impaired people travel alone, they mainly rely on the urban blind sidewalk system and have a clear choice of destination. Through the investigation and analysis of the blind sidewalk system in the research area, it can be found that the current blind sidewalk system has some problems, such as random distribution, low density and a lack of connection with the travel destinations. In view of the existing problems, the following optimization strategies are put forward.

4.1. Optimization Strategies

  • Taking the residential areas as the core, let the visually impaired people go out of the house. The first principle of blind sidewalk system planning is to increase the possibility of travel for visually impaired people and ensure the connection between the blind sidewalk system and residential areas, thus increasing the availability of the entire travel system.
  • Link to various travel destinations, and provide clear travel options. Because visually impaired people cannot use their vision to receive external information effectively, too many travel choices will cause trouble for them. The planning of the blind sidewalk system should link the main travel destinations, reduce other unnecessary choices, make the travel system provide clear guidance and improve the use efficiency and travel safety.
  • Construct the blind sidewalk system in different levels to meet different travel requirements. For different travel destination choices, the blind sidewalk system needs to be divided into two levels, and different levels of the blind sidewalk system can be distinguished by different recognition patterns and different widths. The first-level blind sidewalk connects the main travel destinations, such as the disabled service centre, the urban park, the emergency shelter, etc. The second-level blind sidewalk mainly connects the residential area and the necessary public service facilities and traffic facilities to meet the daily travel requirements of visually impaired people.
  • Increase the density and distribution of the blind sidewalk system on branch roads. Through the analysis of the network service area, it can be seen that the current blind sidewalk system only presents a single “linear” service area and does not form a “regional” service area, which means that the utilization rate of the blind sidewalk system is very low. According to the results of a previous study, it is suggested that increasing the density and distribution of the blind sidewalk system on the branch road will improve the use efficiency and increase the accessibility of various travel destinations.

4.2. Discussion of Optimization Strategies

Based on the above four design strategies, the blind sidewalk system for visually impaired people in the central urban area of Tianjin was re-planned. The purpose of the re-plan is to improve the service coverage area of the blind sidewalk system in the urban secondary trunk road and the urban branch road, increase the density of blind sidewalk system, and promote the connection with residential areas and related travel destinations.
As shown in Figure 7a, the red blind sidewalk represents the first-level blind sidewalk system, which links the main travel destinations, including disabled service centres, urban parks and so on. The blue blind sidewalk represents the secondary blind sidewalk system, which mainly distributes in the urban residential areas, connecting hospitals, restaurants and other places.
By comparing the re-planning results of the blind sidewalk system with the current conditions, as shown in Figure 7b, the total length of the re-planned blind sidewalk system has increased from 439,429 m to 545,018 m. The length of the blind sidewalk on the urban branch road has most increased, from 37,702 m to 195,906 m, with a new increased length of approximately 160,000 m. The length of the blind sidewalk on the urban secondary trunk road is basically unchanged. The length of the blind sidewalk on the urban arterial road has decreased from 179,053 m to 147,265 m. The length of the blind sidewalk on the urban expressway has decreased from 41,184 m to 21,357 m.
Figure 8a is the result of the network service area analysis of the disabled service centres based on the re-planned blind sidewalk system. From Table 5, it can be seen that the service area has been expanded and that the ratio has increased from 2.7% to 5.5%. Figure 8b is the result of the urban parks in the research area. Due to the improvement in density and the optimization of the connectivity of the re-planned blind sidewalk system, the correlation between urban parks and residential areas has been strengthened, and the ratio of the highest service area has also increased from 16.6% to 30.4%. Figure 8c is the result of service area analysis of hospitals, restaurants and others in the research area. It can be seen from the figure that their service area has an effective cover and has good accessibility to the blind sidewalk system. As shown in Table 5, the highest ratio has increased from 53.6% to 71.0%.
We can find an interesting phenomenon by comparing Table 4 and Table 5. Taking urban parks as an example, it can be seen that the current service areas were 9.2 km2 (5.2%), 21.3 km2 (12.1%), and 29.2 km2 (16.6%). Based on the re-planned blind sidewalk system, the new service areas were 10.7 km2 (6.1%), 35.1 km2 (20.0%), and 53.4 km2 (30.4%). The lowest ratio was only increased by 17.3%, and the highest ratio was increased by 83.1%. It may be concluded that increasing the density of the blind sidewalk system has a significantly better effect on the long-distance travel of visually impaired people than on the short-distance travel.
Based on the overall analysis results, in the research area, compared with the analysis results of the current conditions (as shown in Figure 4), the re-planned blind sidewalk system can change the service area of these facilities from the previous “band” to “regional”. Fifteen service units can be formed in each district (as shown in Figure 6c), and most of them are concentrated in the residential area, which makes it possible for visually impaired people to go out of their home and travel around. At the same time, in planning, the re-planned blind sidewalk system strengthens the connection between most blind sidewalk systems and travel destinations and constructs the “point-line-regional” blind sidewalk service system framework.
It can be seen from the analysis results that based on the current situation of blind sidewalk in the research area, the visually impaired people had difficulty in reaching the destination, which means the blind sidewalk system is not fair enough compared to other urban road transport systems. We hope that through future research, we can promote the equity of transportation system and meet the transport requirement of various social groups in Chinese cities. This is also the research motivation of this article.

5. Conclusions

According to this study, visually impaired people have their own obvious characteristics in the purpose and mode of travel and have different travel destinations. The most frequently chosen travel destinations were the disabled service centres and urban parks, followed by public facilities such as hospitals and restaurants, which were related to their daily life. Based on the results of the questionnaire, it was found that visually impaired people relied very little on the urban public transport system. Through the investigation and analysis of the current conditions, it was found that the urban blind sidewalk system was random and has a bad connection with the necessary travel destinations, which leads to the existing conditions of urban transportation that cannot meet the travel requirements of visually impaired people.
Based on these problems, this research proposed an optimization strategy of travel system for visually impaired people. First, it is suggested that the planning of the blind sidewalk system should be integrated into the overall design of the urban transportation system, and a hierarchical design should be conducted according to the requirements of visually impaired people. Second, the blind sidewalk system needs to be divided into levels and put in contact with necessary travel destinations, especially the disabled service centre, urban parks, urban shelters, etc. Furthermore, the density and distribution of the blind sidewalk system in the urban secondary trunk road and branch road should be increased to expand the service area of each travel destination to meet the travel requirements of visually impaired people.
This paper is a research study on traffic equity and accessibility based on the travel modes of visually impaired people. Due to the limited number of subjects, there may be some deviation in the research conclusions. In further research, the number of subjects will increase; at the same time, the research objects will be extended to the entire disabled community. The research achievements can provide reference for relevant research in other cities, including architectural design, urban planning, urban transportation system planning, etc., to promote the comprehensive development of urban equity construction in China.

Author Contributions

Conceptualization, X.L., S.Z., J.Z. and F.F.; methodology, X.L., S.Z., J.Z. and F.F.; software, X.L. and S.Z.; validation, X.L. and S.Z.; formal analysis, X.L. and S.Z.; investigation, X.L. and S.Z.; data curation, X.L. and S.Z.; writing—original draft preparation, X.L. and S.Z.; writing—review and editing, J.Z. and F.F.; supervision, J.Z. and F.F.; funding acquisition, S.Z. and J.Z.

Funding

This research was funded by China Postdoctoral Science Foundation, grant number No. 2018M640235, National Natural Science Foundation of China, grant number No. 51438009, China Scholarship Council program and Tianjin Postdoctoral International Training Program.

Acknowledgments

The authors are grateful to the anonymous referees who provided valuable comments and suggestions to significantly improve the quality of the paper.

Conflicts of Interest

The authors declare no conflict of interest.

Appendix A. Questionnaire

Dear participants,
We are a research team from the school of architecture, Tianjin University. In order to investigate and understand the travel information in your activity area, and the travel needs for your daily life, would you like to spare a few minutes to answer the following questions in the questionnaire carefully? We sincerely hope to get some opinions from you and we will read the questions and options for you one by one. We will inform you that your answers will be kept strictly confidential. Thank you for your great support and cooperation!
  • 1. Gender
  • A. Male B. Female
  • 2. Age
  • A. < 6 years old B. 7–17 years old C. 18–40 years old D. 41–65 years old E. > 66 years old
  • 3. Educational background
  • A. Primary school B. High school C. undergraduate D. postgraduate
  • 4. Occupation
  • A. Student B. Jobholder C. Freelance D. Unemployed E. Retirement
  • 5. Travel destinations
  • A. Disabled service center B. Blind massage place C. Shopping mall D. Urban park E. Hospital F. Restaurant G. Market H. Others
  • 6. Travel mode
  • A. Individual travel B. Accompanied travel C. Guide dog
  • 7. Transportation choice
  • A. Bus B. Subway C. Walking D. Private car E. Others
  • 8. the duration of travel time
  • A. < 10min B. 10–20min C. 20–30min D. 30–60min E. > 60min
  • 9. Do you use the city indicator system?
  • A. Yes B. No
  • 10. How satisfied are you with the urban blind sidewalk system?
  • A. Very satisfactory B. Comparative satisfaction C. Satisfaction D. Dissatisfaction
  • 11. How satisfied are you with the urban barrier-free facilities?
  • A. Very satisfactory B. Comparative satisfaction C. Satisfaction D. Dissatisfaction
  • 12. Do you think there should be professionals in the public places that serve vulnerable group?
  • A. Yes B. No
  • 13. Do you know about urban emergency shelters?
  • A. Yes B. No
  • 14. What’s your first reaction when you know the disaster happened?
  • A. Call for help loudly B. Look for people around to help C. Run blindly D. Stay where you are E. Listen to command arrangement f. Others
  • 15. Do you think it’s necessary to conduct lecture on urban travel or pre-exercises on evacuation for disaster prevention?
  • A. Yes B. No
  • 16. What other requirements do you have for your urban travel system?
  • _________________________________________________

References

  1. China Disabled Persons’ Federation. Available online: http://www.cdpf.org.cn/sjzx/cjrgk/201206/t20120626_387581.shtml (accessed on 8 February 2019).
  2. Wang, Y.L.; Wang, S.Y.; Zhu, J.Y.; Jiang, Y.H. The mind of going out of the disabled and psychological debugging of their going out. Guide Sci. Educ. 2011, 5, 171–172. [Google Scholar]
  3. Chen, F.; Ji, X.F.; Zhang, H.D. Progress and prospect of transportation equity in urbanization process. Hum. Geogr. 2014, 29, 10–17. [Google Scholar]
  4. Zhang, J.; Wang, T.Y. Study on fairness of urban transportation system development and empirical analysis. World Sci.-Tech. R&D 2015, 37, 258–263. [Google Scholar]
  5. Cervero, R.; Day, J. Suburbanization and transit-oriented development in China. Transp. Policy 2008, 15, 315–323. [Google Scholar] [CrossRef]
  6. Zhong, Y.X.; Lu, Y.L. Assessment of Fair Space of Opportunities for Regional Development Based on Accessibility—A Case of Jiangxi Province. Sci. Geogr. Sin. 2009, 37, 258–263. [Google Scholar]
  7. Sanchez, T.W. The connection between public transit and employment: The cases of Portland and Atlanta. J. Am. Plan. Assoc. 1999, 65, 284–296. [Google Scholar] [CrossRef]
  8. Litman, T. Evaluating Transportation Equity: Guidance for Incorporation Distributional Impacts; Victoria Transport Policy Institute: Victoria, BC, Canada, 1997. [Google Scholar]
  9. Chen, F.; Ji, X.F. Impacts Analysis of Transportation Equity under Urban Transportation Policy. J. Kunming Univ. Sci. Technol. (Soc. Sci. Ed.) 2011, 11, 7–10. [Google Scholar]
  10. Welch, T.F. Equity in transport: The distribution of transit access and connectivity among affordable housing units. Transp. Policy 2013, 30, 283–293. [Google Scholar] [CrossRef]
  11. Pearson, R.G.; Joost, M.G. Egress behavior response times of handicapped and elderly subjects to simulated residential fire situations. The Bureau 1983. [Google Scholar]
  12. Clark-Carter, D.D.; Heyes, A.D.; Howarth, C.I. The efficiency and walking speed of visually impaired people. Ergonomics 1986, 29, 779–789. [Google Scholar] [CrossRef]
  13. Shields, T.J. Fire and disabled people in buildings. J. R. Soc. Promot. Health 1994, 114, 304–308. [Google Scholar] [CrossRef]
  14. Dunlop, K.E.; Shields, T.J.; Silcock, G.W.H. Towards the quantification of emergency egress capabilities for disabled people. Fire Eng. Emerg. Plan. 1996, 154–161. [Google Scholar]
  15. Boyce, K.E.; Shields, T.J.; Silcock, G.W.H. Toward the characterization of building occupancies for fire safety engineering: Capabilities of disabled people moving horizontally and on an incline. Fire Technol. 1999, 35, 51–67. [Google Scholar] [CrossRef]
  16. Jiang, C.S.; Zheng, S.Z.; Yuan, F. Current status and trends of evacuation safety research on the disables. China Saf. Sci. J. 2009, 19, 161–166. [Google Scholar]
  17. Qian, H.W.; Yin, X.J.; Jin, Y.S. Study on the management technical system of aid of vulnerable groups in earthquake emergency shelters during the disaster. J. Catastrophol. 2016, 31, 164–170. [Google Scholar]
  18. Zhang, S.; Zeng, J.; Liu, X.Y.; Ding, S.Y. Effect of obstacle density on the travel time of the visually impaired people. Fire Mater. 2019, 43, 162–168. [Google Scholar] [CrossRef]
  19. Zhang, S.; Zeng, J.; Ren, L.H.; Liu, X.Y. Investigation and building renovation on the acoustic environment of Tianjin Eye Hospital. Build. Energy Effic. 2016, 44, 56–59. [Google Scholar]
  20. An, T.Y.; Deng, X.M. Investigation on the implementation of Barrier-free regulations in Beijing. Build. Sci. 2011, 05, 85–88. [Google Scholar]
  21. Zhou, X.; Jin, X.; Wang, Y.; Wang, F. Research and thinking on Changsha blind-path construction and usage Situation. Chin. Overseas Archit. 2011, 4, 50–51. [Google Scholar]
  22. Tianjin Municipal People’s Government. Available online: http://www.tj.gov.cn/tj/tjgk/qhyrk/rkymz/ (accessed on 8 February 2019).
  23. Li, X.M.; Liu, C.F. Accessibility and service of Shenyang surban parks by network analysis. Acta Ecol. Sin. 2009, 29, 1554–1562. [Google Scholar]
  24. Shi, T.; Li, J.Y.; Li, Y.; Yin, H.Y. Analysis of urban park accessibility in Shenyang City. Chin. J. Ecol. 2016, 35, 1345–1350. [Google Scholar]
  25. Ghanbari, A.; Ghanbari, M. Assessing spatial distribution of Tabriz Parks by GIS (compared network analysis and buffering). Geogr. Environ. Plan. 2013, 24, 223–234. [Google Scholar]
  26. Oh, K.; Jeong, S. Assessing the spatial distribution of urban parks using GIS. Landsc. Urban Plan. 2007, 82, 25–32. [Google Scholar] [CrossRef]
  27. Zhang, S.; Zeng, J.; Liu, X.Y. A research on emergency evacuation mode of visually impaired people. J. Catastrophology 2018, 33, 69–73. [Google Scholar]
Figure 1. (a) The location of study area, (b) The current situation boundary of the study area.
Sustainability 11 01735 g001
Figure 2. Design structure of the questionnaire survey.
Sustainability 11 01735 g002
Figure 3. Travel destination selection for visually impaired people.
Sustainability 11 01735 g003
Figure 4. (a) Transportation choice; (b) Travel mode choice.
Sustainability 11 01735 g004
Figure 5. The distribution of travel destinations and blind sidewalk system of research areas.
Sustainability 11 01735 g005
Figure 6. (a) Network service area analysis of disabled service centres based on current blind sidewalk system; (b) Network service area analysis of urban parks based on current blind sidewalk system; (c) Network service area analysis of other relevant travel destinations based on current blind sidewalk system.
Sustainability 11 01735 g006
Figure 7. (a) Distribution of the re-planned blind sidewalk system in the research area; (b) Data comparison between re-planned and current blind sidewalk system in the research area.
Sustainability 11 01735 g007
Figure 8. (a) Network service area analysis of disabled service centres under re-planned blind sidewalk system; (b) Network service area analysis of urban parks under re-planned blind sidewalk system; (c) Network service area analysis of other relevant travel destinations under re-planned blind sidewalk system.
Sustainability 11 01735 g008
Table 1. Travel mode for visually impaired people.
Travel ModeFirst ChoiceSecond ChoiceThird Choice
Individual travelWalkingSubway
Bus
Guide dog
Accompanied travelPrivate carSubway
Bus
__
Table 2. Travel distance for visually impaired people.
Travel time<10 min10–20 min20–30 min30–60 min>60 min
Average travel distance<432 m432–864 m864–1296 m1296–2592 m>2592 m
Maximum travel distance<666 m666–1332 m1332–1998 m1998–3996 m>3996 m
Minimum travel distance<288 m288–576 m576–864 m864–1728 m>1728 m
Table 3. Survey statistics of research area.
SubjectsNumberArea (km2)
Disabled server centres9-
Urban parks5635.9
Hospitals, restaurants, shopping malls and other places2057-
Residential areas18269.3
Research area-175.8
Table 4. Results of network service area analysis based on current blind sidewalk system.
Subjects400 m Service Area/Ratio *800 m Service Area/Ratio1000 m Service Area/Ratio
Disabled server centres1.5 km2/0.9%3.7 km2/2.1%4.8 km2/2.7%
Urban parks9.2 km2/5.2%21.3 km2/12.1%29.2 km2/16.6%
Hospitals, restaurants, shopping malls and other37.9 km2/21.6%82.5 km2/46.9%94.3 km2/53.6%
* Ratio of the service area to the research area.
Table 5. Result of network service area analysis based on re-planned blind sidewalk system.
Subjects400 m Service Area/Ratio*800 m Service Area/Ratio1000 m Service Area/Ratio
Disabled server centres1.9 km2/1.1%6.3 km2/3.6%9.7 km2/5.5%
Urban parks10.7 km2/6.1%35.1 km2/20.0%53.4 km2/30.4%
Hospitals, restaurants, shopping malls and other57.2 km2/32.5%94.3 km2/53.6%124.8 km2/71.0%
* Ratio of the service area to the research area.

