Investigation and Evaluation of Energy Consumption Performance for Hospital Buildings in China


School of Civil and Resource Engineering, University of Science and Technology Beijing, Beijing 100083, China
*
Author to whom correspondence should be addressed.
Sustainability 2019, 11(6), 1724; https://doi.org/10.3390/su11061724
Submission received: 20 February 2019
/
Revised: 15 March 2019
/
Accepted: 18 March 2019
/
Published: 21 March 2019
(This article belongs to the Section Energy Sustainability)
Abstract
:Energy use in hospitals is higher than other public buildings, so it is essential to investigate and evaluate its energy consumption performance to save energy. In this paper, a comprehensive investigation was conducted to study energy consumption of hospitals in China. The investigation results show that electricity use accounts for the maximum share in total energy consumption of hospitals, especially in south China. Improving air conditioning systems is the most direct and effective way for realizing hospital building energy savings. What’s more, a new evaluation system of energy-saving performance for hospital buildings was developed. This evaluation system could evaluate performance of energy use in hospital, find out the weakness of energy use, and provide improving suggestions. Furthermore, a kind of visual software was given by our paper, which can be used intuitively by practitioners to evaluate building energy consumption performance of a hospital.
1. Introduction
For the design of ‘nearly zero-energy’ buildings (NZEB) [1], there are two aspects needing to be considered, IEQ (Indoor Environmental Quality) and Energy saving/efficiency. First, at the international level (EU, USA) the new legislations claim that NZEB goals have to be reached in the presence of acceptable IEQ levels for occupants. This is especially for Health Facilities (hospital buildings) where IEQ requirements have to be calibrated by thinking about two different groups of people: on one hand the patients, and the medical/paramedic staff. Therefore, there are many literatures were conducted to investigate IEQ in hospital buildings [2,3,4,5,6,7,8,9,10]. Among them, Fanger’s studies are very important in the field of indoor environment quality, which have inspired (and still inspire) professional design engineers and academic researchers on human thermal comfort and indoor air quality [11]. Secondly, under the premise of considering IEQ, hospital energy saving research is also a very key issue.
As we know, building energy consumption has kept rising during the past few decades, and the proportion of building sections rose form 10% in 1980 to more than 30% now [12,13]. Recently, China has become the largest energy consumer in the world [14]. In particular, hospital’s energy use is more than twice as much as other general public buildings. The higher energy use in hospital buildings is due to the high space heating, cooling and ventilation loads, continuous operation for the majority of facilities, and high number of medical equipment [15]. Therefore, hospitals should be the most important in implementing energy saving and environmentally sustainable development [16].
First, it is significant to conduct a national statistical investigation of hospital energy consumption. In recent years, there are many related studies being developed. For example, in 1999 Ahmed H.S [17] suggested that the economic and technological considerations must be observed in the design and construction of hospitals in the low-income regions of developing countries. In 2007 in UK [15], in order to reduce primary energy consumption by 15% during this decade, for all existing buildings the healthcare target is to improve the total energy consumption to a level of 445 kWh/m2 and 550 kWh/m2 for good practice and typical practice, respectively. For Asia [18], Japanese researchers conducted a sensitivity analysis in structure optimization of energy supply systems for a hospital in 2007.
It can be concluded that there are not many comprehensive investigations of energy consumption performance of hospitals. Especially, in China, there is hardly any comprehensive energy investigation data of hospitals with different levels in all over climatic zones. This study, therefore, was motivated to conduct a comprehensive investigation to fill this gap for the first time. The purpose is to clarify the status of energy consumption, to identify and to illustrate the weak links for hospital buildings’ energy efficiency improvement.
Secondly, it is also necessary to give a reasonable evaluation of the energy consumption of hospital buildings based on this investigation. There are various rating systems that can be used on assessment in operation and management of energy systems in hospitals. BREEAM is the earliest rating system of green buildings and was created in U.K in 1990 [19,20]. Among the BREEAM products, BREEAM Healthcare version was developed in 2008 for green hospital buildings [21]. LEED is another commonly used green building rating system, which was launched by U.S. Green Building Council in 1998 [22,23,24]. Among the LEED products family, LEED for Healthcare was released by USGBC in 2011. What’s more, Green Guide for Health Care (GGHC) is created by Steering Committee from U.S. healthcare industry [25,26]. Rating systems in these developed countries have set a good example for other countries.
However, different countries have different characteristics of energy consumption and influence mechanisms, so the rating methods must suit the actual conditions of their own countries. Hence, in 2006, China issued Evaluation Standard for Green Building (ESGB), which is the first multi-objective and multi-level comprehensive evaluation standard of green building “environment performance grade” in China [27,28,29]. However, it is vacant in rating systems of hospitals in China. In this instance, a rating system of energy consumption in the hospital building sector needs to be established in China.
Therefore, in this study, the comprehensive energy investigation of hospitals in China was undertaken to investigate the status of energy consumption. Then a new evaluation system of energy consumption in operation and management for hospitals was established, and which can identify the weak links in energy efficiency of energy supply system of a hospital. The results obtained by this paper provide owners and operators of hospitals in China to enhance the efficient of energy-savings.
2. Investigation Methodology and Energy Structure of 100 Hospitals
2.1. Sample Description
In order to make comprehensive statistics on building energy consumption for hospitals in China, 100 hospitals were investigated. In this investigation, their annual and monthly energy consumption and energy consumption structure will be analyzed systematically.
First, as shown in Table 1, 100 selected hospitals were distributed in four climate zones: Frozen, cold, hot summer & cold winter, and hot summer & warm winter, which is due to that different zones have their own characteristics on energy consumption. It can be seen that most hospitals (38%) are located in hot summer & cold winter zone and there are 10 hospitals in frozen zone.
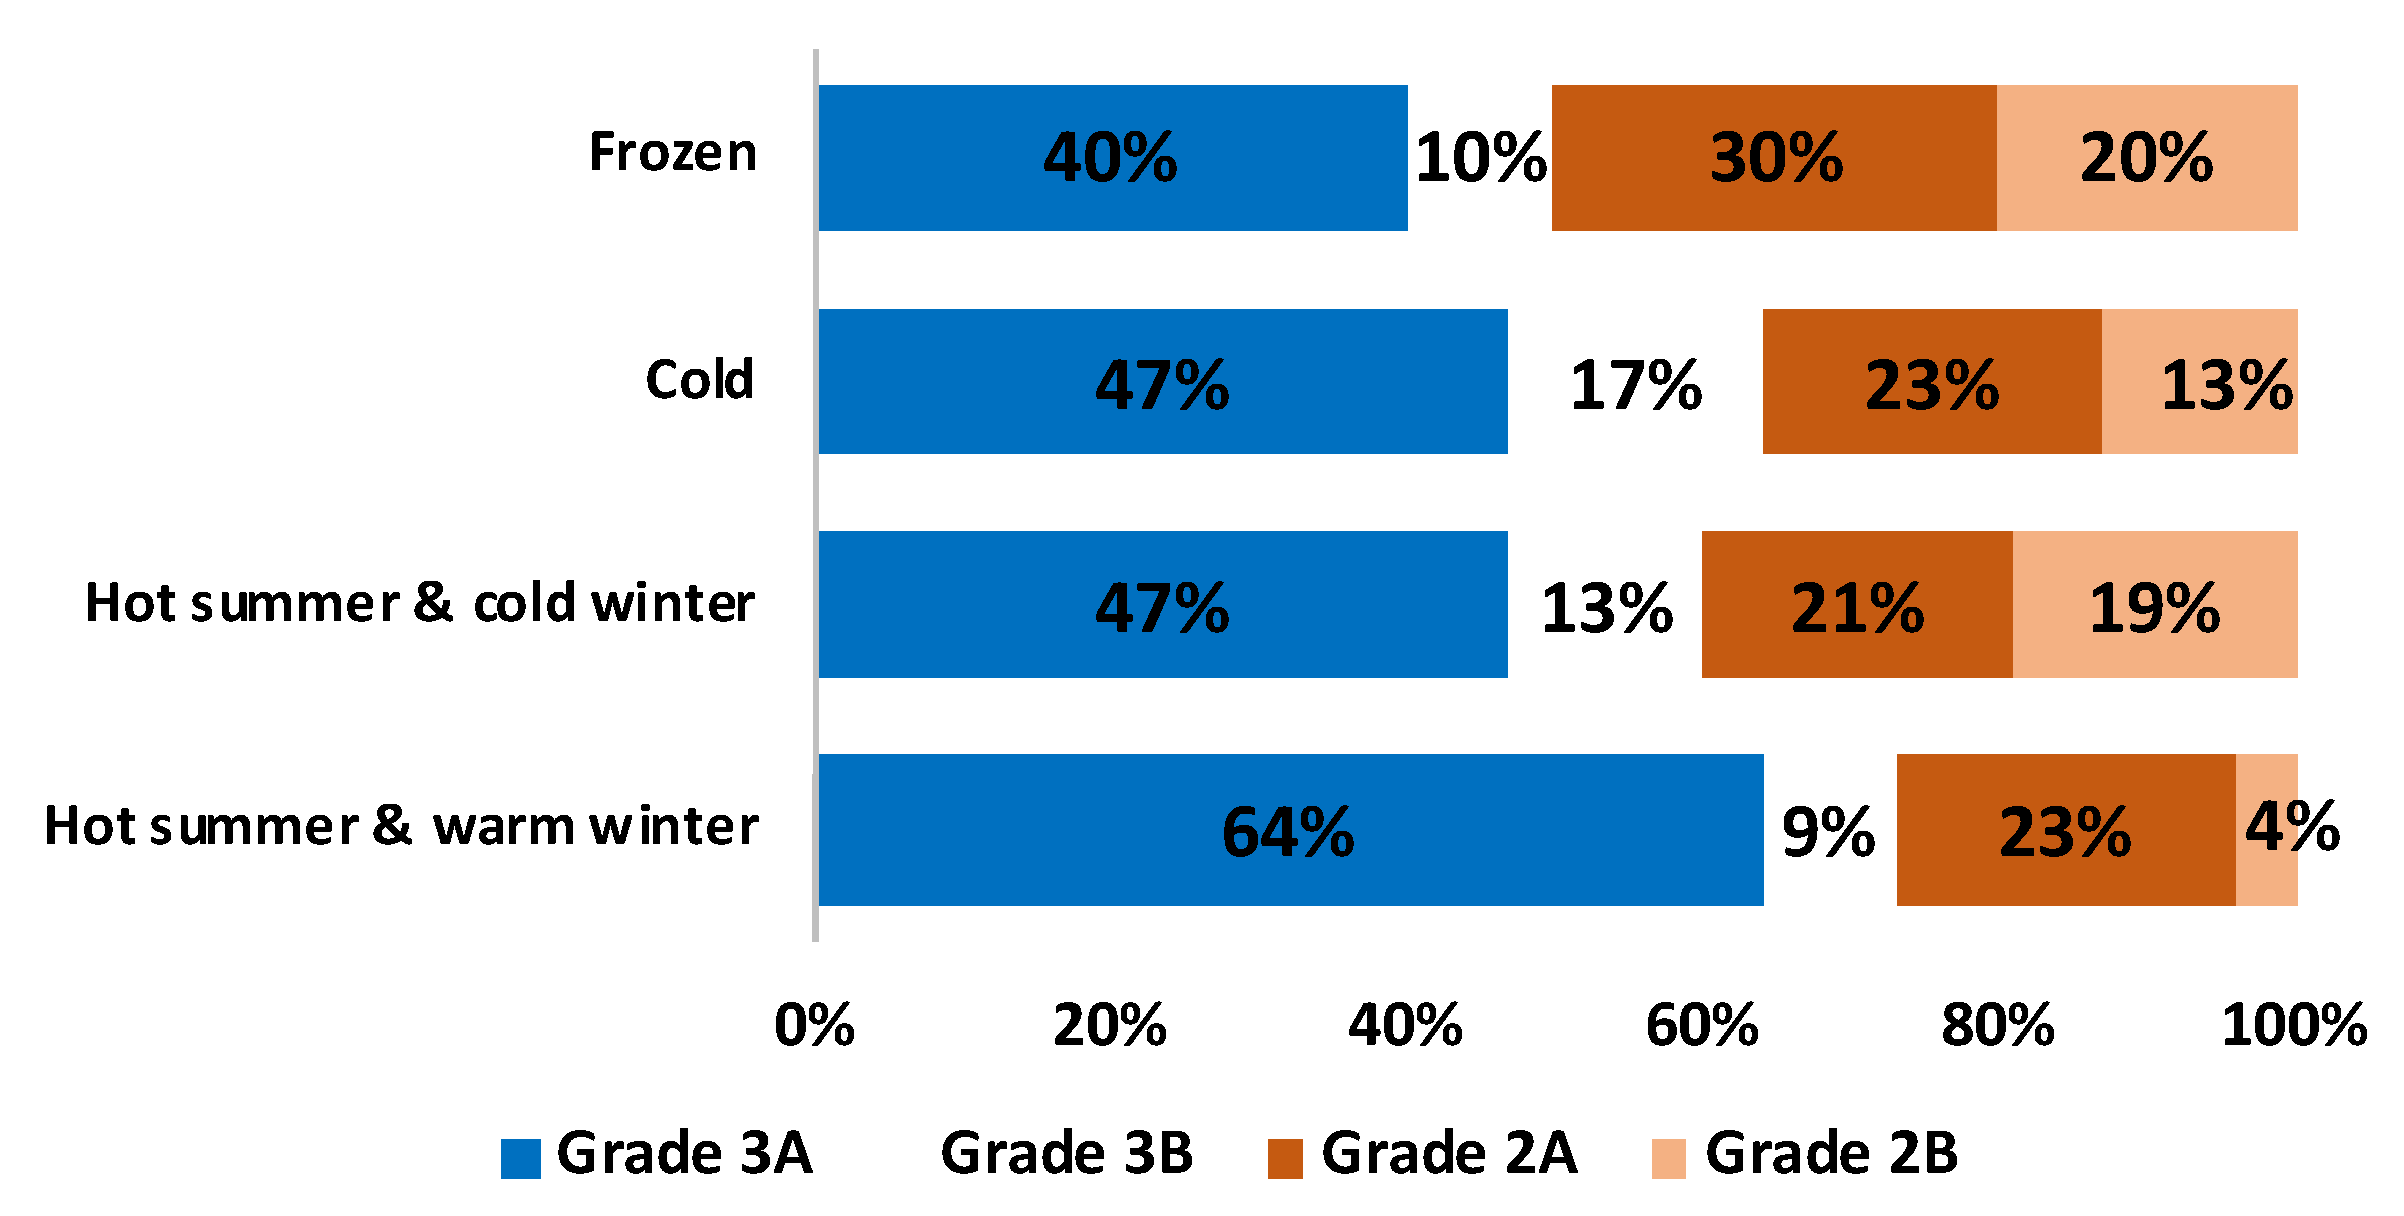
Secondly, the distribution of different grades of hospitals in different regions will greatly affect its distribution of energy consumption. Here, these 100 hospitals we investigated were selected based on different grades. As shown in Table 1 and Figure 1, according to hospital grade, 100 hospitals are divided into 4 categories: Grade 3A, Grade 3B, Grade 2A and Grade 2B. From Table 1 it can be concluded that in China roughly half of the hospitals are Grade 3A hospital. Moreover, Figure 1 indicated that, in the hot summer & warm winter areas, the proportion of Grade 3 hospitals is the largest (73%, in which 64% for Grade 3A hospitals and 9% for Grade 3B hospitals), while in the frozen region the proportion of the Grade 3 hospitals is the smallest (only 50%). At the same time, the hot summer & warm winter areas accounted for the smallest proportion of Grade 2 hospitals (27%, in which the proportion of Grade 2B is only 4%), while the frozen region accounted for the largest proportion of Grade 2 hospitals (50%, especially for Grade 2B hospitals the proportion is high to 20%).
Thirdly, hospital bed number also has an impact on its energy consumption. Therefore, as shown in Table 2, based on bed numbers, hospitals are also classified into 4 kinds. It can also be seen that for most of hospitals there are less than 1000 beds, while only 11 hospitals have bed numbers of more than 1500.
2.2. Analysis of Hospital Building Energy Structure
Before analyzing hospital building energy consumption, it is necessary to investigate their energy structures and find the main types of energy consumption. In this investigation, it is found that the energy supply systems in hospitals mainly consist of air conditioning system and domestic hot water supply system. Figure 2 shows the composition of energy structure (cooling and heating source) for each energy supply system.
Figure 2 indicates that hospital buildings use a variety of energy sources for heating and cooling, including electricity, renewable energy, nature gas and fossil fuel. Among them, electricity is most widely used as cooling source in air conditioning system, accounting for 74%. While natural gas is most commonly used as heating sources in both air conditioning system and domestic hot water supply system, accounting for 46% and 52%, respectively. It is interesting to note that, renewable energy utilization is mainly used in domestic hot water supply systems, accounting for 33%. However, the overall utilization of renewable energy is relatively small, and it needs to be improved.
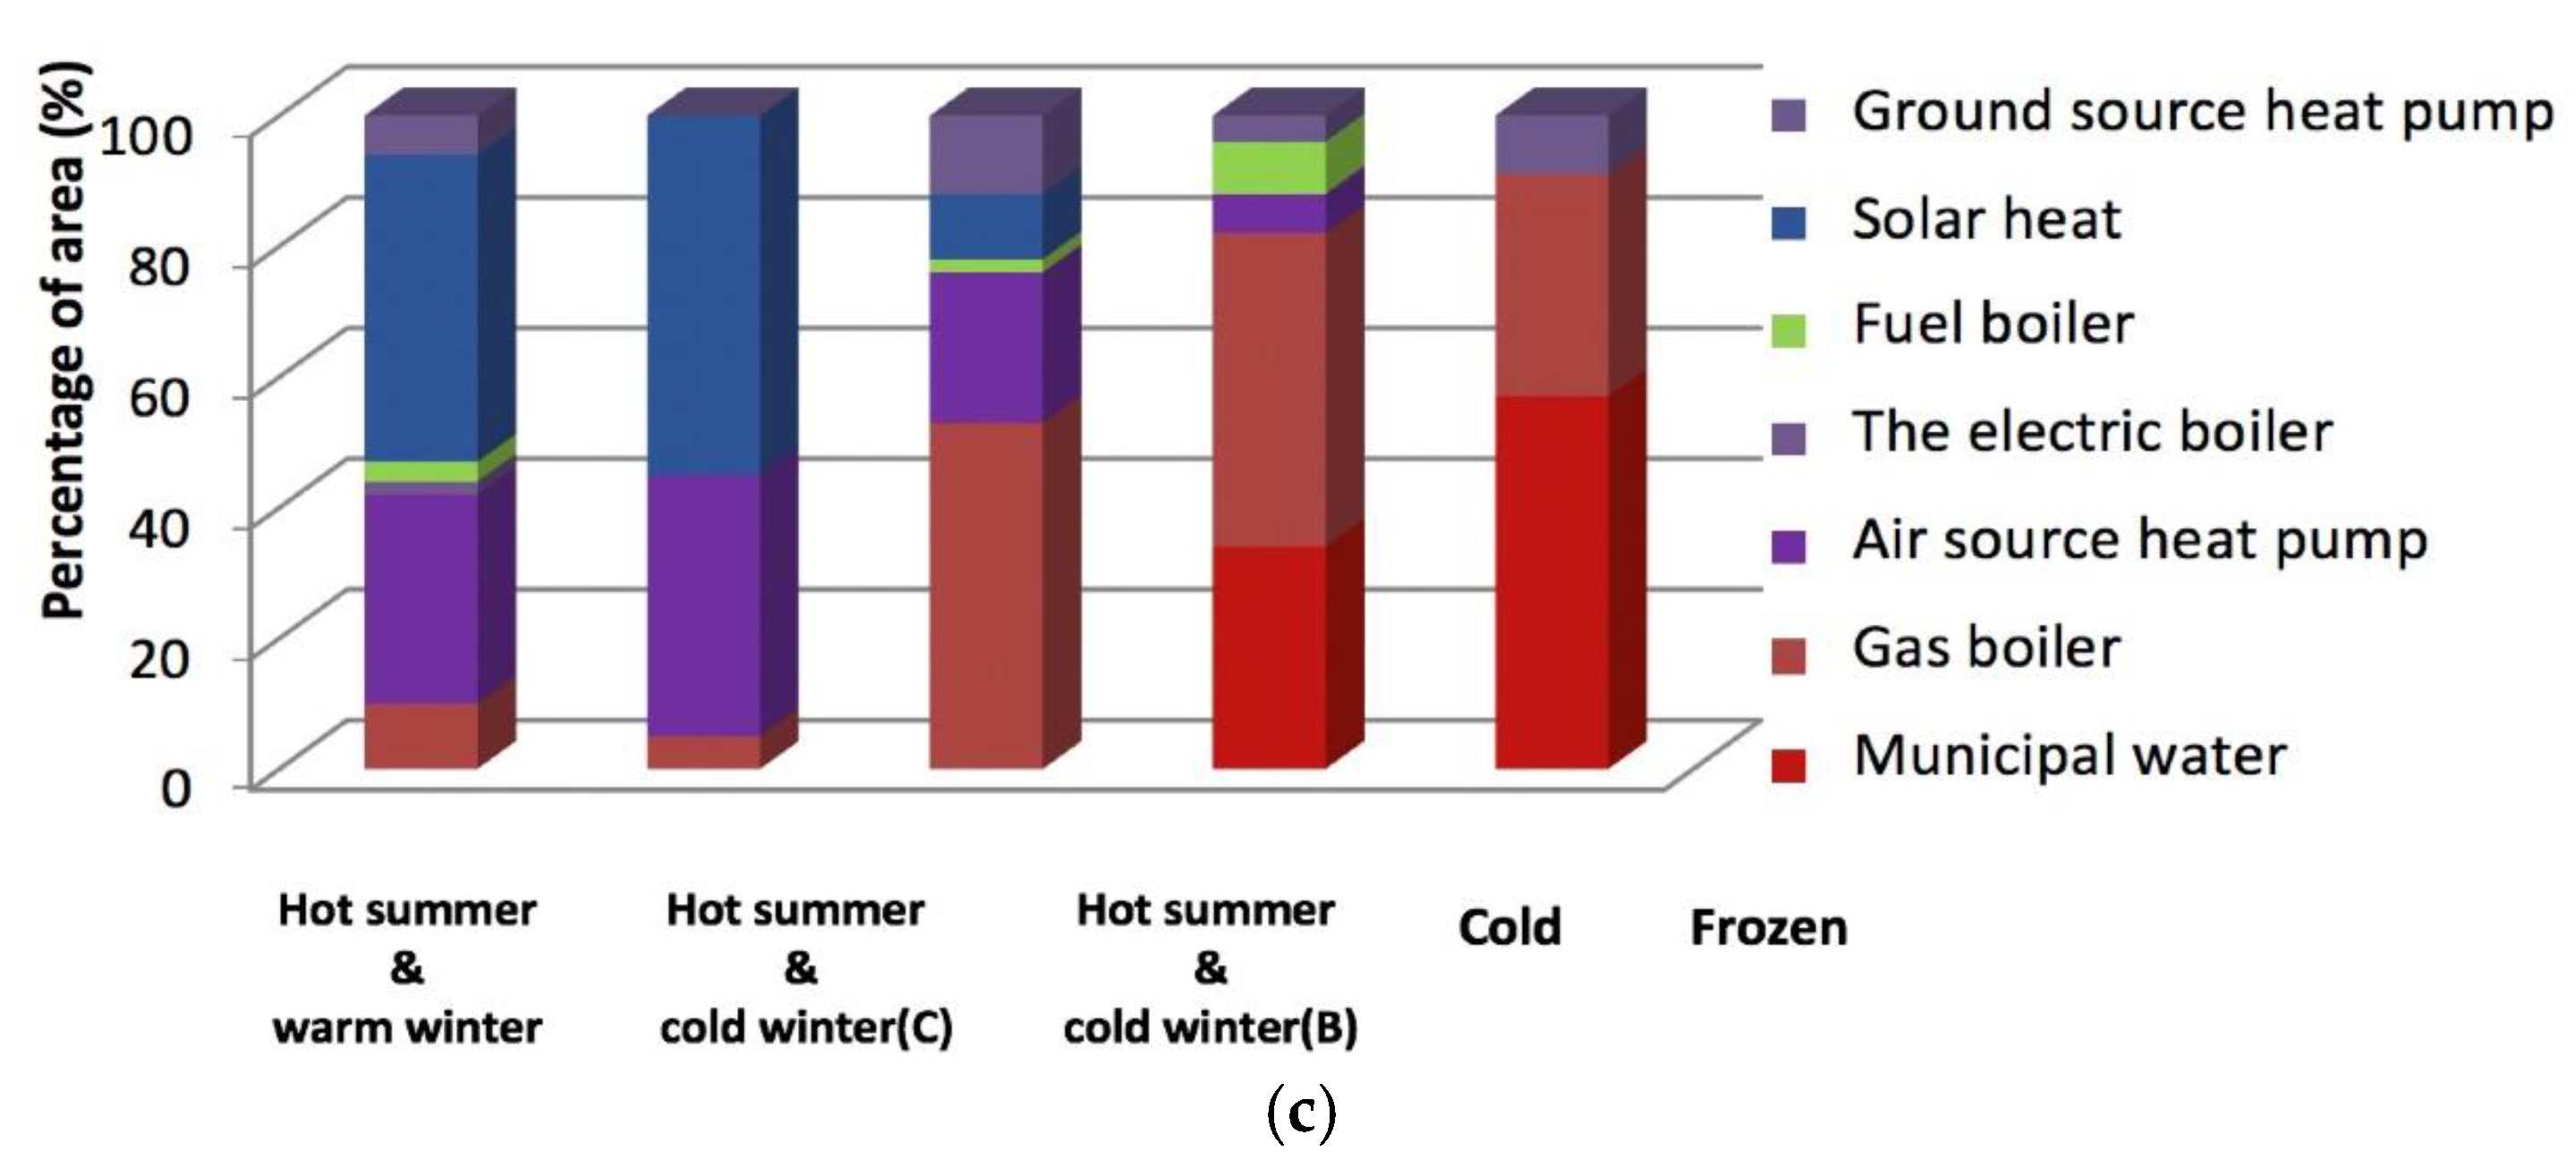
Moreover, according to these three kinds of cooling and heating sources, the percentage statistics of the specific energy supply system in different climate zones were made. That is, the ratio between the building area served by each energy supply system and the overall building area of the surveyed hospital in this climate zone, as shown in Figure 3. It can be seen that there are a variety of energy supply systems in each heating and cooling source, including split air conditioning, air source heat pump, ground source heat pump, lithium bromide chiller, screw chiller, centrifugal chiller, etc. Each energy supply system needs to consume its own energy structure, that is, the form of each energy supply system determines its corresponding energy structure. Therefore, from Figure 3, it can be further concluded that the composition of the energy structure in the cold and heat sources of hospitals. For example, in Figure 3a, two types of energy structures can be seen, namely electricity (corresponding energy supply systems are split air conditioning, lithium bromide chiller, screw chiller, centrifugal chiller) and renewable energy (corresponding energy supply systems are air source heat pump and ground source heat pump). And it turns out that electricity is used far more than renewable energy in any climate, which is consistent to the trend in cooling source of air conditioning systemin in Figure 2.
3. Energy Consumption Investigation Results of 100 Hospitals
3.1. Analysis of Hospital Building Energy Consumption
As analyzed in the previous section, electricity and natural gas are the two most used energy structures in these 100 hospitals. In this section, two kinds of energy consumption will be investigated, i.e., electricity consumption and total energy consumption. Here, electricity consumption was directly measured by flow meters. While, total energy consumption was calculated by the sum of electricity consumption and natural gas. Specifically, total energy consumption was defined as the equivalent calorific values of electricity consumption and gas usage (10.91 MJ/kWh and 17.6 MJ/m3, respectively) [30]. What’s more, the energy consumption bears definite seasonal characteristics, so two important energy statistical parameters, including annual energy consumption and monthly energy consumption, will be discussed in the next.
3.1.1. Electrical Consumption
Figure 4 and Figure 5 show the distribution of annual electricity consumption by 100 hospitals according to the climate zone category and the bed number category, respectively. Figure 4 indicates that there is a significant disparity among the four climatic regions. It can be seen that for hospitals in hot summer & warm winter zone annual electricity consumption is 140.7 kWh/m2, while the value is 45.2 kWh/m2 in frozen zone, which is 67.9% decreased. It can be concluded that annual electricity consumption is higher in the southern area in China than in northern area, which is caused by a lot of use of air conditioning systems in summer. Therefore, the south hospitals play the largest part in total electricity consumption, accounting for 39.1%.
Figure 5 shows annual electricity consumption by 100 hospitals according to bed number. It can be seen that annual electricity consumption per bed increased with increasing number of beds, i.e., for the hospital with more bed numbers there is a higher annual electricity consumption per bed. Specifically, for hospitals with 100~500 beds annual electricity consumption is 6515.9 kWh/bed, while the electricity consumption value is 7999.8 kWh/bed for hospitals with >1500 beds, which is 22.8% increased. However, it is interesting to note that, when the hospital’s bed number is over than 1000, the growth rate becomes smaller.
3.1.2. Total Energy Consumption
Figure 6 shows the values of annual total energy consumption by two grades hospitals according to the climate zone category. It can be seen that, for all climate zones, all of annual total energy consumptions in Grade 3 hospitals are higher than that in Grade 2 hospitals. Particularly for hospitals in frozen zone, the higher annual total energy consumption ratio is 1.2 times. The reason perhaps is that Grade 3 hospitals have the large building size and provide nationwide healthcare service, in which there are a large number of beds and patients. And in Grade 3 hospitals, the participation of central air conditioning systems is relatively high [31], which also results in high energy demand. In addition, in China Grade 3 hospitals, as large national hospitals, often operate 24 h a day, which resulting in that the demand for energy supply is also continuous. Therefore, Grade 3 hospitals have the higher annual total energy consumptions.
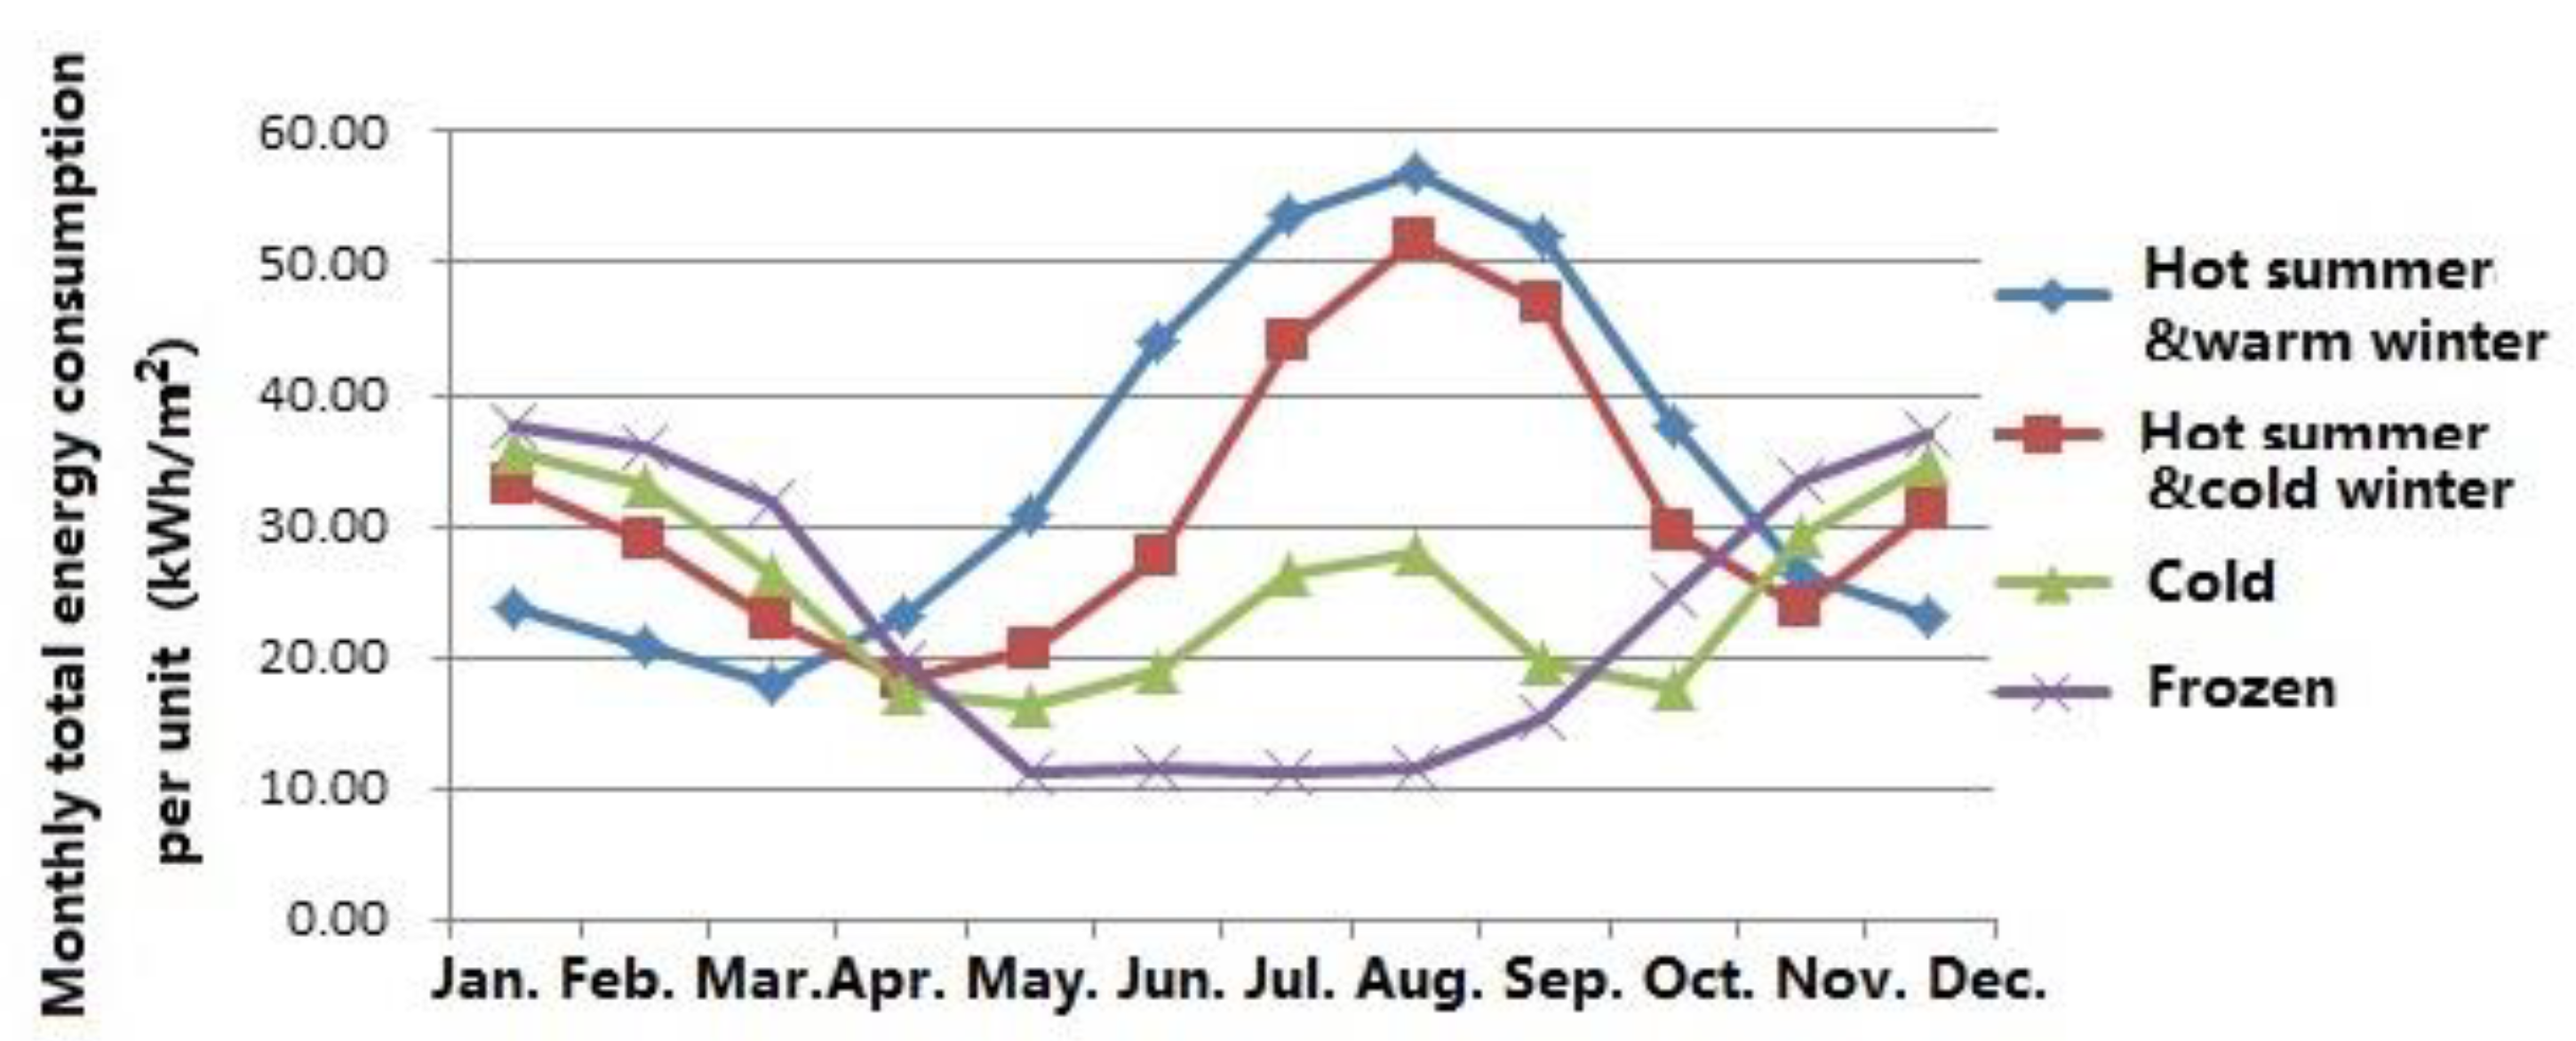
Figure 7 shows that the distribution of monthly total energy consumption per unit according to the climate zone category. It can be seen that in hot summer & warm winter zone, the trend of monthly total energy consumption fluctuates dramatically and reaches a peak in August. It can be concluded from the figure that, for most of the year (April to October), the energy consumption in hot summer & warm winter zone is the highest in the four climate zones, and much higher than that in cold region and frozen region. While in frozen zone, energy use in winter is higher than that in other zones, but compared with most other months, its energy consumption is only slightly higher. This phenomenon, therefore, further reflects the importance of the impact of the hospital grade distribution on the energy consumption per unit area in the different climatic zone.
Figure 8 and Figure 9 show annual total energy consumption by 100 hospitals according to the climate zone category and the bed number category, respectively. It is interesting to note that, compared with the annual electricity consumption, annual total energy consumption shows the consistent trend.
First, Figure 8 illustrates that the total energy consumption in south hospitals is still higher than that in north hospitals, and the corresponding values are 278.7 kWh/m2, 300.5 kWh/m2, 379.6 kWh/m2 and 414.6 kWh/m2 for frozen, cold, hot summer & cold winter, and hot summer & warm winter zone, respectively. It can be noticed that, in the hot summer & warm winter areas, annual total energy consumption is the highest, the frozen region has the smallest. This phenomenon is consistent with the trend of hospital number with different grade in Figure 1 and the conclusion in Figure 7. As indicated in Figure 6, annual total energy consumptions in Grade 3 hospitals is much higher than that of Grade 2 hospitals due to their scale and facilities. Moreover, in areas of hot summer & warm winter, the proportion of Grade 3 hospitals in the survey scope is far greater than that in frozen areas (in Figure 1). As a result, the annual total energy consumption in hot summer & warm winter areas is the highest among the four climatic zones, while that in cold areas it is lower than the average.
Figure 9 shows that the average annual total energy consumption per bed for hospitals with different bed numbers exerts same growth pattern with electricity consumption. However, there are some fluctuations in the maximum and minimum values for hospitals with large bed numbers. For example, there is one hospital with a capacity of 1000~1500 beds having higher total energy consumption than that in hospitals with over 1500 beds (20,282.4 kWh/bed for hospital with 1000~1500 beds, and 19,733.6 kWh/bed for hospital with >1500 beds).
3.2. Analysis on the Energy Consumption Cost
Analysis on hospital energy consumption should focus on the amount of energy consumed, but also the cost of energy use. Therefore, in this section, the sources of energy use costs and the energy end components of the highest cost source will be investigated.
As shown in the Figure 10a, it can be seen that for hospitals in China the energy use cost sources include electricity, steam, water, medical, gas, and others. Figure 10a also indicates that electricity costs the most, which accounts for up to 64%. Then the cost of steam comes second, which takes up 16%. While the total cost of other types only account for 20%. It can be concluded that electricity plays a key role in hospitals, which is the most direct and effective way for achieving energy savings in hospital buildings.
Figure 10b shows energy end components of electricity. As shown in this figure, air conditioning systems account for the maximum share (50%), which is roughly the same as the sum of other energy end. So how to improve the efficiency of air conditioning is the key to energy saving in hospitals.
In addition, in order to further analyze the energy use costs, this investigation on energy end will be conducted based on space composition of hospital buildings, including outpatient area and inpatient area. The outpatient area comprises operating rooms, surgical theatres, their interconnecting hallways, and ancillary work areas, while ward is a major part in inpatient area.
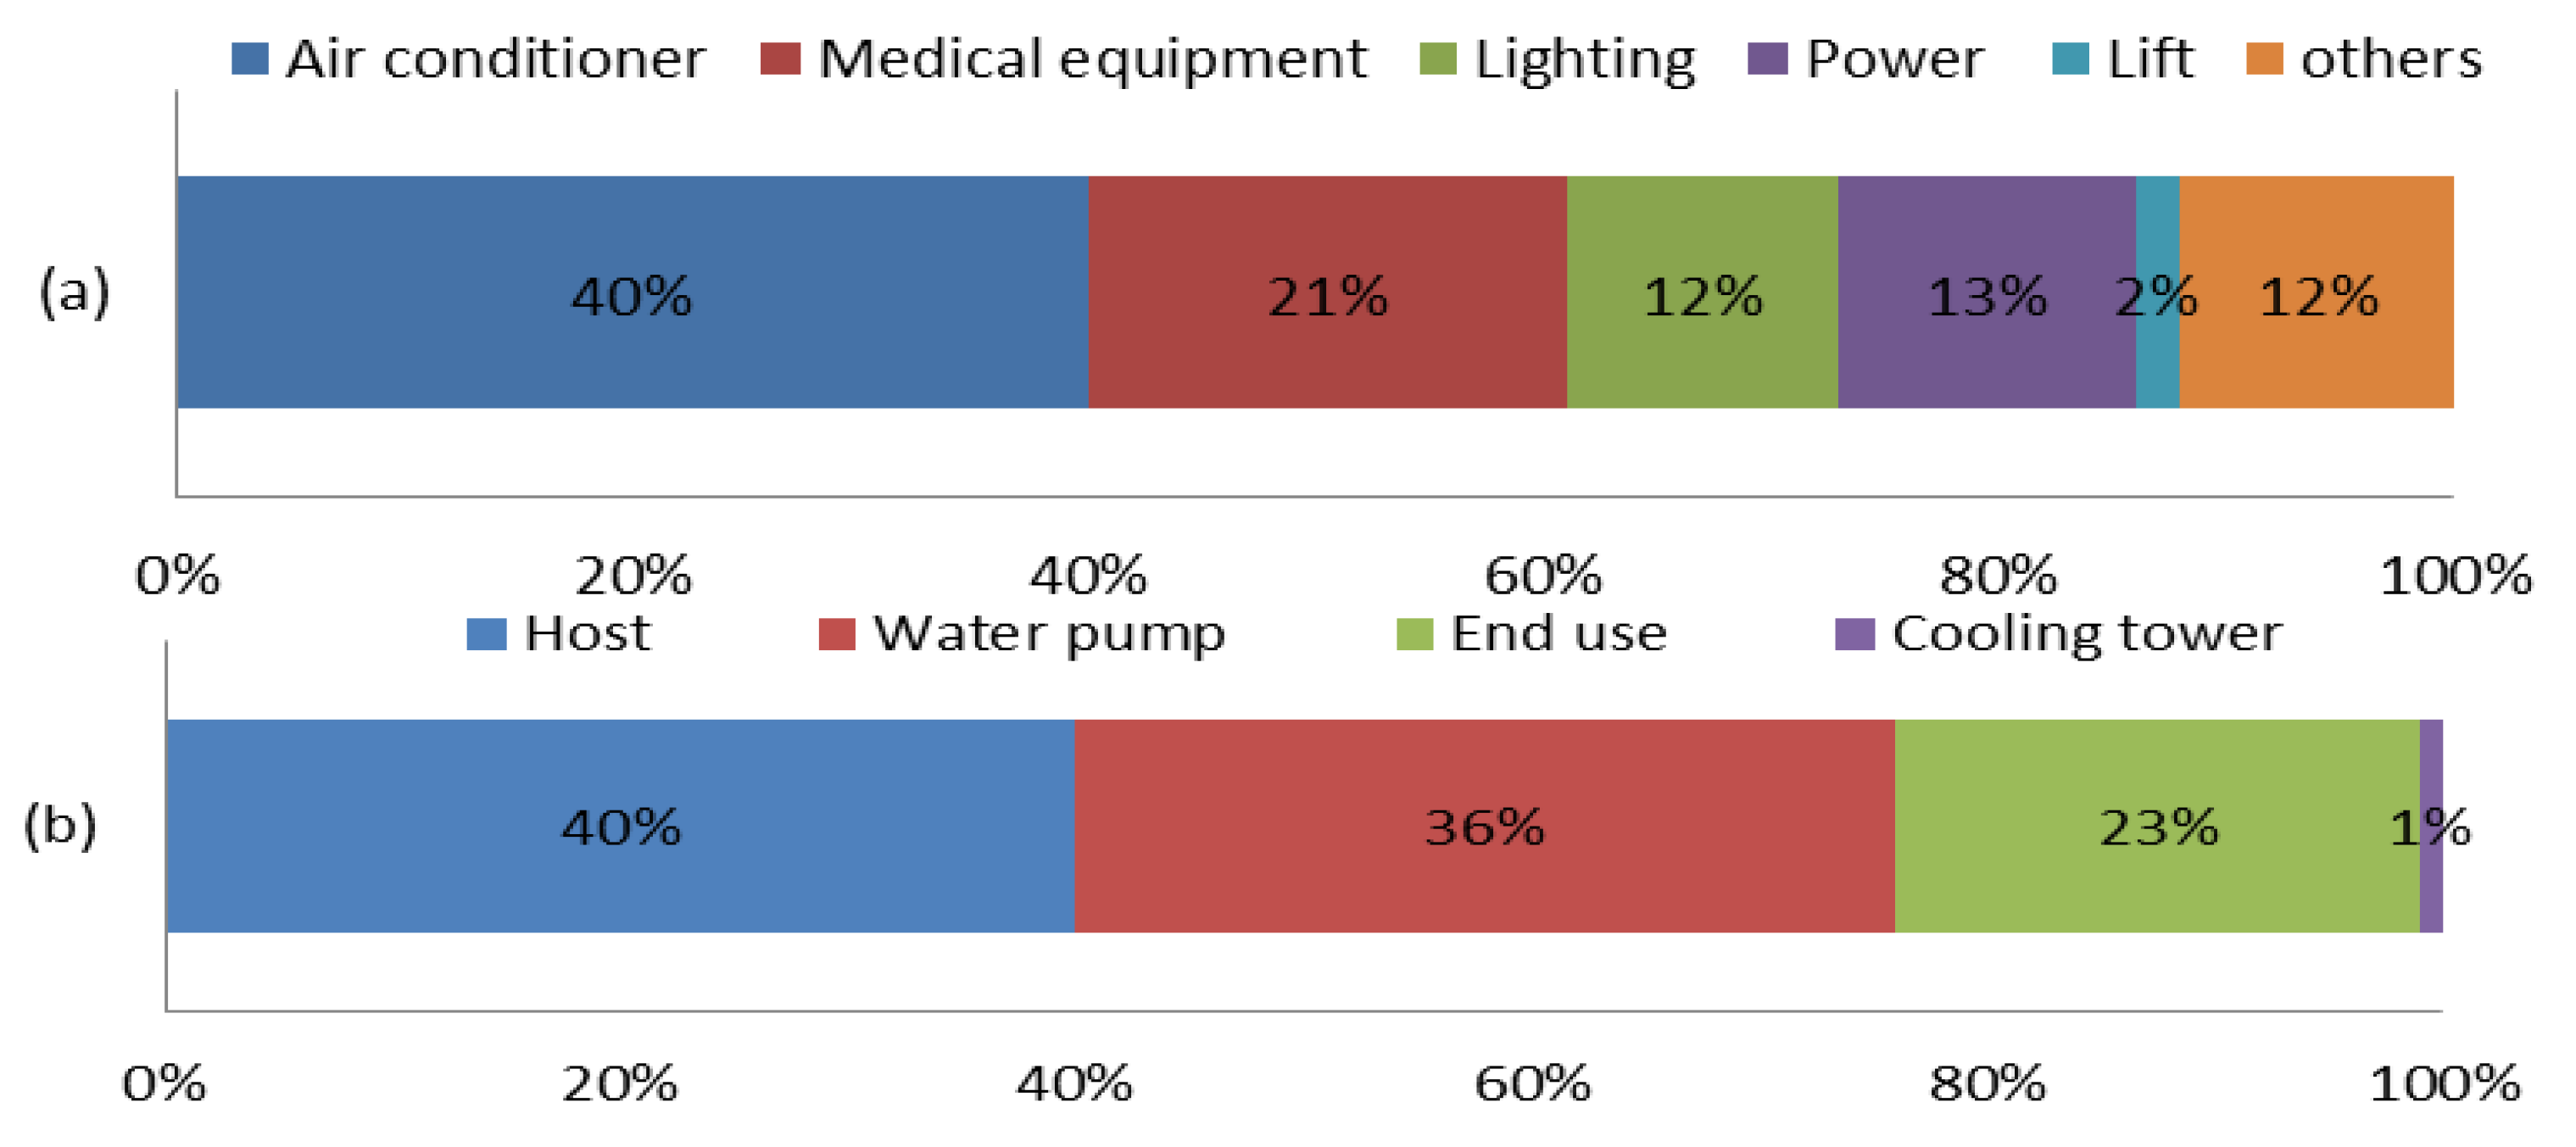
First, Figure 11 indicates that, in outpatient area, the highest electricity consumption is attributed to air conditioning systems, which make up to 40%. Specifically, the energy costs by the host and water pump are the two major compositions in air conditioning systems, which account for 40% and 36%, respectively.
Second, Figure 12 indicates that, in inpatient area, the highest electricity consumption is also attributed to air conditioning systems, accounting for 63%. Specifically, in air conditioning systems, the energy cost of the host is the highest, which accounts for 70%, much higher than those of the other air conditioning system equipment.
4. Evaluation of Building Energy-Saving
According to the investigation above, it can be concluded that there is a specific trend of energy consumption of hospital buildings, and operation and management is very important to hospital building, while, at present, there is no national standard for the operation and management of hospital buildings in China. Due to the difference of national conditions, there are obvious differences in relevant codes and standards, so foreign standards cannot be blindly copied. Moreover, the existing evaluation indexes “green hospital building evaluation standard” in China has some shortcomings in operation evaluation. Therefore, this paper attempts to establish an evaluation system suitable for China’s national conditions and targeted at the operation and management of hospital buildings.
Combined with investigation results, this paper proposed a novel evaluation system of building energy-saving for hospitals in China. The establishment of the evaluation system is based on a careful analysis of LEED HC in US, GGHC operations and Assessment Standard for Healthcare Green Building in China. This evaluation system consists of three indexes, which are the comprehensive index (Ie), the index of energy saving performance (Ip), and the index of energy saving level (Il). The relationship of these three indexes is shown as follows. In this formula, a and b are constant, and their values are 10 and 7, respectively.
4.1. The Index of Energy Saving Level
According to the results of our investigation, we can calculate the average annual total energy consumption () of hospital buildings in each bed number range, as shown in Table 3. Then energy saving level () can be got by Equation (2), i.e., the ratio of to total annual energy consumption of a hospital (). Then according to the tri-sectional quantile of Il score, hospitals could be divided into three groups, as shown in Table 4.
4.2. The Index of Energy Saving Performance
The scores of Ip were calculated through comprehensive consideration of performances of different evaluation items, such as subentry measures, building automation, air conditioning unit energy-saving, renewable energy utilization, pump frequency control, heat recovery of exhaust air, condensation water recovery, natural cooling, intelligent lighting, energy-saving lamps and reduction in water use. Here, the calculation of Ip will strengthen consideration on high energy consumption items, such as air conditioning system and lighting system (as mentioned in Section 2). According to the scores of Ip, hospitals were divided into four groups, as shown in Table 5.
4.3. The Comprehensive Index
Finally, Ie can be calculated by bringing Il and Ip of the hospital into the formula 1. As shown in Table 6, hospitals are classified into four levels. Specifically, three stars (★★★) are awarded for a hospital with the best energy-saving level and performance, while zero star (☆) is for a hospital with the worst energy-saving level and performance.
4.4. Visual Application of Evaluation System
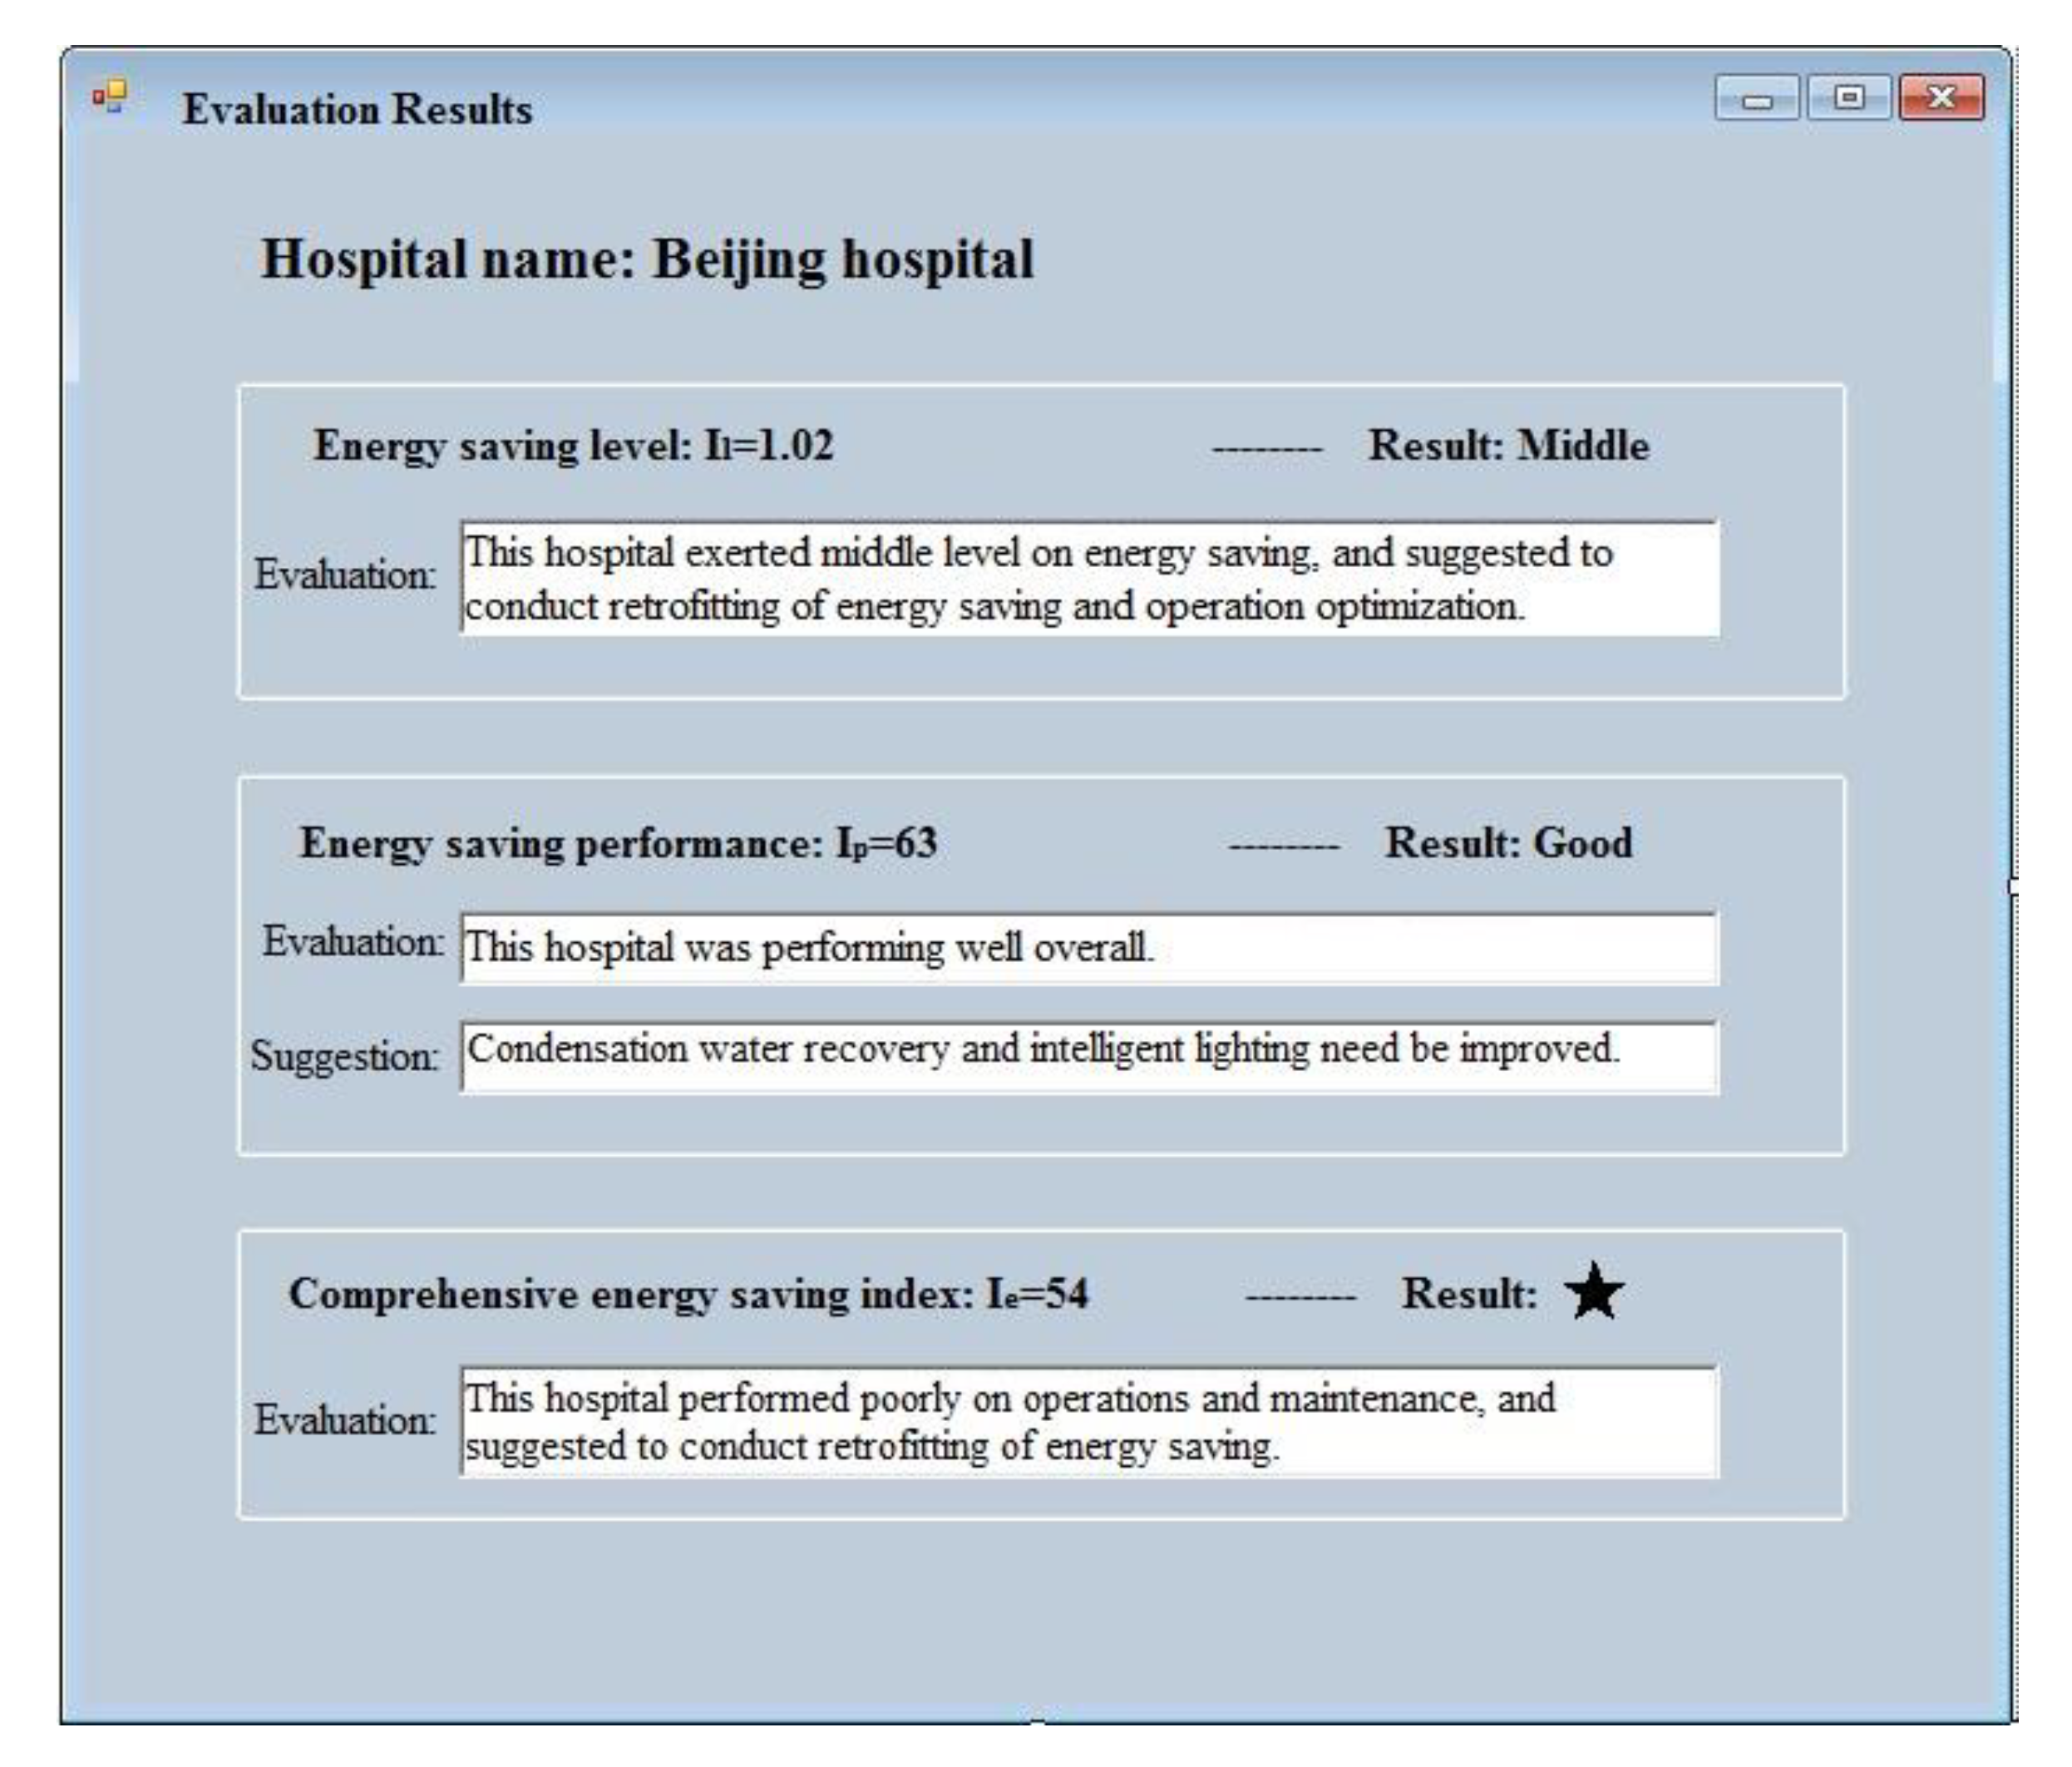
Section 4.1, Section 4.2 and Section 4.3 described the evaluation index composition and its calculation procedure, which is affected by many parameters of the energy consumption and energy supply system of hospitals. Therefore, considering the application convenience, this paper further gave visual software as shown in Figure 13, which can be applied by practitioners evaluating the building energy consumption performance. Practitioners only input relevant parameters of one hospital, and the output will be given by this visual software (Figure 14).
5. Conclusions
This study carried out a comprehensive energy use investigation of hospitals in China. The investigation results indicate that electricity consumption is the highest in the total energy consumption, which accounts for 64%. Air conditioning system accounts for the maximum share in electricity consumption, especially in south China. Therefore, saving electricity in the south hospital is the most direct way for achieving hospital energy savings.
Then a novel rating system of energy consumption in operation and management for Chinese hospitals was established. This rating system can evaluate energy use performance of a hospital, which also can be compared to another hospital due to using a standard evaluation process. What’s more, this evaluation system can find out weak links of energy use and provide corresponding improving suggestions. Furthermore, to achieve these evaluations, a kind of visual software was given by our paper, which can be easily used by practitioners.
Through the results of this investigation and rating system, some suggestions on energy saving in hospitals were given as follows. Compared with other types of public buildings, the function of hospital buildings is much more complex, and the healthcare environment is under strict control. Therefore, hospital energy saving must start from the concept of comprehensive energy utilization and energy balance. And the traditional measures of hospital energy saving need to be changed and conducted based on the comfort of the healthcare environment. During the expansion of the hospital, the energy supply and demand of the whole hospital should be comprehensively planned to achieve energy balance as far as possible, to improve the efficiency of the system, and to strengthen the heat recovery and utilization. Only in this way, the energy saving in hospital buildings can be realized with the assurance of the service level of the hospital.
Finally, this investigation is only a first step of a more in-depth analysis where energy assessment has to be carried out simultaneously to IEQ investigations.
Author Contributions
R.J. and S.Q. jointly designed the research paper and reviewed the paper findings; R.J. analyzed the data, and wrote the major parts of the manuscript; and S.Q. reviewed and revised the manuscript prior to the submission.
Funding
This research was funded by National Key R&D Plan of China [2017YFC0702600].
Conflicts of Interest
The authors declare no conflict of interest.
References
- Vanhoutteghem, L.; Skarning, G.C.J.; Hviid, C.A.; Svendsen, S. Impact of façade window design on energy, day lighting and thermal comfort in nearly zero-energy houses. Energy Build. 2015, 102, 149–156. [Google Scholar] [CrossRef]
- Alfano, F.R.D.A.; Olesen, B.W.; Palella, B.I.; Riccio, G. Thermal comfort: Design and assessment for energy saving. Energy Build. 2014, 81, 326–336. [Google Scholar] [CrossRef]
- Del Ferraro, S.; Iavicoli, S.; Russo, S.; Molinaro, V. A field study on thermal comfort in an Italian hospital considering differences in gender and age. Appl. Ergon. 2015, 50, 177–184. [Google Scholar] [CrossRef] [PubMed]
- Golbazi, M.; Aktas, C.B. Analysis of Credits Earned by LEED Healthcare Certified Facilities. Procedia Eng. 2016, 145, 203–210. [Google Scholar] [CrossRef] [Green Version]
- Han, J.; Zhang, G.; Zhang, Q.; Zhang, J.; Liu, J.; Tian, L.; Zheng, C.; Hao, J.; Lin, J.; Liu, Y.; et al. Field study on occupants’ thermal comfort and residential thermal environment in a hot-humid climate of China. Build. Environ. 2007, 42, 4043–4050. [Google Scholar] [CrossRef]
- Pourshaghaghy, A.; Omidvari, M. Examination of thermal comfort in a hospital using PMV-PPD model. Appl. Ergon. 2012, 43, 1089–1095. [Google Scholar] [CrossRef] [PubMed]
- Sattayakorn, S.; Ichinose, M.; Sasaki, R. Clarifying thermal comfort of healthcare occupants in tropical region: A case of indoor environment in Thai hospitals. Energy Build. 2017, 149, 45–57. [Google Scholar] [CrossRef]
- Skoog, J.; Fransson, N.; Jagemar, L. Thermal environment in Swedish hospitals: Summer and winter measurements. Energy Build. 2005, 37, 872–877. [Google Scholar] [CrossRef]
- Khalid, W.; Salim, S.A.Z.S.; Rijal, H.B.; Yakub, F. Thermal Comfort in Hospitals in Hot and Humid Climates: A Literature Review. In Proceedings of the 1st Green Environmental Energy and Building Science (GEEBS) International Conference, Johor Bahru, Malaysia, 16–17 October 2017. [Google Scholar]
- Yau, Y.H.; Chew, B.T. Thermal comfort study of hospital workers in Malaysia. Indoor Air 2009, 19, 500–510. [Google Scholar] [CrossRef] [PubMed]
- Alfano, F.R.D.; Olesen, B.W.; Palella, B.I. Povl Ole Fanger’s Impact Ten Years Later. Energy Build. 2017, 15, 243–249. [Google Scholar] [CrossRef]
- Si, B.; Tian, Z.; Chen, W.; Jin, X.; Zhou, X.; Shi, X. Performance Assessment of Algorithms for Building Energy Optimization Problems with Different Properties. Sustainability 2018, 11, 18. [Google Scholar] [CrossRef]
- Ji, R.; Zhang, Z.; He, Y.; Liu, J.; Qu, S. Simulating the effects of anchors on the thermal performance of building insulation systems. Energy Build. 2017, 140, 501–507. [Google Scholar] [CrossRef]
- Wang, Q.; Zhou, P.; Zhao, Z.; Shen, N. Energy Efficiency and Energy Saving Potential in China: A Directional Meta-Frontier DEA Approach. Sustainability 2014, 6, 5476–5492. [Google Scholar] [CrossRef] [Green Version]
- Balaras, C.A.; Dascalaki, E.; Gaglia, A. HVAC and indoor thermal conditions in hospital operating rooms. Build. Environ. 2007, 39, 454–470. [Google Scholar] [CrossRef]
- Meegoda, J.; Hsieh, H.N.; Rodriguez, P.; Jawidzik, J. Sustainable Community Sanitation for a Rural Hospital in Haiti. Sustainability 2012, 4, 3362–3376. [Google Scholar] [CrossRef] [Green Version]
- Sherif, A.H. Hospitals of Developing Countries: Design and Construction Economics. J. Archit. Eng. 1999, 5, 74–81. [Google Scholar] [CrossRef]
- Shu, Y.; Ito, K.; Yokoyama, R. Sensitivity analysis in structure optimization of energy supply systems for a hospital. Energy Conv. Manag. 2007, 48, 2836–2843. [Google Scholar]
- Schweber, L. The effect of BREEAM on clients and construction professionals. Build. Res. Inf. 2013, 41, 129–145. [Google Scholar] [CrossRef]
- Schweber, L.; Haroglu, H. Comparing the fit between BREEAM assessment and design processes. Build. Res. Inf. 2014, 42, 300–317. [Google Scholar] [CrossRef] [Green Version]
- Alhorr, Y.; Arif, M.; Bano, T.; Egbu, C.; Mazroei, A.; Elsarrag, E. Creating a better healing environment in Qatari healthcare sector: Exploring the research agenda for the future. Int. J. Sustain. Built. Environ. 2015, 4, 158–164. [Google Scholar] [CrossRef] [Green Version]
- Ferreira, J.; Pinheiro, M.D.; Brito, J.D. Portuguese sustainable construction assessment tools benchmarked with BREEAM and LEED: An energy analysis. Energy Build. 2014, 69, 451–463. [Google Scholar] [CrossRef]
- Wu, P.; Song, Y.; Shou, W.; Chi, H.; Chong, H.Y.; Sutrisna, M. A comprehensive analysis of the credits obtained by LEED 2009 certified green buildings. Renew. Sustain. Energy Rev. 2017, 68, 370–379. [Google Scholar] [CrossRef]
- Azhar, S.; Carlton, W.A.; Olsen, D.; Ahmad, I. Building information modeling for sustainable design and LEED rating analysis. Autom. Constr. 2011, 20, 217–224. [Google Scholar] [CrossRef]
- Pradinuk, R. Incentivizing the Daylit Hospital: The Green Guide for Health Care Approach. HERD Health Environ. Res. Des. J. 2009, 2, 92–112. [Google Scholar] [CrossRef]
- Younger, M.; Morrow-Almeida, H.R.; Vindigni, S.M.; Dannenberg, A.L. The Built Environment, Climate Change, and Health: Opportunities for Co-Benefits. Am. J. Prev. Med. 2008, 35, 517–526. [Google Scholar] [CrossRef]
- Liu, Y.; Guo, X.; Hu, F. Cost-benefit analysis on green building energy efficiency technology application: A case in China. Energy Build. 2014, 82, 37–46. [Google Scholar] [CrossRef]
- Zhang, Y.; Wang, J.; Hu, F.; Wang, Y. Comparison of evaluation standards for green building in China, Britain, United States. Renew. Sustain. Energy Rev. 2017, 68 Pt 1, 262–271. [Google Scholar] [CrossRef]
- Jian, Z.; Pullen, S.; Rameezdeen, R.; Bennetts, H.; Wang, Y.; Mao, G.; Zhou, Z.; Du, H.; Duan, H. Green building evaluation from a life-cycle perspective in Australia: A critical review. Renew. Sustain. Energy Rev. 2017, 70, 358–368. [Google Scholar]
- Chen, S.; Li, N.; Guan, J.; Xie, Y.; Sun, F.; Ni, J. A statistical method to investigate national energy consumption in the residential building sector of China. Energy Build. 2008, 40, 654–665. [Google Scholar] [CrossRef]
- Benelmir, R.; Feidt, M. Energy cogeneration systems and energy management strategy. Energy Convers. Manag. 1998, 39, 1791–1802. [Google Scholar] [CrossRef]
Figure 1.
The proportion of hospital number with different grade in each climate zone.

Figure 2.
The proportion of energy structures in different cooling and heating sources.

Figure 3.
Percentage statistics of the specific energy supply system in different climate zones. (a) Cooling source in air conditioning system; (b) heating source in air conditioning system; (c) heating source in domestic hot water.
Figure 3.
Percentage statistics of the specific energy supply system in different climate zones. (a) Cooling source in air conditioning system; (b) heating source in air conditioning system; (c) heating source in domestic hot water.


Figure 4.
Annual electricity consumption per unit in each climate zone.

Figure 5.
Annual electricity consumption per bed based on hospital bed capacity.

Figure 6.
Annual total energy consumption per unit by two grades hospitals in each climate zone.

Figure 7.
Monthly total energy consumption per unit in each climate zone.

Figure 8.
Annual total energy consumption per unit in each climate zone.

Figure 9.
Annual total energy consumption per bed for different bed capacity.

Figure 10.
The sources of energy use costs and the energy end components of the highest cost source in the 100 hospitals. (a) The proportion of energy use cost source. (b) Energy end components of electricity.
Figure 10.
The sources of energy use costs and the energy end components of the highest cost source in the 100 hospitals. (a) The proportion of energy use cost source. (b) Energy end components of electricity.

Figure 11.
Electricity cost compositions in outpatient area. (a) Energy end components of electricity. (b) The equipment proportion of air conditioning system.
Figure 11.
Electricity cost compositions in outpatient area. (a) Energy end components of electricity. (b) The equipment proportion of air conditioning system.

Figure 12.
Electricity cost compositions in inpatient area. (a) Energy end components of electricity. (b) The equipment proportion of air conditioning system.
Figure 12.
Electricity cost compositions in inpatient area. (a) Energy end components of electricity. (b) The equipment proportion of air conditioning system.

Figure 13.
The evaluation software for energy system performance for hospitals.

Figure 14.
The evaluation result of energy system performance for one hospital in Beijing.


Table 1.
Hospital numbers for different levels in different climatic zone.
| Hospital Category | Climatic Zone | ||||
|---|---|---|---|---|---|
| Frozen | Cold | Hot Summer & Cold Winter | Hot Summer & Warm Winter | Total | |
| Grade 3A | 4 | 14 | 18 | 14 | 50 |
| Grade 3B | 1 | 5 | 5 | 2 | 13 |
| Grade 2A | 3 | 7 | 8 | 5 | 23 |
| Grade 2B | 2 | 4 | 7 | 1 | 14 |
| Total | 10 | 30 | 38 | 22 | 100 |
Table 2.
Hospital numbers in different bed number range.
| Bed Number | 100~500 | 500~1000 | 1000~1500 | >1500 | Total |
|---|---|---|---|---|---|
| Hospital Number | 39 | 40 | 10 | 11 | 100 |
Table 3.
Average annual total energy consumption of hospital buildings in each bed number range and tri-sectional quantile of Il.
Table 3.
Average annual total energy consumption of hospital buildings in each bed number range and tri-sectional quantile of Il.
| Number of Beds | Tri-Sectional Quantile of Il | ||
|---|---|---|---|
| 100~500 | 338.42 | 0.86 | 1.19 |
| 500~1000 | 357.83 | 0.90 | 1.44 |
| 1000~1500 | 368.27 | 0.85 | 1.16 |
| >1500 | 382.65 | 0.90 | 1.15 |
Table 4.
Energy saving level of the energy system in hospitals.
| Number of Beds | Level | ||
|---|---|---|---|
| Low | Middle | High | |
| 100~500 | Il < 0.86 | 0.86 ≤ Il < 1.19 | Il ≥ 1.19 |
| 500~1000 | Il < 0.90 | 0.90 ≤ Il < 1.44 | Il ≥ 1.44 |
| 1000~1500 | Il < 0.85 | 0.85 ≤ Il < 1.16 | Il ≥ 1.16 |
| >1500 | Il < 0.90 | 0.90≤ Il <1.15 | Il ≥ 1.15 |
“Low” were awarded to hospitals that had a low level of energy saving and suggested to conduct energy audit to determine the main reason for high energy use. “Middle” were awarded to hospitals that had a middle level of energy saving and suggested to conduct retrofitting of energy saving and operation optimization. “High” were awarded to hospitals that had a high level of energy saving and suggested to find energy-saving potential according to the index of energy saving performance.
Table 5.
Energy saving performance of the energy system in hospitals.
| Performance | Score of Ip |
|---|---|
| Bad | 0 ≤ Ip < 25 |
| Middle | 25 ≤ Ip < 50 |
| Good | 50 ≤ Ip < 75 |
| Excellent | 75 ≤ Ip < 100 |
“Bad” were judged to hospitals that lacked energy saving measures, and mast conduct retrofitting of energy saving. “Middle” were judged to hospitals that achieved parts of energy saving and suggested to apply more technology and strategy of energy saving. “Good” were judged to hospitals that are performing well overall but not achieving the same consistently high level of energy saving measures as” Excellent” hospitals. “Excellent” were judged to hospitals that have the highest level of performance on energy saving, and suggested to apply more advanced technology application of energy saving.
Table 6.
The comprehensive level of the energy system in hospitals.
| Level | Score of Ie |
|---|---|
| ☆ | 0 ≤ Ie < 40 |
| ★ | 40 ≤ Ie < 60 |
| ★★ | 60 ≤ Ie < 80 |
| ★★★ | 80 ≤ Ie ≤ 100 |
☆ were awarded to hospitals that have the lowest level of performance on operations and maintenance, and must conduct retrofitting of energy saving. ★ were awarded to hospitals that performed poorly on operations and maintenance, and were suggested to conduct retrofitting of energy saving. ★★ were awarded to hospitals that achieved good performance on operations and maintenance but not achieving the same consistently high level of performance as three-star hospitals, and were suggested to conduct upgrading of energy saving. ★★★ were awarded to hospitals that demonstrated very high performance on operations and maintenance, and were suggested to strengthen the system maintenance and energy saving behavior.
© 2019 by the authors. Licensee MDPI, Basel, Switzerland. This article is an open access article distributed under the terms and conditions of the Creative Commons Attribution (CC BY) license (http://creativecommons.org/licenses/by/4.0/).
Share and Cite
MDPI and ACS Style
Ji, R.; Qu, S. Investigation and Evaluation of Energy Consumption Performance for Hospital Buildings in China. Sustainability 2019, 11, 1724. https://doi.org/10.3390/su11061724
AMA Style
Ji R, Qu S. Investigation and Evaluation of Energy Consumption Performance for Hospital Buildings in China. Sustainability. 2019; 11(6):1724. https://doi.org/10.3390/su11061724
Chicago/Turabian StyleJi, Ru, and Shilin Qu. 2019. "Investigation and Evaluation of Energy Consumption Performance for Hospital Buildings in China" Sustainability 11, no. 6: 1724. https://doi.org/10.3390/su11061724
Note that from the first issue of 2016, this journal uses article numbers instead of page numbers. See further details here.