Article

Analysis of the Utilization of Air-Cooled Blast Furnace Slag as Industrial Waste Aggregates in Self-Compacting Concrete

by
José D. Ríos
1,
Adelardo Vahí
1,
Carlos Leiva
2,
Antonio Martínez-De la Concha
1 and
Héctor Cifuentes
1,*
1
Departament of Continuum Mechanics and Structural Analysis, ETS Ingeniería, Universidad de Sevilla, Camino de los Descubrimientos, s/n, 41092 Sevilla, Spain
2
Department of Chemical and Environmental Engineering, ETS Ingeniería, Universidad de Sevilla, Camino de los Descubrimientos, s/n, 41092 Sevilla, Spain
*
Author to whom correspondence should be addressed.
Sustainability 2019, 11(6), 1702; https://doi.org/10.3390/su11061702
Submission received: 20 February 2019 / Revised: 15 March 2019 / Accepted: 19 March 2019 / Published: 21 March 2019
(This article belongs to the Special Issue Sustainable Civil Engineering Materials)

Abstract

:
In this work, the effects of replacing the aggregates of self-compacting concrete by air-cooled blast furnace slag have been analysed. Different mixes have been manufactured by substituting the fine and coarse natural aggregates by air-cooled blast furnace slag. The fracture energy and the tensile and compressive strength have been determined for each mix. The self-compacting properties of the mixes, or the absence of them, have been observed. The main goals of this research are the decrease of the price of aggregates, reduction of the industrial waste, and attenuation the rate of consumption of natural resources. The results show that the self-compactability of the concrete is gradually lost as the slag content is increased, thus, when the ratio of replacement is low, the concrete keeps the self-compacting properties. Nevertheless, the loss of self-compaction affects the mechanical properties by increasing its strength. An air-cooled blast furnace slag did not present problems of heavy metals leaching.

1. Introduction

Blast furnace slag (BFS) is a non-metallic industrial by-product, which is produced in blast furnaces by the melting of the iron ore, producing molten pig iron [1]. Worldwide, more than 500 million tons of blast furnace slag are produced every year [2]. The blast furnace slag can be granulated slag (GBFS) or air-cooled blast furnace slag (ACBFS). Using water, granulated slag is rapidly cooled, resulting in a vitreous slag, while ambient air slowly cools air-cooled slag. The air-cooled slag solidifies and crystallizes, creating a rock-like slag, with little or no cementing property that is why it is only used as coarse aggregate [3].
The main use of granulated blast furnace slag is cement production [4], but GBFS can also be used as any other additive to concrete or as part of alkali activated materials. Today, in the European cement regulations, there are fourteen types of cement containing blast furnace slag [4]. However, the use of slag aggregate as substitute of natural coarse and fine aggregate instead of supplementary cementitious material has not been widely studied in self-compacting concretes. This application leads to the elimination of aggregate grinding and, consequently, a reduction of production costs. The ACBFS are usually more porous than natural aggregates. Thus, the use of ACBFS as substitute of natural aggregates could lead to a higher water absorption of mix, and the direct substitution of aggregates must be properly studied.
In Spain, the 70% of blast furnace slag that was produced in 2014 was reused. Nevertheless, the remaining 30% wasted—that represent half-million of a tone—is deposited in landfills due to a lack of knowledge regarding the recycling opportunities of this material and which is almost ACBFS. During 2012, 70.1% of the ACBFS was used, 34% as road base and road surface layers [4], 8% as fillers and 14% in asphalt concrete, whereas only 12.1% of the ACBFS was used as aggregate replacement of concrete [5]. Nonetheless, the demand for concrete has rapidly increased due to the development of industrialization and urbanization in the last decades. It is estimated that the world demands over 10-billion tons per year of construction aggregates [6].
The use of air-cooled blast furnace slag in the production of concrete can have economical motivations—acquiring ACBFS, as a waste that is industrially generated, is cheaper than obtaining natural aggregates from a quarry. Additionally, the reuse of air-cooled blast furnace slag has implications in the environmental preservation and it promotes a sustainable development. In this way, it is important to research the use of slag in the production of concrete as aggregate [4]. On the other hand, many wastes present the disadvantage that they could be enriched in harmful substances to people or the environment [7] during the industrial process where they are produced, such as heavy metals, which could be leached, so it would be necessary to study the behaviour of these substances.
The convenience of slags as aggregate in concrete will depend on the properties that have to be achieved in fresh and hardened states. In this way, according with some authors [8], the concrete that is produced with blast furnace slag as fine aggregates provides more workability when fresh, easily the vibration and making a better compaction with less entrapped air. Nonetheless, the depletion of natural aggregates as well as the consumption of large amounts of energy on the production, transportation, and use of raw materials, should be considered when producing concrete [9]. With this consideration, the use of ACBFS as aggregate in concrete should be considered.
During the last two decades, a series of studies have been undertaken to understand the behaviour of concrete containing ACBFS aggregates [1,10,11,12]. These studies have shown that ACBFS aggregate has great potential as a feasible alternative to natural aggregate in the concrete industry. The objective of this research is to analyse the effects of adding air-cooled blast furnace slag (from now on, industrial waste aggregate) in substitution of the natural aggregate on the properties of the self-compacting concretes. Some concrete samples have been casted in order to determine the compressive and tensile strength, to study how the fracture process happens and to see the bilinear tension softening diagram changes as the slag content increases. Coarse and fine aggregates are used, and the effects of each of them are studied separately, as well as mixed.

2. Materials and Specimens Preparation

In this section, the constituents that were used in the manufacturing of the concrete mixes, the grading distribution of the aggregates, the determination of fresh concrete consistency, and the description of specimen preparation are presented.

2.1. Materials

Five different concrete mixes have been manufactured in this work and are designated as mix I, II, III, IV, and V. Table 1 shows the mix proportions of each concrete and the constituents used. The method that was proposed by Deeb and Karihaloo [13] for self-compacting normal and high-strength concretes, which was successfully was used in numerous researches, designed the mix proportion [14,15,16,17]. The compositions of the mixes have kept the cement and superplasticizer dosage constant. The cement used was a CEM-II/B-L 32.5 N that was provided by Portland Valderribas and fabricated according to the EN 197-1:2011 standard [18]. A third generation polycarboxylic ether-based superplasticizer was used as a reducer of water, particularly the Master-Glenium 355C, as provided by BASF. The manufacturing of concrete mixes was carried out in accordance with the European Standard EN 934-2:2010 [19]. Four different types of aggregates were used, the designated as natural fine aggregate (NFA) was siliceous sand, while the designated as natural coarse aggregate (NCA) was crushed limestone. The labelled as slag coarse aggregate (SCA) and the slag fine aggregate (SFA) were both air-cooled blast furnace slags.
Table 2 shows the chemical composition of all constituents. The four major oxide phases that are present in ACBFS are CaO, SiO2, Al2O3, and MgO. These oxides count on approximately 93% of the ACBFS composition, with the remaining 4% consisting of sulphur, manganese, iron, titanium, fluorine, sodium, and potassium, which make it an intermediate composition between the ones of NFA and NCA. Due to that, with low ratio replacements of slag, the global composition of concrete will not vary significantly. However, it is worth noting that the mixes with NCA and SFA replacing the NFA will be mostly limestone, while the composition with NFA and SCA replacing NCA will be siliceous. A mix with only ACBFS (i.e., SFA and SCA) will have a similar composition than a mix that is fabricated with both natural coarse and fine aggregates (NCA and NFA). A 2% of total limit sulphur content is recommended for the ACBFS aggregates, according to the EN-12620:2013 [20]. As shown, NCA has a large content of CaCO3 (Table 2) as CaO, and additionally, the loss in ignition. From minor components, ACBFS presents a lot of heavy metals (Ba, Cr, Se, Cu), which could produce significant leaching problems that should be analysed. Complementary, the specific density of the different aggregates was measured. The specific density that was obtained from the NFA was 2.65 g/cm3, the density of the NCA was 2.66 g/cm3, and the result for the ACBFS was the lowest (2.26 g/cm3) due to its higher internal porosity. The water absorption of aggregates was determined according to EN-1097-6 [21]. NFA presented a 1.2% of water absorption, the NCA a 1.8%, and the ABFS a 3.5%, respectively.
Additionally, a granulometric analysis of each type of aggregate (i.e., NFA, NCA, SFA, and SCA) was carried out, as reflected in Figure 1. ACBFS was sieved at 2.5 mm. SCA is the fraction with a size higher than 2.5 mm and SFA is the fraction lower than 2.5 mm. As can be seen, the slag coarse aggregate (SCA) has a grading distribution that is slightly smaller than the natural coarse aggregate (NCA). On the other hand, the grading distribution of the fine slag (i.e., SFA) is similar to the natural fine aggregate (NFA). This means that the range of particle size is narrower in the mixes (Table 1) where the air-cooled blast furnace slag (i.e., SFA and SCA) replaces natural aggregates (i.e., NFA and NCA).
As can be seen in Figure 2, the shape of coarse slag (i.e., SCA) is different than the shape of natural coarse aggregate (NCA). Indeed, the coarse slag grains (i.e., SCA) show irregularities and cavities, while the grains of the natural coarse aggregate have a smoothened surface that allows a more efficient compaction.

2.2. Mix Proportions and Specimen Preparation

The manufacturing procedure of mixes (Table 1) has been carried out according to the specifications in the European standard EN-12390-2:2001 [22]. For each of the different concrete mixes (i.e., mix I, II, III, IV, and V), 21 litres were produced, which were cast into four specimens of 4.4 litres, each with prismatic form 440 × 100 × 100 mm3. The concrete prisms were cured in water at 20 °C for 42 days, higher than 28 days, so it can be considered that the strengthening process was fully completed.
During the mixing process of each type of mixture, it was observed how the paste and aggregate flew properly in the compositions I, II, and III, as it happens in self-compacting concrete. Nevertheless, mix IV lost self-compacting properties (see Figure 3). Thus, the water of mix IV had to be increased to 0.6 water/cement ratio, with mix IV being the composition that absorbed more water due to the higher porosity of the reused slag aggregates (i.e., SFA and SCA) [23,24].
The flow table test was carried out for each mixture to determine the self-compacting properties and the consistency of fresh concrete, in accordance with the European standard EN 12350-5:2009 [25]. The time until reaching the spread diameter was less than a minute and the diameters of the final shape were 70 centimetres (the longest one) and 62 centimetres (the shortest one). Both of them are perpendicular to each other. No signs of segregation were observed for any mixture. Figure 4 provides an example of what can be seen for mix II. The displacement of the aggregates happened in the directions, and they moved as much as the cement paste, as can be seen in Figure 4.
When considering that the water content was remarkably high when reused slag aggregate is added in high proportions (i.e., mix IV), the compressive strength could significantly decrease to be used in structural applications. Additionally, it manufactured the mix V, with 50% of slag aggregates (Table 1). The water content of mix V was maintained at the 0.5 w/c ratio, although an extra consolidation was also required. This extra-consolidation was executed with a vibrating table for 1 min.

2.3. Experimental Programme

In this section, the experimental tests that were carried out for the characterisation of the different concrete mixes are described.

2.3.1. Density Test

Density tests were carried out on each sample of mix to obtain an average density. The density was measured in hardened samples after 46 days, 42 days curing in water, and four days drying in a furnace at 105 °C in order to eliminate the moisture. It has been measured in determining the mass and the volume of the samples. The dimensions of the samples were determined, recording three data for each dimension and establishing an average value. For each mix, all of the samples were tested and the average data was calculated.

2.3.2. Compressive Strength, fc

Four cubic specimens of 100 mm of side for each mix were used for the determination of the compressive strength according to the European standard EN-12390-3:2009 [26]. A servo-hydraulic machine with a load capacity of 3000 kN was used. The velocity of the test was controlled by the displacement of the top compressed face, which becomes strained at a pace of 0.5 mm/min. Compressive strength is the most usually measured mechanical property of a concrete. When considering that concrete is a material with the highest strength under compressive loads, the quality of a concrete can be determined by the compressive strength. This compressive strength is closely correlated to the porosity of matrix, as numerous studies have shown in concrete [27,28,29,30]. The fact that a reduction of porosity increases the strength, in general, of cement-based materials was recognised long ago [31,32,33].

2.3.3. Tensile Strength, ft

Tensile strength was determined by the Barcelona test or also known as double-punch test according to the specifications in the Spanish standard UNE-83515:2010 [34], which assign this test for fibre-reinforced concrete. However, according to previous authors [35,36,37,38], this test has also been applied for plain concrete with satisfactory results. Cylindrical steel punches with a height of 20 mm and a diameter of 25 mm were placed at the centre of the top and the bottom surfaces of the specimen. The specimens used were cubic with faces of 100 mm long in each side. Four different samples for each kind of concrete have been tested. During the test, the cylinders support compression against the surfaces where they were placed, until they penetrate the concrete specimens. This penetration provokes a tension state inside the concrete, until the specimen gets broken. In this point, the maximum tensile stress (ft) that the concrete can withstand is reached. Once the maximum load applied for breaking the specimen is known, the tensile strength, ft, is determined.
The determination of the tensile strength on plain concretes through the application of the modified Barcelona test [34] can be obtained by using the Equation (1), as proposed by Chen and Yuan [39].
f c t = 0.75 P 1.2 ( d 2 ) h ( d 2 ) 2   ,
where P is the maximum load, d is the diameter of specimen, h is the height of the specimen, and d′ is the diameter of the plate [39].

2.3.4. Three-Point Bending Tests

Three-point bending tests were carried out in order to determine the fracture energy according to the RILEM work-of-fracture method [40]. The modifications that were proposed by Guinea et al. [41,42,43] were considered to obtain a size-independent fracture energy value. Four notched prismatic specimens of 440 × 100 × 100 mm3, with notch depth of 50 mm, were tested for each mix (i.e., mix I, II, III, IV, and V). The notches were performed with a diamond saw after the curing process and prior to the testing just on the midspan of specimens. The three-point bending tests were performed in a 200 kN dynamic servo-hydraulic machine at a rate of 0.01 mm/min and data being recorded at 5 Hz. The deflection at the midpoint in specimens was measured with a linear variable displacement transducer (LVDT) that was mounted on a rigid frame fixed to the specimen. The supporting brackets were mounted on steel ball bearings to allow them to freely rotate.
The fracture energy of concrete was determined from the load-deflection curves by using Equation (2) specified in the RILEM TCM-85 recommendation [40], applying the corrections that are proposed by Guinea et al. [41,42], corresponding to the adjustment of the tail of the load-deflection curves.
G F = W F B ( D a ) ,
where GF is the fracture energy (N/m), WF is the total work of fracture, and B(D − a) is the ligament area. The total work of fracture is given by:
W F = W m + W n m ,
Wm is the measured work of fracture corresponding to the total area below the P-δ curve recorded until the end of the test at δu. Wnm is the non-measured work of fracture, being obtained by means of the remote tail constant, A, while taking into account the influence of cutting the P-δ curve [42].
W n m = 2 A δ u ,

2.3.5. Bilinear Tension Softening Diagram

The bilinear tension softening diagrams of each specimen tested were calculated from the three-point bending test curves recorded. This diagram is an important fracture property, especially when a numerical analysis of the fracture behaviour of concrete is needed, since it could model the fracture mechanism of material [44]. In this work, it has used an inverse analysis method that is based on the non-linear hinge model described in [14,45,46] to determine the parameters that defines the bilinear tension softening diagram (see Figure 5). It is worth noting that a qualitative analysis of the influence of the microstructure in the fracture behaviour of concrete can be completed from their corresponding bilinear softening diagrams, as was carried out in other authors [14,15,47,48]. The first steep linear branch of the softening diagrams is mainly a consequence of the microcracking process and the second linear branch is due to the frictional dissipation processes (e.g., aggregate interlock). The determination of the bilinear softening diagrams consists of the minimization of the sum of square errors between the experimental and theoretical values of the load that were obtained for each deflection value, in accordance to the analytical expressions that are given in [49]. The optimization problem is solved in steps corresponding to the different phases of crack propagation.
Step I—Elastic phase: Determination of Ec
min   E c 1 N max 0 0 N max 0 ( P s p P s p ) 2   subject   to   E c > 0
Step II—First linear branch of cracking phase: Determination of ft and a1
min   ( f t , a 1 ) 1 N max 0 N max ( P s p P s p ) 2   subject   to   f t   >   0
Step III—Second linear branch of cracking phase: Determination of a2 and b2
min   ( a 2 , b 1 ) 1 N max 0 N max ( P s p P s p ) 2
whereby Psp and P′sp, are the actual load and the estimated load, respectively. The N max 0 and Nmax represent the last observation of loads made belonging to step I and the total number of observations made, respectively.
The constitutive relationship of the hinge model is assumed to be linear elastic in the pre-crack state, while the cracked state is approximated by a bilinear softening curve:
σ = E c ε pre cracked   state
σ = σ w ( w ) = g ( w ) f t   cracked   state
whereby Ec is the elastic modulus, ε is the elastic strain, σw (w) denotes the stress-crack opening relationship with w, crack opening, and ft, the uniaxial tensile strength.
The function g(w) is defined as:
g ( w ) = b 1 a 1 w 0 w < w 1
g ( w ) = b 2 a 2 w w 1 w w 2

2.3.6. Leaching Test

ACBFS should have a low toxicity level to be considered in concrete, but they present a high heavy metals content as minor components, which could be leached due to the rain effect. According to EN 12457-4:2003 [50], the leaching tests were carried out to characterise the ACBFS and cement.

3. Results and Discussion

3.1. Density of the Mixes

Table 3 presents the density of each mix (i.e., mix I, II, III, IV, and V) in kg/m3 and the corresponding standard deviation. The average value of four samples are shown. Cement and water content have not changed in mixes I, II, and III, and the density of different aggregates is quite similar, so the specific density essentially depends of the porosity of material. As can be seen, the addition of slag (i.e., SFA or SCA) leads to a decrease in the specific density of ACBFS in mix II and III in comparison to the mix with exclusively natural aggregate. Mix II, where the replacement of the aggregate is equal to 50% of fine aggregate, shows a decrease of 3% in density, while the replacement of 50% in the coarse aggregate (i.e., mix III) shows a decrease of 5% in density, when compared with mix I. In fact, mix II has a slightly higher granulometry that explains the higher porosity, which causes this decrease on density; meanwhile, mix III is made with coarse slag aggregate, which—as shown in 
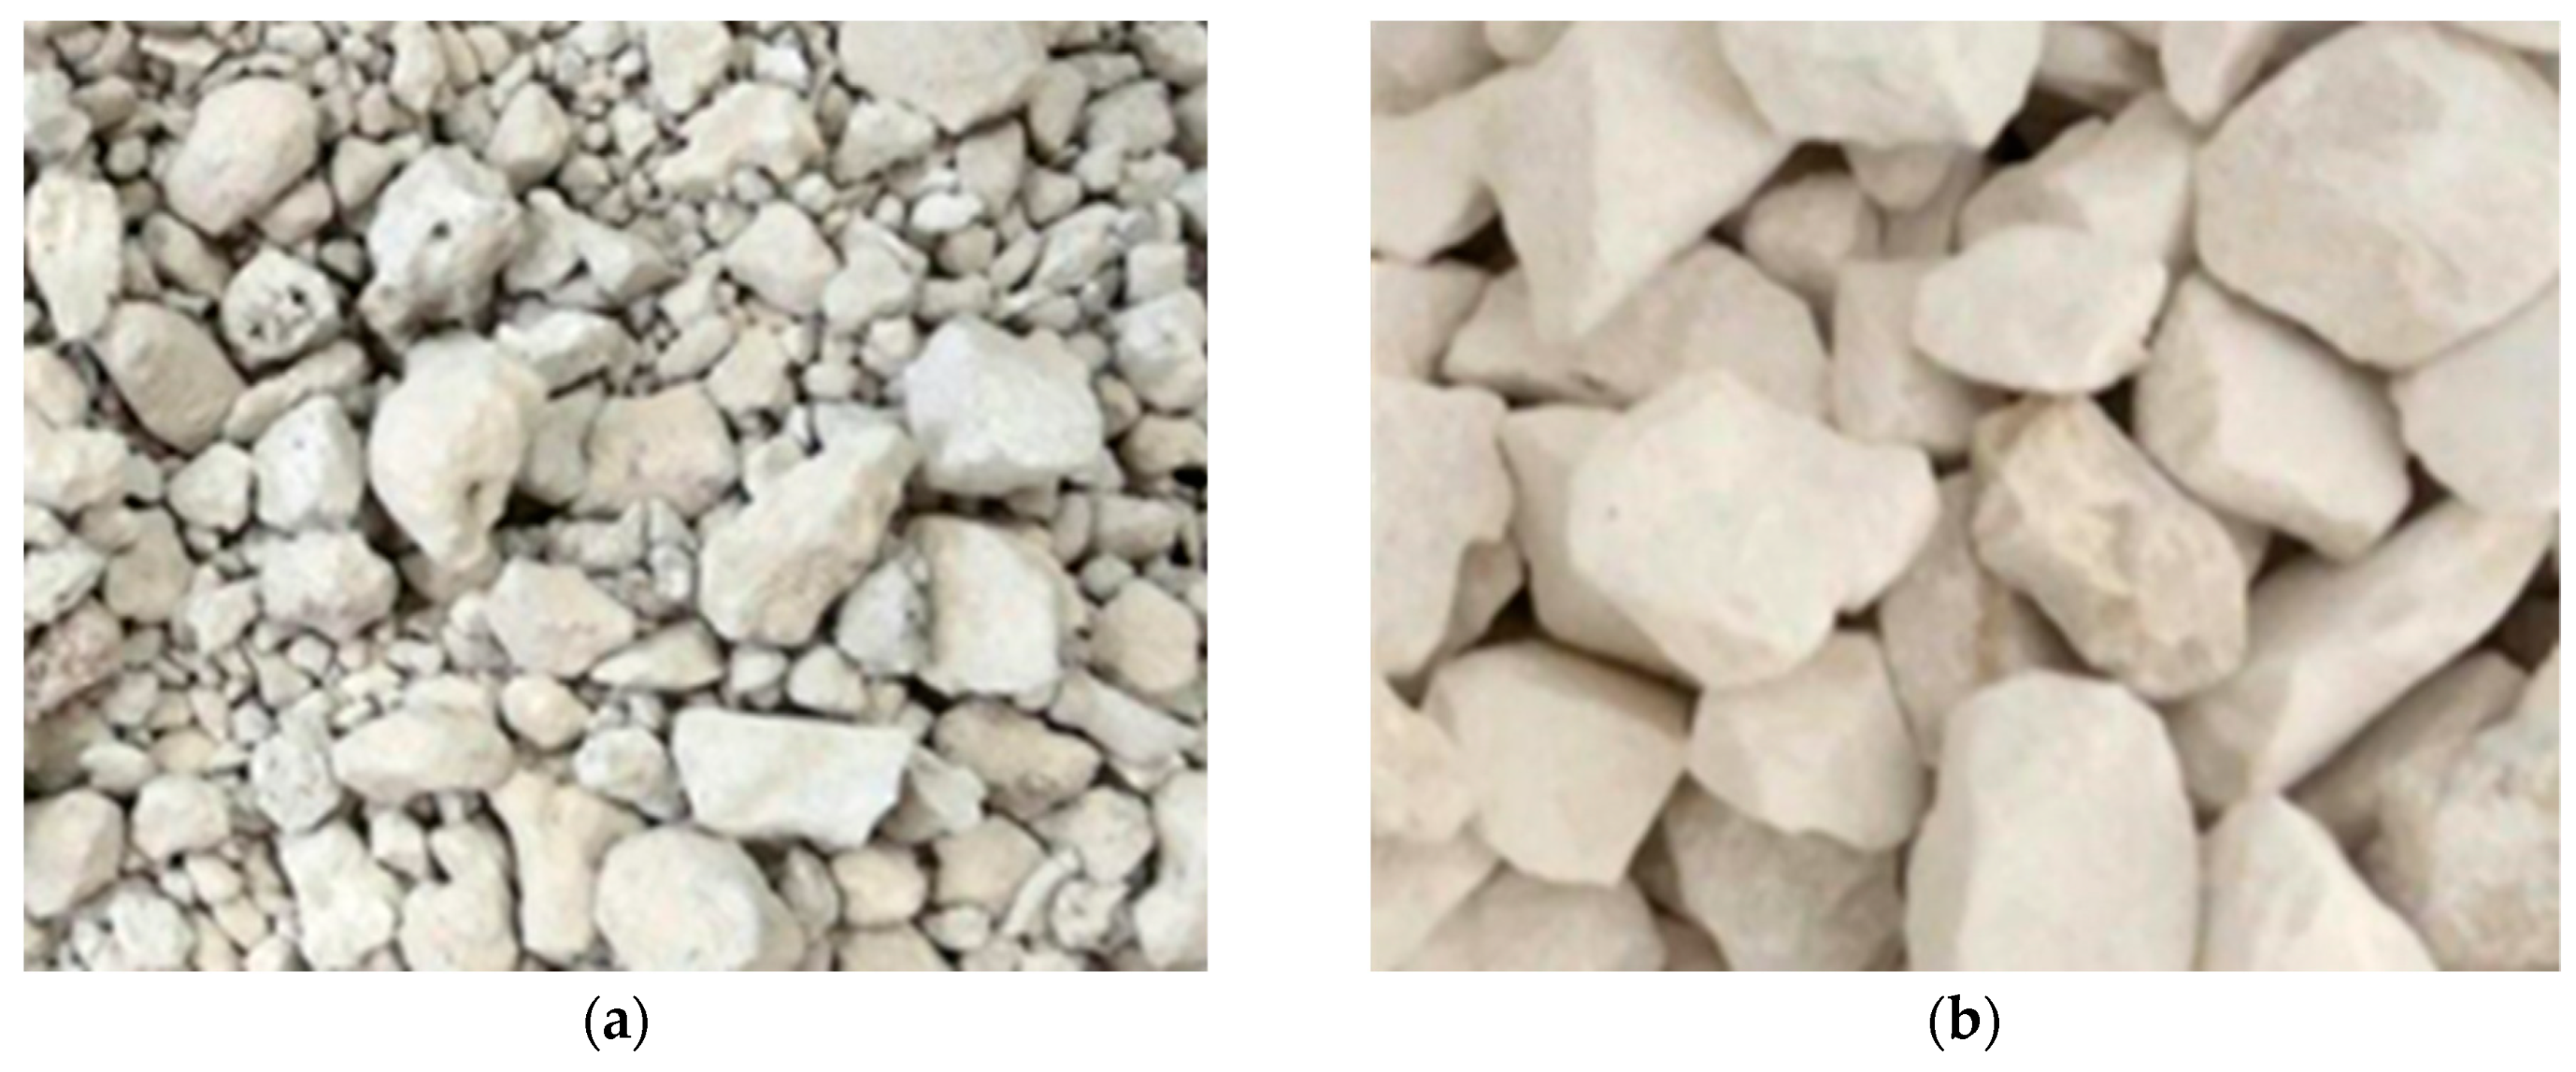
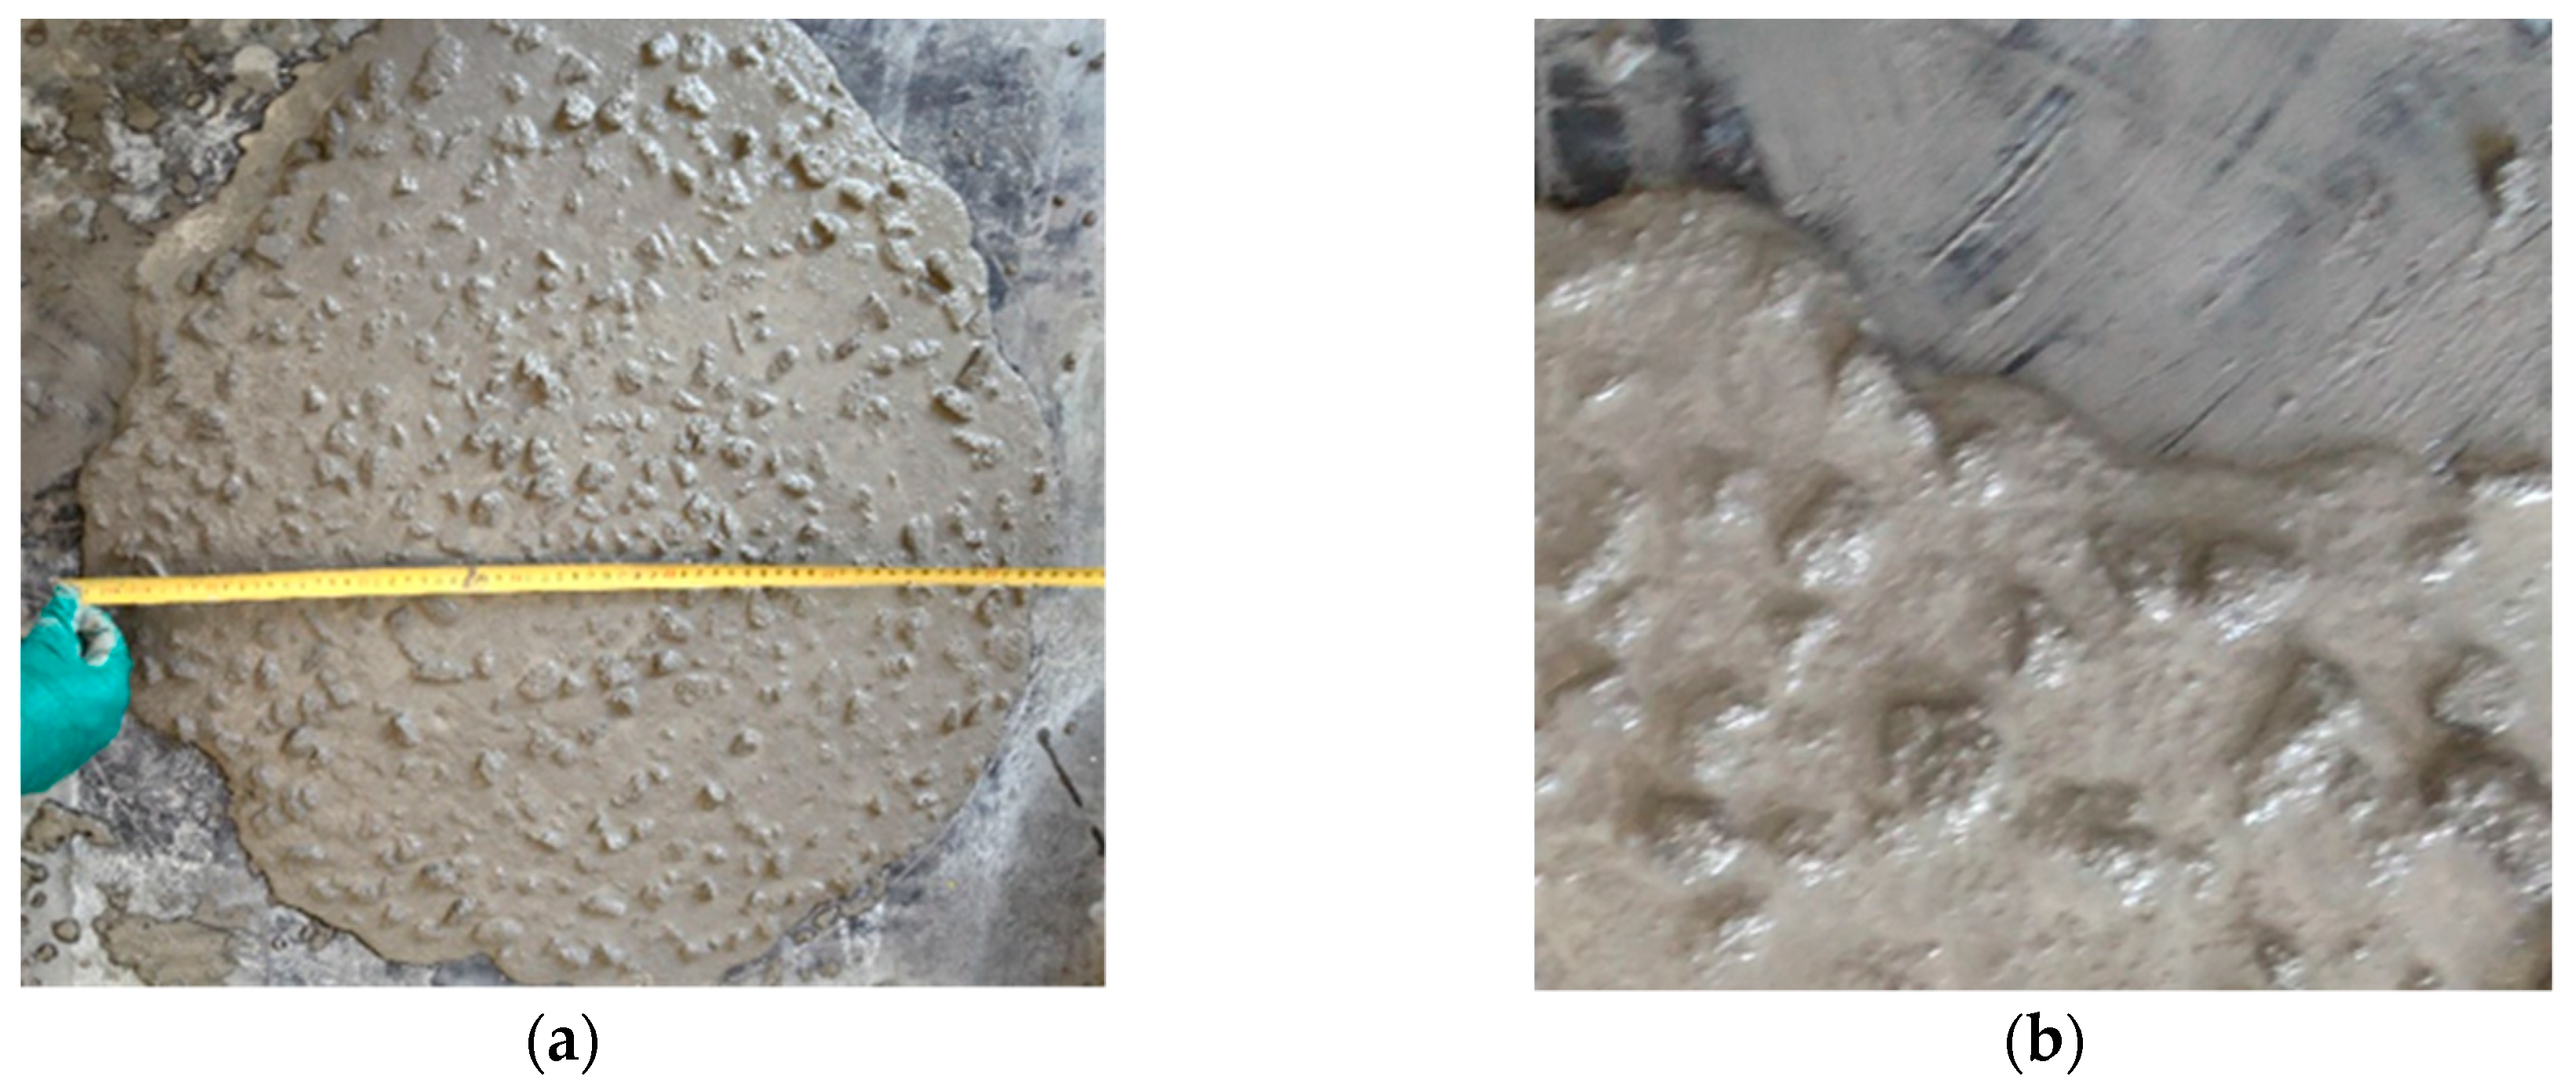
Figure 2—had irregularities and cavities in the surface of the grains, causing the lower density on the mixture when compared with mix I. The mix IV shows a more significant decrease, because, additionally to the slag replacement, the higher water/cement ratio chosen. On the contrary, the mix V density remarkably increased its density, since, although the water content was kept constant, the mix was vibrated and a higher density was achieved.
Moreover, a distribution of larger particle size causes a higher packing density and decreases water demand, while a narrower particle size distribution provides higher hydration rates for equal specific surface area [23,24]. Mix III has a distribution of lower particle size, however the proportional amount of water was not changed between different mixes, which infers a decrease in density. However, the density of mix IV, which had a full replacement of aggregate by slag, is 13.5% lower than the density of mix I and the data was 1.97 kg/m3, in absolute terms, which is extremely low when compared with an average concrete density due to the addition of water. This matches with the excessive porosity that is shown in Figure 3.
With this information, it is concluded that a full replacement of aggregate by blast furnace slag affects to density. However, mix V did not show any porosity. Therefore, mixes I and V have very similar densities. The difference of density in mix V is only around 1.5% in relation to mix I, which suggests that the self-compacting of mix I worked as well as the vibration. Aggregates in mix V are smaller than aggregates in mix I, which explains it slightly less porosity.

3.2. Compressive Strength

Table 4 shows an average value of the compressive strength measured of four specimens and its standard deviation for each mix (i.e., I, II, III, and IV and V). The concrete manufactured with both coarse and fine slag (i.e., SCA and SFA) replacing half of the natural aggregates (i.e., mix V) shows higher compressive strength when vibrated than the self-compacting concrete that was manufactured exclusively with natural aggregates (i.e., mix I)—this improvement is over the 35%. Thus, it can be assured that the reduction of costs in the manufacturing of concretes, by using reused slag aggregates, can derive to a significantly enhanced concrete, which can be an interesting factor when considering the increasing concern of the waste of materials (i.e., ACBFS in this case). Additionally, the compressive strength value of mix V overcomes the compressive strength that is estimated for conventional concretes according to the Abram’s law [51] for the water to cement ratio used (Table 1).
With regards to self-compacting mixes, the addition of ACBFS (i.e., mix II, III, and IV) conducts to a decrease of the compressive strength in comparison with the mix that was only fabricated with natural aggregates (i.e., mix I). Whether the replacement of natural aggregate is not accompanied with an extra vibration, the compressive strength of concretes is reduced by around 35% in those cases where the amount of replaced aggregate is 50% (i.e., mix II and III). There is no a remarkable evidence of difference between replacing natural fine aggregate or coarse aggregate (i.e., mix II or mix III, respectively). This decrease is situated around the 70% when all natural aggregates are replaced (i.e., mix IV). The drastic reduction of water that is accessible to reaction by a higher absorption of aggregates led to the increment of the water/cement ratio. The higher porosity of ACBFS aggregates (i.e., SFA and SCA) reflected in their lower density values (see Section 3), leading to a higher water absorption during the mixing 1, which derives into a reduction of the self-compacting of mixes with reused slag aggregates (i.e., mix II, III, IV, and V). The loss of self-compacting conducted to a higher porosity in the concrete matrix and, as a consequence, a decreasing density of hardened concretes. From the results of several studies [27,52], the compressive and tensile strength is inversely related to the porosity of concrete matrix. Table 4 shows that the mixes with lower compressive strengths correspond with those of lower density.

3.3. Tensile Strength

The average values of the maximum load, the tensile strength estimated of each mix (i.e., mix I, II, III, IV, and V) and the standard deviation of four specimens are presented in Table 5.
From the results, it is observed that the addition of slag aggregates (i.e., mix II, III, IV, and V) conducts to concretes with slightly lower tensile strength, except in mix IV, where the difference is more significant. The reduction is almost inexistent in mix II, III, and V, because, although the differences in mix III and V are higher, the scatter is more significant. When the replacement of aggregate is total (i.e., mix IV) and the water to cement ratio is increased, the tensile strength falls down by 80%. The external appearance of this mix suggested that it could not be used for structural applications due to the low packing density, and the low data of tensile strength reached is strong evidence of this. When the replacement of natural aggregates by slag is simultaneous but the concrete is vibrated (i.e., mix V), the tensile strength remains in similar values than that obtained with exclusively natural aggregates (i.e., mix I). It is worth noting that the tensile strength of mixes is reduced when the density is lower (Table 3), which is in accordance to compressive strength in the previous section.

3.4. Fracture Energy

The results that were obtained from three-point bending tests are shown in curves correlating the load applied with the deflection of the specimen (Figure 6). The area that is covered under these load-deflection curves is the so-called work-of-fracture. In Figure 6, the average load-deflection curves for each mix are plotted.
The average value of maximum load, fracture energy, and the corresponding standard deviation of mixes I, II, III, and V are presented in Table 6. Mix IV has not been considered due to the significant difference of its load-displacement curve with respect to the others. Four specimens were tested for each mix. As shown in Table 6, the substitution of slag aggregates, mix II, and III, leads to an increase in the fracture energy, with increases of 10.5%, 30%, and 62%, respectively. The average fracture energy that was obtained for mix V is similar to mix I, which perhaps shows that this concrete has similar fracture behaviour than that with only natural aggregates.
One aspect to consider is the fact that mixtures with lower fracture energy has a higher maximum load. All the curves of the different samples vary from sharped to wider. As can be seen in Figure 6, the highest peak loads are obtained with a lower deflection, and as the peaks of the curves gets lower, they tend to be more to the right.

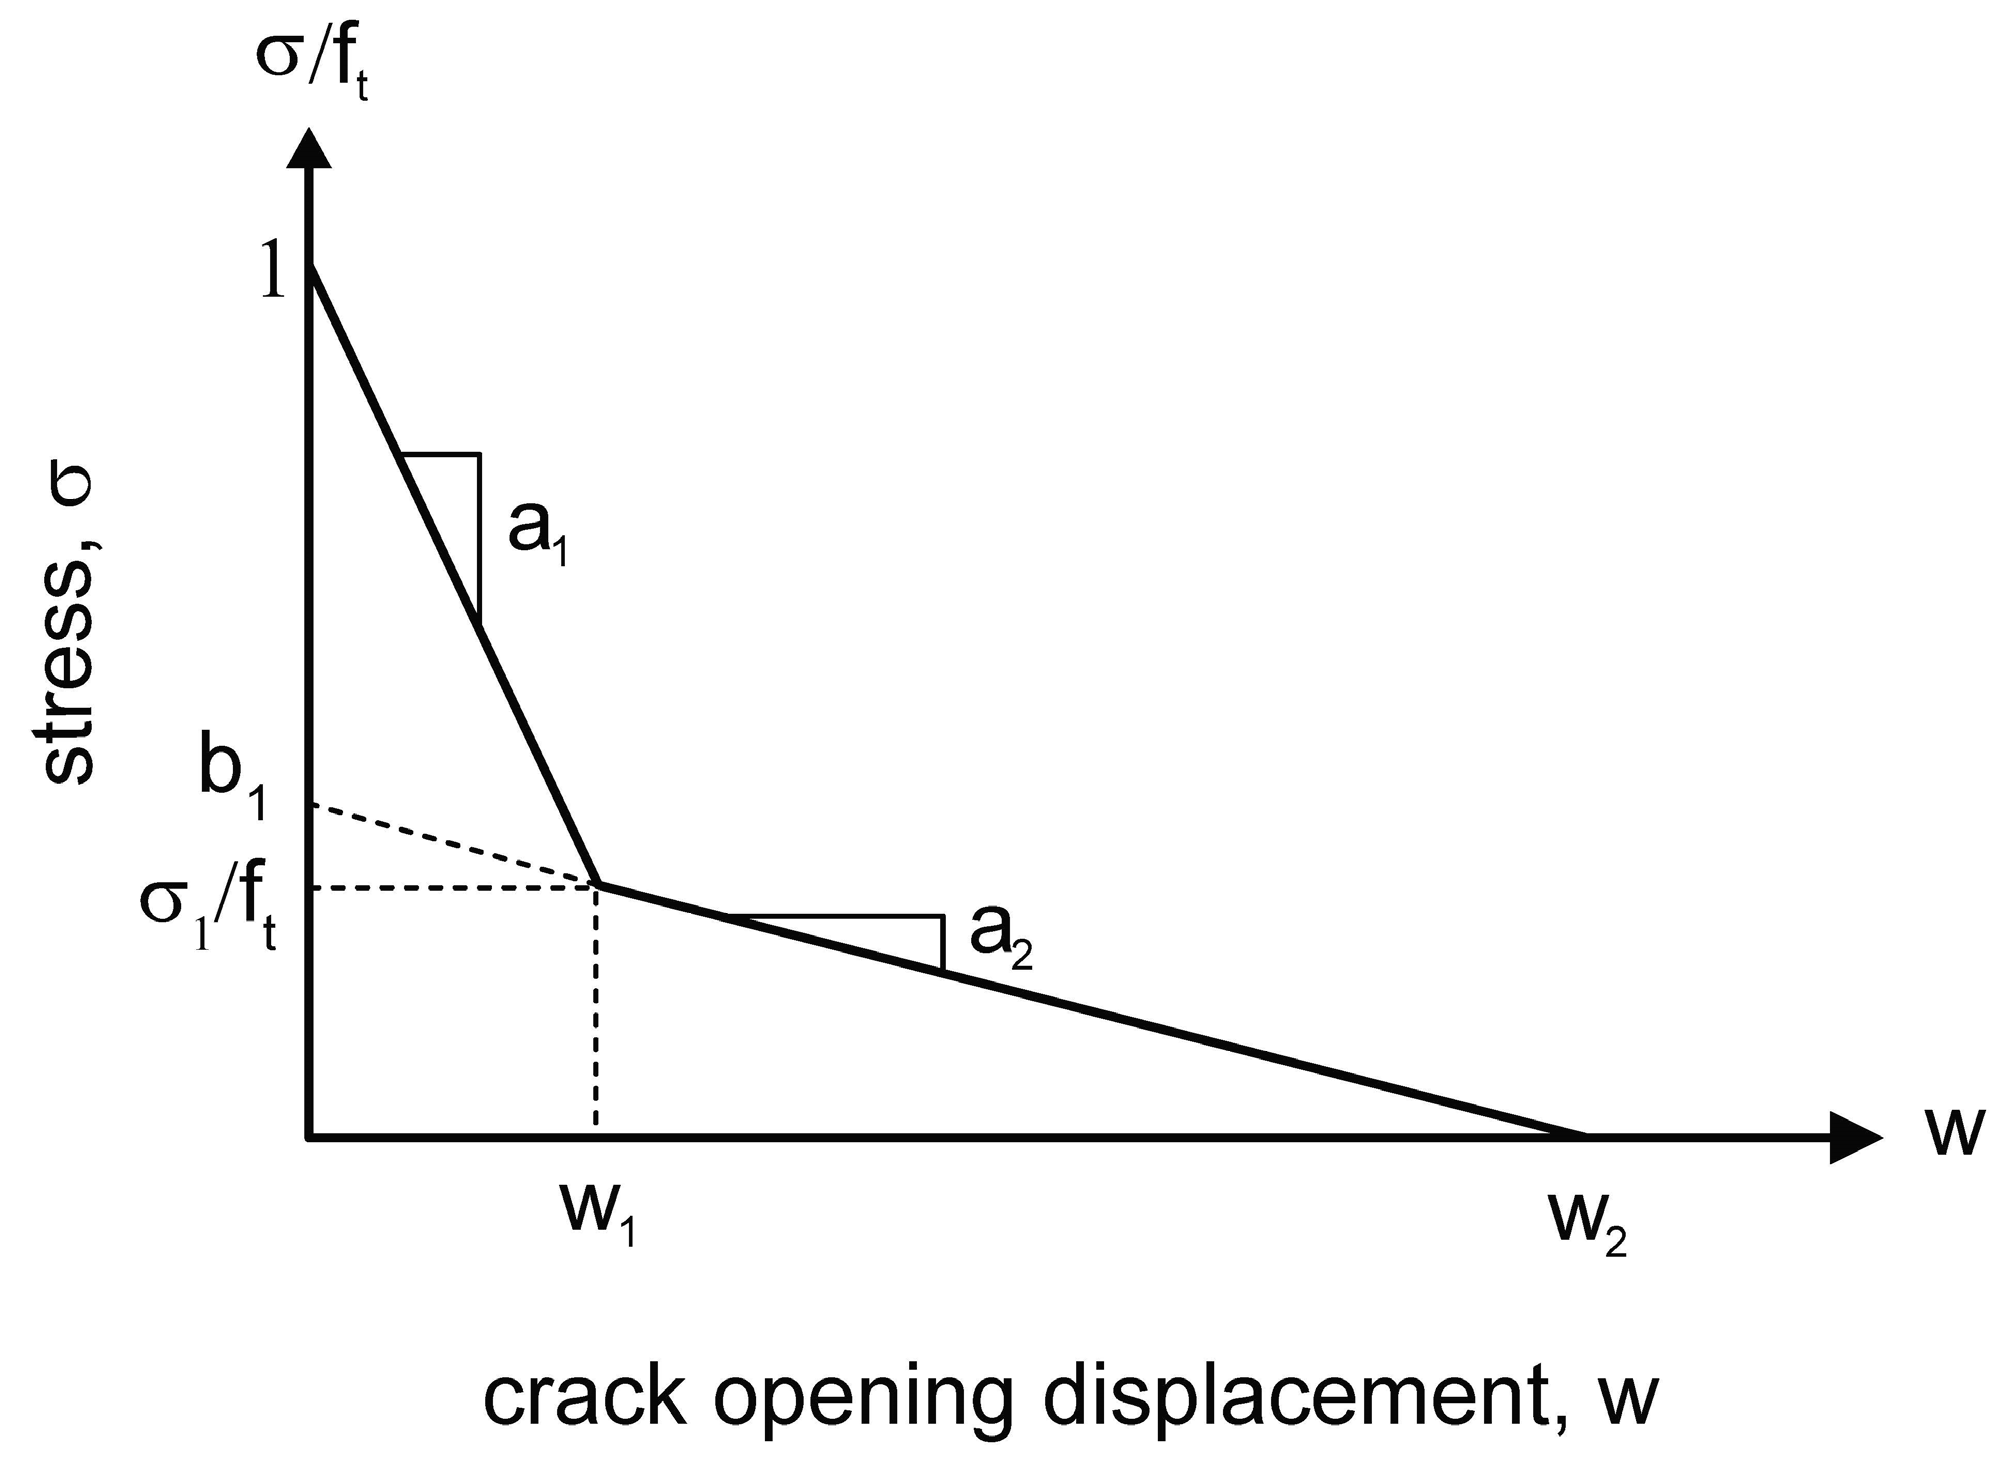
3.5. Bilinear Tension Softening Diagrams

The parameters of the bilinear tension softening diagrams that were determined through the inverse method [45,46,49] described in Section 2.3.5, from the load-deflection curves, are shown in Table 7 for each mix and are plotted in Figure 7. The load-deflection curve that was obtained for mix IV (Figure 6) is very different of the curve of the rest of mixes (i.e., mix I, II, III, and V). Additionally, the non-linearity of pre-peak part of the load-deflection curve and the very horizontal tendency of the post-peak part made it impossible to find a bilinear tension softening diagram with a low enough tolerance for mix IV.
From the results, it can be observed that the slag aggregates (i.e., SFA and SCA) always cause a reduction on the value of the Young’s modulus, Ec (Table 7), leading to an initial stiffness decrease. This decrease varies between 12.9%, 15.5%, and 12.2% for mixes II, III, and V, respectively.
The similarity between mixes II and V remains in the other parameters, making both bilinear softening diagrams very similar one to the other (see Figure 7). Nonetheless, the mix III shows a shorter peak (i.e., lower ft in Table 7) and a more horizontal slope at the right of the peak (Figure 7), meaning that mix III is a weaker material in the elastic phase, but more energy is needed for the propagation of the cracking [53]. Tensile failure in concrete can be caused by the cracking of aggregates or cracking in the surface between the aggregate and cement paste [54]. When considering this fact, the size of aggregates in mix III was smaller than in mixes I, II, and V, and this could make the route for crack propagation between aggregate interfaces shorter. For this reason, the cracking in mix III could grow following an irregular path and avoiding the aggregates. Thus, it required less fracture energy, as observed from the first branch slope, a1, of the bilinear tension softening diagram (Table 7). It could be considered that the path follow by cracks in mixes I, II, and V, which have larger aggregates would be much longer, thus the crack propagation is generated following a straighter route, breaking the aggregates, so a higher ft is necessary and the fracture energy needed is higher, as seen by the higher values of a1 (Table 7).
According to some authors [46,49], the value of second linear branch of the bilinear softening diagram, a2, is a result of the aggregate interlock, which is primarily governed by the maximum size and the texture of the coarse aggregate used in the concrete mix. As aforementioned in Section 2.1, the texture of the coarse slag (i.e., SCA) is different, with more irregularities, than the texture of the coarse natural aggregate (i.e., NCA). Additionally, the mixes with slag aggregates have a higher slope in a2, resulting in a concrete with lower ductility and more fracture energy. Nonetheless, this influence also appears in mix II, which does not have coarse slag (SCA) but fine slag (SFA), suggesting that texture in fine slag can also has an effect on the value of a2.
With regards to the crack analysis and according to the discrete crack model of Hillerborg [55], there is a zone where material is in tension and the deterioration mechanisms to produce the cracking of concrete occurs. This zone is so-called fracture process zone (FPZ) and its size is related with the ductility of the material—the larger this area is, the more ductility the material has. Nevertheless, it is not simple to calculate the size of it. Associated with this magnitude, the characteristic length (lch) of a material, which is based in a cohesive model, can be considered to be proportional to the size of FPZ [56]. From a comparative analysis, a longer characteristic length, lch, means a larger FPZ and, subsequently, more ductile behaviour. The characteristic length is calculated, as follows:
l c h = E c G F f t 2 ,
Table 8 shows the average values of the characteristic length. As was mentioned in Section 3.4, the mixes with a higher tensile strength tend to be mixtures with a lower fracture energy. When considering that characteristic length is proportional to fracture energy and inverse to tensile strength, mix III—which had previously the highest value of fracture energy (Table 6) between the mixtures with bilinear correlation calculated—is now the mix with a higher value of characteristic length (Table 8), which means the more ductile of them. The characteristic length value is influenced by the maximum coarse aggregate size [15], but for mixes I and II, the maximum coarse aggregate is the same, so the reduction of value produced, of around 27%, suggests that fine slag (i.e., SFA) produces concretes with lower ductility than the natural fine aggregate (i.e., NFA). The characteristic length of mix V is between the values for mix II and III, which is probably influenced by the reasons that make the characteristic length of mix II gets lower and that make the characteristic length of mix III higher. Furthermore, the lower characteristic length corresponds to the sharper load-deflection curves; meanwhile the longest characteristic lengths are related with the widest curves.
With the parameters that were obtained for bilinear tension softening diagram of mix III (Table 7), the load-crack mouth opening displacement (CMOD) curve of these mix would be the dotted line represented in Figure 8. The real curve that was obtained with the data test is also represented as a comparison.

3.6. Leaching Analysis

Materials that are to be appropriated for the construction industry must not significate a hazard to the safety, hygiene, or health of workers, occupants, or neighbours, as well as not having a high impact during their service life on the quality of the environment or the climate. Nowadays, there are countries with heavy metal leaching regulations of wastes in concrete and others in absence of this. For example, there is no any specific regulation in Spain regarding the emissions of heavy metals with regards to the re-use of wastes in building materials with respect to the difference with other countries as Italy has a regulation [57]. For this reason, the leaching test according to the EN 12457-4:2003 standard [50] frequently performed in the waste management field has been carried out in this work. Table 9 shows air-cooled blast furnace slag and cement leaching data of some heavy metals and they are compared with the limits that are stated by the European Union waste landfill directive [58]. The landfill directive can define three categories: inert, non-hazardous, and hazardous wastes. The results show that the air-cooled blast furnace slag can be considered as an inert waste. Only Se, Cr, and Ba in the ACBFS presented values that are higher than limit detection, but only a 3.3% wt of Se, 0.13% wt of Ba, and 5.6% wt of Zn were leaching (see Table 2). The rest of compounds in the leachate are similar to that of the cement.
In the case of the utilization of blast furnace slags in roads construction in Spain, there are some regional leaching regulations and limits using the test according to the EN 12457-4:2003 standard [50], like those that were established by the Autonomous Government of Catalonia [59], Cantabria [60], and Basque Country [61]. They established regional regulations for recycling of metallurgical and municipal solid waste incineration slag in pavement roads. Italy has a national regulation for the reuse of wastes [57] using the same leaching test. In Spain, Catalonia, and Cantabria present the same limits, but Basque Country present different limits. Table 5 shows the values that were obtained with the EN 12457-4:2003 standard [50] and compared to the different limits of the different regulations. The limits are different depending on the regulation, and subsequently, the ACBFS could be used in Catalonia, Cantabria, and Italy, a country with a specific regulation of wastes in construction material, but not in the Basque Country, because the Se content is higher than the limit. The lack of regulated specific tests and/or the different limits (in the case that the specific test exists) avoid the progress of a market where wastes can be used as construction materials.

4. Conclusions

In this paper, the results of the mechanical and fracture properties of five different mixes with a partial and total substitution of natural aggregates by air-cooled blast furnace slag aggregates have been compared to assess the applicability of these mixes as structural concretes, and additionally leaching tests have been carried out to assess the safe application of this waste. From the results, the following conclusions can be drawn:
Self-compacting concrete with air-cooled blast furnace slag aggregates requires an additional water to compensate the high water absorption of these aggregates or vibration. A saturation procedure of the aggregates is necessary, ensuring the acceptable flowability of the concrete. However, it is an interesting partial substitute that, in certain doses, maintains the self-compacting properties of the concrete. For non-self-compacting concretes, the blast furnace slag maintains and can even improve the mechanical properties of concrete made with natural aggregates.
Even with partial substitutions, not close to a full replacement, the mechanical properties are substantially lost. If there is an option for vibrating the concrete, or if the substitution is made in low amounts (less than 25% of total aggregate), the mechanical properties results are still high enough for structural purposes. From a leaching point of view, ACBFS have presented no significant problems regarding both leaching. However, the wide variety of limits for the same leaching test in different regions and countries do not let its recycling in all of them.
All of these benefits, along with the environmental advantages of using air-cooled blast furnace slag, make ACBFS an interesting material in the production of self-compacting concrete for low replacements of natural aggregates.

Author Contributions

Conceptualization, H.C. and C.L. Methodology, J.D.R., C.L. and H.C. Validation and formal analysis, A.V., J.D.R. and A.M.-D.l.C. Investigation, J.D.R. and A.M.-D.l.C. Funding acquisition, H.C. All authors wrote the paper and approved the submitted version.

Funding

This research was funded by the Ministry of Finance and Competitiveness (Ministerio de Economía y Competitividad) of Spain, grant number BIA2016-75431-R and the VI Plan Propio de Investigación of the University of Seville.

Acknowledgments

The natural coarse aggregate used was supplied by Tajeldi S.A. company and the blast furnace slag from EDERSA company.

Conflicts of Interest

The authors declare no conflict of interest.

References

  1. Ozbakkaloglu, T.; Gu, L.; Fallah Pour, A. Normal- and high-strength concretes incorporating air-cooled blast furnace slag coarse aggregates: Effect of slag size and content on the behavior. Constr. Build. Mater. 2016, 126, 138–146. [Google Scholar] [CrossRef]
  2. World Steel Association. Steel Statistical Yearbook 2014; World Steel Association: Brussels, Belgium, 2014. [Google Scholar]
  3. Balczár, I.; Korim, T.; Hullár, H.; Boros, A.; Makó, É. Manufacture of air-cooled slag-based alkali-activated cements using mechanochemical activation. Constr. Build. Mater. 2017, 137, 216–223. [Google Scholar] [CrossRef]
  4. Netinger, I.; Barišić, I.; Fučić, A.; Bansode, S.S. Characteristics and Uses of Steel Slag in Building Construction; Woodhead Publishing: Cambridge, UK, 2016; Volume 194. [Google Scholar]
  5. van Oss, H.G. Iron and Steel Slag. Mineral Yearbook; U.S. Geological Survey: Washington, DC, USA, 2013.
  6. Pacheco-Torgal, F.; Ding, Y.; Jalali, S. Properties and durability of concrete containing polymeric wastes (tyre rubber and polyethylene terephthalate bottles): An overview. Constr. Build. Mater. 2012, 30, 714–724. [Google Scholar] [CrossRef] [Green Version]
  7. Leiva, C.; Arenas, C.; Cifuentes, H.; Vilches, L.F.; Ríos, J.D. Radiological, leaching and mechanical properties of cocombustion fly ash in cements. J. Hazard. Toxic Radioact. Waste 2017, 21, 04017011. [Google Scholar] [CrossRef]
  8. Hooton, R.D. Canadian use of ground granulated blast-furnace slag as a supplementary cementing material for enhanced performance of concrete. Can. J. Civ. Eng. 2000, 27, 754–760. [Google Scholar] [CrossRef]
  9. Akaözolu, S.; Ati, C.D. Effect of Granulated Blast Furnace Slag and fly ash addition on the strength properties of lightweight mortars containing waste PET aggregates. Constr. Build. Mater. 2011, 25, 4052–4058. [Google Scholar] [CrossRef]
  10. Ashby, J. Air cooled blast furnace slag as a concrete aggregate for engineering construction. In Proceedings of the National Symposium on the Use of Recycled Materials in Engineering Construction, Sydney, Australia, 30–34 May 1996. [Google Scholar]
  11. Valcuende, M.; Benito, F.; Parra, C.; Miñano, I. Shrinkage of self-compacting concrete made with blast furnace slag as fine aggregate. Constr. Build. Mater. 2015, 76, 1–9. [Google Scholar] [CrossRef]
  12. Kumar Karri, S.; Rao, G.V.R.; Raju, P.M. Strength and Durability Studies on GGBS Concrete. Int. J. Civ. Eng. 2015, 2, 34–41. [Google Scholar] [CrossRef]
  13. Deeb, R.; Karihaloo, B.L. Mix proportioning of self-compacting normal and high-strength concretes. Mag. Concr. Res. 2013, 65, 546–556. [Google Scholar] [CrossRef]
  14. Cifuentes, H.; Ríos, J.D.; Gómez, E.J. Effect of mix design on the size-independent fracture energy of normal- and high-strength self-compacting concrete. Mater. Constr. 2018, 68, 1–11. [Google Scholar] [CrossRef]
  15. Alyhya, W.S.; Abo Dhaheer, M.S.; Al-Rubaye, M.M.; Karihaloo, B.L. Influence of mix composition and strength on the fracture properties of self-compacting concrete. Constr. Build. Mater. 2016, 110, 312–322. [Google Scholar] [CrossRef]
  16. Alyhya, W.S.; Kulasegaram, S.; Karihaloo, B.L. Simulation of the fl ow of self-compacting concrete in the V-funnel by SPH. Cem. Concr. Res. 2017, 100, 47–59. [Google Scholar] [CrossRef]
  17. Dhaheer, M.S.A.; Kulasegaram, S.; Karihaloo, B.L. Simulation of self-compacting concrete fl ow in the J-ring test using smoothed particle hydrodynamics (SPH). Cem. Concr. Res. 2016, 89, 27–34. [Google Scholar] [CrossRef]
  18. EN 197-1:2011. Cement—Part 1: Composition, Specifications and Conformity Criteria for Common Cements; European Committee for Standarization (CEN): Brussels, Belgium, 2011.
  19. EN 934-2:2010. Admixtures for Concrete, Mortar and Grout—Part 2: Concrete Admixtures-Definitions, Requirements, Conformity, Marking and Labelling; European Committee for Standarization (CEN): Brussels, Belgium, 2010.
  20. EN-12620:2013. Aggregates for Concrete; British Standards Institution: London, UK, 2013.
  21. EN 1097-6:2014 Tests for Mechanical and Physical Properties of Aggregates-Part 6: Determination of Particle Density and Water Absorption; Brussels, European Committee for Standarization (CEN): Brussels, Belgium, 2014.
  22. EN-12390-2:2001. Testing Hardened Concrete Part 2: Making and Curing Specimens for Strength Tests; European Committee for Standarization (CEN): Brussels, Belgium, 2011.
  23. Aiqin, W.; Chengzhi, Z.; Ningsheng, Z. Theoretic analysis of the influence of the particle size distribution of cement system on the property of cement. Cem. Concr. Res. 1999, 29, 1721–1726. [Google Scholar] [CrossRef]
  24. Sprung KK-GE. Particle Size Distribution and Properties of Cement. Part I: Strength of Portland Cement; Bauverlag GmbH: Gütersloh, Germany, 1985; pp. 136–145. [Google Scholar]
  25. EN 12350-5:2009. Testing Fresh Concrete—Part 5: Flow Table Test; European Committee for Standarization (CEN): Brussels, Belgium, 2009.
  26. EN-12390-3: 2009. Testing Hardened Concrete Part 3: Compressive Strength of Test Specimens; AENOR: Madrid, Spain, 2009.
  27. Chen, X.; Wu, S.; Zhou, J. Influence of porosity on compressive and tensile strength of cement mortar. Constr. Build. Mater. 2013, 40, 869–874. [Google Scholar] [CrossRef]
  28. Li, D.; Li, Z.; Lv, C.; Zhang, G.; Yin, Y. A predictive model of the effective tensile and compressive strengths of concrete considering porosity and pore size. Constr. Build. Mater. 2018, 170, 520–526. [Google Scholar] [CrossRef]
  29. Kumar, R.; Bhattacharjee, B. Porosity, pore size distribution and in situ strength of concrete. Cem. Concr. Res. 2003, 33, 155–164. [Google Scholar] [CrossRef]
  30. Chindaprasirt, P. Cement paste characteristics and porous concrete properties. Constr. Build. Mater. 2008, 22, 894–901. [Google Scholar] [CrossRef]
  31. Pantazopoulou, J.S.; Mills, R.H. Microstructural Aspects of the Mechanical Response of Plain Concrete. Mater. J. 1995, 92, 605–616. [Google Scholar] [CrossRef]
  32. Auskern, A.; Horn, W. Capillary Porosity in Hardened Cement Paste. J. Test. Eval. 1973, 1, 74–79. [Google Scholar] [CrossRef]
  33. Yudenfreund, M.; Hanna, K.M.; Skalny, J.; Odler, I.; Brunauer, S. Hardened portland cement pastes of low porosity. V. Compressive strength. Cem. Concr. Res. 1972, 2, 731–743. [Google Scholar] [CrossRef]
  34. UNE 83515:2010. Fibre Reinforced Concrete. Determination of Cracking Strength, Ductility and Residual Tensile Strength. Barcelona Test; AENOR: Madrid, Spain, 2010.
  35. Perepérez Ventura, B.; Barbera Ortega, E.; Galván Llopis, V.; Curras Cayón, A.; Balash Parici, S.; Moscardó Martín, J.A. Concrete Indirect Tensile Strength By Double Punch Test. Influence of the aggregates maximum size and of the eccentricity. Inf. Constr. CSIC 1985, 37, 374. [Google Scholar]
  36. Chen, W.F. Double Punch Test for Tensile Strength of Concrete, Sept (70-18) PB224770/AS (NTIS). Fritz Laboratory Reports. 1969. Available online: https://preserve.lehigh.edu/cgi/viewcontent.cgi?article=2994&context=engr-civil-environmental-fritz-lab-reports (accessed on 20 March 2019).
  37. Bortolotti, L. Double-Punch Test for Tensile and Compressive Strengths in Concrete. Mater. J. 1988, 85, 26–32. [Google Scholar] [CrossRef]
  38. Marti, P. Size Effect in Double-Punch Tests on Concrete Cylinders. Mater. J. 1989, 86, 597–601. [Google Scholar] [CrossRef]
  39. Blanco, A.; Pujadas, P.; Cavalaro, S.; Fuente ADe Aguado, A. Cement & Concrete Composites Constitutive model for fibre reinforced concrete based on the Barcelona test. Cem. Concr. Compos. 2014, 53, 327–340. [Google Scholar] [CrossRef]
  40. Rilem, D.R. RILEM TCM-85, Determination of the fracture energy of mortar and concrete by means of three-point bend tests on notched beams. Mater. Struct. 1985, 18, 287–290. [Google Scholar] [CrossRef]
  41. Guinea, G.V.; Planas, J.; Elices, M. Measurement of the fracture energy using three-point bend tests: Part 1-Influence of experimental procedures. Mater. Struct. 1992, 25, 212–218. [Google Scholar] [CrossRef]
  42. Elices, M.; Guinea, G.V.; Planas, J. Measurement of the fracture energy using three-point bend tests: Part 3- Influence of cutting the P-δ tail. Mater. Struct. 1992, 25, 327–334. [Google Scholar] [CrossRef]
  43. Planas, J.; Elices, M.; Guinea, G.V. Measurement of the fracture energy using three-point bend tests: Part 2-Influence of bulk energy dissipation. Mater. Struct. 1992, 25, 305–312. [Google Scholar] [CrossRef]
  44. Cifuentes, H.; Karihaloo, B.L. Analysis of the early-age cracking in concrete made from rapid hardening cement. Hormigón Y Acero 2018, 69, 101–112. [Google Scholar] [CrossRef]
  45. Ostergard, L. Early-Age Fracture Mechanics and Cracking of Concrete. Experimetnal and Modelling. Ph.D. Thesis, Technical University of Denmark (DTU), Kongens Lyngby, Denmark, 2003. [Google Scholar]
  46. Ramachandra Murthy, A.; Karihaloo, B.L.; Iyer, N.R.; Raghu Prasad, B.K. Bilinear tension softening diagrams of concrete mixes corresponding to their size-independent specific fracture energy. Constr. Build. Mater. 2013, 47, 1160–1166. [Google Scholar] [CrossRef]
  47. Park, K.; Paulino, G.H.; Roesler, J. Cohesive fracture model for functionally graded fiber reinforced concrete. Cem. Concr. Res. 2010, 40, 956–965. [Google Scholar] [CrossRef]
  48. Ríos, J.D.; Leiva, C.; Ariza, M.P.; Seitl, S.; Cifuentes, H. Analysis of the tensile fracture properties of ultra-high-strength fiber-reinforced concrete with different types of steel fibers by X-ray tomography. Mater. Des. 2019, 107582. [Google Scholar] [CrossRef]
  49. Abdalla, H.M.; Karihaloo, B.L. A method for constructing the bilinear tension softening diagram of concrete corresponding to its true fracture energy. Mag. Concr. Res. 2004, 56, 597–604. [Google Scholar] [CrossRef] [Green Version]
  50. EN 12457-4: 2003. Characterization of Waste: Leaching. Compliance Test for Leaching of Granular Waste Material and Sludges, Part 2: One Stage Batch Test at a Liquid to Solid Ratio of 10L/kg for Materials with Particle Size below 10 mm (without or with Size Reaction); European Committee for Standarization (CEN): Brussels, Belgium, 2003.
  51. Neville, A. Properties of Concrete; Pearson Education Limited: Essex, UK, 2011. [Google Scholar]
  52. Felekoǧlu, B.; Türkel, S.; Baradan, B. Effect of water/cement ratio on the fresh and hardened properties of self-compacting concrete. Build. Environ. 2007, 42, 1795–1802. [Google Scholar] [CrossRef]
  53. Cifuentes, H.; Leiva, C.; Medina, F.; Fernández-Pereira, C. Effects of fibers and rice husk ash on properties of heated high-strength concrete. Mag. Concr. Res. 2012, 64, 457–470. [Google Scholar] [CrossRef]
  54. Zhou, X.Q.; Hao, H. Mesoscale modelling of concrete tensile failure mechanism at high strain rates. Comput. Struct. 2008, 86, 2013–2026. [Google Scholar] [CrossRef]
  55. Hillerborg, A.; Modéer, M.; Peterson, P.E. Analysis of crack formation and crack growth by means of fracture mechanics and finite elements. Cem. Concr. Res. 1976, 6, 773–782. [Google Scholar] [CrossRef]
  56. Cifuentes, H.; Medina, F. Mecánica de la Fractura Aplicada al Hormigón. Conceptos, Análisis Experimental y Modelos Numéricos; Secretariado de Publicaciones de la Universidad de Sevilla: Seville, Spain, 2013; ISBN 978-84-472-1481-5. [Google Scholar]
  57. Ministero dell’ambientee della tutela del territorio. Individuazione Dei Rifiuti Non Pericolosi Sottoposti Alle Procedure Semplificate Di Recupero Ai Sensi Degli Articoli 31 E 33 Del Decreto Legislativo 05/02/1997. Gazzetta Ufficiale 19 May 2006 N. 115; Ministero dell’ambientee della tutela del territorio: Rome, Italy, 2006. [Google Scholar]
  58. European Commission. Establishing Criteria and Procedures for the Acceptance of Waste at Landfills. Council Decision 2003/33/EC of 19 December 2002; European Committee for Standarization (CEN): Brussels, Belgium, 2002. [Google Scholar]
  59. Departamento de Medio ambiente de Generalitat de Catalunya. Generalitat de Catalunya DO (1996). Order on Valorization of Slags; Diario Oficial de Cataluña: Barcelona, Spain, 1996. [Google Scholar]
  60. Consejería de Medio Ambiente de la comunidad de Cantabria. Decreto 104/2006, de 19 de Octubre, de Valorización de Escorias En La Comunidad Autónoma de Cantabria; Boletín oficial de Cantabria: Santander, Spain, 2006. [Google Scholar]
  61. Consejería de Ordenacion del Territorio y Medio Ambiente del Pais Vasco. Decreto 34 Del País Vasco, Por El Que Se Regula La Valorización Y Posterior Utilización de Escorias Procedentes de La Fabricación de Acero En Hornos de Arco Eléctrico, En El Ámbito de La Comunidad Autónoma Del País Vasco; Boletín Oficial del País Vasco: Bilbao, España, 2003. [Google Scholar]
Figure 1. Grading distribution of aggregates.
Sustainability 11 01702 g001
Figure 2. Slag coarse aggregate (SCA) (a) and natural coarse aggregate (NCA) (b).
Sustainability 11 01702 g002
Figure 3. Mix I (a) and mix IV (b).
Sustainability 11 01702 g003
Figure 4. Measured of fresh concrete consistency through flow table tests (a) diameter of flow and (b) border of flow for Mix II.
Sustainability 11 01702 g004
Figure 5. Scheme of the stress—crack opening relationship.
Sustainability 11 01702 g005
Figure 6. Load–deflection curves from three-point bending tests of mixes.
Sustainability 11 01702 g006
Figure 7. Normalised bilinear stress-crack opening diagram for mixes.
Sustainability 11 01702 g007
Figure 8. Experimental and estimated load-crack mouth opening displacement (CMOD) curves for mix III.
Sustainability 11 01702 g008
Table 1. Mix proportions of concrete mixes in kg/m3.
Mixes
ConstituentsIIIIIIIVV 1
Cement386
Water194194194232194
Natural fine aggregate (NFA) < 3 mm10405201040-520
Slag fine aggregate (SFA) < 2.5 mm-520-1040520
Natural coarse aggregate (NCA) < 10 mm693693347-347
Slag coarse aggregate (SCA) 2.5–10 mm--347693347
Superplasticizer (SP)3.4
1 Vibrated concrete.
Table 2. Chemical analysis of constituents.
CompoundcementNFANCASFA/SCASFA/SCA (minor compounds)(mg/kg)
SiO220.9695.60.0135.12Hg<1.5
Al2O35.742.410.069.12Se1.8
Fe2O32.460.080.020.42Pb<1.5
MnO20.10--0.41Ba621.4
MgO1.500.02-6.06Cd<1.5
CaO60.890.0955.7443.14Cr28.7
Na2O0.360.28-0.19As<1.5
K2O0.731.49-0.54Ni2.5
TiO20.280.04-0.76Zn2.6
P2O50.17---Cu8.2
SO31.11--1.77Co<1.5
BaO---0.11Sn<1.5
Loss on ignition5.20.244.011.47V14.3
Table 3. Density of concrete mixes.
MixIIIIIIIVV 1
Density (kg/m3)2.282.212.171.972.31
standard deviation0.98%1.88%2.64%1.22%2.63%
1 Vibrated concrete.
Table 4. Compressive strength of concrete mixes.
MixIIIIIIIVV 1
fc (MPa)41.226.523.711.856.7
standard deviation4.5%7.9%0.9%12.0%4.2%
1 Vibrated concrete.
Table 5. Results of tensile strength.
MixIIIIIIIVV 1
Maximum load (N)81,17571,25069,55020,01680,325
fct (MPa)3.32.92.70.63.1
Standard deviation4.8%3.0%10.3%2.8%8.4%
1 Vibrated concrete.
Table 6. Maximum load and fracture energy of each mix.
MixIIIIIIV 1
Maximum load (N)1847186117281831
GF (N/m)46.4 ± 3.4%51.3 ± 10.3%60.6 ± 11.7%46.5 ± 10.8%
1 Vibrated concrete.
Table 7. Parameters of bilinear tension softening diagrams.
Mixft (MPa)a1a2b2Ec (GPa)
I3.139.90.420.10029.2
II3.440.21.790.19925.4
III2.830.80.920.14924.7
V 13.439.42.180.19325.6
1 Vibrated concrete.
Table 8. Characteristic length for each mix.
MixIIIIIIV
lch (mm)165.3120.2182.8147.0
Table 9. Leaching results according to EN 12457-4:2003 [50] leachability of air-cooled blast furnace slag (ACBFS) and cement (in mg/kg, dry basis). Comparison of the leaching results with the limits of European Union waste landfill directive, Catalonia (OCVE) and Cantabria (CA), Basque Country (PV) and Italy.
ACBFSCementInert wasteNon-hazardous wasteHazardous wasteOCVE and CA limits (mg/kg)PV limit (mg/kg)Italian Ministerial Decree 186 (mg/kg)
Hg<0.01<0.010.010.220.01-0.01
Se0.07 ± 0.01<0.050.10.570.10.0070.1
Pb<0.05<0.050.510500.5-0.5
Ba0.7 ± 0.09<0.0520100300201710
Cd<0.02<0.020.04150.040.0090.05
Sb<0.02<0.020.060.750.06-
Cr<0.05<0.050.510700.52.60.5
As<0.2<0.20.52250.5-0.5
Mo<0.02<0.020.510300.51.3-
Ni<0.05<0.050.410400.40.80.1
Zn0.12 ± 0.02<0.0245020041.230
Cu<0.05<0.052501002-0.5
Co<0.02<0.01-----2.5
Sn<0.25<0.05-- ---
V0.16 ± 0.01<0.02-- -1.32.5

