Article

2008–2017 Bogota River Water Quality Assessment Based on the Water Quality Index

by
Daissy Milena Díaz-Casallas
1,
Mario Fernando Castro-Fernández
2,
Elvira Bocos
3,
Carlos Enrique Montenegro-Marin
1 and
Rubén González Crespo
3,*
1
Engineering Faculty, Universidad Distrital Francisco José de Caldas and Colombia, Bogota 110111, Columbia
2
Engineering Faculty, Universidad Cooperativa de Colombia, Bogota 110111, Columbia
3
School of Engineering, Universidad Internacional de La Rioja, 26006 Logroño, Spain
*
Author to whom correspondence should be addressed.
Sustainability 2019, 11(6), 1668; https://doi.org/10.3390/su11061668
Submission received: 23 January 2019 / Revised: 8 March 2019 / Accepted: 8 March 2019 / Published: 19 March 2019

Abstract

:
This article provides a deep analysis of the water quality at the upper basin of the Bogota River (Colombia) between 2008 and 2017. The Water Quality Index has been the indicator employed to determine the ecological status of the river. This index was chosen in order to normalize the analysis, given that it is commonly used by the Institute of Hydrology, Meteorology and Environmental Studies, a government agency of the Ministry of Environment and Sustainable Development of Colombia, to determine the state of surface effluents. The results obtained were organized in a double-entry matrix in order to relate the variables of the sample period and the sampling station. The research revealed an insufficient quality of water, demonstrating that the high stretch of the Bogota River basin has, in general, regular or acceptable water quality, while only five stations showed an acceptable status. Surprisingly, the stations located close to the wastewater treatment plants of the municipalities of Choconta, Suesca, Gachancipa, and Tocancipa, as well as Rio Negro, have a poor water quality, discharging a high load of contaminants into the river. Although great efforts have been made by Colombian authorities to restore the critical state of the majority of their aquatic ecosystems, recent implementation of policies and instruments have not shown significant achievements yet. For this reason, this study aims to present a powerful decision-tool for the monitoring and evaluation of correction measures implemented on this river basin. The data used in this research were provided by the Regional Autonomous Corporation of Cundinamarca.

1. Introduction

From the past few decades, growing pressures and overexploitation of hydric resources have provoked an extreme quality decay of surface and groundwater. Industrial pollution, agriculture activities and increasing citizen demands are some of the major factors responsible for the water deterioration. Many researchers have focused their efforts on the development of environmentally friendly and powerful treatments that can completely degrade persistent and organic contaminants [1,2]. Meanwhile, authorities are already implementing measures in order to stop the entrance of contaminants on water bodies.
For this reason, monitoring may be the most important activity for the correct management of hydric resources. Early detection of dangerous trends in water quality is the only way to detect the negative impacts of pollution and to implement correction and prevention measures. As stated by Burt, Howden & Worral [3], monitoring is not only a question of analytical measurement, but it is also essential in order to make these data available for environmental authorities and the scientific community. Likewise, it is necessary to evaluate and tailor up different methodologies in order to determine the most efficient method for establishing the real state of the groundwater and rivers.
Monitoring of water sources must become one of the main options for surveillance. Furthermore, obtained data should be presented in an open format, allowing reuse and statistical analysis [4]. Diverse methodologies have been used in the assessment and evaluation of water bodies, including comparison of variables with current regulations, the Water Quality Index (WQI) and simulation methodologies [5].
Many indicators have been employed in the evaluation of water quality status. More efforts have been made to develop more accurate methodologies that are able to determine the state of rivers in an easy way, especially in the last two decades. Examples include the Shannon Diversity Index, the Biological Monitoring Working Party Index and the WQI.
Among them, the WQI has shown to be an excellent indicator. In fact, environmental authorities of many different countries are using this methodology to evaluate the status of water bodies under their management. As it will be further explained in State of the Art (Section 2), this indicator seems to be a powerful tool that integrates biological and chemical variables in the classification and evaluation of surface effluents. From the determination of the five variables typically analysed in water, data obtained through these analyses can be integrated in a simple calculation, thus making it possible to determine the quality status of a river basin [4].
Despite being probably the most important activity for the correct management of water resources, the periodic monitoring of effluents in Colombia has been insufficiently performed. According to the National Water Study conducted by the Institute of Hydrology, Meteorology and Environmental Studies (IDEAM) in 2000, the measurement of physical–chemical parameters in Colombia is a routine activity. Notwithstanding, although these indicators are regularly employed to estimate the WQI of spills coming from the oil industry and some regional autonomous corporations like Bogota, Barranquilla, Bucaramanga, Cali or Manizales, research by Samboni et. al. [6] demonstrated that the calculation of water quality indices is not as routine in urban wastewater and river basin management, as wrongly believed.
In this context, one of the goals of the National Policy of Integral Management of Hydric Resources (PNGIRH) in Colombia [7] is the improvement of water quality and the reduction of pollution, being used as a monitoring strategy. To accomplish this complex task, IDEAM has designed a network of environmental indicators, including the WQI, that are able to form a national monitoring network of water resources.
Unfortunately, neither this network not policy strategies have stopped the deterioration, especially in vulnerable populations like Bogota River. As expected, the higher part of this river does not have pollution, while industrial and urban spills at the end of the high basin have caused considerable levels of contamination, according to recent reports from the Governorate of Cundinamarca [8]. It is noteworthy that this zone uses irrigation for crops and so, the use of water without previous treatment may constitute an important risk not only to the ecological stability of the ecosystems but also for the population surrounding its Rivera.
These results reflect the importance of setting out the baseline status of river quality for implementation of correction measures through the PNGIRH. The knowledge of initial water status is crucial for Colombian authorities in order to measure the efficiency of their policies and, to confirm if their strategies are being met or redirection is needed.
In view of the aforementioned, the aim of this work is to develop a deep multi temporal analysis (from 2008 to 2017) able to set the quality status of the upper basin of the Bogota river using an easy analytical tool, which positively contributes to the fulfilment of the PNGIRH objectives.
In order to establish this baseline river quality status, methodology defined by IDEAM was employed to calculate the WQI. As described in the methodological section, data used as input in this study were pursued from the environmental laboratory of the Regional Autonomous Corporation of Cundinamarca (CAR). CAR is the environmental authority in Colombia responsible for the management of the Bogota River basin. For analytical determination, CAR follows official procedures described in the 22nd Edition of Standard Methods for the Examination of Water and Wastewater [9].
As can be concluded from the obtained results, this multi temporal analysis revealed insufficient quality in some points of the Bogota River linked to deficient management and insufficient monitoring tools. Therefore, this study creates an easy and efficient methodology for quickly determining the general state of the river, which may be an interesting alternative, not only for the scientific community, but also for stakeholders and public authorities.
Moreover, this study shows the heavy pressures that the Bogota River is suffering, reflecting the urgency for further studies and more stringent protection measures in order to stop deterioration of this environment.

2. State of the Art

In the last few decades, governments worldwide are getting increasingly aware of the importance of preliminary evaluation in order to establish a baseline status of water bodies, in order to determine the efficiency of implemented correction measures. Classification of effluents based on purity degree dates from the mid-twentieth century, with Horton’s studies in the 1960s and Landwehr in the 1970s [10].
Horton [11] was the first to develop a water quality index (WQI), demonstrating the alarming environmental problems that the aquatic ecosystems that were analyzed were suffering. By means of ten variables commonly monitored, such as dissolved oxygen (DO), total coliform counts, pH, specific conductance, alkalinity, chloride content, and temperature, Horton’s index was able to estimate the contamination of aquatic bodies, and was pioneering in the generation of a normalized methodology [12,13].
From then on, many researchers have modified Horton’s indicator in order to develop a more accurate methodology that integrates other types of variables, such as socio-economic activities. For instance, in 1970, Brown, MacClelland, Deininger and Tozer, supported by the National Sanitation Foundation of the United States of America (NSF), proposed an index based on the structure of Horton, known as the NSF Water Quality Index (NSWKI) [14].
In Spain, the General Quality Index (ICG), is the most extensively used, after being developed in 1983 by the former Ministry of Public Works (MOPU). This index is a dimensionless value obtained from 23 water quality parameters, processed by linear equations.
The Biological Monitoring Working Party (BMWP) score system [15] has been used by the regulatory authorities in the European Union since the arrival of the Water Framework Directive. BMWP is used to set the basis of the river invertebrate status classification system.
In 2011, Montoya et al. [16] adapted the Biological Monitoring Working Party index (BMWP/Col) to the specific conditions of Colombia and combined it with other indices like the Average Taxon Score (ASTPT), the Shannon Diversity Index (SHDI) and the Environmental Quality Index (EQA). These researchers aimed to identify the degree of alteration in which the different sections of the river were located and the relationship between the structure of aquatic macroinvertebrates and river pollution.
A recent study published by Giri et al. [17] reported that Shannon’s diversity index (SHDI) is an indicator commonly employed to determine the effect of water quality and able to relate its effect above land use, as also explained by Huang et al. [18].
The Water Quality Index (WQI) has become an excellent instrument to assess the status of hydric resources and make the main stakeholders aware of the ecological quality of effluents. Likewise, public diffusion is crucial to get citizens involved in the importance of quality and quantity conservation of this vital good [5].
According to Walsh and Wheeler [19], since its creation, the WQI has been widely used by several states and countries. This fact is mainly due to the simplicity and complete analysis that this index offers, combining physical, chemical and biological parameters in the same assessment [20]. Concretely, this indicator integrates information about different variables related to water quality in a single and normalized measuring scale [4,21].
Different research has been carried out by the Colombian scientific community. For instance, Finotti et al. [22] have successfully used the Water Quality Index (WQI, NSFWQI) as a tool for urban water resources management, in the state of Sao Paulo. In their study, they compare the quality of different effluents with the legal limits defined by Canadian rules. Their study demonstrates for whom the use of a normalized index is an excellent tool, either for water quality evaluation or to compare this quality with the state of any other water body around the world.
In 2015, Calvo and Mora [23] classified water quality in five classes using the Dutch Index, which obtains a global score from the analysis of three indicators, namely five-days biological oxygen demand (BOD5), dissolved oxygen (DO) and total organic nitrogen (N-NH4+). Basílico et al. [24] adapted and applied two new indices: Pampean Water Quality Index (ICAP) and Pampean Bank Quality Index (ICRP). The variables used for the calculation of the ICAP were total suspended solids (TSS), ammonia nitrogen (N-NH4+), total phosphorus (Pt), BOD5 and DO, in addition they calculated the Water Quality Index (ICA). These authors have successfully proven their indicator on the environmental assessment of two local creeks on the Pampeana plain, located in Colombia.
More recently, Madera et al. [25] determined the water quality at some tributary points of the Cesar River such as the River Calenturitas, Maracas and Tucuy, using aquatic macro invertebrates as bioindicators and applying the BMWP/Col index adapted for Colombia by Roldan (Biological Monitoring Working Party score).
An article by Giri et al. [17] concluded that most researchers normally focus their studies on simulation methodologies rather than monitoring a real scenario. However, statistical analysis has proven to be usually more efficient than water quality models.
As it may be deduced from all the aforementioned, experience has demonstrated the pivotal role of primary evaluation in setting out the initial status of effluents and determining the efficiency of implemented correction measures [26]. Periodic monitoring allows not only early detection of quality changes, but also recognition of the effectiveness of existing and new measures. Moreover, dissemination of results, free access and reuse of data is an excellent comparative and management tool [3].

3. Materials and Methods

This section describes the methodology used to perform a deep analysis of the ecological state of the upper basin of the Bogota River. In the same way, the data source, the treatment of them and the methodology used for the calculation and analysis of the WQI are described.

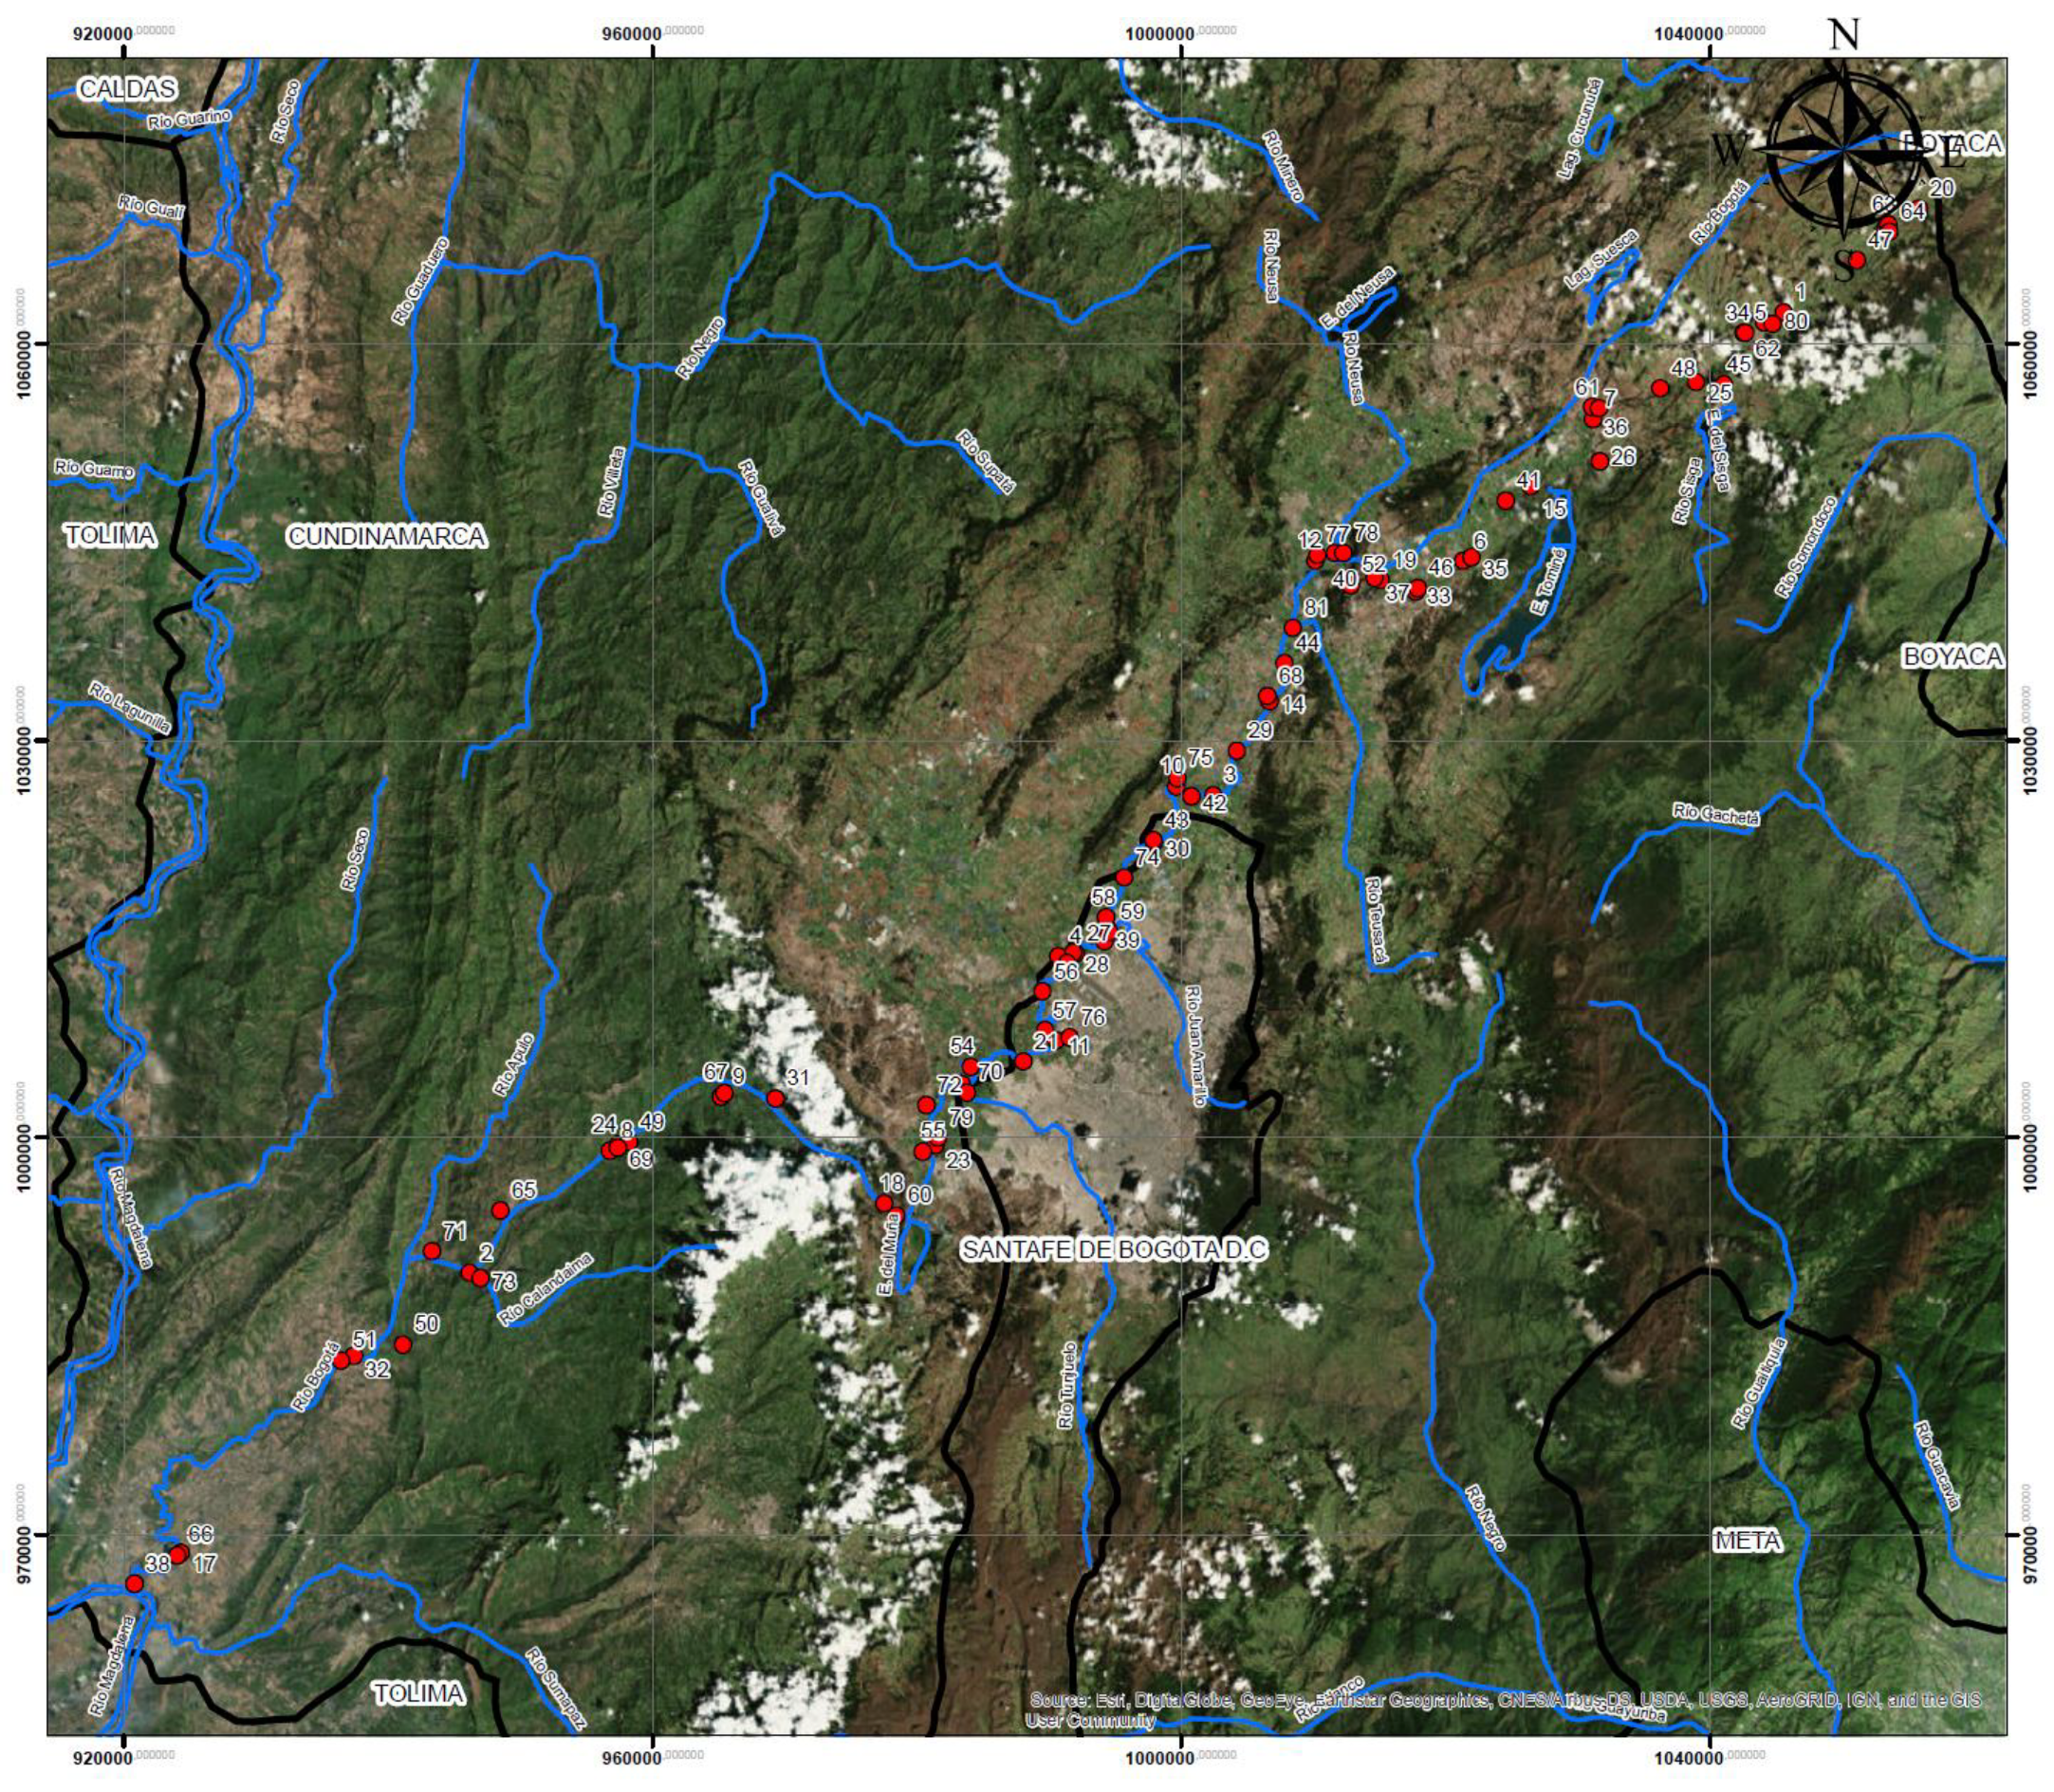
3.1. Description of the Area of Study

The Bogota River is located on the Magdalena watershed. It is born at 3300 m above sea level in the municipality of Villapinzon and flows into the Magdalena River at 280 m above sea level in the municipality of Girardot. It is the biggest river of the Magadalena watershed, which is composed of a natural system formed by ravines, rivers, lagoons and wetlands that, in most cases, are tributaries of the Bogota River and its regulation system, consisting of nine reservoirs and one irrigation district [27].
The economic activities developed in the basin equal approximately 26% of the total at national level, highlighted by agricultural production, which includes crops of cane, coffee, fruit trees, and bananas, livestock and industrial activities, such as leather processing and flower production [27].
Regarding morphological and physiographic characteristics, the watershed can be divided into three differentiated sectors: (1) the upper basin, which goes from its source to the north of the urban zone of the capital district, with a total length of 165 km; (2) the middle basin, from the beginning of the urban area of Bogota to the “Salto de Tequendama”, with a total length of 90 km and (3) the lower basin, from the “Salto de Tequendama” to its mouth in the Magdalena River, with a length of 55 km [8,28]. The majority of the basin has light to moderate erosion soil.
The river basin has approximately 45 municipalities representing a total of 1,297,752 inhabitants, of which 75.4% corresponds to urban population and 24.5% to rural population, not including the city of Bogota, which contributes 6,865,997 inhabitants [27].
As it may be seen in Figure 1, the upper basin of the Bogota River corresponds to the section located between the monitoring points (PM): upstream of Villlapinzon (PM 1) and station LG Puente Vargas (PM 32), and receives the downloads (direct or indirect) of the municipalities of Villapinzon, Choconta, Suesca, Sesquile, Guatavita, Gachancipa, Tocancia, Cogua, Nemocon, Zipaquira, Sopo and part of the downloads of La Calera and Cajica [28].

3.2. Data Collection

Data used in this research were provided by the official laboratory of the environmental authority of CAR. These measures were taken from 29 stations located on the higher part of the Bogota River basin. Concretely, dissolved oxygen (DO), total suspended solids (TSS), chemical oxygen demand (COD), electrical conductivity (EC) and pH were monitored during a representative period of 10 years, from 2008 to 2017. Table 1 details station names and their location. Likewise, the distribution of the monitoring stations in the study area is shown in Figure 1.

3.3. Pollution Index Calculation

As aforementioned, water quality indices have been used for more than 50 years, and their simplicity still makes them an excellent evaluation method. However, it is important to be clear about the availability and veracity of the information used for calculating these indicators.
In this study, a multi-temporal analysis was carried out using the Water Quality Index (WQI) developed by IDEAM. Concretely, to obtain the WQI described by IDEAM, five parameters were analyzed: dissolved oxygen, total suspended solids, chemical oxygen demand, electrical conductivity and pH. As already mentioned, the data employed in this research were supplied by CAR, an official Colombian organization, which ensures the veracity and quality of the study [29].
With each of the variables used to calculate the WQI (DO, SST, COD, CE and pH) a sub-index is calculated, the equations used to calculate these parameters are listed in Table 2.
where:
  • SPDO is saturation percentage of dissolved oxygen.
  • IDO is sub index of dissolved oxygen.
  • ISST is sub index of total suspended solids.
  • ICOD is sub index of chemical oxygen demand.
  • ICE is sub index of electrical conductivity
  • IpH is sub index of pH
Once the above mentioned parameters were obtained, WQInjt could be easily calculated by means of Equation (1) (Water quality index equation (Source: [29]):
W Q I n j t = ( i = 1 n W i × I i k j t )
where:
  • W Q I n j t is the water quality index of a determined surface current in the j water quality monitoring station at time t, evaluated based on n variables.
  • W i is the weight or relative weight assigned to the i quality variable.
  • I i k j t is the calculated value of the i variable (obtained after applying the functional curve or corresponding equation), in the j monitoring station, registered during the measurement made in the k quarter, of the t time period.
  • n is the number of quality variables involved in the indicator calculation; in our case, n equals 5.
Following indications of IDEAM, all variables which are described in Table 3, employed for the WQI calculation, have the same weight.
Table 4 shows the relationship between values, water quality score and colour.
Subsequently, a dual-entry matrix indicates the results obtained from calculating the indicator by relating them to the sampling taking stations, the period of analysis (2008–2017), and the WQI results. Additionally, these data were strictly analyzed by using descriptive and dispersion measures.

3.4. Analytical Determinations

After recovery, samples were kept under refrigeration at 4 °C, preventing them from light radiation. Finally, preparation of samples and analytical determination of DO, SST, COD, pH and conductivity were done following the official procedures described in the 22nd Edition of Standard Methods for the Examination of Water and Wastewater [9].

4. Results

Data used as input for the WQI calculation corresponded to the results of the Bogota River water quality monitoring conducted by CAR. These data were delivered in portable document format (PDF). This file was further converted into a flat file format for facilitating its introduction into the MySQL database engine. Furthermore, the information supplied by CAR was cleaned, selecting only the data required for the calculation of the WQI. Subsequently, this index was calculated from a sheet specifically tailored for this research, which took into account the one proposed by IDEAM [29].

4.1. Availability and Description of Data

With 29 monitoring stations and 19 periods in the study, a sample of 551 WQIs should have been available for analysis. However, as shown in Table 5 there were only 420 (76.2%) valid measures. The remaining 23.8% did not have sufficient information for a correct determination of this indicator. As can be seen in Table 5, the WQI data set has a median of 0.6, which is framed as acceptable quality. Furthermore, a typical variation of 0.15 was found, indicating slight data variability and high robustness of the analysis (see Table 5).
As displayed in Table 6, some monitoring stations, like Choconta Municipalty (Mun.) discharge, Choconta Mun. downstream, Lg—Saucio station, Lg—Florencia bridge station or Gachancipa Mun. discharge, had greater data availability, with each of them possessing 89.5% valid data.
In contrast, the Hacienda el Triunfo station only had data corresponding to periods 2008-1 and 2, 2009-1 and 2, 2015-2, 2016-1 and 2, and 2017-1, which corresponds to 42.1% of the total theoretical data that should have been available. This lack of information is due to the fact that during 2010, the phenomenon of “La Niña” severely hit Colombia, putting some monitoring stations out of service (see Table 6).
When assessing the availability of data grouped by time periods, we observed that except for the case submitted in 2011-02, in which no information concerning the WQI estimation was present, given the reasons already outlined, the 2012-02 and 2010-01 periods were ones in which the least WQIs were calculated, with 65.5 and 55.2% missing results.
By contrast, from 2015-02 to 2017-01, only one station missed results, leading us to calculate 96.6% of the WQI (see Table 7), where N is the number of values included or excluded.

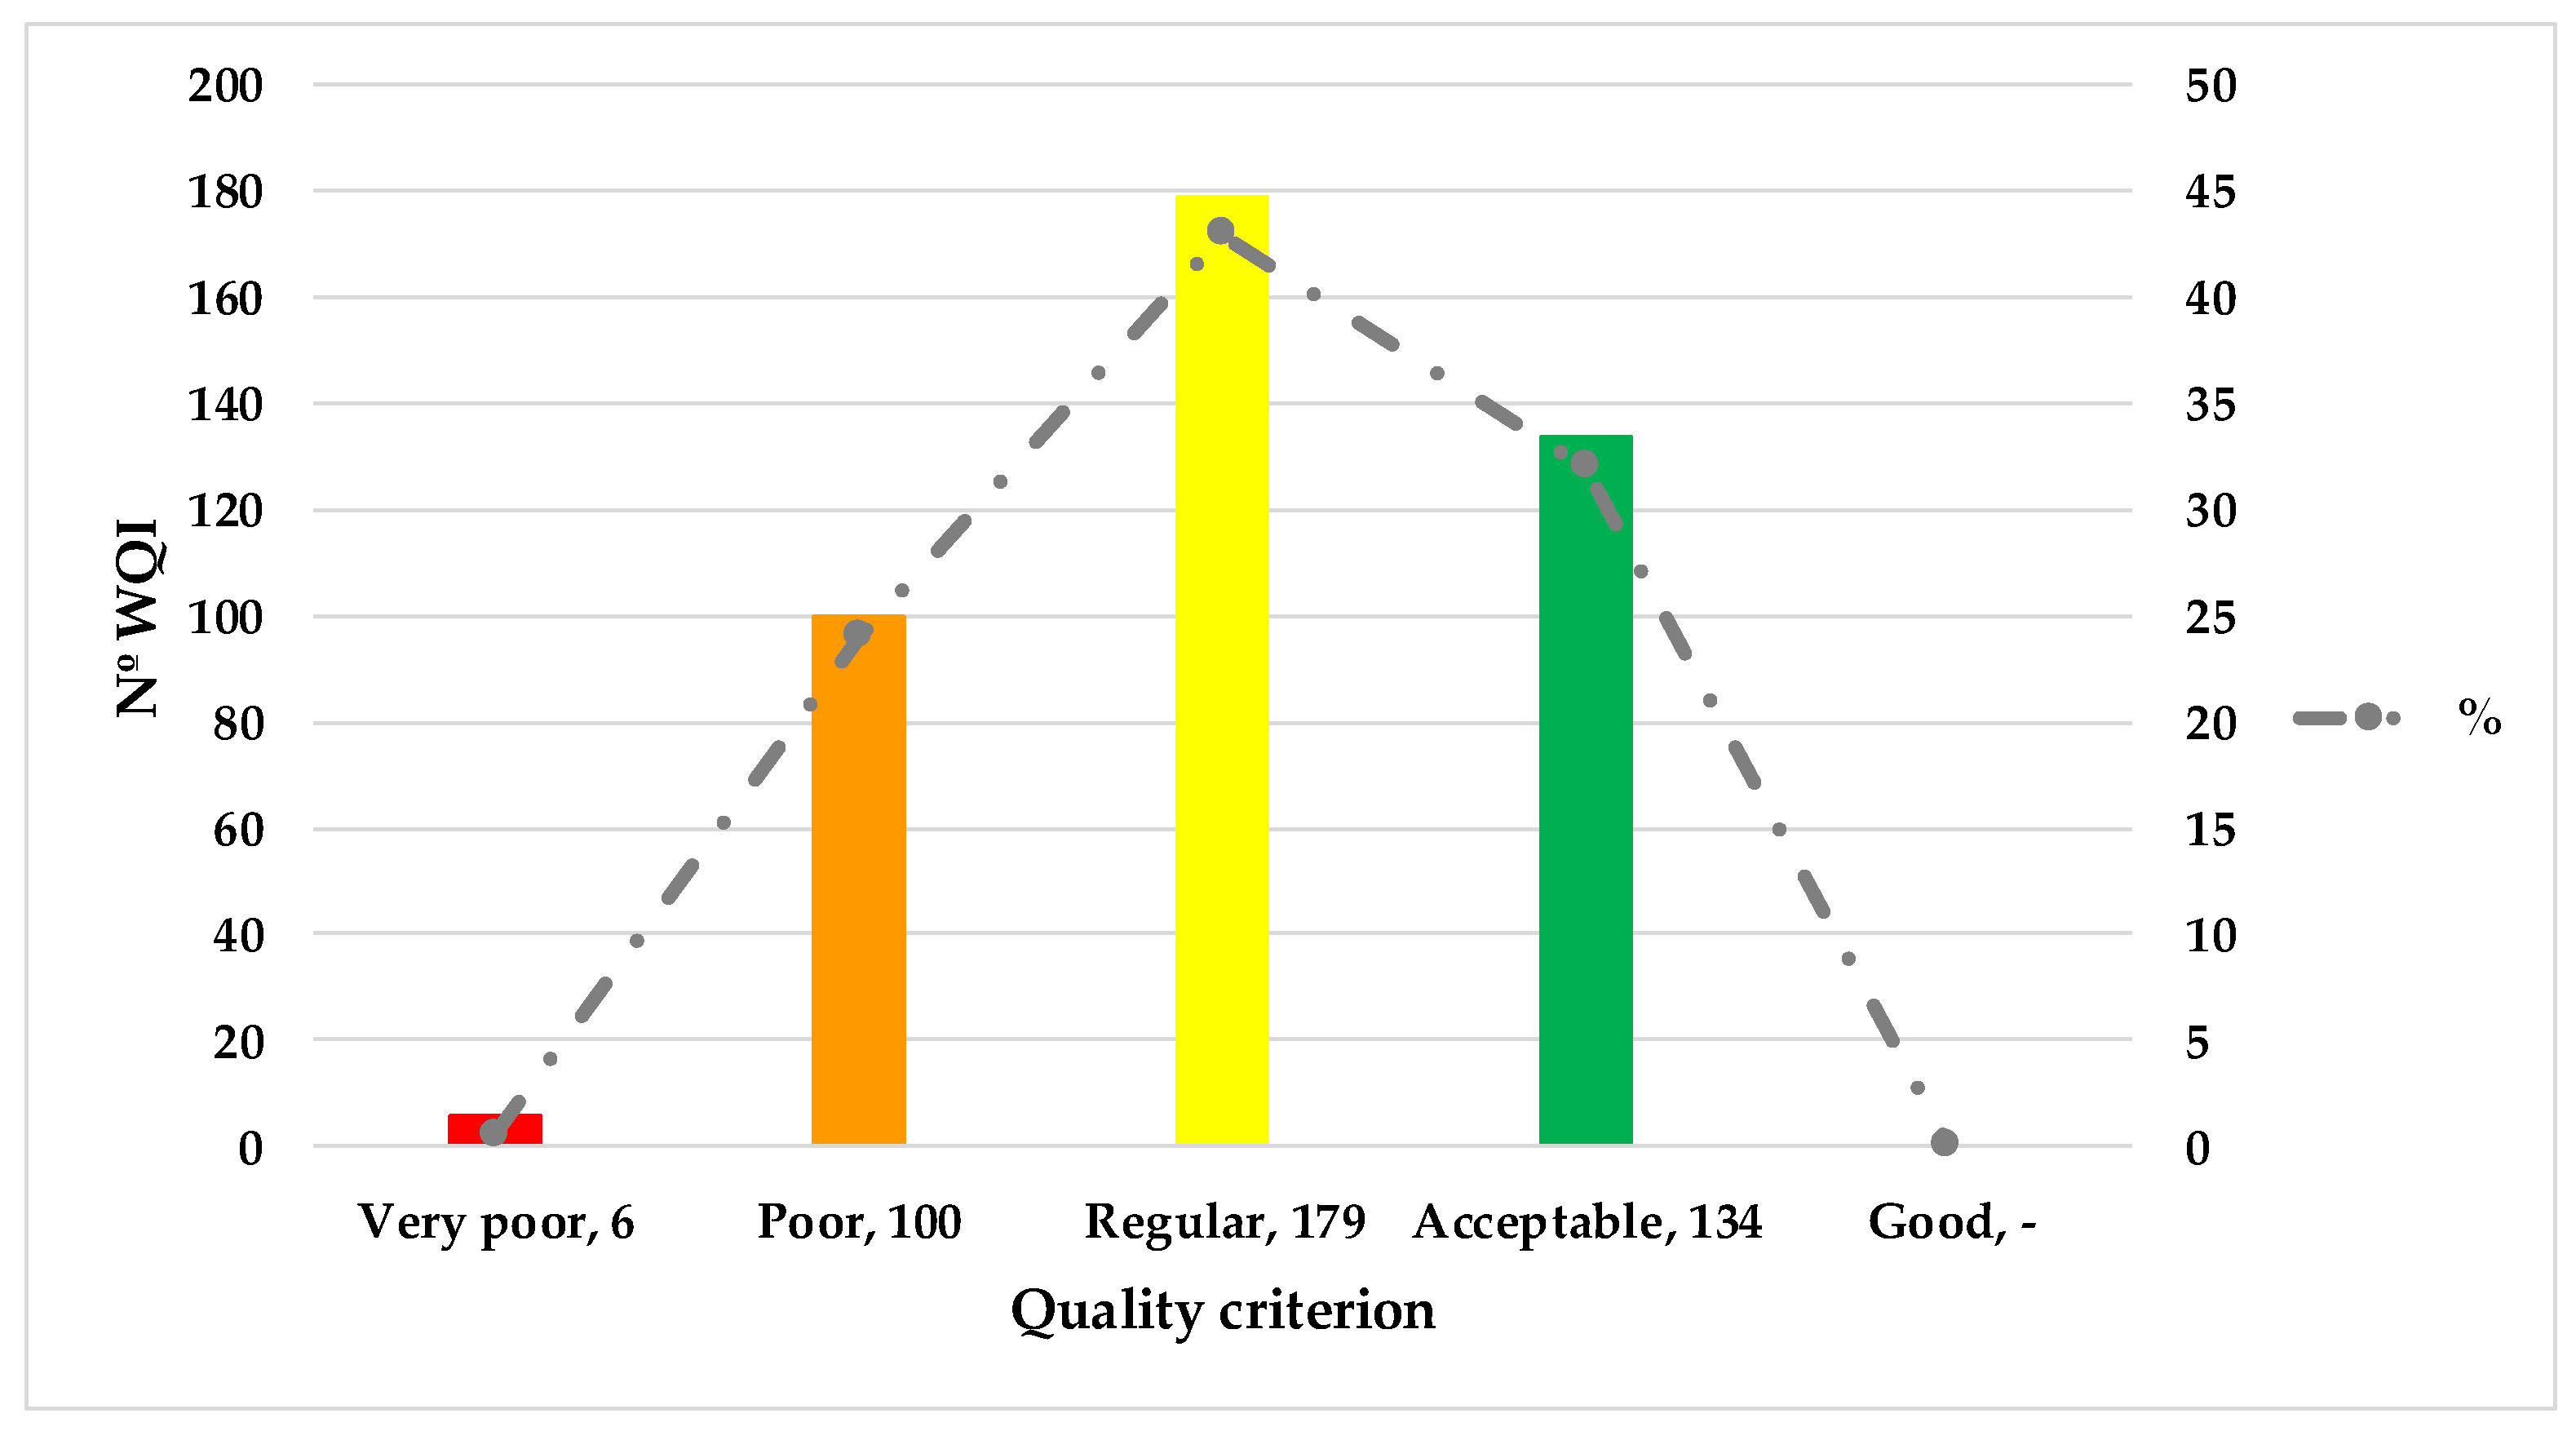
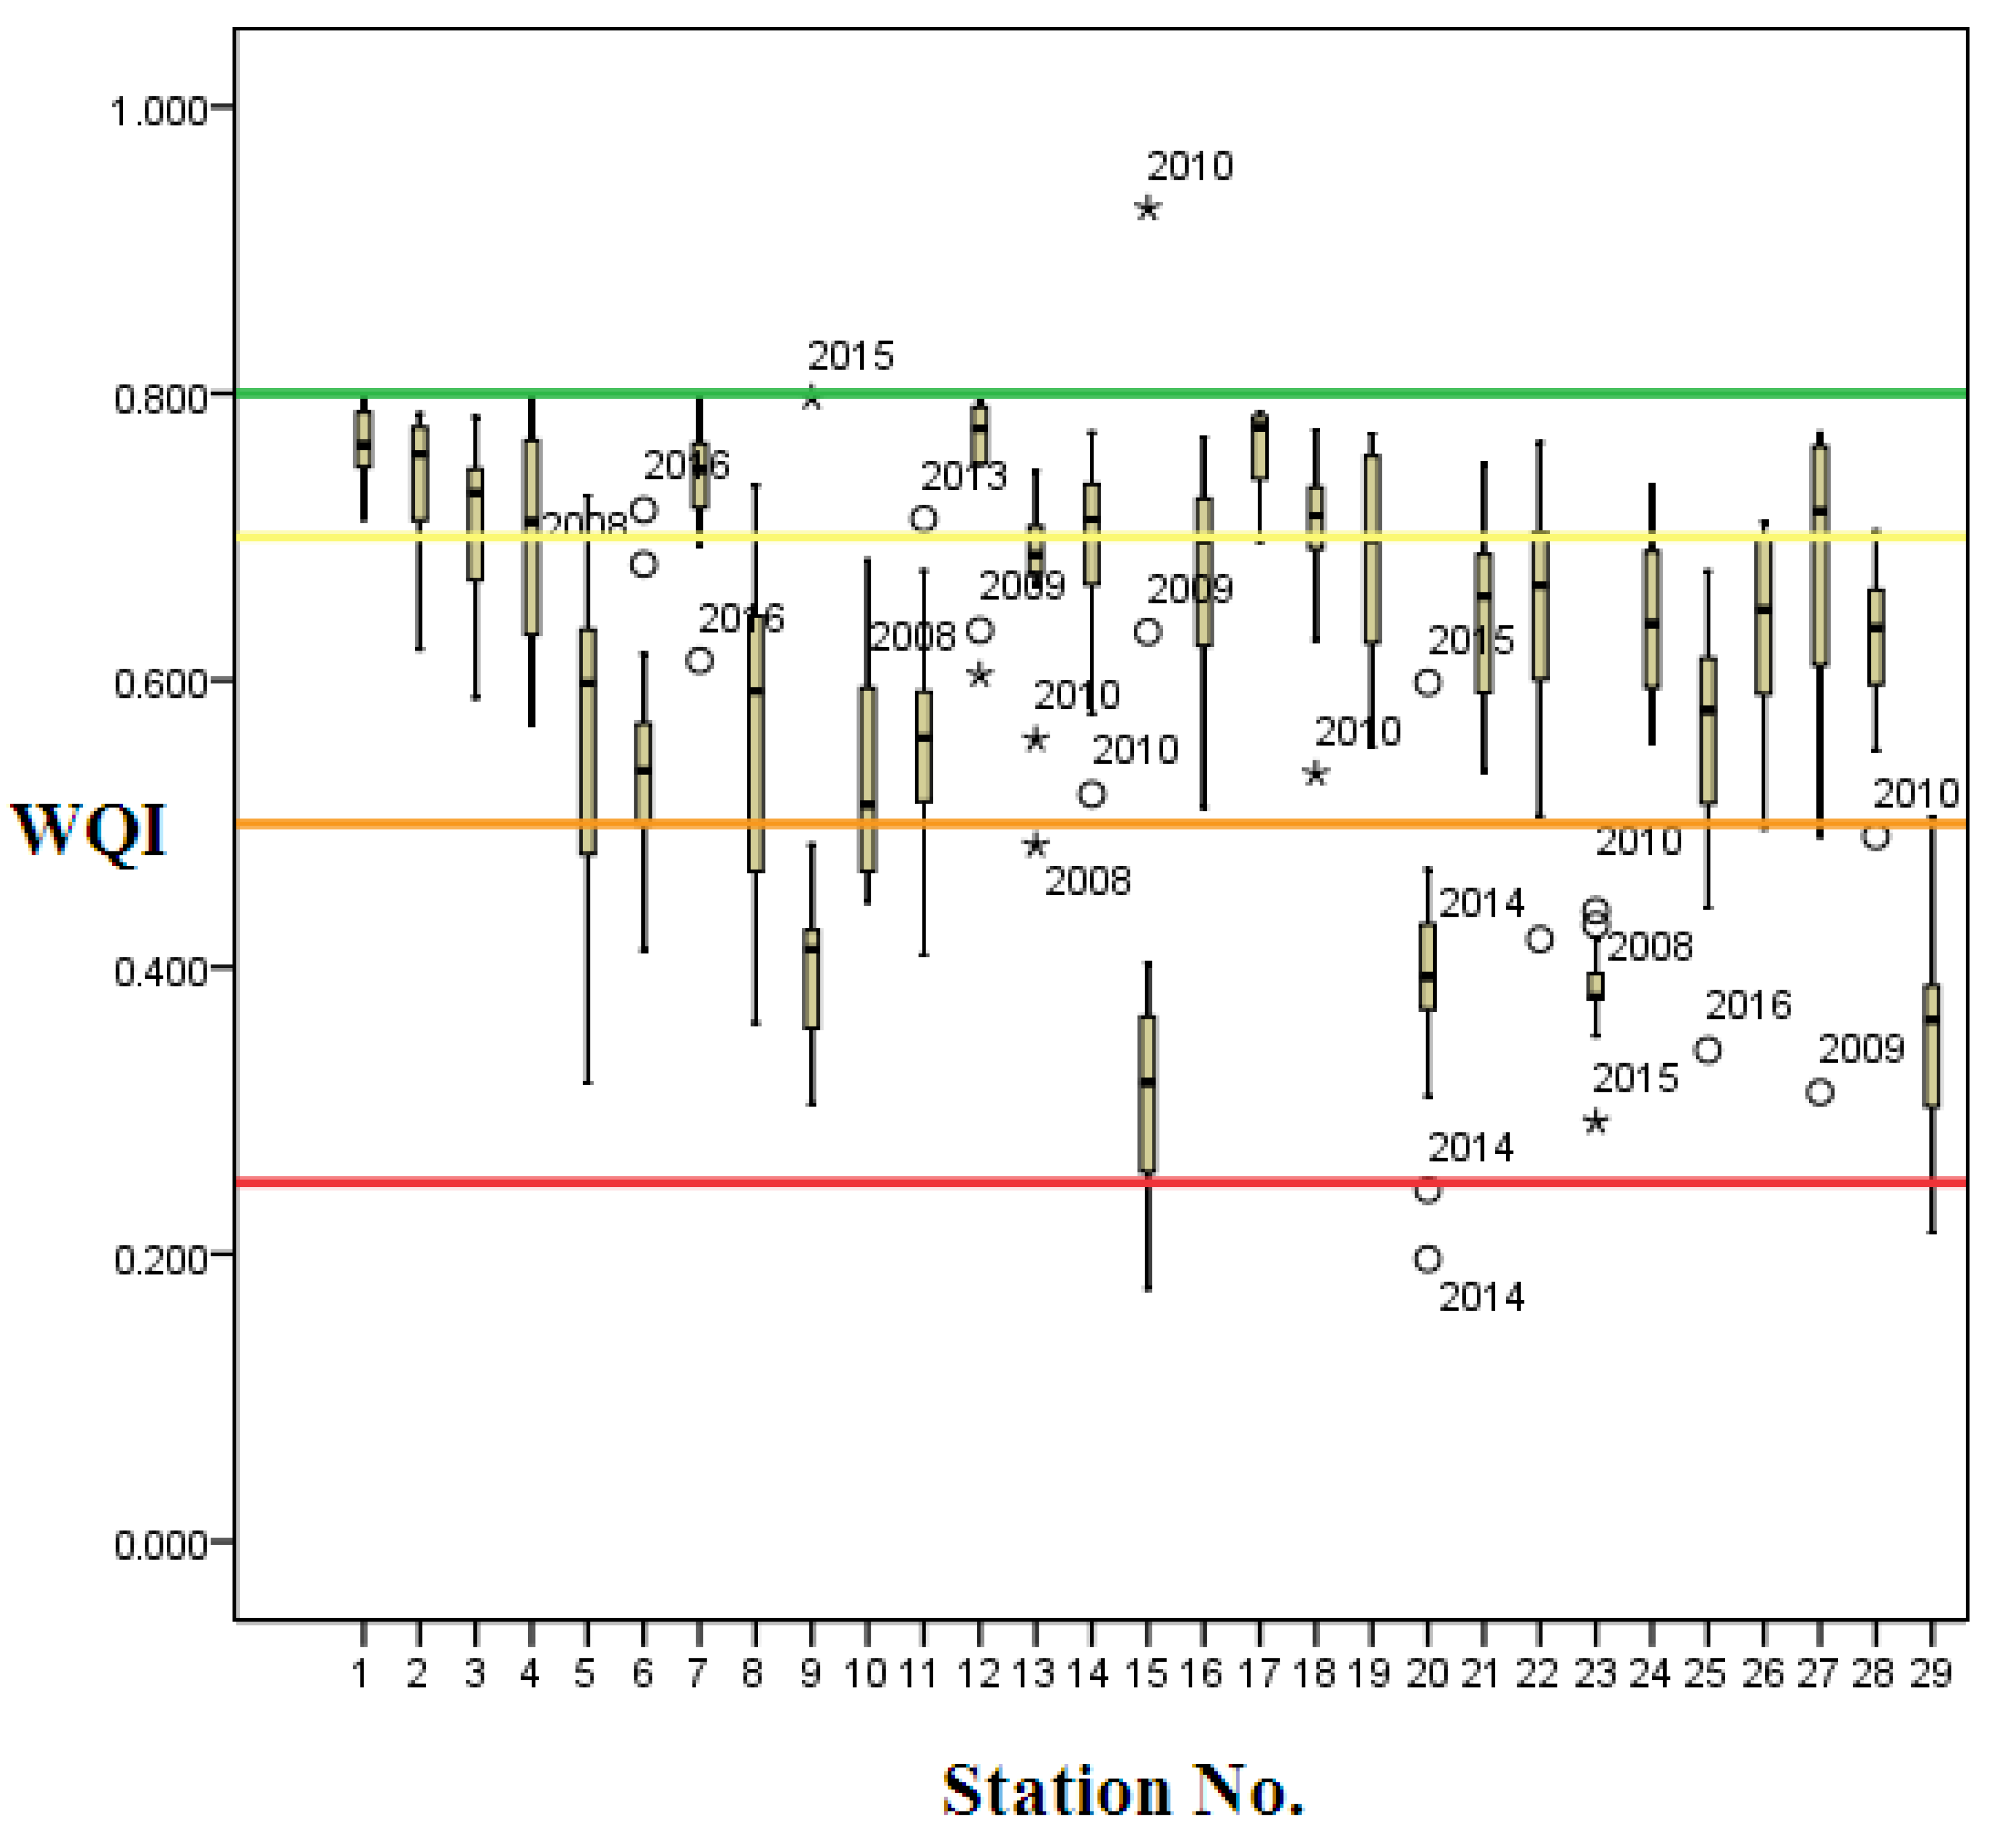
4.2. Water Quality Assessment

Figure 2 summarizes the results of these studies in a glance. As already stated, there were some missed data throughout the period of analysis, linked to the implementation of PGIRH and extreme climatic events. Complete data were only available during the first and last years of study, while, from 2010 to 2013, there were some information deficiencies. As shown in Figure 2, around 43% (179 stations) of the total WQIs estimated showed “regular” quality status, while 32% and 24% were “acceptable” and “poor”, respectively.
The extreme value “very poor” represent 1% of the data. It should be noted that, there were no stations with good quality status. As indicated below, these values will be regarded as outliers.
Once the WQI at the monitoring points of the Bogota River were calculated, they were arranged in a dual-input matrix. This matrix can be seen in Table 9, where columns represent the period and rows correspond to the monitoring station from which the data were collected.
The matrix is composed of 21 columns, in which the first represents the number of the station based on its geographic location; thus, station No. 1 is located at the source of the river in the municipality of Villapinzon, in the Guacheneque Moorland upper basin, and station No. 29, Rio Negro, is the last station corresponding to the stretch of the basin under study. The second column includes the name of the monitoring station, while the remaining 19 columns include the results of each and every period monitored. All cells of the matrix are highlighted using colors of the value categories determined in Table 4.
This matrix was included in the SPSS statistical software, which conducts a descriptive statistical analysis. This statistical analysis demonstrates a coefficient of variation of the results obtained from the monitoring stations lower than 30%, as shown in Table 8.
In general, WQIs were invariable except for the discharge station of the municipality of Suesca with a coefficient of variation of 51%, indicating that, over the time period analyzed, the water quality values fluctuated significantly. Surprisingly, this was the only station depicting good quality status in a concrete moment of the study.
The results matrix (Table 9) identifies three periods of time that are associated with the moments in which public policies related to the integrated water resource management of the Bogota River basin were drafted. The first is associated with the period prior to the implementation of the PNGIRH (2008-01–2009-02), while the second is directly related to the development and launch of the PNGIRH (2010-01–2014-02), as well as the heavy downfalls associated with the “La Niña” phenomenon (2010–2011). It should be noted that in 2010 and 2011, Colombia faced one of the worst rainy seasons, which was attributed to the phenomenon of “La Niña”, and, after that, some stations were out of service. Otherwise, from the year 2014, a significant improvement in the availability of the indicators is presented.
On average, it can be estimated that the water quality of the upper stretch of the Bogota River basin is average; and only five stations have acceptable water quality (Villapinzon Upstream, Villapinzon Bridge, Tejar River, Sisga Reservoir Discharge, Tomine Reservoir Discharge). These stations correspond with the first two monitoring stations. The first one is located at the source of the river, while the other is located after the river flows through the urban area of the Villapinzon municipality.
Two other stations with acceptable water quality are the El Sisga (Choconta) and Tomine (Guatavita) reservoir discharges, which avoid a significant amount of contaminants in the river.
Figure 3 shows a boxplot diagram that simplifies the analysis of information of the monitored stations. Similarly, this diagram seems to be an excellent tool for facilitating the identification of atypical data regarding a service station. For instance, the diagram shows a strange WQI value, corresponding to the Suesca Municipality Discharge station during 2010, which may be due to the wrong analytic determination of CAR.
As can be seen, the majority of results fluctuate between regular and acceptable status. Meanwhile, the stations located close to the wastewater treatment plants (WWTP) from the municipalities of Choconta, Suesca, Gachancipa, Tocancipa and Rio Negro registered an index quality between poor and very poor. These results denote an incomplete or insufficient capacity of the WWTPs, whose spills may endanger aquatic ecosystems and human welfare.

5. Discussion

Anthropogenic activities have caused severe quality problems in the Bogota River basin, which can be concluded from the results obtained in Section 3, where multi temporal determination in different monitoring stations was carried out using WQI.
This study confirms similar patterns of quality behaviour along the river that varies little, lying between acceptable and regular in most of the stations analysed. Even those samples corresponding to the municipal discharges showed deficient management of the WWTP, which seemed to be inefficient, as was already reported in 2011 by Carreño & Méndez [30].
Although in general, compliance with the monitoring strategies of water quality in the Bogota River are observed, occasionally data supplied by CAR had no information in different periods. This may have hindered the performance of determining the water status using the WQI, limiting the evaluation of the efficiency of the multi temporal analysis of water quality at the same time.
As indicated by Ramírez & Viña [31], the formulation of the WQI has proved to be very significant in the ecological and environmental areas, but it still has limitations that are an obstacle to its application, because, by concentrating on a single number, the quality of a water body, an immense amount of information is lost and this changes the real condition and what happens to it.
According to Tejeda-Benitez et al. [32], 99% of the population of Colombia, including Bogota, are located in the Magdalena watershed, which is exposed to land-use practices such as illicit crops, deforestation, agriculture, industry, mining and increasing rates of urbanization. Furthermore, clear evidence of high loads of heavy metals in the majority of Colombian rivers has been reported, with the Bogota River being one of the most polluted by these kind of contaminants [33].
One of the limitations of WQI is that it does not consider the effect of variables such as heavy metals, persistent organic pollutants or pathogens, or parameters with marked influence on the ecological status of water bodies. As a matter of fact, different studies have reported the low biodegradability and toxicity of many polycyclic aromatic hydrocarbons (PAHs) and pesticides, persistent in the environment owing to their low water solubility and low volatility [34,35]. Some of these indicators are complementary variables that, at the same time can be associated with the economic activities developed in the region. As an example, some heavy metal markers, such as chromium, seem to be one of the best parameters for the evaluation of the environmental management in the tanneries. Likewise, Escherichia coli, nitrates or pesticides, among others, are substances typically found in areas with high amounts of agricultural activities.
Given the potential toxicity of some of these pollutants and their metabolites, even at low concentrations [2], it seems interesting to tailor old methods and indices and create new ones, combining the analysis of the parameters mentioned above (Table 2), which are commonly and easily analysed, with many others like heavy metals, nitrates or pesticides, commonly present in water, identifying possible synergies regarding their effect on ecosystems and living beings.

6. Conclusions

This study highlights the necessity for further efforts on the continuous monitoring of Colombian river basins, showing a general and dangerous pattern of behaviour in the quality of the Bogota River. This is not a new discussion, as other authors have already highlighted the importance of continuous monitoring of water parameters for correct management [36]. However, this research aims to proportionate an easy tool for future researchers and authorities.
Likewise, this study has shown that further measures ought to be implemented in order to stop the strong deterioration that the Bogota River is suffering, particularly in its upper basin, where great problems of water quality were detected. In general, it was possible to observe a similar behaviour of the effluent quality that minimally varies between acceptable and regular. A deviation of this general pattern was found in the stations corresponding to WWTP discharges of some municipalities, who presented a poor state.
Despite recent formulation of numerous policies and instruments oriented to the recovery of the water bodies and associated ecosystems, unacceptable quality in many points of the basin still remain [8].
Depending on the objectives of the study, multiple methods can be taken in advance to evaluate different environmental indicators, combining and correlating a wide range of variables at the same time [17].
In this study, the WQI was shown to be an excellent index able to represent a partial view of the quality of the biggest tributary river of the Magdalena watershed. However, further research, integrating variables associated with pollution and socio-economic activities, may significantly improve the results obtained through this method.
To sum up, future research should include the study of socio-economic activities in which historical behaviour patterns of the watershed are analysed. A deeper understanding of this context will be extremely helpful to address problems from the source, identifying which involve conflict creating pressure and negative impacts on the environment. A holistic knowledge of the ecological, social and economic dynamics of the river basin will constitute information of vital importance for the formulation of future successful public policies. Furthermore, technological solutions such as sensors are becoming very useful for the dairy evaluation of effluents [37]. Thus, this study maybe the basis for a future technological development that couples statistical and technological methodologies.

Author Contributions

D.M.D.-C. worked in the development and methodological part. M.F.C.-F. worked on the data acquisition. E.B. worked on the review of the paper. C.E.M.-M. worked on the methodological part too. R.G.C. managed and worked on the global and methodological review of the paper.

Funding

This research received no external funding.

Conflicts of Interest

The authors declare no conflict of interest.

References

  1. Barzegari, Z.; Bina, B.; Pourzamani, H.R.; Ebrahimi, A. The combined treatment of bisphenol A (BPA) by cogulation/flocculation (C/F) process and UV irradiation in aqueous solutions. Desalin. Water Treat. 2016, 57, 8802–8808. [Google Scholar] [CrossRef]
  2. Bocos, E.; Alfaya, E.; Iglesias, O.; Pazos, M.; Ángeles Sanromán, M. Application of a new sandwich of granular activated and fiber carbon as cathode in the electrochemical advanced oxidation treatment of pharmaceutical effluents. Sep. Purif. Technol. 2015, 151, 243–250. [Google Scholar] [CrossRef]
  3. Burt, T.P.; Howden, N.J.K.; Worrall, F. The changing water cycle: hydroclimatic extremes in the British Isles. Wiley Interdiscip. Rev. Water 2016, 3, 854–870. [Google Scholar] [CrossRef]
  4. Castro Fernández, M.F.; Almeida, J.; Ferrer, J.; Díaz Casallas, D.M. Indicadores de la calidad del agua: evolución y tendencias a nivel global. Ing. Solidar. 2014, 10, 111–124. [Google Scholar]
  5. Valdes-Basto, J.; Samboni-Ruiz, N.E.; y Carvajal-Escobar, Y. Desarrollo de un Indicador de la Calidad del Agua usando Estadística Aplicada, Caso de Estudio: Subcuenca Zanjón Oscuro. TecnoLógicas 2011, 26, 165–180. [Google Scholar] [CrossRef]
  6. Samboni, N.E.; Reyes, A.; Carvajal, Y. Aplicación de los indicadores de calidad y contaminación del agua en la determinación de la oferta hídrica neta. Ing. Compet. 2011, 13, 49–60. [Google Scholar]
  7. Política Nacional para la Gestión Integral del Recurso Hídrico; Ministerio de Ambiente Vivienda y Desarrollo Territorial: Bogota, Columbia, 2010.
  8. Plan de Desarrollo de Cundinamarca, unidos podemos mas, 2016–2020; Gobernación de Cundinamarca: Bogota, Columbia, 2015.
  9. American Public Health Association, “Standard Methods for the Examination of Water and Wastewater”, 2012. Available online: https://www.standardmethods.org (accessed on 12 March 2019).
  10. Lumb, A.; Sharma, T.C.; Bibeault, J.-F. A Review of Genesis and Evolution of Water Quality Index (WQI) and Some Future Directions. Water Qual. Expo. Heal. 2011, 3, 11–24. [Google Scholar] [CrossRef]
  11. Horton, R.K. An index number system for rating water quality. J. Water Pollut. Control Fed. 1965, 37, 300–306. [Google Scholar]
  12. W. R. Ott Water Quality Indices Survey of Indices Used in The United States. Available online: https://nepis.epa.gov/Exe/ZyNET.exe/2000BCAV.TXT?ZyActionD=ZyDocument&Client=EPA&Index=1976+Thru+1980&Docs=&Query=&Time=&EndTime=&SearchMethod=1&TocRestrict=n&Toc=&TocEntry=&QField=&QFieldYear=&QFieldMonth=&QFieldDay=&IntQFieldOp=0&ExtQFieldOp=0&XmlQuery=&File=D%3A%5Czyfiles%5CIndex Data%5C76thru80%5CTxt%5C00000000%5C2000BCAV.txt&User=ANONYMOUS&Password=anonymous&SortMethod=h%7C-&MaximumDocuments=1&FuzzyDegree=0&ImageQuality=r75g8/r75g8/x150y150g16/i425&Display=hpfr&DefSeekPage=x&SearchBack=ZyActionL&Back=ZyActionS&BackDesc=Results page&MaximumPages=1&ZyEntry=1&SeekPage=x&ZyPURL (accessed on 15 March 2019).
  13. Rodríguez Rodríguez, E.; Ramos López, A.E.; Romero Olivé, Z.V.; Hernández Hernández, M.C. Aplicación de un índice de calidad acuática en cuerpos de agua de Tabasco, Mexico; CEPIS: Lima, Peru, 1997; pp. 1–12. [Google Scholar]
  14. Behar, R.; Zúñiga de Cardozo, M.C.; Rojas, O. Análisis y Valoración del Índice de Calidad de Agua (ICA) de la NSF: Casos Ríos Cali y Meléndez. Ing. Compet. 1997, 1, 17–27. [Google Scholar]
  15. Freshwater Biological Association. Final Report: Assessment and Presentation of the Biological Quality of Rivers in Great Britain. Available online: http://nora.nerc.ac.uk/id/eprint/3564/1/N003564CR.pdf (accessed on 28 February 2019).
  16. Montoya, Y.; Yeimi Acosta, M.; Zuluaga, Y. Water quality assessment in Río Negro River and its main tributaries using ICA, BMWP/Col and ASPT. Caldasia 2011, 33, 193–210. [Google Scholar]
  17. Giri, S.; Qiu, Z. Understanding the relationship of land uses and water quality in Twenty First Century: A review. J. Environ. Manag. 2016, 173, 41–48. [Google Scholar] [CrossRef]
  18. Huang, J.; Zhan, J.; Yan, H.; Wu, F.; Deng, X. Evaluation of the impacts of land use on water quality: A case study in the Chaohu Lake Basin. Sci. World J. 2013, 2013, 1–7. [Google Scholar] [CrossRef] [PubMed]
  19. Walsh, P.J.; Wheeler, W. Water Quality Index Aggregation and Cost Benefit Analysis; National Center for Environmental Economics, U.S. Environmental Protection Agency: Washington, DC, USA, 2012.
  20. Oana, I. Water Quality Index—Assessment Method of the Mptru River Water Quality (Oltenia, Romania). Ann. Univ. Craiova, Ser. Geogr. 2010, 13, 74–83. [Google Scholar]
  21. Kumar Singh, P.; Kumar Tiwari, A.; Prakash Panigary, B.; Kumar Mahato, M. Water Quality Indices Used for Water Resources Vulnerability Assessment Using GIS Technique: A Review. Int. J. Earth Sci. Engin. 2014, 12, 1594–1600. [Google Scholar]
  22. Finotti, A.R.; Finkler, R.; Susin, N.; Schneider, V.E. Use of water quality index as a tool for urban water resources management. Int. J. Sus. Dev. Plan. 2015, 10, 781–794. [Google Scholar] [CrossRef]
  23. Calvo-Brenes, G.; Mora-Molina, J. Evaluación de la calidad del agua en los ríos Tigre y Rincón de la península de Osa en dos períodos de tiempo distintos. Rev. Tecnol. Marcha 2015, 28, 55–67. [Google Scholar] [CrossRef]
  24. Basilico, G.O.; De Cabo, L.; Faggi, A. Adaptación de índices de calidad de agua y de riberas para la evaluación ambiental en dos arroyos de la llanura Pampeana. Rev. Mus. Argentino Cienc. Nat. 2015, 17, 119–134. [Google Scholar]
  25. Madera, L.C.; Angulo, L.C.; Díaz, L.C.; Rojano, R. Evaluación de la Calidad del Agua en Algunos Puntos Afluentes del río Cesar (Colombia) utilizando Macroinvertebrados Acuáticos como Bioindicadores de Contaminación. Inf. Tecnol. 2016, 27, 103–110. [Google Scholar]
  26. Voulvoulis, N.; Arpon, K.D.; Giakoumis, T. The EU Water Framework Directive: From great expectations to problems with implementation. Sci. Total Environ. 2017, 575, 358–366. [Google Scholar] [CrossRef]
  27. Corporación Autónoma Regional de Cundinamarca-CAR. Pomca Cuenca Río Bogotá; CAR: Bogotá, Colombia, 2006. [Google Scholar]
  28. Boletín de Calidad de las Cuencas de la Jurisdicción CAR—2014; Corporación Autónoma Regional de Cundinamarca-CAR: Bogotá, Colombia, 2015.
  29. Hoja Metodológica Índice de calidad del agua en corrientes superficiales (ICA); Ideam: Bogota, Columbia, 2011.
  30. Carreño Sayago, U.F.; Méndez Sayago, J.A. Estimación de la confiabilidad de las plantas de tratamiento de aguas residuales que operan con lagunas de estabilización en la cuenca alta y media del Río Bogotá. Ing. Recur. Nat. Ambient. 2011, 10, 55–64. [Google Scholar]
  31. Ramírez González, A.; Viña Vizcaíno, G. Limnología Colombiana, Aportes a su conocimiento y estadisticas de análisis; Fundación Universidad de Bogotá Jorge Tadeo Lozano: Bogota, Columbia, 1998. [Google Scholar]
  32. Tejeda-Benitez, L.; Flegal, R.; Odigie, K.; Olivero-Verbel, J. Pollution by metals and toxicity assessment using Caenorhabditis elegans in sediments from the Magdalena River, Colombia. Environ. Pollut. 2016, 212, 238–250. [Google Scholar] [CrossRef] [PubMed]
  33. Olivero-Verbel, J. Colombia: Environmental Health Issues. In Encyclopedia of Environmental Health; Elsevier: Amsterdam, The Netherlands, 2011; pp. 740–754. [Google Scholar]
  34. Liao, S.G.; Li, D.W. Review of Contaminated Sites Remediation Technology. Adv. Mater. Res. 2011, 414, 1–4. [Google Scholar] [CrossRef]
  35. Bocos, E.; Fernández-Costas, C.; Pazos, M.; Sanromán, M.Á. Removal of PAHs and pesticides from polluted soils by enhanced electrokinetic-Fenton treatment. Chemosphere 2015, 125, 168–174. [Google Scholar] [CrossRef] [PubMed]
  36. Parra, L.; Sendra, S.; Lloret, J.; Bosch, I. Development of a Conductivity Sensor for Monitoring Groundwater Resources to Optimize Water Management in Smart City Environments. Sensors 2015, 15, 20990–21015. [Google Scholar] [CrossRef] [PubMed]
  37. Parra, L.; Rocher, J.; Escrivá, J.; Lloret, J. Design and development of low cost smart turbidity sensor for water quality monitoring in fish farms. Aquac. Eng. 2018, 81, 10–18. [Google Scholar]
Figure 1. Monitoring stations located along the Bogota River.
Sustainability 11 01668 g001
Figure 2. WQI result distribution according to the quality criterion.
Sustainability 11 01668 g002
Figure 3. Bogota River WQI box plot 2008-01–2017-01 by SPSS.
Sustainability 11 01668 g003
Table 1. Monitoring points—Bogota River upper basin [28].
No.Station NameLocated on
1Villapinzon upstreamBogota River
2Villapinzon bridgeBogota River
3Brook Quincha upstreamBogotaRiver
4Brook QuinchaTributary
5Lm—Chingacio stationBogota River
6Choconta additionTributary
7Tejar RiverTributary
8Via Telecom bridgeBogota River
9Choconta Mun. dischargeTributary
10Choconta Mun. downstreamBogota River
11Lg—Caucio stationBogota River
12Sisga reservoir dischargeTributary
13Lm—Santa Rosita stationBogota River
14Santander bridgeBogota River
15Suesca Mun. dischargeTributary
16Suesca Mun. downstreamBogota River
17Tominé reservoir dischargeTributary
18Papeles and Molinos discharge up streamBogota River
19Lg—Florencia bridge stationBogota River
20Gachancipa Mun. dischargeTributary
21Gachancipa Mun. Down streamBogota River
22Lm—Tocancipa stationBogota River
23Tocancipa Mun. dischargeTributary
24Termozipa up streamBogota River
25Termozipa dischargeTributary
26El Triunfo farmBogota River
27Neusa RiverTributary
28Lg—El Espino stationBogota River
29Rao NegroTributary
Note: Lm—Limnological; Lg—Limnographic; Mun—Municipality.
Table 2. Reference equations for ICA calculation [29].
VariableNumberEquationWhere
Dissolved Oxygen
(DO)
1 SP DO = O x ×   100 C p
Once the dissolved oxygen saturation percentage has been calculated, the value of the DO sub-index is calculated with the formula:
I DO = 1 ( 1 0.01 × SP DO )
When the percentage of dissolved oxygen saturation is greater than 100%:
I DO = 1 ( 0.01 × S P DO 1 )
Ox: It is the dissolved oxygen measured in the field (mg/L) associated to the elevation, flow and capacity of re oxygenation.
Cp: It is the concentration of oxygen balance (mg/L), at non-standard pressure, that is, saturation oxygen
Total Suspended Solids
(TSS)
2 I TSS = 1 ( 0.02 + 0.003 × TSS ) If TSS ≤ 4,5, then ITSS = 1
If TSS ≥ 320, then ITSS = 0
Chemical Oxygen Demand
(COD)
3If COD ≤ 20, then ICOD = 0.91
If 20 < COD ≤ 25, then ICOD = 0.71
If 25 < COD ≤ 40, then ICOD = 0.51
If 40 < COD ≤80, then ICOD = 0.26
If COD > 80, then ICOD = 0.125
Electrical Conductivity
(CE)
4 I CE = 1 10 ( 3.26 + 1.34   ×   l o g 10 CE ) When ICE < 0, then ICE = 0
pH5If pH < 4, then IpH = 0.1
If 4 ≤ pH ≤ 7, then IpH = 0.02628419 × e(pH × (0.520025)
If 7 < pH ≤ 8, then IpH = 1
If 8 < pH ≤ 11, then IpH = 1 × e(pH × 8) − 0.5187742
If pH >11, then IpH = 0.1
Table 3. Variables and their weight in the calculation of the WQI ([29]).
VariableMeasurement UnitWeight
DOSaturation %0.2
TSSmg/L0.2
CODmg/L0.2
ECµS/cm0.2
pHpH units0.2
Table 4. WQI water quality index ([29]).
Value CategoriesWater QualityScore
0.0–0.25Very poorVP
0.26–0.50PoorP
0.51–0.70RegularR
0.71–0.90AcceptableA
0.91–1.00GoodG
Table 5. Descriptive statistics by SPSS software package.
VariableNMedianStandard DeviationMissing
NumberPercentage
WQI4200.60330.1484113123.8
Table 6. Summary of the WQI data processing by station by SPSS.
Point No.ValidMissingTotal
No.PercentageNo.PercentageNo.Percentage
WQI11157.9%842.1%19100%
21578.9%421.1%19100%
31578.9%421.1%19100%
41578.9%421.1%19100%
51684.2%315.8%19100%
61578.9%421.1%19100%
71263.2%736.8%19100%
81578.9%421.1%19100%
91789.5%210.5%19100%
101789.5%210.5%19100%
111789.5%210.5%19100%
121473.7%526.3%19100%
131578.9%421.1%19100%
141578.9%421.1%19100%
151684.2%315.8%19100%
161473.7%526.3%19100%
171368.4%631.6%19100%
181578.9%421.1%19100%
191789.5%210.5%19100%
201789.5%210.5%19100%
211684.2%315.8%19100%
221578.9%421.1%19100%
231578.9%421.1%19100%
241578.9%421.1%19100%
251578.9%421.1%19100%
26842.1%1157.9%19100%
271157.9%842.1%19100%
281368.4%631.6%19100%
291157.9%842.1%19100%
Table 7. Summary of missing values by periods of time by SPSS.
PeriodCategory
IncludedExcludedTotal
No.PercentageNo.PercentageNo.Percentage
2008-01 × N29100%00%29100%
2008-02 × N2793.1%26.9%29100%
2009-01 × N2586.2%413.8%29100%
2009-02 × N2482.8%517.2%29100%
2010-01 × N1344.8%1655.2%29100%
2010-02 × N2172.4%827.6%29100%
2011-01 × N2069.0%931%29100%
2011-02 × N00%29100%29100%
2012-01 × N1965.5%1034.5%29100%
2012-02 × N1034.5%1965.5%29100%
2013-01 × N2689.7%310.3%29100%
2013-02 × N2172.4%827.6%29100%
2014-01 × N2275.9%724.1%29100%
2014-02 × N2482.8%517.2%29100%
2015-01 × N2689.7%310.3%29100%
2015-02 × N2896.6%13.4%29100%
2016-01 × N29100%00%29100%
2016-02 × N2896.6%13.4%29100%
2017-01 × N2896.6%13.4%29100%
Table 8. Monitoring stations and descriptive statistical summaries of SPSS.
StationNo.RangeMinimumScoreMaximumScoreMedianScoreStandard DeviationVarianceCoefficient of Variation
Villapinzon Upstream110.0850.71A0.80A0.76A0.0270.0014%
Villapinzon Bridge150.1640.62R0.79A0.74A0.0560.0038%
Brook Quincha Upstream150.1950.59R0.78A0.70R0.0630.0049%
Brook Quincha150.2290.57R0.80A0.70R0.0810.00712%
Lm—Chingacio
Station
160.4090.32P0.73A0.56R0.1110.01220%
Choconta
Aggregates
150.3070.41P0.72A0.55R0.0810.00715%
Tejar River120.1860.61R0.80A0.74A0.0490.0027%
Vía Telecom Bridge150.3750.36P0.74A0.56R0.1180.01421%
Choconta Municipality Discharge170.4930.30P0.80A0.42P0.1100.01226%
Choconta Municipality Downstream170.2380.45P0.68R0.53R0.0760.00614%
Lg—Caucio Station170.3040.41P0.71A0.55R0.0800.00615%
Sisga Reservoir Discharge140.1910.60R0.79A0.75A0.0590.0048%
Lm—Santa Rosita Station150.2610.48P0.75A0.67R0.0670.00510%
Santander Bridge150.2520.52R0.77A0.69R0.0710.00510%
Suesca Municipality Discharge160.7530.18VP0.93G0.36P0.1820.03351%
Suesca Municipality Downstream140.2580.51R0.77A0.68R0.0720.00511%
Tomine Reservoir Discharge130.0900.70R0.79A0.76A0.0310.0014%
Papeles Y Molinos Discharge Upstream150.2400.53R0.77A0.70R0.0600.0049%
Lg—Florencia bridge Station170.2180.55R0.77A0.69R0.0700.00510%
Gachancipa Municipality Discharge170.4020.20VP0.60R0.39P0.0870.00822%
Gachancipa Municipality Downstream160.2150.54R0.75A0.65R0.0640.00410%
Lm—Tocancipa Station150.3460.42P0.77A0.65R0.0960.00915%
Tocancipa Municipality Discharge150.1470.29P0.44P0.38P0.0350.0019%
Termozipa Upstream150.1800.56R0.74A0.64R0.0590.0039%
Termozipa Discharge150.3340.34P0.68R0.56R0.0920.00816%
El Triunfo Farm80.2140.50P0.71A0.64R0.0770.00612%
Neusa River110.4600.31P0.77A0.65R0.1440.02122%
Lg—El Espino Station130.2130.49P0.70R0.62R0.0620.00410%
Rio Negro110.2890.22VP0.50P0.35P0.0780.00622%
Table 9. WQI results of the Bogota River’s upper basin 2008-01–2017-01.
No.Station Name2008-12008-22009-12009-22010-12010-22011-12011-22012-12012-22013-12013-22014-12014-22015-12015-22016-12016-22017-1
1Villapinzon Upstream0.79 (A)0.78 (A) 0.79 (A)0.75 (A)0.75 (A) 0.73 (A)0.80 (A)0.71 (A)0.75 (A)0.76 (A)0.77 (A)
2Villapinzon Bridge0.75 (A)0.73 (A)0.70 (R)0.76 (A) 0.68 (R) 0.78 (A)0.76 (A)0.76 (A) 0.62 (R)0.74 (A)0.79 (A)0.78 (A)0.62 (R)0.77 (A)0.78 (A)
3Brook Quincha Upstream0.74 (A)0.73 (A)0.69 (R)0.60 (R) 0.68 (R) 0.73 (A)0.66 (R)0.72 (A) 0.62 (R)0.75 (A)0.78 (A)0.75 (A)0.59 (R)0.75 (A)0.78 (A)
4Brook Quincha0.57 (R)0.65 (R)0.59 (R)0.62 (R) 0.78 (A) 0.71 (A)0.69 (R)0.75 (A) 0.64 (R)0.74 (A)0.80 (A)0.72 (A)0.59 (R)0.80 (A)0.80 (A)
5Lm.—Chingacio
Station
0.46 (P)0.51 (P)0.49 (P)0.62 (R) 0.64 (R)0.62 (R) 0.47 (P)0.50 (P)0.66 (R) 0.63 (R)0.62 (R)0.58 (R)0.44 (P)0.70 (R)0.73 (A)0.32 (P)
6Choconta
Aggregates
0.57 (R)0.68 (R)0.41 (P)0.50 (P) 0.47 (P)0.62 (R) 0.55 (R)0.54 (R)0.53 (R) 0.50 (P)0.57 (R)0.57 (R)0.46 (P)0.72 (A)0.52 (R)
7Tejar River0.69 (R)0.72 (A) 0.74 (A) 0.72 (A) 0.77 (A) 0.80 (A) 0.79 (A)0.75 (A)0.76 (A)0.61 (R)0.75 (A)0.75 (A)
8Vía Telecom Bridge0.44 (P)0.60 (R)0.46 (P)0.63 (R)0.52 (R)0.66 (R)0.73 (A) 0.48 (P) 0.59 (R)0.68 (R) 0.74 (A)0.47 (P) 0.42 (P)0.61 (R)0.36 (P)
9Choconta Municipality Discharge0.34 (P)0.41 (P)0.42 (P)0.41 (P)0.38 (P)0.39 (P)0.43 (P) 0.44 (P) 0.45 (P)0.49 (P)0.33 (P)0.41 (P)0.30 (P)0.80 (A)0.36 (P)0.37 (P)0.33 (P)
10Choconta Municipality Downstream0.51 (P)0.56 (R)0.51 (R)0.45 (P)0.47 (P)0.68 (R)0.45 (P) 0.48 (P) 0.59 (R)0.63 (R)0.60 (R)0.63 (R)0.47 (P)0.56 (R)0.45 (P)0.52 (R)0.45 (P)
11Lg.—Caucio Station0.41 (P)0.49 (P)0.58 (R)0.52 (R)0.47 (P)0.56 (R)0.68 (R) 0.44 (P) 0.71 (A)0.62 (R)0.62 (R)0.57 (R)0.52 (R)0.57 (R)0.52 (R)0.59 (R)0.52 (R)
12Sisga Reservoir Discharge0.79 (A)0.60 (R)0.75 (A)0.63 (R)0.79 (A) 0.79 (A) 0.77 (A)0.78 (A)0.79 (A)0.79 (A)0.75 (A)0.75 (A)0.78 (A)0.76 (A)
13Lm. Santa Rosita Station0.69 (R)0.48 (P)0.68 (R)0.69 (R) 0.56 (R)0.73 (A) 0.72 (A)0.70 (R)0.67 (R)0.68 (R)0.68 (R)0.67 (R)0.69 (R)0.73 (A)0.75 (A)
14Santander Bridge0.71 (R)0.58 (R)0.67 (R)0.74 (A)0.72 (A)0.52 (R)0.74 (A) 0.72 (A)0.66 (R0.69 (R)0.71 (A) 0.77 (A)0.62 (R)0.75 (A)0.77 (A)
15Suesca Municipality Discharge0.27 (P)0.33 (P)0.63 (R)0.18 (VP)0.25 (VP)0.93 (G)0.36 (P) 0.37 (P)0.25 (VP)0.30 (P)0.25 (VP)0.31 (P)0.40 (P)0.32 (P)0.26 (P)0.33 (P)
16Suesca Municipality Downstream0.76 (A)0.61 (R)0.71 (R)0.70 (R)0.73 (A)0.51 (R)0.72 (A) 0.64 (R)0.67 (R)0.62 (R) 0.62 (R)0.77 (A)0.70 (R) 0.76 (A)
17Tomine Reservoir Discharge0.78 (A)0.71 (R)0.74 (A)0.78 (A) 0.74 (A)0.78 (A)0.77 (A)0.78 (A)0.70 (R)0.78 (A)0.77 (A)0.79 (A)0.79 (A)
18Papeles Y Molinos Discharge Upstream0.74 (A)0.63 (R)0.69 (R)0.71 (A)0.77 (A)0.53 (R)0.77 (A) 0.73 (A)0.71 (A)0.72 (A)0.69 (R)0.69 (R)0.76 (A)0.72 (A)0.68 (R)
19Lg.—Florencia bridge Station0.76 (A)0.61 (R)0.69 (R)0.74 (A)0.77 (A)0.55 (R)0.77 (A) 0.60 (R) 0.66 (R)0.65 (R)0.70 (R)0.62 (R)0.76 (A)0.76 (A)0.63 (R)0.73 (A)0.73 (A)
20Gachancipa Municipality Discharge0.41 (P)0.37 (P)0.31 (P)0.39 (P)0.43 (P)0.45 (P)0.39 (P) 0.47 (P) 0.40 (P)0.38 (P)0.20 (VP)0.24 (VP)0.60 (R)0.39 (P)0.37 (P)0.39 (P)0.43 (P)
21Gachancipa Municipality Downstream0.72 (A)0.69 (R)0.67 (R) 0.68 (R)0.54 (R)0.63 (R) 0.60 (R) 0.69 (R)0.64 (R)0.75 (A)0.55 (R)0.72 (A)0.58 (R)0.65 (R)0.66 (R)0.56 (R)
22Lm.—Tocancipa Station0.63 (R)0.57 (R)0.66 (R) 0.51 (P)0.67 (R) 0.56 (R) 0.68 (R)0.68 (R)0.76 (A)0.42 (P)0.77 (A)0.70 (R)0.74 (A)0.71 (R)0.66 (R)
23Tocancipa Municipality Discharge0.39 (P)0.44 (P)0.38 (P) 0.43 (P)0.36 (P) 0.38 (P) 0.40 (P)0.42 (P)0.39 (P)0.38 (P)0.38 (P)0.29 (P)0.35 (P)0.38 (P)0.38 (P)
24Termozipa Upstream0.62 (R)0.60 (R)0.62 (R) 0.64 (R)0.64 (R) 0.58 (R) 0.74 (A)0.69 (R)0.70 (R)0.59 (R)0.66 (R)0.57 (R)0.69 (R)0.56 (R)0.73 (A)
25Termozipa Discharge0.53 (R)0.47 (P)0.68 (R)0.51 (R) 0.61 (R) 0.62 (R)0.60 (R)0.67 (R)0.66 (R)0.58 (R) 0.59 (R)0.44 (P)0.57 (R)0.34 (P)0.51 (R)
26El Triunfo Farm0.55 (R)0.50 (P)0.64 (R)0.63 (R) 0.66 (R)0.70 (R)0.71 (A)0.70 (R)
27Neusa River0.72 (A) 0.31 (P)0.77 (A) 0.66 (R)0.77 (A)0.63 (R) 0.49 (P)0.72 (A)0.59 (R)0.77 (A)0.76 (A)
28Lg.—El Espino Station0.55 (R)0.55 (R) 0.69 (R) 0.49 (P) 0.64 (R)0.70 (R)0.64 (R)0.66 (R)0.62 (R)0.61 (R)0.66 (R)0.60 (R)0.67 (R)
29Rio Negro0.22 (VP) 0.29 (P)0.40 (P)0.31 (P) 0.42 (P)0.37 (P)0.30 (P) 0.31 (P)0.36 (P)0.50 (P)0.36 (P)
Note: Water quality scores are written in brackets.

