Spatial Correlation of Formats in the Central Districts of a Megacity: The Case of Shanghai


1
Department of Urban and Rural Planning, College of Landscape Architecture, Nanjing Forestry University, Nanjing 210037, China
2
Department of Urban Planning, School of Architecture, Southeast University, Nanjing 210096, China
*
Author to whom correspondence should be addressed.
Sustainability 2019, 11(6), 1658; https://doi.org/10.3390/su11061658
Submission received: 17 February 2019
/
Revised: 8 March 2019
/
Accepted: 14 March 2019
/
Published: 19 March 2019
(This article belongs to the Special Issue Metropolitan Geographies and Sustainable Regional Development)
Abstract
:A “format” is an essential component of a city’s central districts and reflects their economic characteristics. In the urban context, individual formats relate to and mutually influence each other. Using data from two central districts in Shanghai—People’s Square and Lujiazui—and a case study approach, we investigated the mutual influences and relations among formats in these districts. We collected and categorized data on formats and assessed the degree of format aggregation. We also identified and described three different types of spatial relationships that may exist among formats: Strong two-way correlations, strong one-way correlations, and weak two-way correlations. These spatial relationships reflect the spatial distribution structure in an urban central district, embodying the systemicity and integrity of formats. The relationships we found have significance for future research on spatial relationships in other urban central districts.
1. Introduction
The concept of a “format” originated in Japan in the 1960s. Kanemura Eitetsu thinks that format was defined from the perspective of a store that directed contact with consumers [1]. It mainly refers to a combination of marketing elements that provides consumers with various retail services. In particular, it refers to a combination of goods, prices, stores, and sales. With the multitude of economic activities in existence, it is also used in the context of the service industry, such as healthcare, businesses, and more. As such, the term “format” is now used to denote the extant or realized form of retail and service industry activities to meet different consumer needs [2]. As a result, format covers various business industries such as commercial and catering industries. Therefore, we can conclude that formats are major forces operating within central urban districts. Analyzing the spatial distribution of formats can clearly advance the understanding of the economic, social, and spatial structures of these areas.
The related literature focuses on the retail format and is divided into three categories. The first is about competition between stores of the same type of retail format. Bhatnagar and Ratchford developed a general model of retail format choice for non-durable goods and found that the optimality of format depends on membership fees, travel costs, consumption rates, perishability of products, inventory holding costs of consumers, and cost structures of retailers [3]. Cardinali et al. analyzed competition between grocery store formats in the Italian retail market and found that there was an increasing overlap between store formats; they also stated that the similarity between different store formats can sometimes be greater than that between different stores of the same format [4]. Sangwon and Soo Cheong tested whether geographic clustering differs by restaurant segment due to the differences in consumers’ hedonic and utilitarian values [5]. Although stores that have the retail format have a competitive relationship, they are not only mutually exclusive in spatial terms.
The second category is about the relationship between consumer shopping behavior and choice of retail format. Sane and Chopra analyzed the shopping motives of customers in the age group of 15 to 29 years; the findings indicated that hedonic and convenience motives play a predominant role for customers while shopping in organized retail outlets [6]. Klein and Schmitz found high inter-format loyalty in each consumer group, but it varied significantly between clusters. Moreover, significant differences were observed between consumer groups regarding perceived acquisition utility and perceived transaction costs [7]. Luceri and Latusi found that age, gender, employment status, and citizenship had an impact on the choice of multi-store formats. Store format preference and sale proneness were also found to be determinants of cross-format mobility [8].
The third category, with relatively few studies, is about the spatial orientation of retail formats. Piovani et al. built a model for consumers’ location preference regarding spatial distribution of retail activities by quantifying the role of floor–space and agglomeration in retail location choice [9]. Shi et al. analyzed the spatial distribution of formats, determined the association of format and the relationship between urban spatial structure and urban morphology, and summarized the related characteristics [10].
From the above discussion, we can state that, first, stores of the retail format have a competitive relationship, but it is not a mutually exclusive relationship. Second, consumers display different choices for similar formats based on their own needs and characteristics. Third, there is a certain regularity in the spatial distribution of similar formats, but the spatial distribution patterns of different formats in urban central districts vary. For formats in urban central districts, the relationships are more complicated. We envisage the following situations: Different formats have mutually cooperative relationships, such as the finance and insurance industries, that provide protection for cash flow and monetary security. Furthermore, different formats have mutually exclusive relationships. For example, the education and scientific research industries have a high demand for a quiet environment, which is mutually exclusive with the noisy environment in the market services industry. In addition, the needs of consumers are also related to the different relationships between formats. The key is ease of simultaneous conduct, such as in eating and shopping, so that consumers become the link between the retail and catering industries. These business operations and social characteristics cause the spatial distribution of different formats in urban central districts thus showing a certain relationship and regulating law.
This paper aims to explore the spatial relationship between different formats in urban central areas; this, which can help in to advance our understanding of the spatial distribution characteristics of urban economies and the spatial arrangement of different formats in urban central districts. First, we applied the definition of a central district formulated by Hu and Yang [11] to define two central districts of Shanghai—People’s Square and Lujiazui. Then, we collected data on formats in these districts and assessed their spatial distribution. Our analysis indicates that the distribution of formats within a central urban district is not balanced, with significant variations in the strength of the correlations between formats. However, stable hierarchical features were found within a district. Therefore, we collected and classified data on formats and applied quantitative methods to assess the degree of format aggregation. Finally, we identified and described three types of spatial relationships between formats. We will test and verify such relationships in the central districts of other megacities in future research.
2. Research Methods and Case Selection
2.1. Case Selection
Following a comprehensive analysis of 13 cities and 20 typical central urban areas in Asia, we decided to focus our research on People’s Square and Lujiazui districts in Shanghai. Shanghai is an economic, financial, trade, and shipping center in Asia, and its gross domestic product (GDP) is the highest among Chinese cities and second-highest among Asian cities. At the end of 2013, the urban population of Shanghai was approximately 13.613 million, and the regional GDP was CNY 2.132 billion.
People’s Square and Lujiazui, which display different levels of development, are two central districts in Shanghai. People’s Square is a traditional and “old” urban central district. Its development dates back to 1841, and its history spans nearly 200 years. In contrast, the development of Lujiazui, an emerging central district (thus, a “new” district), began in 1998 and spans roughly two decades. In terms of format type, People’s Square is more complicated, while Lujiazui is home to mainly enterprises, finance, and insurance firms, which are more important and are new forms of economic growth. Such combinations of old and new urban central districts can also be found in other global megacities such as Paris (Halles Central and La Défense Central districts) and Singapore (Orchard Central and Marina Central districts). This combination allows us to comprehensively study the spatial correlation degree of formats in urban central districts.
2.2. Data Collection and Classification of Formats
We collected data from the Baidu Map Open Platform (http://lbsyun.baidu.com/), crawling the names of formats and their spatial locations using Python programming language. We then input them into the ArcGIS software and created a map of the formats and their spatial locations. Finally, we conducted a manual proofreading of these formats, deleted non-existent formats, added new relevant formats, and corrected those with wrong spatial locations to obtain our final formats data.
Perspectives on what constitutes a service industry differ across disciplines. Moreover, different service industries have framed their own classification schemes. In this study, we focused on the different functions of particular formats and adopted an economic perspective for analysis. We used data on service industries in China obtained from the Classification of National Economic Industries (GB/T 4754-2002) (http://hzs.mofcom.gov.cn/aarticle/Nocategory/200212/20021200055542.html). As shown in Table 1, we divided the formats into 15 categories. The classification and integration of formats enabled the identification of those with the same functions.
2.3. Degree of Format Aggregation
The degree of format aggregation indicates the spatial correlation of a format with those located around it. It also reveals the degree of concentration of other formats within a certain distance and can be represented by the number of formats within that range. If the number of different formats within a specified distance exceeds a certain limit, this indicates the existence of a closer relationship between formats.
We specified the core area of influence of a single format as “N meters”; that is, a format has strong spatial correlations with other formats within a range of N meters, which means that, for format A, we spatially screening other formats within its N-meter range, these formats are considered to have a strong spatial correlation with A. For example, like restaurants with Catering services functions, retail functions formats within their N meters will be consumed by the restaurant’s customers with great probability. The term denotes the radius within which we calculated the number of other types of formats around a particular format and represents the format aggregation or dispersal within N meters. Thus,
where denotes the degree of aggregation of format B in the N meter range of format A, BA denotes the number of B formats within a range of N meters of A, and B denotes the total number of B formats in the two central districts.
We calculated the degree of aggregation of other formats with respect to each of the 15 types of formats located in the central districts. These values indicate the strength of the degree of aggregation of B with A.
3. Results
3.1. Data Collection and Classification
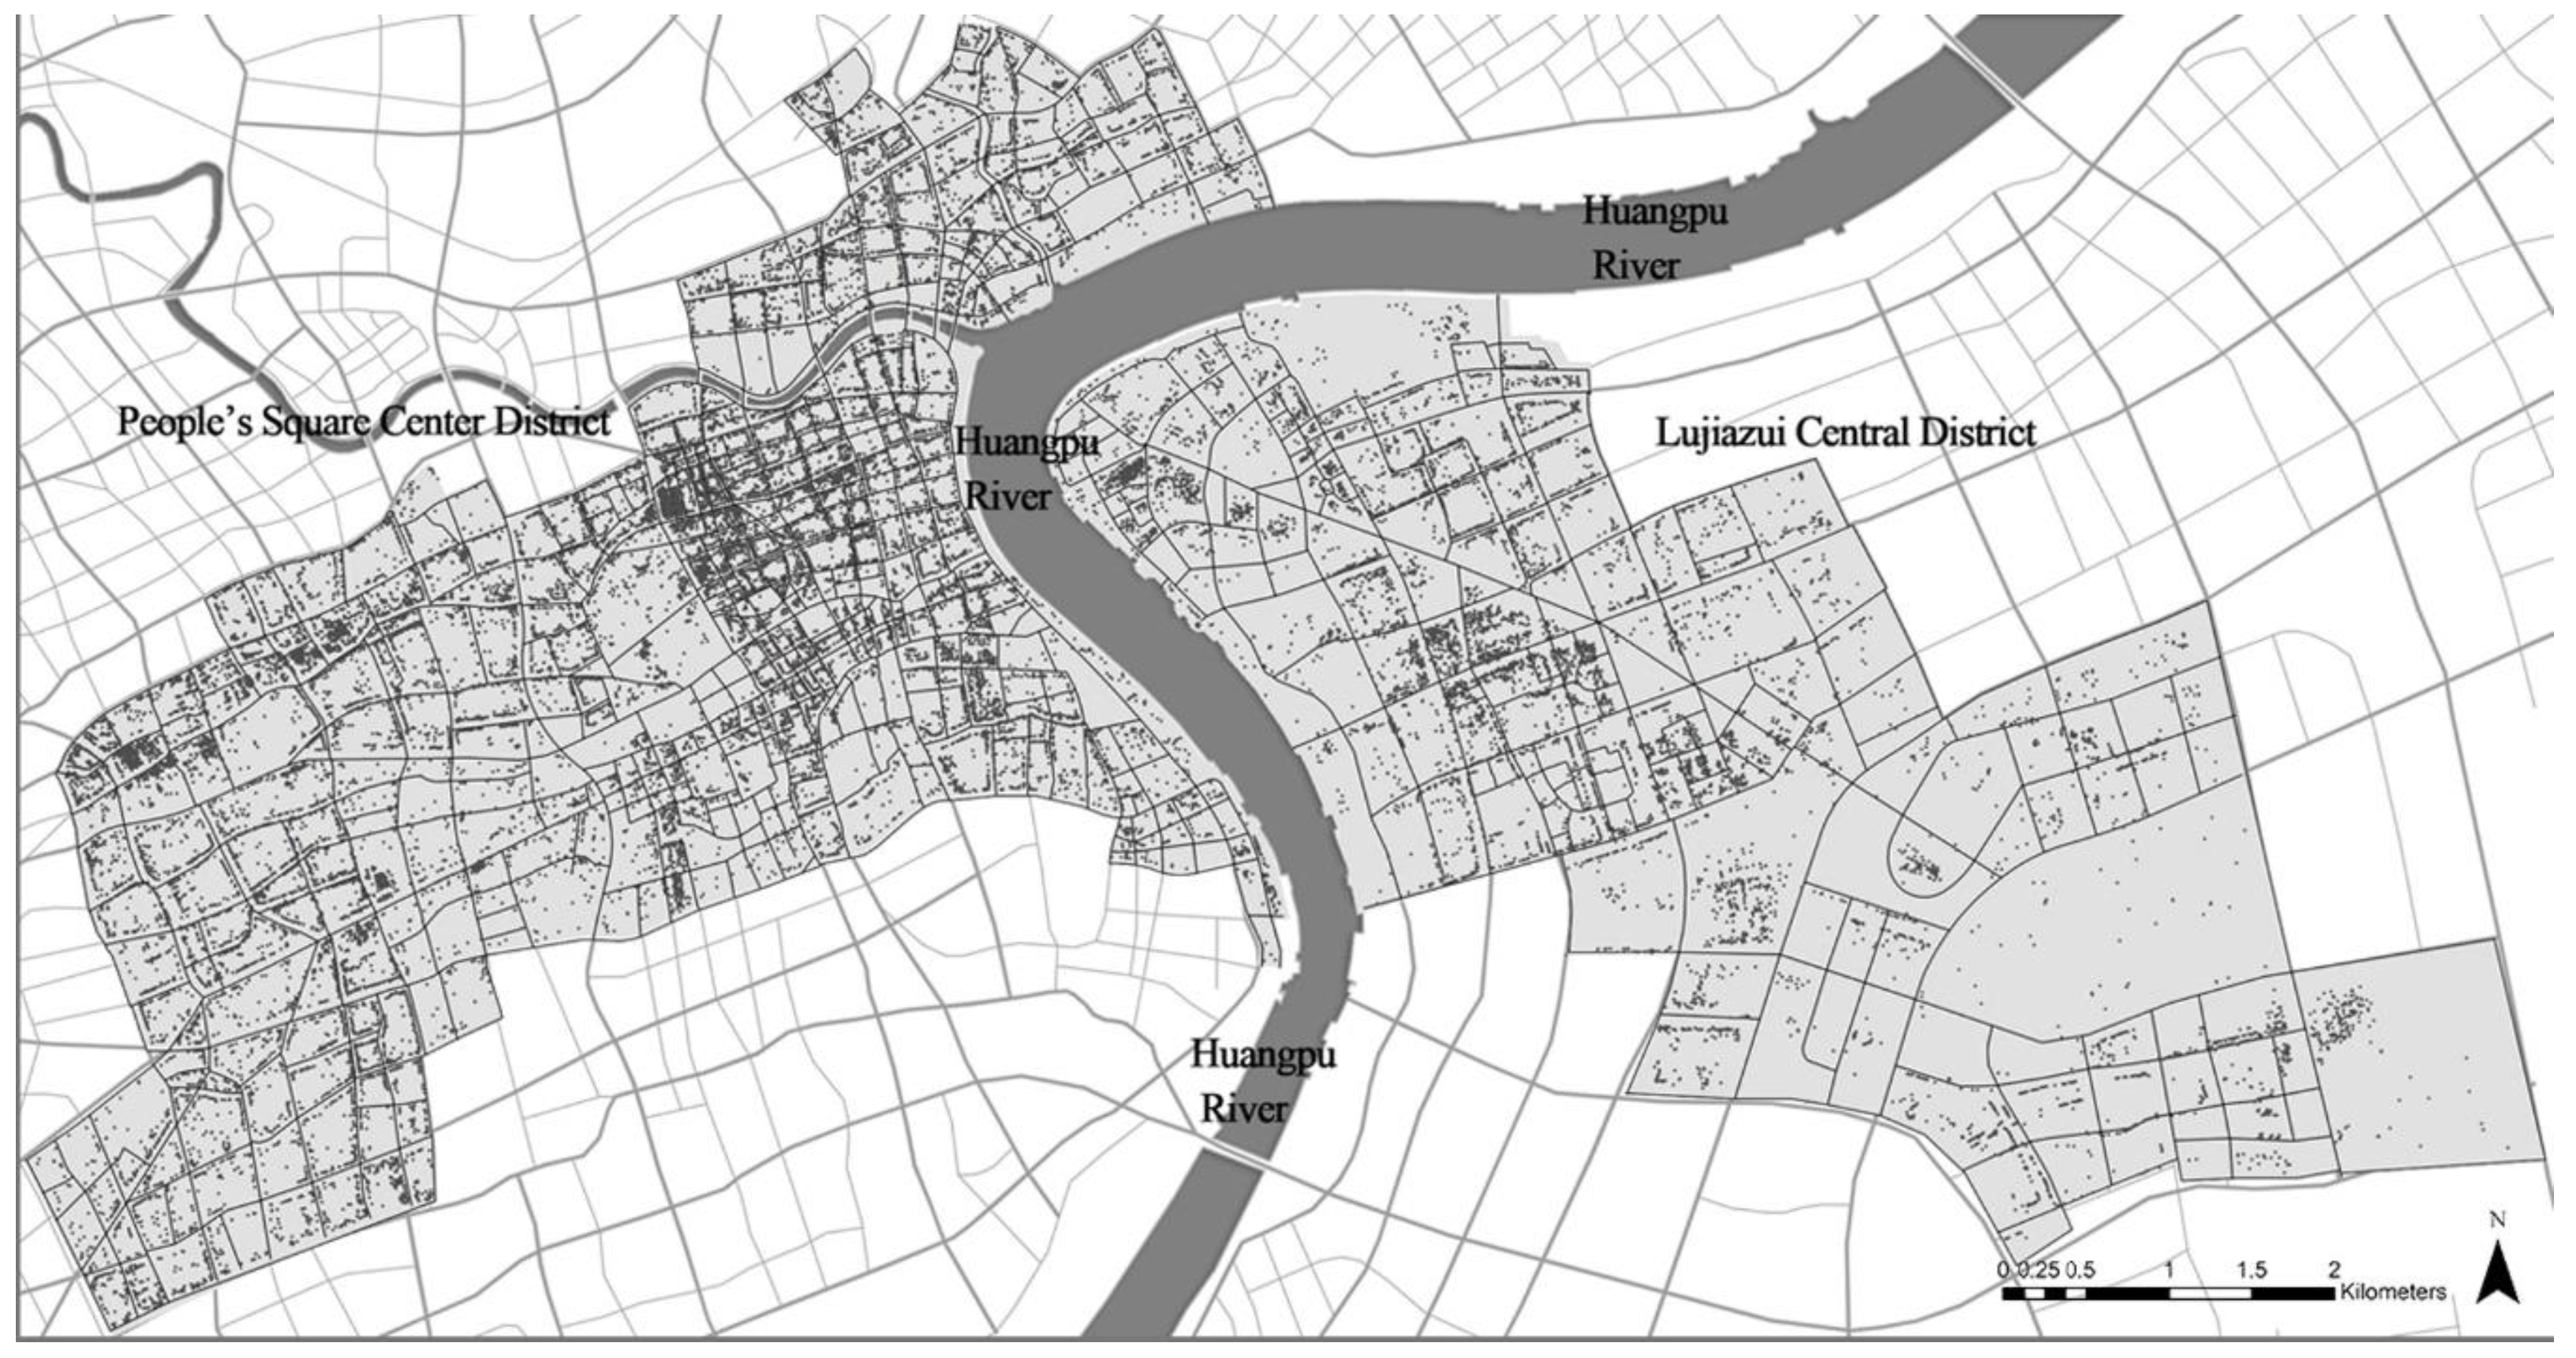
We developed a map of the spatial locations of formats based on the format data of Shanghai’s two central districts, which incorporate a total of 49,172 formats (Figure 1).
Table 2 shows the number of formats according to different types of functions.
Although the two central districts differ significantly in the number of formats, the proportions of the various format types are similar. The most common types of formats in both districts are retail services, business offices, and catering services. The functions of entertainment and healthcare, finance and insurance, culture and art, accommodation services, and educational and scientific research are significant in the determination of formats. The remaining formats relate to essential functions within each central district.
3.2. Degree of Format Aggregation
Due to the complexity of formats, we considered a variety of factors to determine the scope of influence (N). We conducted interviews to elicit the perspectives of operators in existing format institutions and observed their daily activities to obtain first-hand information. We divided the two main central districts into 30 sampling areas and conducted interviews with the operators of 90 randomly selected institutions covering 15 format types. Each interview addressed the following three aspects:
- (1)
- basic attributes of the format institutions, including the store areas and turnover;
- (2)
- interactions between operators and other format organizations during operating hours, including the purpose, consumer spending, spatial locations, and other information;
- (3)
- operator perspectives: Peripheral format organizations at five-meter intervals were first identified. We then interviewed the operators for a comprehensive understanding of the influence of other format organizations on a particular format within each range.
The results of the interviews indicate that a format mostly interacts with other formats within a ten-meter range, and minimal interactions occur with formats at distances over 20 m. The overall findings of the interviews suggest that the primary area of influence of an individual format in People’s Square is within a range of 20 m; that is, a format has strong spatial correlations with other types of formats within a range of 20 m. The figures obtained by using Equation (1) denote the degree of aggregation of B with A. Further, the degree of aggregation of different formats was obtained through paired calculations conducted for the 15 format types in the central districts. The results are reported in Table 3. The vertical numerical values denote the degree of aggregation of other formats with a particular format, and the horizontal values denote the reverse aggregations.
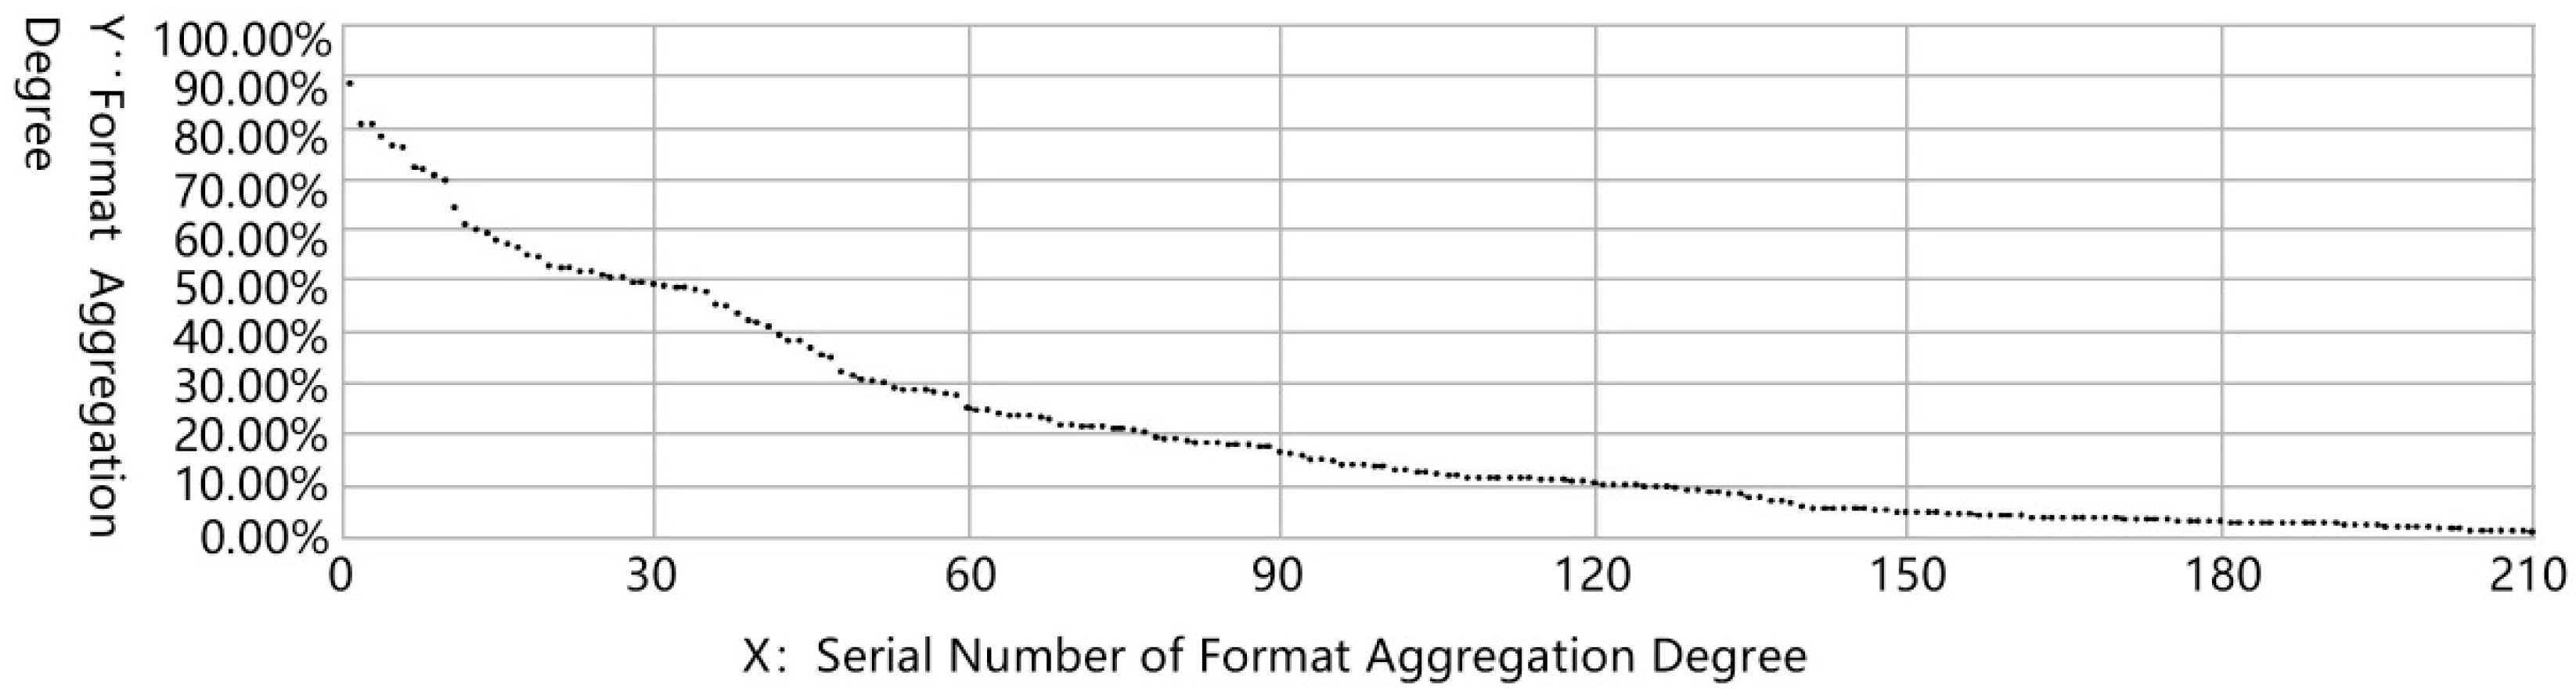
The degree of aggregation of these formats indicates a scattered distribution of format aggregation scores and reveals 210 distributions of the aggregation degree for the two levels of format relationships. Figure 2 shows that aggregated relationships whose scores for between formats are less than 10% accounted for 49% of all aggregated relationships, whereas those with more than 90% scores accounted for only 1%.
Due to the presence of a significant imbalance in the distribution of scores, a classification based on equal values may lead to biased results. Therefore, after conducting an in-depth investigation and analysis of the interactions between formats, we separately considered their median values. A degree of aggregation of B formats with an A format above 11.65% means that the aggregation degree of B with A is high. Conversely, a degree of aggregation below 11.65% indicates a low degree of aggregation of B with A. In other words, we identified two levels of aggregation: Scores ranging between 11.65% and 100% indicate strong aggregation, while scores ranging between 0% and 11.65% indicate weak aggregation. Table 4 shows the final aggregation levels.
4. Discussion
Based on our data, we find the existence of three categories of spatial relationships between formats according to their degree of aggregation: A strong two-way correlation, a strong one-way correlation, and a weak two-way correlation.
4.1. Strong Two-Way Correlation
This kind of relationship occurs in a situation in which two types of formats, A and B, are strongly aggregated with each other (Figure 3). We posit that when strong linkages exist between two types of formats, these formats will be spatially aggregated with each other. In central districts, a high degree of aggregation exists among a number of peripheral formats of different types. Two strongly-linked formats reinforce each other and the correlation continues strengthening through a scale effect. Such correlations are observed in Shanghai’s two main central districts. Table 5 shows the seven paired functions of the two types of formats typically found in a strong two-way association.
Table 5 shows that the strong two-way correlation of formats mainly includes functions that meet the essential needs of citizens, such as the provision of food, clothing, shopping, and work facilities. These basic needs cater to a large number of consumers; therefore, the number of related formats is high. These formats are complementary and can meet the basic needs of consumers; therefore, they occur in spatial clusters.
4.2. Strong One-Way Correlation
A strong one-way correlation requires a strong degree of aggregation of B with A and a simultaneously weak degree of aggregation of A with B (Figure 4). In such a spatial relationship, A is an associated format while B is an associating format. A strong one-way correlation reflects features of spatial aggregation and not elements of functional aggregation. In other words, B surrounds and congregates with A in space. Spatial dependence is a characteristic feature of a strong one-way association, wherein format A provides format B necessary spatial development factors. Similar to a strong two-way correlation, a strong one-way correlation promotes the aggregation of formats, as illustrated by Shanghai’s two main central districts. The ten paired combinations of associated (A) and associating (B) formats, as shown in Table 6, validate strong one-way correlations.
Table 6 shows that the associated formats in a strong one-way correlation is often a function that meets the basic needs of the population within the central district, while the associating format is associated mainly with professional functions that meet the consumers’ higher-level demands. For instance, administrative and sports functions meet the basic needs of consumers in the region in which the associated formats are located, and, thus, they are apparent in a strong one-way correlation.
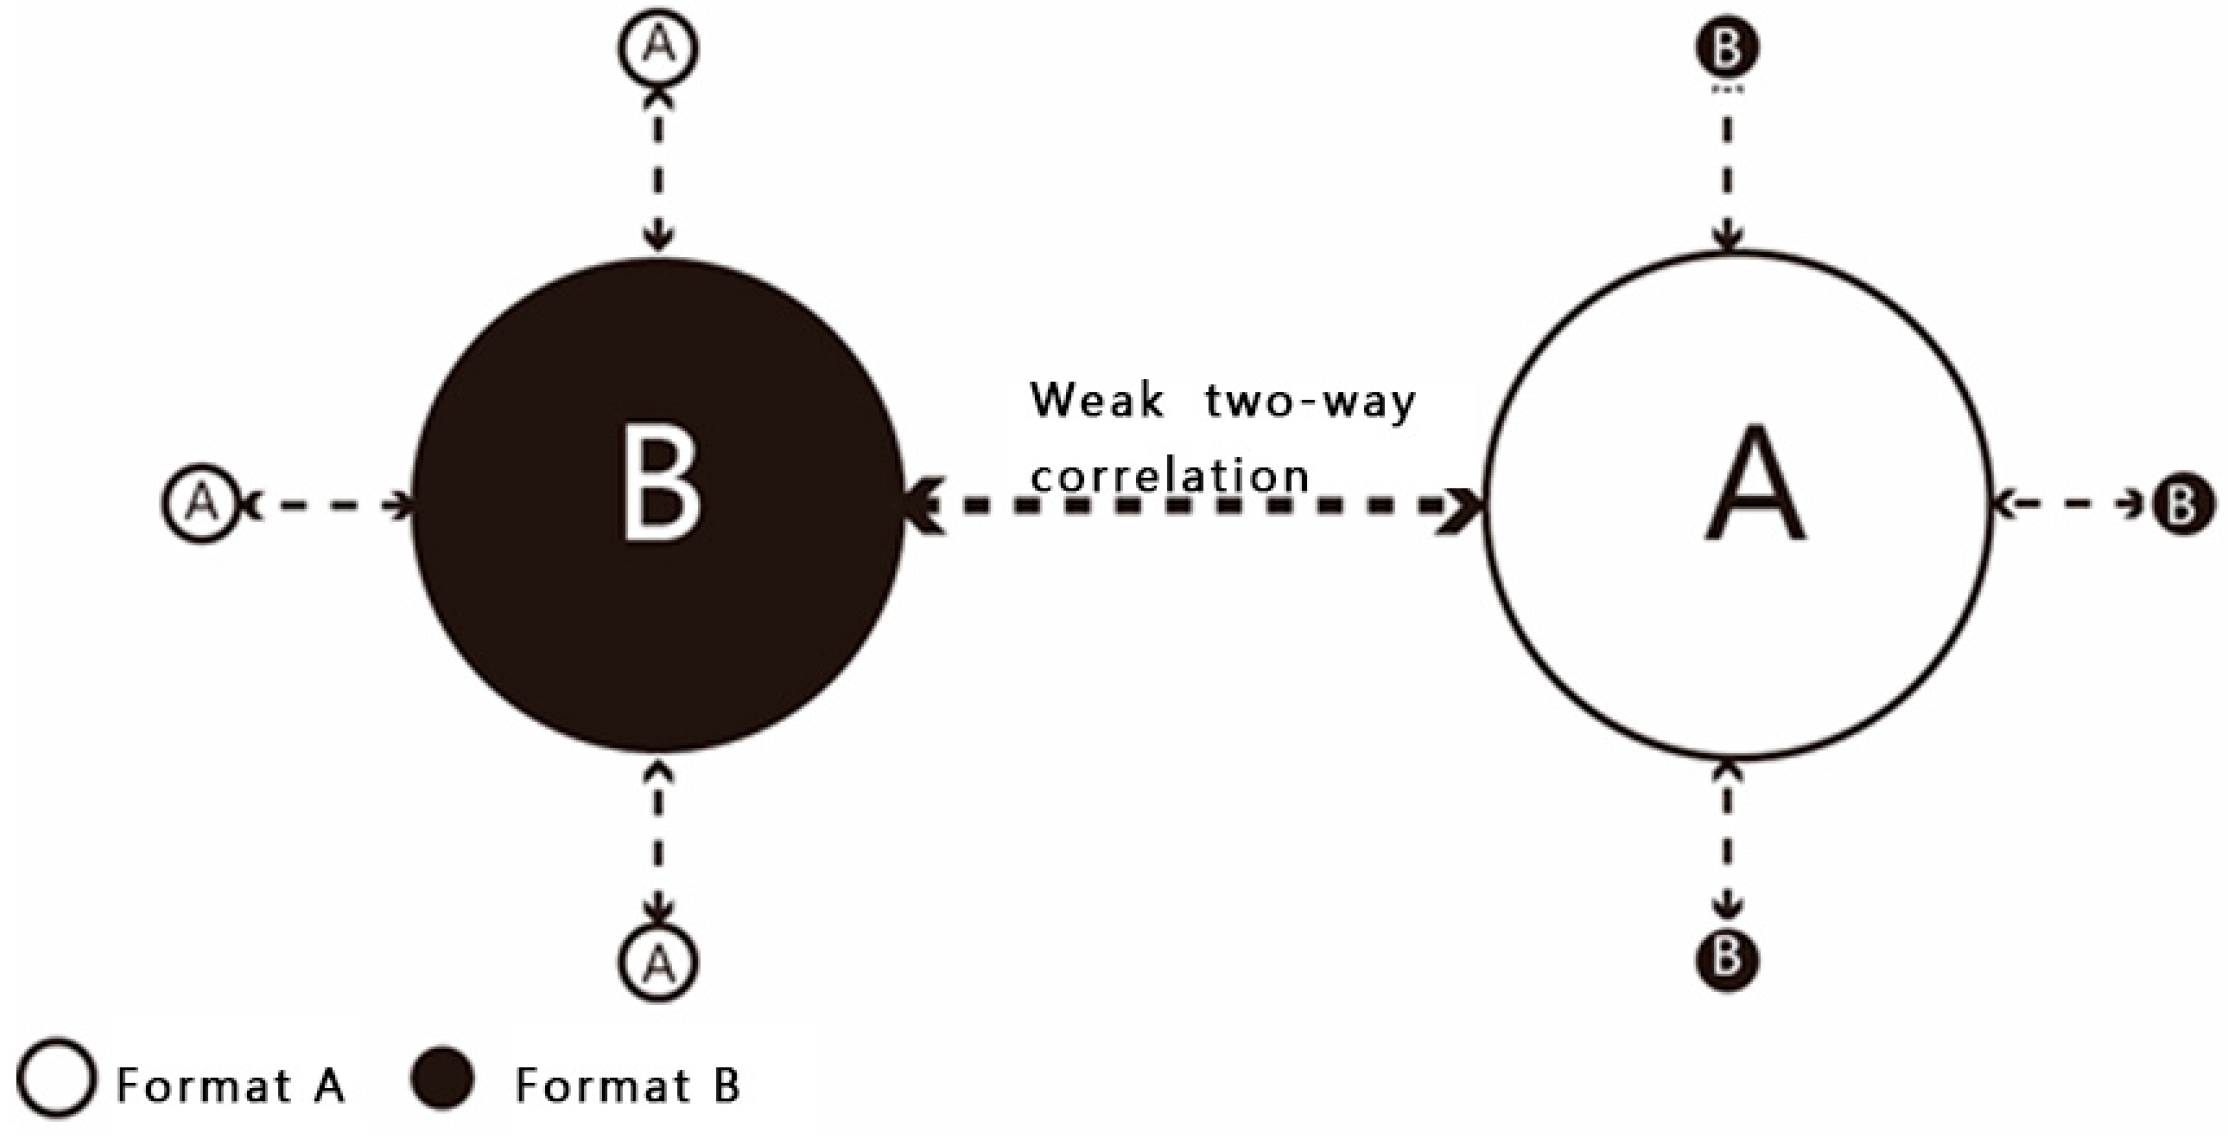
4.3. Weak Two-Way Correlation
A weak two-way correlation requires a weak degree of aggregation between A and B, where the level of interdependence between the two formats is very low: They either exhibit no mutual influence on each other within the central district, or their impacts on each other are negative (Figure 5). Consequently, the degree of aggregation between A and B is weak. Such correlations can also be observed in Shanghai’s two main central districts. Table 7 shows 18 paired functions that are characteristic of a weak two-way correlation.
Table 7 shows that the formats characterized by a weak two-way correlation are associated mainly with businesses and professional functions. Compared with the formats that meet basic needs, they cater to fewer consumers and are evenly distributed in the region to meet the demands of consumers in a wide area. At the same time, these consumer groups, which demand professional services, also subscribe to specific functions, such as cultural, artistic, and market services. Formats that exhibit a weak two-way correlation may mutually exclude requirements pertaining to the environment. For instance, healthcare services require a quiet environment, while sports services need the opposite.
5. Conclusions and Future Work
In this study, we explored the spatial correlations of various types of urban formats. Using Shanghai for our case study, we collected and classified data on formats in the city’s two main central districts. We analyzed the degree of spatial aggregation between formats of various types. Our findings identified two levels of the degree of business aggregation: Strong and weak. We proposed and described three types of spatial relationships that may exist between different format types: Strong two-way correlation, strong one-way correlation, and weak two-way correlation. Moreover, we briefly analyzed the various combinations of formats that are characterized by these spatial relationships. Our analysis suggests that two-way correlation formats fulfill mainly the basic needs of customers. The services or products that they provide are complementary and compensate for the lack of consumer demand for other formats. In the case of strong one-way correlations, the correlated format is the basic needs format, and the correlating format is the professional function, which may depend on the former. The latter caters to higher-level demands of citizens after their basic needs have been met. The weak two-way correlation formats comprise primarily professional functions. There may be a mutually exclusive relationship between the two formats, that is, the requirement of one format regarding the environment may be the opposite of that of another format. In addition, a consumer may select a particular format and reject another in the vicinity. A further possibility is that another format provides a product or service that is mutually exclusive of other products or services.
These three spatial relationships are the result of Shanghai’s complex laws on economic operation and the society. They explain whether different types of formats in urban central districts should be clustered in order to conform to economic operation laws. Based on the existing spatial relationships between different formats, we aim to create a model for such spatial relationships in a future study, which can serve as a guide while designing the layout of a megacity.
Shanghai’s two main central districts provided an apt case study for our examination of the spatial relationships between formats in megacities. However, these relationships have been investigated and confirmed only for Shanghai. It remains to be seen whether the findings of this study apply to high-density central districts in megacities of other countries and regions. We aim to apply the same research methods to assess format relationships in central districts of megacities such as Tokyo, Hong Kong, and Paris in a future study to verify and extend our findings.
Author Contributions
Conceptualization, J.Y. and X.H.; formal analysis, J.Y. and X.H.; investigation, X.H. and Z.Z.; methodology, J.Y. and X.H.; writing—original draft, X.H. and Z.Z.; writing—review and editing, X.H. and Z.Z.
Funding
This research was funded by the National Natural Science Foundation of China, grant number 51708296, China Postdoctoral Science Foundation, grant number 2017M611823, Top-notch Academic Programs Project of Jiangsu Higher Education Institutions, grant number PPZY2015A063 and A Project Funded by the Priority Academic Program Development of Jiangsu Higher Education Insitutions.
Conflicts of Interest
The authors declare no conflict of interest.
References and Note
- Kanemura, E. Reexamination of the theoretical hypothesis about the occurrence and development of retail industry on the premise of retailing categories. Bull. Grad. Sch. Commer. (Waseda Univ.) 36. (In Japanese)
- Wu, Y.-F. Industry formats: The theoretical evolution of retail formats. Ind. Econ. Rev. 2013, 4, 27–38. (In Chinese) [Google Scholar]
- Bhatnagar, A.; Ratchford, B.T. A model of retail format competition for non-durable goods. Int. J. Res. Mark. 2004, 21, 39–59. [Google Scholar] [CrossRef]
- Cardinali, M.G.; Bellini, S. Interformat competition in the grocery retailing. J. Retail. Consum. Serv. 2014, 21, 438–448. [Google Scholar] [CrossRef]
- Sangwon, J.; SooCheong, J. To cluster or not to cluster?: Understanding geographic clustering by restaurant segment. Int. J. Hosp. Manag. 2019, 77, 448–457. [Google Scholar]
- Sane, V.; Chopra, K. Analytical study of shopping motives of young customers for selected product categories with reference to organized retailing in select metropolitan select cities of India. Procedia Soc. Behav. Sci. 2014, 133, 160–168. [Google Scholar] [CrossRef]
- Klein, A.; Schmitz, G. Main-format dominance in consumers’ FMCG cross-format shopping patterns. J. Retail. Consum. Serv. 2016, 30, 105–115. [Google Scholar] [CrossRef]
- Luceri, B.; Latusi, S. The cross-shopping behaviour: Patterns of store format mobility in the apparel sector. Int. J. Retail Distrib. Manag. 2016, 44, 89–104. [Google Scholar] [CrossRef]
- Piovani, D.; Zachariadis, V.; Batty, M. Quantifying retail agglomeration using diverse spatial data. Sci. Rep. 2017, 7, 5451. [Google Scholar] [CrossRef] [PubMed]
- Shi, Y.; Hu, X.; Yang, H.; Yang, J. Format compositions and spatial distribution characteristics of central districts in megacities: People’s Square and Shanghai’s Lujiazui District. Urban Des. Int. 2018. [Google Scholar] [CrossRef]
- Hu, X.; Yang, J. Quantitative analysis of the urban factors limiting central district plane form expansion: Twenty-one case studies of Asian megacities’ central districts. J. Asian Archit. Build. Eng. 2018, 17, 345–351. [Google Scholar] [CrossRef]
Figure 1.
Spatial distribution of formats in Shanghai’s central districts Source: Authors’ graphical depiction.
Figure 1.
Spatial distribution of formats in Shanghai’s central districts Source: Authors’ graphical depiction.

Figure 2.
Distribution of scores showing scattered format aggregation Source: Authors’ graph.

Figure 3.
Strong two-way correlation Data source: Authors’ depiction.

Figure 4.
Strong one-way correlation Data source: Authors’ depiction.

Figure 5.
Weak two-way correlation Data source: Authors’ depiction.


Table 1.
Integrated classification of service industry formats.
| Classifications of Service Industry Formats | ||
|---|---|---|
| Administrative services | Entertainment and recreation services | Education and scientific research |
| Sports | Healthcare | Social welfare |
| Traffic services | Retail services | Market services |
| Catering services | Accommodation services | Finance and insurance |
| Businesses | Culture and art | Other services |
Data source: Authors’ collation.
Table 2.
Formats by type and number of organizations in Shanghai’s two main central districts.
| Classification of Formats | Number of Formats | |
|---|---|---|
| People’s Square | Lujiazui | |
| Administrative management | 1258 | 405 |
| Culture and art | 836 | 307 |
| Education and scientific research | 613 | 294 |
| Sports services | 98 | 90 |
| Healthcare | 360 | 139 |
| Social welfare | 44 | 19 |
| Retail services | 13,004 | 3869 |
| Market services | 256 | 68 |
| Catering services | 6353 | 2168 |
| Accommodation services | 684 | 322 |
| Finance and insurance | 1333 | 1186 |
| Businesses | 8017 | 4297 |
| Entertainment and recreation | 1957 | 853 |
| Traffic services | 129 | 36 |
| Other services | 113 | 65 |
Data source: Authors’ collation.
Table 3.
Degree of aggregation among formats in Shanghai’s two main central districts.
| Administrative Management | Culture and Art | Education and Scientific Research | Sports Services | Healthcare | Social Welfare | Retail Services | Marketing Services | Catering Services | Accommodation Services | Finance and Insurance | Business Offices | Entertainment and Healthcare | Transport Services | Other Service Functions | ||
|---|---|---|---|---|---|---|---|---|---|---|---|---|---|---|---|---|
| Administrative management | -- | 22.43% | 16.06% | 2.04% | 9.74% | 2.16% | 48.11% | 2.77% | 27.60% | 7.10% | 24.17% | 48.53% | 18.46% | 4.09% | 3.37% | |
| Culture and art | 23.36% | -- | 18.11% | 2.89% | 4.99% | 1.05% | 57.04% | 1.92% | 37.88% | 11.20% | 22.75% | 49.61% | 27.21% | 3.67% | 2.54% | |
| Education and scientific research | 23.26% | 24.37% | -- | 2.32% | 10.58% | 0.55% | 59.98% | 2.21% | 41.46% | 10.25% | 27.78% | 54.58% | 28.34% | 3.09% | 4.19% | |
| Sports services | 15.43% | 13.30% | 11.17% | -- | 5.85% | 1.60% | 52.66% | 1.06% | 42.02% | 18.62% | 17.02% | 45.21% | 44.68% | 1.60% | 5.32% | |
| Healthcare | 21.00% | 12.60% | 13.60% | 2.20% | -- | 2.00% | 57.80% | 1.20% | 36.40% | 8.00% | 23.60% | 52.20% | 21.40% | 3.40% | 4.60% | |
| Social welfare | 31.75% | 17.46% | 9.52% | 3.17% | 11.11% | -- | 49.21% | 3.17% | 30.16% | 6.35% | 11.11% | 34.92% | 17.46% | 3.17% | 6.35% | |
| Retail services | 9.07% | 11.85% | 10.61% | 1.94% | 4.87% | 1.62% | -- | 8.49% | 64.29% | 10.93% | 20.45% | 56.40% | 31.13% | 1.49% | 3.14% | |
| Marketing services | 11.42% | 7.10% | 4.94% | 0.62% | 1.23% | 0.62% | 80.86% | -- | 51.54% | 7.72% | 13.27% | 50.62% | 20.99% | 3.09% | 2.47% | |
| Catering services | 7.73% | 9.68% | 8.52% | 2.30% | 4.30% | 0.68% | 75.97% | 4.28% | -- | 14.38% | 17.92% | 47.73% | 34.82% | 1.49% | 1.97% | |
| Accommodation services | 11.03% | 12.52% | 8.25% | 3.28% | 3.58% | 0.50% | 61.03% | 1.89% | 54.77% | -- | 17.69% | 52.29% | 37.97% | 1.89% | 3.28% | |
| Finance and insurance | 23.14% | 17.35% | 16.99% | 3.06% | 9.25% | 0.75% | 70.78% | 3.37% | 51.05% | 11.16% | -- | 72.09% | 29.85% | 9.17% | 4.72% | |
| Business offices | 24.80% | 21.41% | 21.07% | 2.61% | 10.03% | 1.01% | 76.35% | 4.86% | 50.67% | 14.49% | 48.24% | -- | 30.49% | 9.67% | 8.79% | |
| Entertainment and healthcare | 12.06% | 13.70% | 12.14% | 5.09% | 4.98% | 0.43% | 69.68% | 2.88% | 59.11% | 18.79% | 20.85% | 49.54% | -- | 2.06% | 2.42% | |
| Transport services | 40.96% | 28.31% | 19.88% | 1.81% | 11.45% | 1.20% | 71.69% | 10.24% | 39.16% | 10.84% | 48.80% | 80.72% | 28.31% | -- | 4.22% | |
| Other service functions | 20.79% | 15.73% | 14.61% | 3.93% | 13.48% | 2.81% | 78.09% | 3.93% | 51.69% | 17.98% | 43.26% | 88.76% | 28.65% | 3.37% | -- | |
Data source: Authors’ calculations.
Table 4.
Scale of aggregation in Shanghai’s main central districts.
| Administrative Management | Culture and Art | Education and Scientific Research | Sports Services | Healthcare | Social Welfare | Retail Services | Marketing Services | Catering Services | Accommodation Services | Finance and Insurance | Business Offices | Entertainment and Healthcare | Transport Services | Other Service Functions | ||
|---|---|---|---|---|---|---|---|---|---|---|---|---|---|---|---|---|
| Administrative Management | -- | S | S | W | W | W | S | W | S | W | S | S | S | W | W | |
| Culture and art | S | -- | S | W | W | W | S | W | S | W | S | S | S | W | W | |
| Education and scientific research | S | S | -- | W | W | W | S | W | S | W | S | S | S | W | W | |
| Sports services | S | S | W | -- | W | W | S | W | S | S | S | S | S | W | W | |
| Healthcare | S | S | S | W | -- | W | S | W | S | W | S | S | S | W | W | |
| Social welfare | S | S | W | W | W | -- | S | W | S | W | W | S | S | W | W | |
| Retail services | W | S | S | W | W | W | -- | W | S | W | S | S | S | W | W | |
| Marketing services | W | W | W | W | W | W | S | -- | S | W | S | S | S | W | W | |
| Catering services | W | W | W | W | W | W | S | W | -- | S | S | S | S | W | W | |
| Accommodation services | W | S | W | W | W | W | S | W | S | -- | S | S | S | W | W | |
| Finance and insurance | S | S | S | W | W | W | S | W | S | W | -- | S | S | W | W | |
| Business offices | S | S | S | W | W | W | S | W | S | S | S | -- | S | W | W | |
| Entertainment and healthcare | S | S | S | W | W | W | S | W | S | S | S | S | -- | W | W | |
| Transport services | S | S | S | W | W | W | S | W | S | S | S | S | S | -- | W | |
| Other service functions | S | S | S | W | S | W | S | W | S | S | S | S | S | W | -- | |
S = strong; W = weak; Data source: Authors’ compilation.
Table 5.
Combinations of formats in a strong two-way correlation.
| Relationship | Functions of Format A | Functions of Format B |
|---|---|---|
| Strong two-way association | Retail services | Catering services |
| Retail services | Business office | |
| Retail services | Entertainment and healthcare | |
| Retail services | Culture and art | |
| Catering services | Business office | |
| Catering services | Entertainment and healthcare | |
| Business office | Entertainment and healthcare |
Data source: Authors’ compilation.
Table 6.
Combinations of formats in a strong one-way correlation Data source: authors’ compilation.
| Relationship | Associated Format Functions (Format A) | Associating Format Functions (Format B) |
|---|---|---|
| Strong one-way correlation | Retail services | Administrative management |
| Retail services | Sports services | |
| Retail services | Accommodation services | |
| Catering services | Culture and art | |
| Catering services | Sports services | |
| Healthcare | Business office | |
| Business office | Sports services | |
| Business office | Traffic services | |
| Traffic services | Accommodation services | |
| Catering services | Social welfare |
Table 7.
Combinations of formats in a weak two-way correlation.
| Relationship | Functions of Format A | Functions of Format B |
|---|---|---|
| Weak two-way correlation | Culture and art | Marketing services |
| Education and scientific research | Marketing services | |
| Sports services | Healthcare | |
| Sports services | Marketing services | |
| Sports services | Transport services | |
| Sports services | Other services | |
| Healthcare | Sports services | |
| Healthcare | Marketing services | |
| Culture and art | Marketing services | |
| Education and scientific research | Marketing services | |
| Social welfare | Sports services | |
| Transport services | Other services | |
| Transport services | Marketing services | |
| Other services | Marketing services | |
| Social welfare | Marketing services | |
| Social welfare | Transport services |
Data source: Authors’ compilation.
© 2019 by the authors. Licensee MDPI, Basel, Switzerland. This article is an open access article distributed under the terms and conditions of the Creative Commons Attribution (CC BY) license (http://creativecommons.org/licenses/by/4.0/).
Share and Cite
MDPI and ACS Style
Hu, X.; Zhang, Z.; Yang, J. Spatial Correlation of Formats in the Central Districts of a Megacity: The Case of Shanghai. Sustainability 2019, 11, 1658. https://doi.org/10.3390/su11061658
AMA Style
Hu X, Zhang Z, Yang J. Spatial Correlation of Formats in the Central Districts of a Megacity: The Case of Shanghai. Sustainability. 2019; 11(6):1658. https://doi.org/10.3390/su11061658
Chicago/Turabian StyleHu, Xinyu, Zhonghu Zhang, and Junyan Yang. 2019. "Spatial Correlation of Formats in the Central Districts of a Megacity: The Case of Shanghai" Sustainability 11, no. 6: 1658. https://doi.org/10.3390/su11061658
Note that from the first issue of 2016, this journal uses article numbers instead of page numbers. See further details here.