Spatial Dynamics of Intercity Technology Transfer Networks in China’s Three Urban Agglomerations: A Patent Transaction Perspective


1
Institute for Global Innovation and Development, East China Normal University, Shanghai 200062, China
2
School of Urban and Regional Sciences, East China Normal University, Shanghai 200241, China
3
Institute of Eco-Chongming, East China Normal University, Shanghai 200062, China
4
Shanghai Key Laboratory for Urban Ecological Processes and Eco-Restoration, East China Normal University, Shanghai 200241, China
5
School of Ecology and Environmental Sciences, East China Normal University, Shanghai 200241, China
*
Authors to whom correspondence should be addressed.
Sustainability 2019, 11(6), 1647; https://doi.org/10.3390/su11061647
Submission received: 6 December 2018
/
Revised: 12 March 2019
/
Accepted: 14 March 2019
/
Published: 19 March 2019
(This article belongs to the Special Issue Building Regional Sustainability in Urban Agglomeration: Theories, Methodologies, and Applications)
Abstract
:Technology transfer has become a vital pipeline for acquiring external knowledge. The purpose of this paper is to portray the spatial dynamics of intercity technology transfer networks in China’s three urban agglomerations based on patent right transaction data from 2008 to 2015. The integration of social networks and spatial visualization is used to explore spatial networks and influencing variables of the networks. The results demonstrate that Beijing, Shanghai, and Shenzhen are emerging as hubs in the three urban agglomerations. The spatial distributions of degree and weighted degree are significantly heterogeneous and hierarchical. The larger cities play the role of a knowledge and technology incubator, highly related to their economic scale, research and development (R&D) input, and innovation output. The evolution of intercity technology linkages is driven by the networking mechanisms of preferential attachment, hierarchical and contagious diffusion, path dependence, and path breaking. Moreover, we found that the geographical proximity and technology gaps are determinants of the strength of intercity technology linkages. As a result, it has been discovered that the network in the Beijing–Tianjin–Hebei agglomeration is organized in a tree network, while the Yangtze River Delta features a polycentric network and the Pearl River Delta has multi-star characteristics.
1. Introduction
Knowledge flow and transfer have become the focus of innovation geography and urban studies in the globalized knowledge economy [1,2,3]. The New Economic Growth Theory holds that the progress of knowledge and technology has become an important driver for modern economic growth [4]. International technology transfer plays an enhanced role in driving national economic growth [5]. Over the past decades, there has been a notable increment in the number of technology transactions among different entities. This indicates that technology transfer has become an important means for any country, region, or city to acquire external technical knowledge [6]. In other words, technology transfer provided a single city or region with opportunities to gain knowledge from others. As the scale of knowledge and technology continues to expand, the relationship among different entities becomes more and more complex through knowledge exchange. Innovation networks have become a critical form of innovation activity [7]. Regional performance is related to both network connectivity and position in addition to internal innovation capacity [8]. Most literature in innovation network studies has focused on influencing factors, the relationship between network structure and regional innovation performance, and the spatial patterns of innovation collaboration networks [9,10,11,12,13,14]. However, little attention has been paid to the spatial dynamic of innovation networks based on the perspective of technology transfer. Thus, in this paper, we explore a pilot study of dynamic urban technology transfer networks from a patent right transaction perspective.
Big cities have a higher level of open innovation [15]. Urban agglomerations have become an economic core of regions relying on well-developed intercity transportation networks and close economic ties [16]. Thus, urban agglomerations have become innovation poles for the accumulation of innovative elements [17]. Urban agglomerations play the role of the “incubator” of knowledge production within national urban systems, and they also act as the hub of technological mobility that links national and international urban systems [18,19]. Technology flows can further support and promote the integrated development of urban agglomerations [20]. However, little attention has been paid to these technology flows within urban agglomerations.
There are currently two main streams of innovation networks research. The first concerns the influencing factors of innovation. Past research suggests that proximity is an important factor of innovation networks [21,22]. Boschma (2005) defined proximity from five dimensions, including cognitive, organizational, social, institutional, and geographical proximity [23]. Hoekman et al. (2009) confirmed the effects of geographical and institutional proximity on the collaboration of scientific publications and patents in Europe [24]. Ma et al. (2014) found that the impact of geographical proximity on scientific cooperation became stronger with the development of information technology in China [25]. Cognitive, organizational, and social proximity have also been studied by scholars [26,27]. Moreover, urban, industrial, and technological gaps, as well as innovation capacity, are also considered to affect innovation linkages [28,29,30,31].
The second stream focuses on regional innovation performance and spatial patterns of innovation networks. The emergence of the network paradigm has helped us understand the innovation network structure [32]. Regions with higher centrality usually have stronger innovation performance and regions without independent innovation capability rely more on external network links [33,34,35]. Moreover, most spatial patterns of innovation network research are mainly based on co-publication and co-patents because of the increased accessibility of patent citation and scientific collaboration data [36,37,38]. However, innovation networks are undirected when based on collaboration data. There is no obvious source and destination city when two or more co-authors or co-inventors are involved in a paper or patent. It is also difficult to reflect the vector characteristics of flow spaces. Moreover, Andersson et al. (2014) found that unlike in Europe and the United States, the political barriers are becoming more significant to Chinese scientific cooperation [39]. Thus, the collaborative linkages involving Beijing and provincial capitals may be overestimated, while those of some cities such as Shenzhen and Suzhou may be underestimated. In this way, the collaborative relational data may not reflect general market-led knowledge flows.
To fill those gaps, patent right transactions are an appropriate index for constructing a directed and weighted innovation network [40]. One major advantage of using patent right transaction data is that we can construct a directed urban innovation network, unlike with scientific collaboration data. Moreover, the data can visually reflect the supply–demand relationship of technology markets and avoid political bias [41]. To date, most literature on patent transaction transfer has mainly documented the intrinsic characteristics of patents [40,42,43] and the drivers of patent transactions [44,45,46,47,48,49]. Instead, this study paid close attention to the spatial characteristics of patent transfers rather than the characteristics of patent transactions. Moreover, existing empirical studies of cross-location technology transfers have mainly focused on the transnational level [6], inter-regional level [50], and inter-organizational level [32]. Thus, intercity technology transfer has remained an under-developed topic in economic geography. Furthermore, urban agglomerations have different geographical contexts with different effects on innovation performance and flows. Hence, two questions need to be answered: what are the similarities and differences of spatial flows of intercity technology transfer within urban agglomerations, and what are the determinants of geographical contexts driving the spatial dynamics? The three major urban agglomerations in China are selected to represent this topic, based on a social network approach. This study’s aims are twofold—one is to comparatively analyze the spatial heterogeneities of the interurban technology transfer networks, and the other is to shed more light on the drivers of their dynamic spatial variations.
The remainder of this paper is organized as follows. Section 2 presents the study area, data processing, and research methods. Section 3 demonstrates the spatial patterns of intercity transfer networks from nodal centralities, flows, and determinants. Section 4 summarizes the conclusions and future research opportunities.
2. Data and Methods
2.1. Study Area
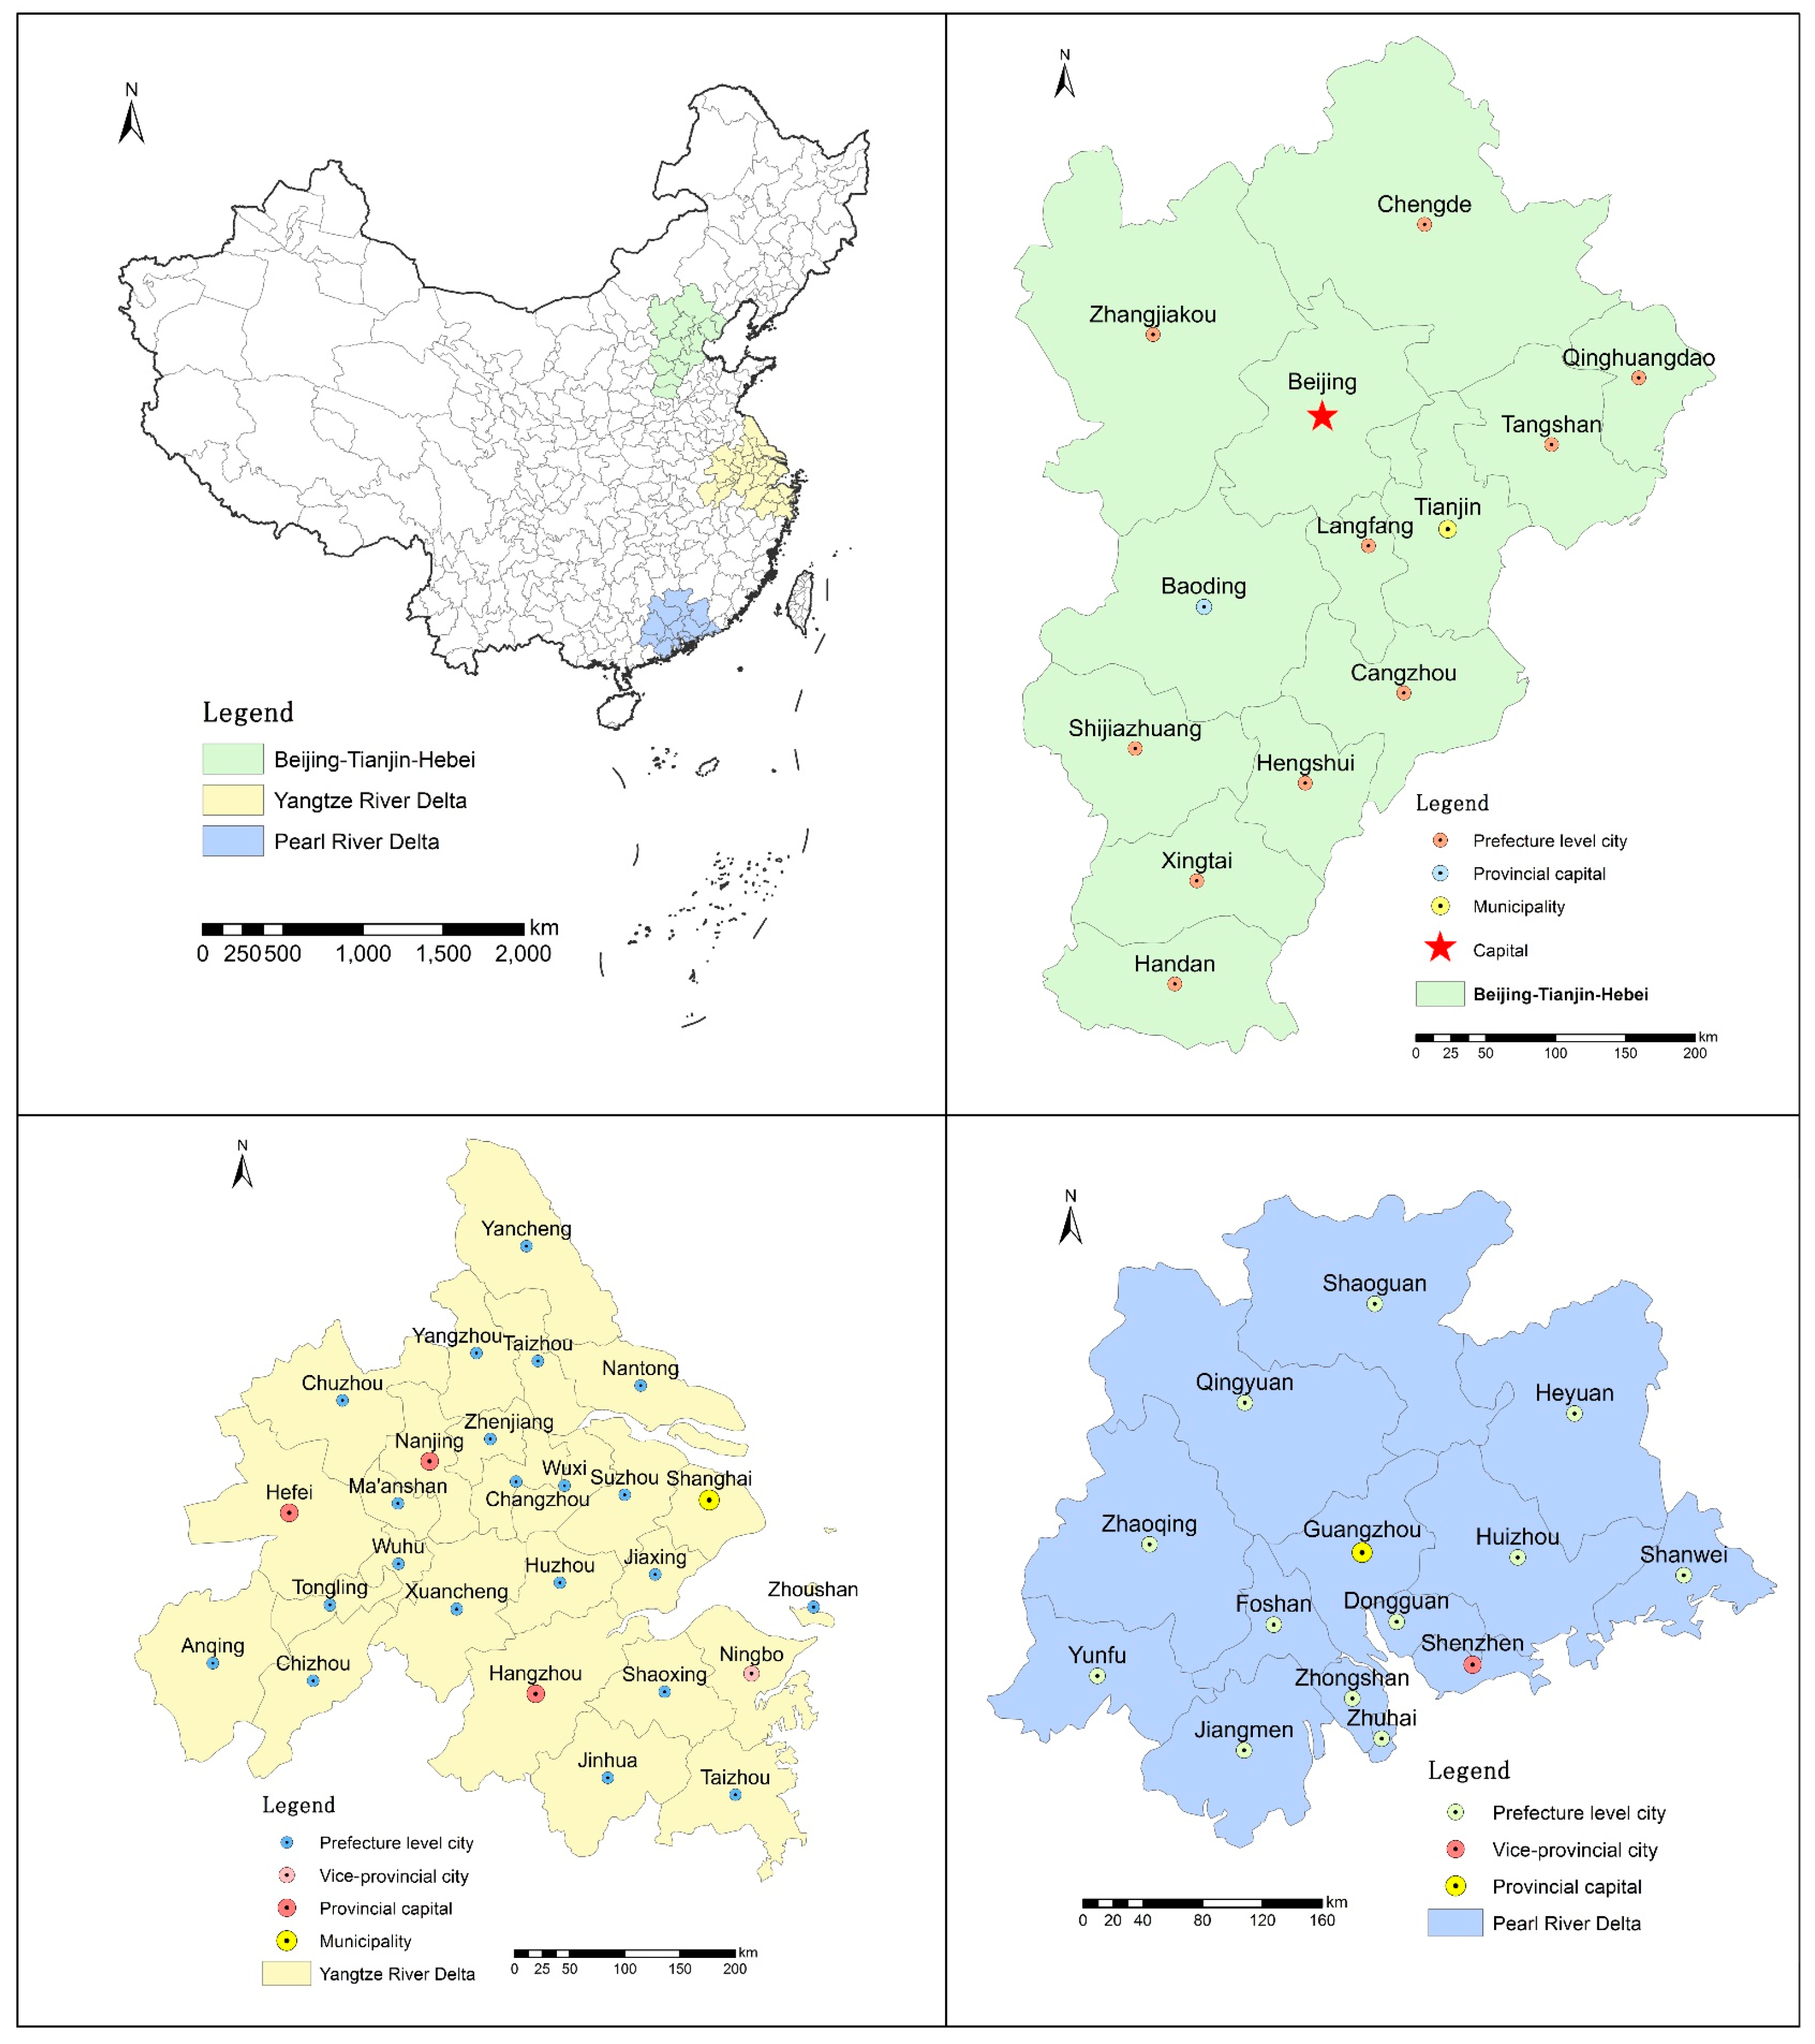
The study areas include Beijing–Tianjin–Hebei (BTH), the Yangtze River Delta (YRD), and the Pearl River Delta (PRD) (Figure 1), which are the largest and most competitive urban agglomerations in China. These areas are important centers of trade, commerce, and innovation, and feature a large talent pool along with high-tech industry [51]. In 2016, the population in these areas accounted for 23.5% of China’s total population, 5.4% of the nation’s land area, and over 40% of its gross domestic product (GDP).
The BTH urban agglomeration consists of three province-level areas, including Beijing (capital and municipality), Tianjin (municipality), and Hebei Province, with 11 cities. Shijiazhuang is the provincial capital of Hebei, and the other 10 cities are prefecture-level cities. The BTH region contains the most important political, cultural, and economic centers in China. The YRD urban agglomeration is composed of four province-level areas, including Shanghai (municipality), Jiangsu Province, Zhejiang Province, and parts of Anhui Province. Among 25 other cities, there are three provincial capitals (Nanjing of Jiangsu Province, Hangzhou of Zhejiang Province, and Hefei of Anhui Province), a vice-provincial city (Ningbo of Zhejiang Province), and 21 prefecture-level cities. The YRD region features the largest urban agglomeration in China with well-developed transportation infrastructure and economic connections. There are 14 cities in the PRD urban agglomeration, including Guangzhou (the provincial capital of Guangdong Province), Shenzhen (the vice-provincial city), and the 12 prefecture-level cities in Guangdong Province. The PRD region is the base for national technological innovation and research and development (R&D) investment. The specific cities of each area are listed in Table A1 of Appendix A. These three urban agglomerations together constitute the center of the national economy and technological innovation.
2.2. Data Sources and Processing
The patent data, including patent citations, patent cooperation, and patent right transactions, have been used in many studies to measure technical interactions and knowledge flows [11,12,36,52,53]. Patent right transaction data refer to records of an assignor selling patent ownership to an assignee. These records provide the ‘source–sink’ relationship (or origin and destination) of patent right flows. Consequently, patent transactions offer a useful perspective to explore spatial connections of interregional technology transfers [40,54]. From the date of application, every change in the owner of a patent is recorded in detail in the patent’s legal status (patent application number, patent name, patent classification number, assignor and address, assignee and address, patent application time, patent grant time, and patent transfer time) by China National Intellectual Property Administration (CNIPA) (http://www.cnipa.gov.cn/).
There are also some drawbacks in measuring technology transfer from the perspective of patent right transactions. First, technology transfer carriers do not only rely on patents. There are also many other ways to transfer technology, such as investment, equipment, talent, other codified types of knowledge, and tacit knowledge. Secondly, most technology patent flows are measured by patent licensing and patent right transactions [55]. Thus, patent right transactions are only a part of technology patents flows. We do not have data available for patent licensing transactions, but patent right transaction data have been proven to be a practical dataset to explore spatial dynamics of technology transfer [40]. Thus, in this study, patent right transaction data from 1 January 2008 to 31 December 2015 were mined to explore the spatial flows of technology transfer networks within urban agglomerations.
The process for extracting the patent transfer data from the CNIPA database is as follows. First, a crawler program was used to mine patent ownership transaction information, which contained the patent application number, patent name, patent classification number, assignor and address, assignee and address, patent application time, patent grant time, and patent transfer time. We obtained 115,784 patent transaction records from 2008 to 2015 in China. In this paper, we pay more attention to the variations of city location before and after patent transfer. Secondly, the patent transfer data of the three major urban agglomerations were screened out by extracting the city names before and after the transfer. Thus, each patent transfer record contained an origin city and a destination city within the three major urban agglomerations. Finally, we counted the number of intercity patent transactions between city-pairs. Intercity technology transfer was defined as a city-pair that featured a patent transfer occurring between different cities. We counted the occurrence of all city-pairs in a year from January 1 to December 31 that denoted the strength of intercity linkages. Transfer data were used to form an intercity technology transfer linkage by aggregating individual patent transfers at the city level. The database includes three columns; namely, pre-transfer city, post-transfer city, and transfer times. Note that we have only retained the patent transaction data within the three urban agglomerations, without consideration of transactions across them. Instead, we emphasize the spatial characteristics of technology transfer networks within urban agglomerations from a comparative perspective.
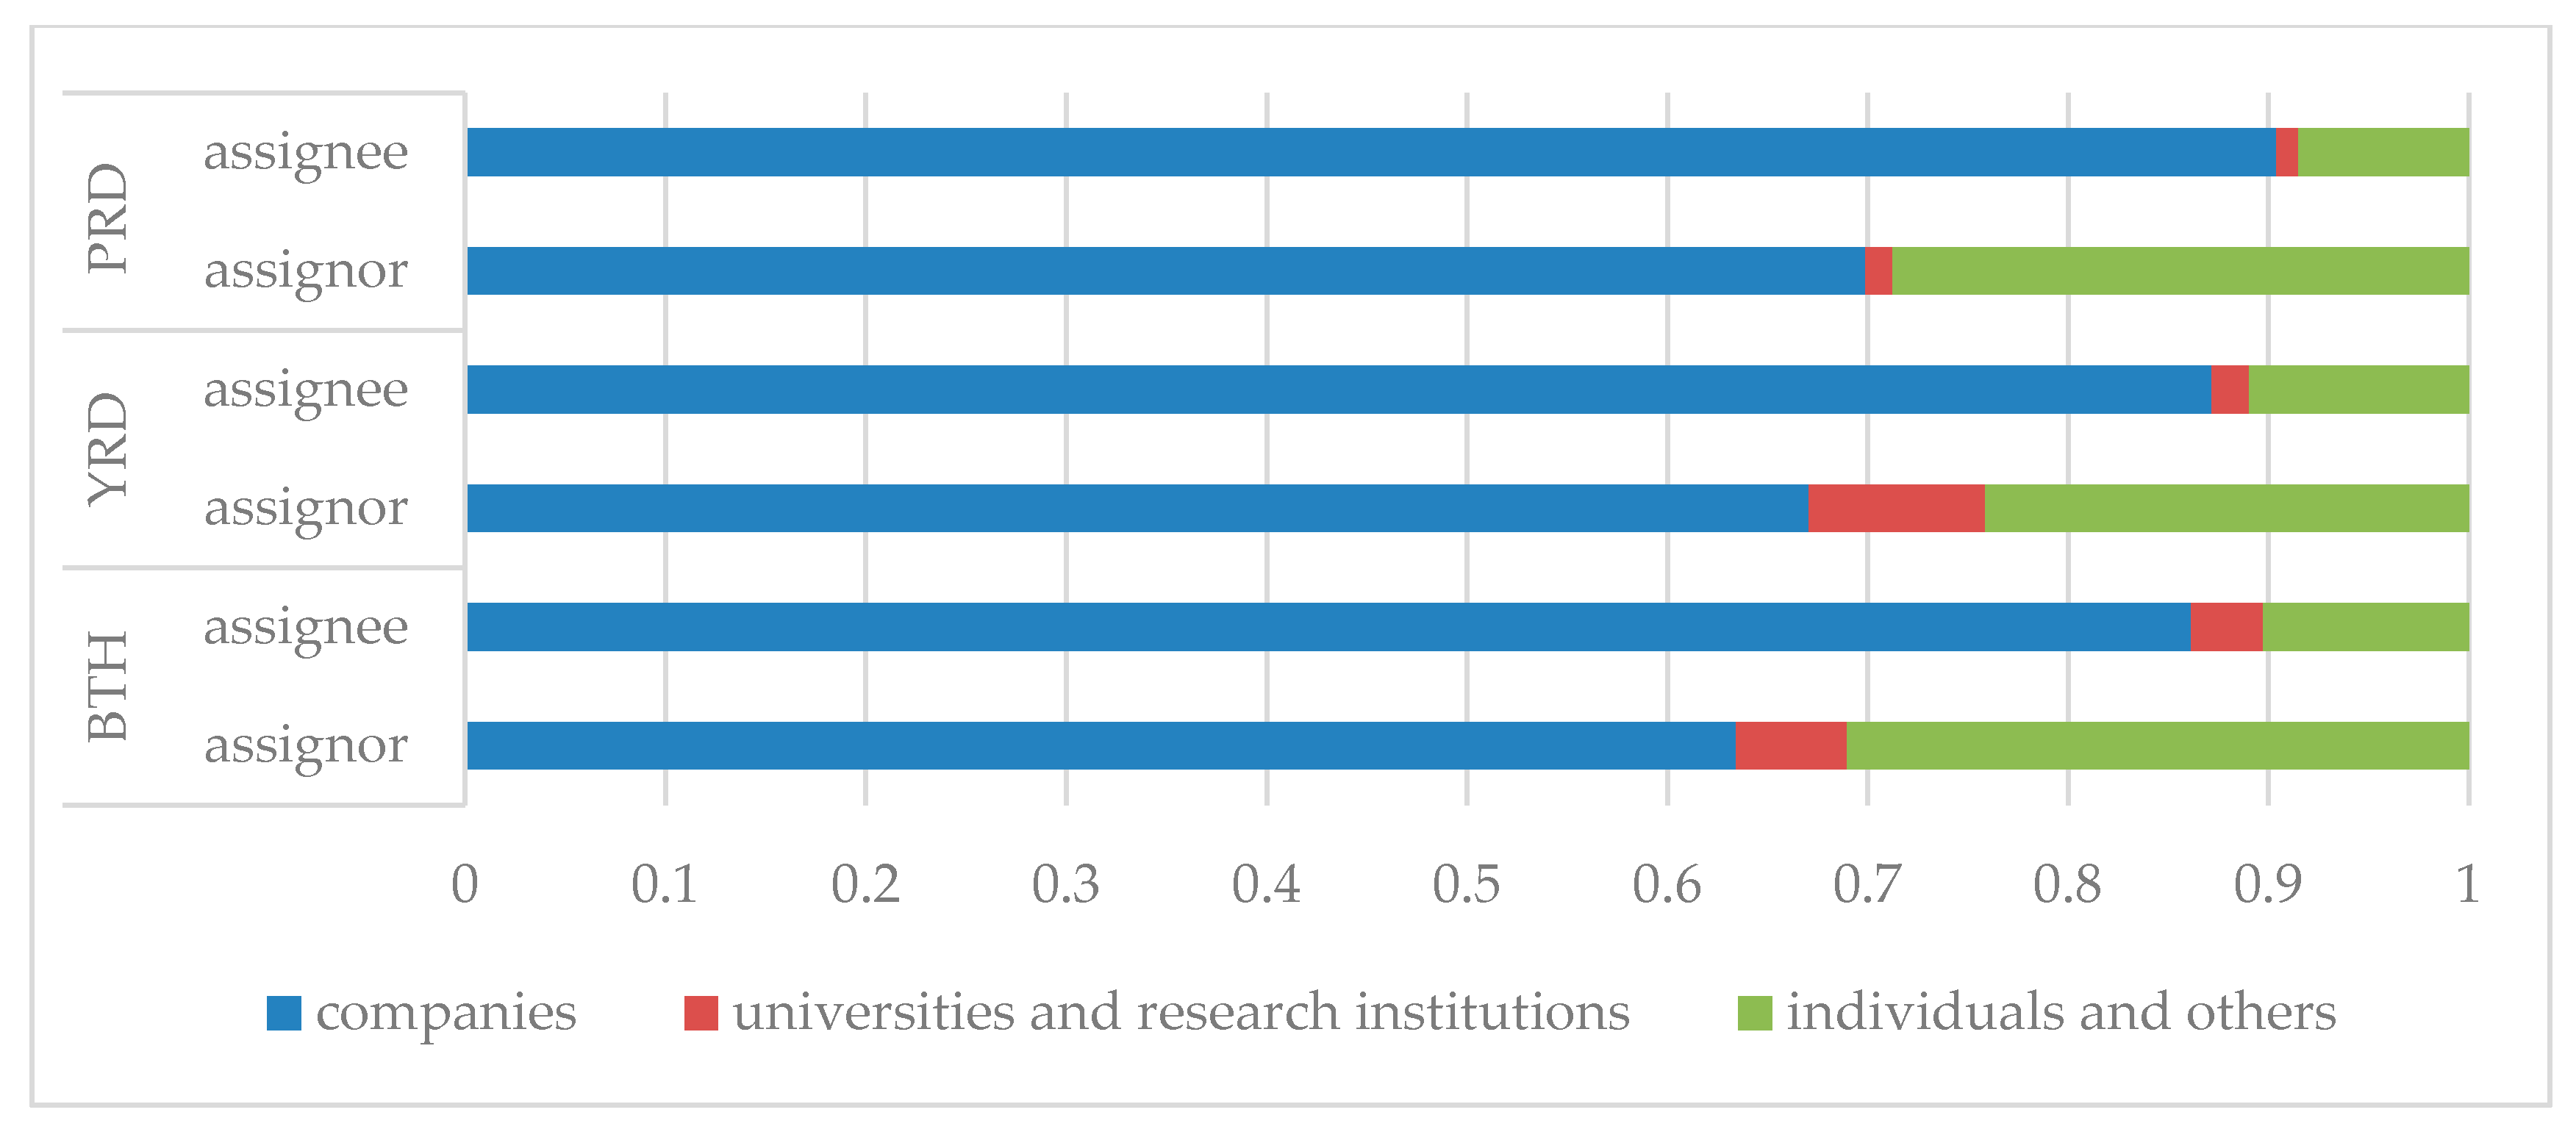
China has become a big patent country and the number of patents has ranked the first in the world for six consecutive years. However, behind the amazing number of patents lies the quality crisis, and the market value and competitiveness of a large number of patents are insufficient [43]—4.82%, 2.21%, and 3.95% are the average proportions of the number of patent transactions to the total patents output of three major urban agglomerations (BTH, YRD, and PRD) for three years (2008, 2012, and 2015), respectively. Figure 2 illustrates the number of total (intracity and intercity) and intercity patent transactions of the three major urban agglomerations from 2008 to 2015. Patent right transaction data are only a part of patent production, but represent high-quality innovative production [40,41]. There was a notable increment in the number of patent transactions within the three major urban agglomerations during the study period. Moreover, according the patent right transaction information in 2015, we identified several types of patentees in the assigner and assignee, including companies, universities and research institutions, individuals, and others (Figure 3). Among them, companies participated in many more patent transactions than other types of patentees. Meanwhile, companies were more likely to play the role of the assignee than the assignor. However, individuals, universities, and research institutions were the opposite.
2.3. Methods
2.3.1. Network Construction
We modeled patent transfer activities within the urban agglomerations using a graph (G) composed of a set (V) of n nodes and a set (E) of m links. In this study, we were not only interested in the structure of the links, but also in the intensity of the links between cities, as they reflect the strength of urban connections. On the basis of the principle of graph theory, a weighted urban network matrix (Formula (1)) was established using a city as the node of the network. The patent transfer relationship between the cities was represented by the edge, and the patent transfer quantity between the cities was based on connection strength. The network covered the weight and direction of technology transfer intensity. Rij was the number of patents transferred from i city to j city for node i. Nine matrices were generated for the three major urban agglomerations in 2008, 2012, and 2015, respectively.
2.3.2. Social Network Analysis
Social network analysis is a useful tool for investigating various kinds of networks [56,57]. It can offer an overall picture and describe the details of a technology transfer network from the perspective of patent transactions. Nine intercity technology transfer networks were constructed within the three urban agglomerations based on the method outlined above. Gephi 0.9.1 (a social network analysis software) was used to calculate network metrics. ArcGIS 10.3 was used to display the spatial pattern of important metrics. The centrality of cities referred to their positional importance and the connections among cities demonstrated their interaction with each other in the network [58]. Degree centrality and betweenness centrality was calculated for all network nodes. Degree centrality was an early indicator that reflected the importance of cities [59]. Betweenness centrality measured the extent to which one city was accessible to other cities and controlled intercity connections with other cities within the network [60]. Degree centrality for city i is defined as (2):
The degree centrality is the ratio of the number of cities connected to a city to the maximum possible number of connections. A city had a higher degree centrality if it had more direct linkages with other cities. Betweenness centrality for city i is defined as (3):
Betweenness centrality is calculated as the ratio of the number of shortest paths between city j and city k passing through city i to the number of shortest paths between city j and city k. The index is normalized between 0 and 1.
The urban weight degree (e.g., the sum of weighted in-degree and out-degree) and net flow in-degree (e.g., the difference between weighted in-degree and out-degree) were calculated to analyze urban node characteristics.
2.3.3. Negative Binomial Regression Analysis
Intercity knowledge flow has significant heterogeneity and hierarchy [35,36,37]. So it is necessary to explore the determinants of the strength of intercity patent transactions. Previous studies have used a gravity model to analyze the determinants of innovation networks [14,61]. Because they do not have directed intercity connections, their flow data cannot be split into origin and destination regions. In this study, however, the number of directed intercity patent transactions was used as the dependent variable. Because the dependent variable is a count, it is inappropriate to use an ordinary least squares estimation. Poisson or negative binomial regressions can be used instead [62]. By calculating the mean and the variance of the dependent variable, we find the variance is greater than the mean. Negative binomial regression is often more appropriate in cases of over-dispersion [63]. For the selection of explanatory variables, we relied on the existing empirical and theoretical literature on this subject [28,30,64,65,66]. The explanatory variables are geographic distance, industrial structure similarity, technology gap, and technology absorptive capacity. We also added three control variables in the regression. Urban economies may affect the capacity for applying technology; thus, we consider the urban economic gap as a control variable. The key city, as a technology output city, may affect the volume of patent transactions between cities. The key city output is the second control variable. Moreover, different urban agglomerations may have different disparities in the volume of intercity patent transactions. The region is viewed as the third control variable in our model. Region is a dummy variable to distinguish different urban agglomerations. The variance inflation factor (VIF) score is below 10, the mean VIF is 1.54, and the highest VIF value is 2.00, indicating multi-collinearity is not serious in these models. The industry data, R&D investment data, and GDP were obtained from the China City Statistical Yearbook [67], and the patent grant data were obtained from the China National Intellectual Property Administration. In this model, we use the cross-sectional data of 2015. The definition of these variables is as follows.
Distance between city-pairs is measured as follows:
where is the physical distance between city i and city y. The is the farthest distance among all city-pairs.
Industrial similarity is defined by the following:
where is the proportion of the production of k industry in the productions of all industries of city i, is the average of , and K is the industrial type.
Technology gap is measured by the gap in the number of patent grants between cities. Its formula is shown as follows:
where is the number of patent authorizations of a city. The number of patent grants of a city is counted by CNIPA (http://www.cnipa.gov.cn/). It is the amount of patents granted to companies or other units located in the city.
Absorptive capacity is calculated by the amount of research investment as a proportion of GDP of the city absorbing the technology:
where is the amount of R&D investment in the destination city.
Economic gap is the gap of urban GDP with the formula below:
where the is the smaller value of GDP and the is the bigger value of GDP.
Key city output is a dummy variable, = 1 when the city i is the key city (Beijing, Shanghai, and Shenzhen) of urban agglomerations,
and = 0 otherwise.
3. Results
3.1. Urban Centrality in the Technology Transfer Network
3.1.1. Degree Centrality and Betweenness Centrality
Table 1 lists the top five cities with the largest urban degree centrality (DC) and betweenness centrality (BC) within the three major urban agglomerations in 2008, 2012, and 2015. Beijing, Shanghai, Shenzhen, and Guangzhou all featured high degree centrality. These cities constituted the core of intercity technology transfer networks. Beijing and Shanghai were observed to hold the dominant position within their urban agglomerations. In 2015, the DC values for Beijing and Shanghai were 1, indicating that Beijing and Shanghai had established contact with other cities within the BTH and YRD, respectively. In the PRD, Shenzhen and Guangzhou had the highest DC values during the study period. These results indicated that the cities tended to connect to other cities that featured developed economies and excellent innovation capacity. This suggests that the evolution of intercity technology transfer networks was driven by the preferential attachment principle [68]. Furthermore, DC values were observed to increase within the three major agglomerations during the study period. However, this increase was observed to diminish during the 2012 and 2015 periods compared with the 2008 period.
Beijing, Shanghai, and Shenzhen were observed to dominate technology transmission in transfer networks. These cities were important bridges for technology flows within the networks. However, there was a considerable discrepancy among BC values within the urban agglomerations. For example, the BC for Beijing–Tianjin–Hebei increased from 2008 to 2015, while the Yangtze River Delta and Pearl River Delta experienced a downward trend. This suggests that the value of BC tended to decline for cities at the top of the hierarchy. In other words, with the increase of intercity linkages, the dependence of the cities at lower positions in the top hierarchy cities had decreased. However, a different situation existed in BTH, where there was a single core network pattern. Most of the cities in this region had a strong linkage with Beijing and a lesser connection with other cities.
As mentioned above, the centrality of cities refers to their positional importance. In this paper, the centrality measures the technology transfer capacity of cities. Generally, the urban technology transfer capacity is highly related to the economy, R&D, and innovation [69]. Thus, we made a correlation analysis between these influencing variables (per capita GDP, R&D investment, patent grant) and the urban centrality, as shown in Table A2 of Appendix A. There is a significant positive correlation between the urban technology transfer capacity and economic level, R&D investment, and innovation performance. Therefore, cities with a high centrality tend to have more developed economies, larger R&D investment, and greater innovation performance than those with lower centrality. Meanwhile, under the impetus of the preferential attachment mechanism, the cities with high centrality occupy a more important position in the network.
3.1.2. Weighted Degree
All cities in the three major urban agglomerations were divided into four hierarchies according to natural breaks classification using ArcGIS 10.3 (Figure 4). Moreover, these hierarchies were based on urban degree (D) and weighted degree (WD).
Overall, both D and WD were observed to increase for the cities, and the intercity patent trading became more positive over time. The scope of intercity technology transfer activities continuously extended over time to match the whole urban agglomeration. Specifically, the YRD had the largest cap value for WD, which was 972 in Shanghai. This was followed by the cap value in the PRD, which was 648 in Shenzhen. The BTH featured the smallest cap value, which was 313 in Beijing (Figure 4). The YRD featured the most intercity linkages, suggesting a more perfect regional technology transfer network. However, the BTH was exposed to an undeveloped technology transfer network during the research period, where there was a significant polarization phenomenon in the spatial distribution. Moreover, the spatial distribution of D and WD was significantly heterogeneous and hierarchical within the three major urban agglomerations.
According to Figure 4, Beijing held the dominant position with the largest D and WD values in the BTH. Tianjin also played an essential role as a sub-core city in the network. Additionally, most of the other cities were located at a lower hierarchy in the network, except for Shijiazhuang and Langfang in 2015. Overall, the cities in Hebei Province held peripheral positions within the networks. There was a significant technology transfer gap between Hebei and Beijing/Tianjin. Shanghai was the core city in the YRD, and dominated the technology transfer activities in the regional network from 2008 to 2015. Suzhou had the second largest WD values, replacing Hangzhou in 2015. Higher WD values were gradually transferred from the central and southeastern areas to eastern areas throughout the study period. In the PRD, the cities with larger D and WD values were concentrated in the southcentral areas of the region. The WD value for Shenzhen (648) was far higher than that of Guangzhou (341), despite the two cities being in the same urban degree hierarchy. This suggests that Shenzhen held a more influential position in the network compared with Guangzhou. Interestingly, there was an inconsistency between the urban hierarchy for D and WD. For example, Foshan had a higher D value than Dongguan, whereas Foshan lagged far behind Dongguan in WD. Thus, a high D value does not mean that a city will have strong intercity linkages. Some cities may have a fixed and strong technology flow with a few cities.
3.2. Flow Direction in the Technology Transfer Network
Net flow in-degree (NFD) was calculated for all cities within the three major urban agglomerations to analyze the direction of intercity technology transfers. Table 2(a–c) list the NFD values for all cities with the ranking based on WD within the three major urban agglomerations. Beijing, Shanghai, and Shenzhen were observed to be the most important cities as they had the largest WD values within their respective urban agglomerations.
Beijing was overwhelmingly dominant within the BTH, and the WD in the city was far higher than that of other cities as a result of its political and economic advantages. The city was observed to change from being a technology absorption center to an output center during the study period. Most of the other surrounding cities were observed to have higher weighted in-degree values than weighted out-degree values. This suggests that Beijing had a varied impact on the surrounding cities, ranging from an initial siphon effect to a diffusion effect later in the study period. In the former period, Beijing continuously absorbed technology from the surrounding cities owing to its numerous enterprises with powerful transformation capability. This led to an economic gap between Beijing and the surrounding cities and indirectly resulted in uneven economic development in the BTH. In the second period, Beijing helped spread technology and innovation to the surrounding cities. Technology transfer was an important means for promoting the integration of the Beijing–Tianjin–Hebei urban agglomeration and relieving urban functions and population pressures in Beijing [20]. As a consequence, supporting technological absorptive capacity and industrial cultivation in Hebei Province aided in reducing poverty zones located around Beijing and Tianjin.
Table 2(b) demonstrates that Shanghai, Hangzhou, Suzhou, and Nanjing held dominant positions within the network. Shanghai possessed a considerably more influential and central position within the network compared with the other cities. These four cities were observed to change from technology absorptive hubs to diffusion centers. The cities of Nantong, Jiaxing, Hefei, Huzhou, and Yancheng were ranked as secondary in the network hierarchy and acted as technology absorbers in the YRD. It is important to understand why cities at the top of the network hierarchy act as important technology export centers, while second tier cities are normally the destination for technology transfers. First, this is because developed cities such as Shanghai, Hangzhou, Suzhou, and Nanjing adopt development strategies for the transformation to new high-tech industries. These cities pay more attention to research and development industries with rich innovation resources, which results in more economic and social benefits. Thereby, these developed cities generate strong external technology spillovers and become technology export centers. Second, the fact that second tier cities act as the main absorption centers can largely be explained by the technology gap theory. When there is a technical gap between two regions, the less developed region will absorb and utilize the improved technology from the developed region. The greater the technological gap, the more difficult for backward regions to imitate technologies, which makes technology transfer more difficult. In other words, the technology spillover effect may not occur when the technology gap exceeds certain distances. Therefore, second tier cities are more likely to absorb technology from the cities at the top hierarchy of the network. Moreover, enterprises play an important role in transforming scientific achievements into market-oriented products. Second tier cities have more enterprises with excellent technical absorptive capacity than lower tier cities. Thus, second tier cities are normally at the absorption center of the network. However, peripheral cities in the network have smaller WD values because of the lower values for weighted in-degree and weighted out-degree, meaning that technology transfer activities for these peripheral cities are not positive.
As shown in Table 2(c), Shenzhen and Guangzhou had the largest technology flows in the PRD during the study period. This shows that Shenzhen’s technological innovation capability surpassed the provincial capital of Guangzhou. The finding was similar to the study of economic links by Pan et al. (2017), which discovered that Shenzhen was the most dominant city in the PRD [70]. The top four cities with the largest technology flows during the study period were Shenzhen, Guangzhou, Dongguan, and Foshan. Among these cities, Shenzhen was also the largest technology exporter. Most of the other cities had a higher weighted in-degree than weighted out-degree, which indicated that Shenzhen was the key technology exporter in the region. Shenzhen has been a window to the world in China’s opening up, and its independent strength in innovation has been remarkable in recent years. Indeed, technological innovation has become the driving force for economic development. In 2017, Shenzhen’s economic output overtook that of Guangzhou for the first time. Guangzhou formerly played the role of technology exporter, but has since changed into a major technology absorption city. These changes suggest that Guangzhou has the capacity to absorb new technologies to improve its competitiveness. For instance, the technology industry in Guangzhou pays close attention to the new generation of information technologies, such as artificial intelligence, biomedicine, new energy, and new material industries. Moreover, the city actively absorbs new technologies with high-tech content. As a result, this has led to the rapid expansion of technology imports in the city.
It can be concluded that the top hierarchical cities within the urban agglomerations have paid more attention to technology diffusion than technology absorption over time. This suggests that major cities are acting as technology exporters, and that innovation has become an important function of the megalopolis. Additionally, other cities within the urban agglomerations actively absorb technology to improve productivity and competitiveness.
3.3. Flow Hierarchy in the Technology Transfer Network
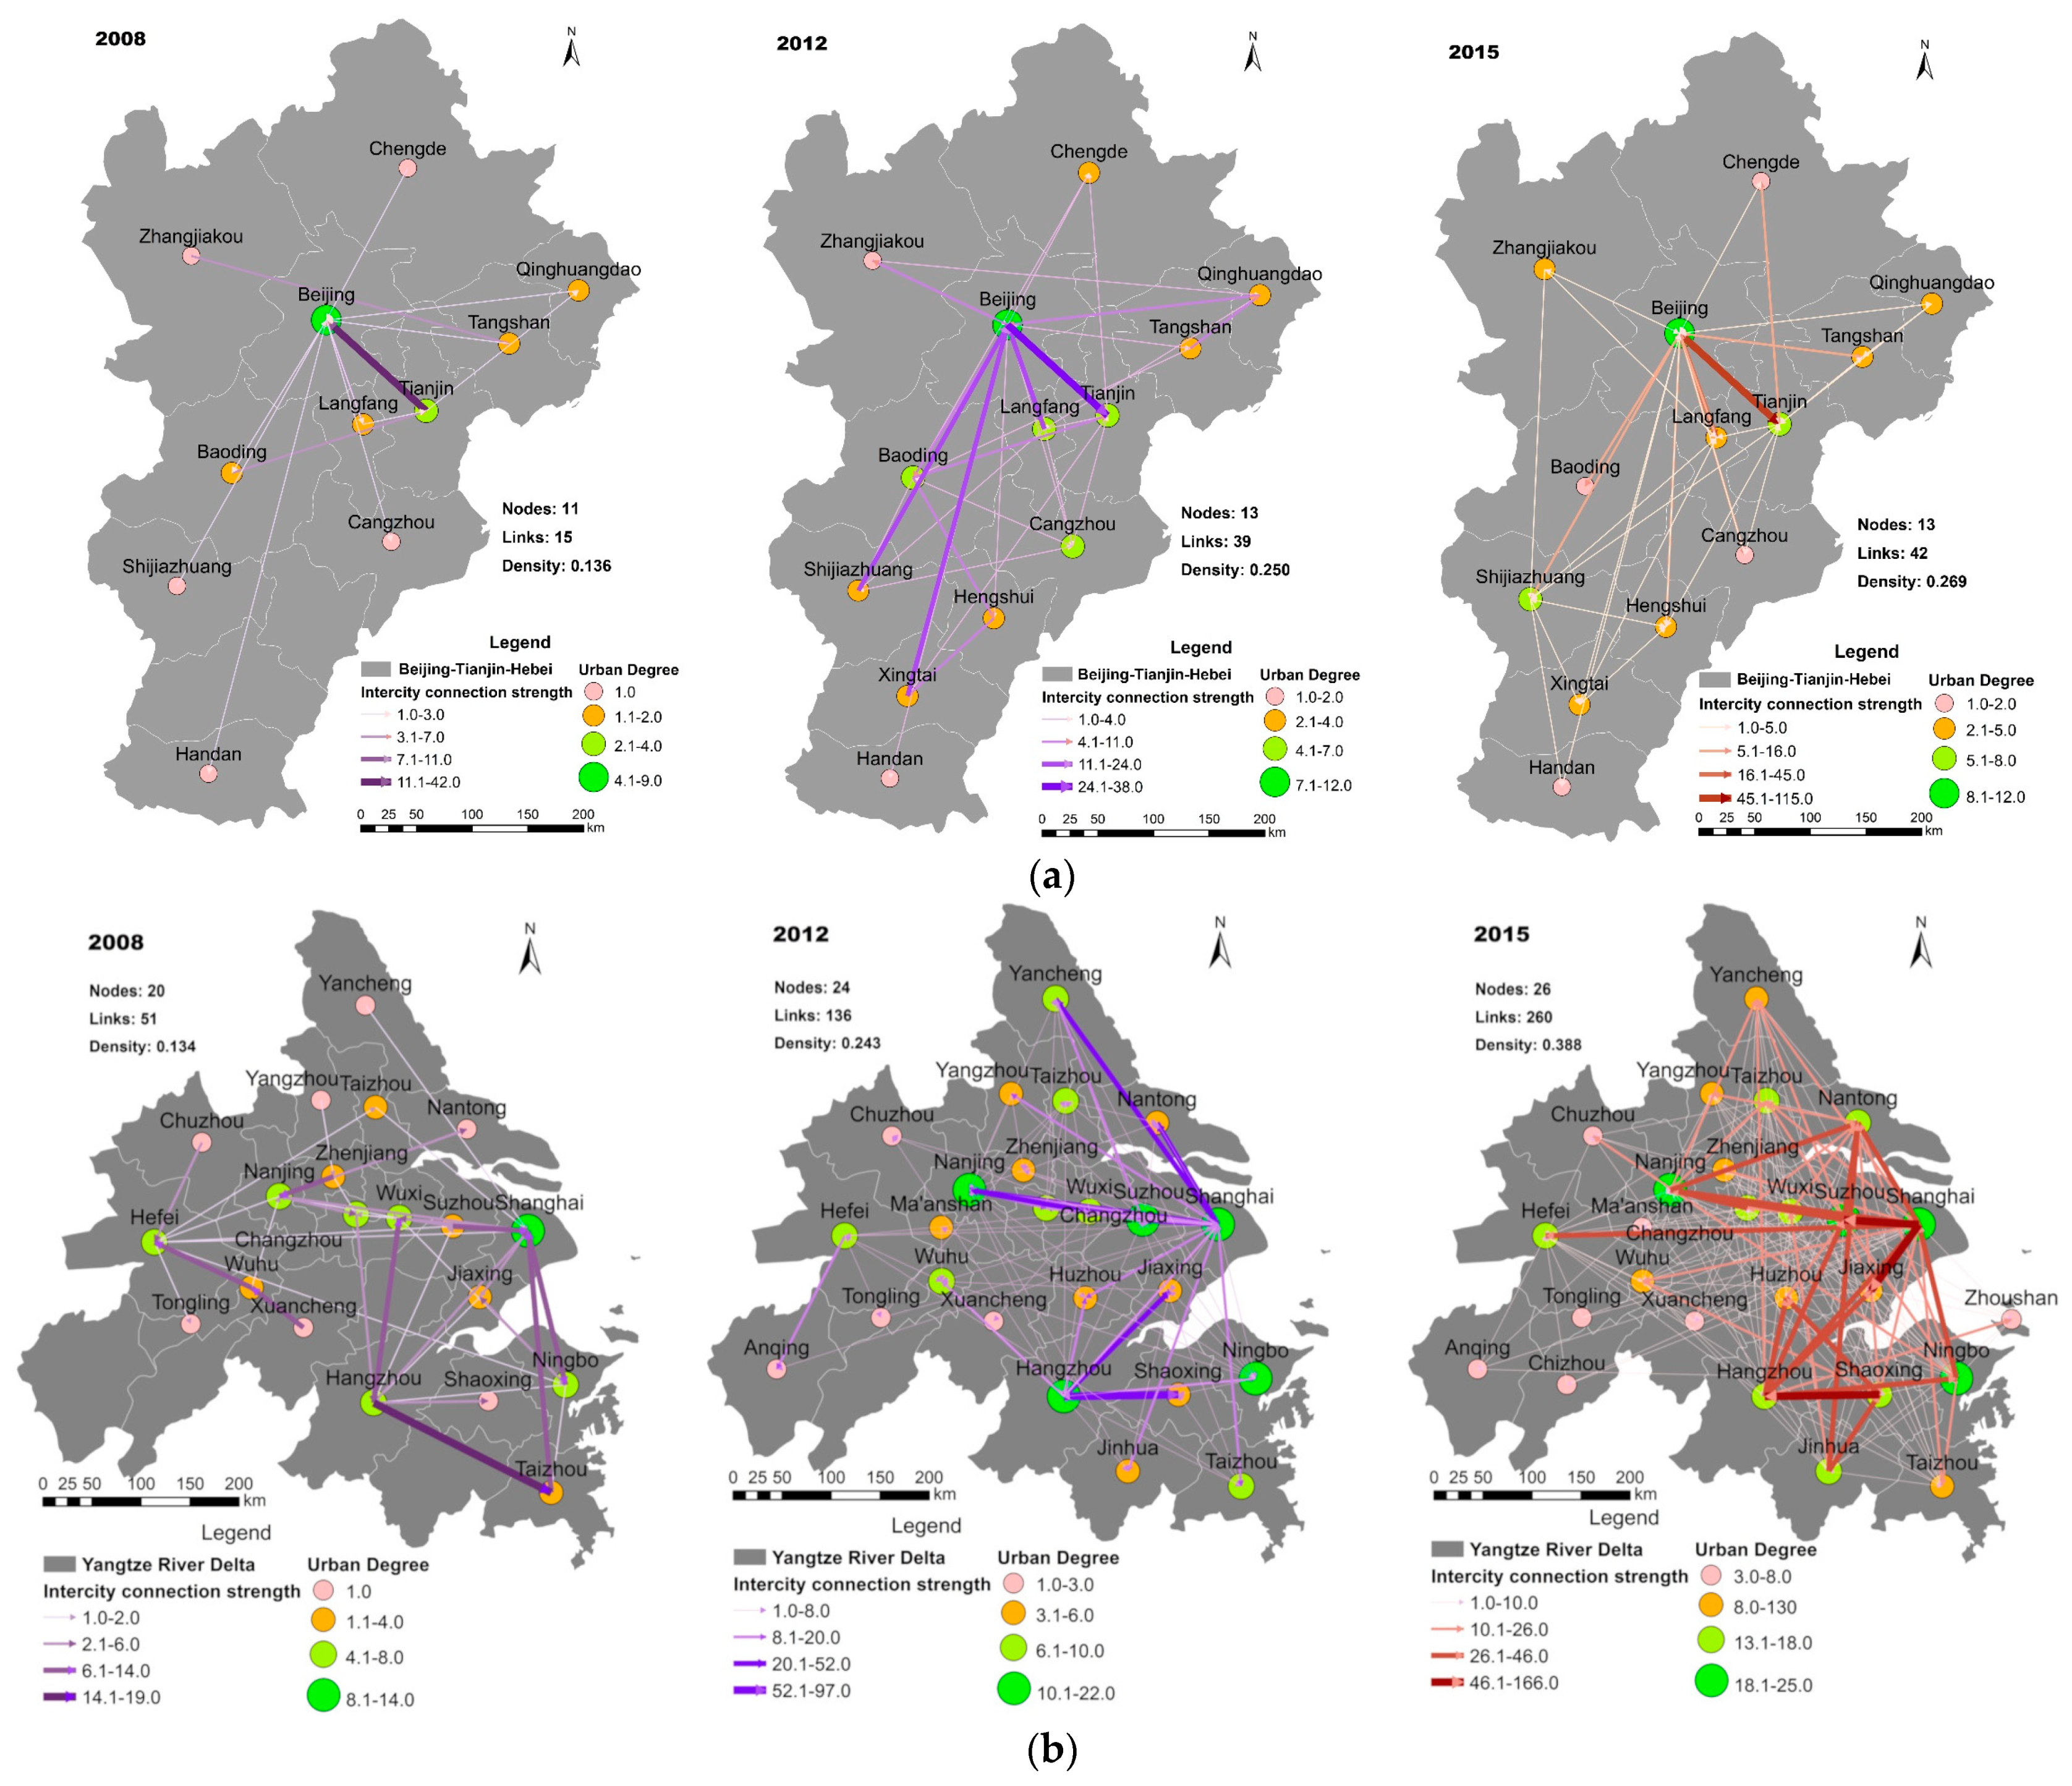
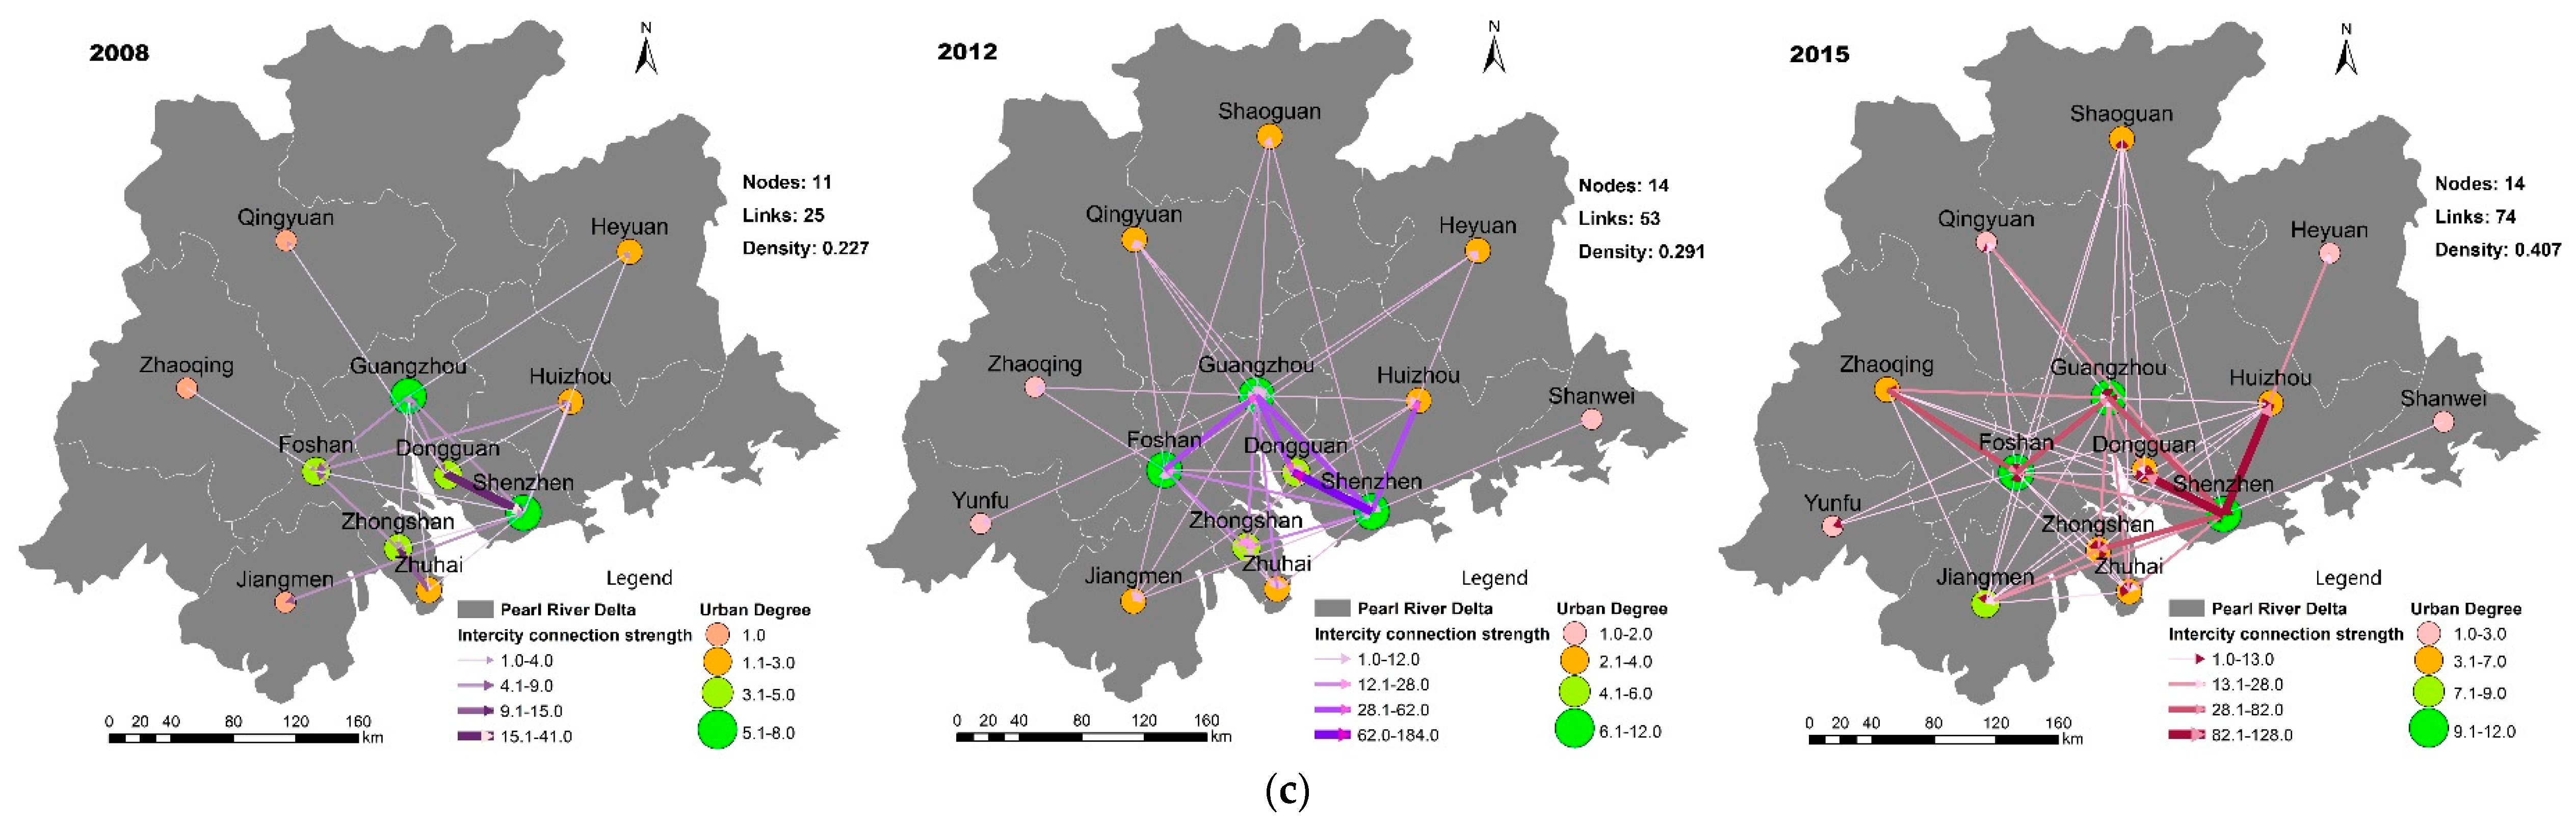
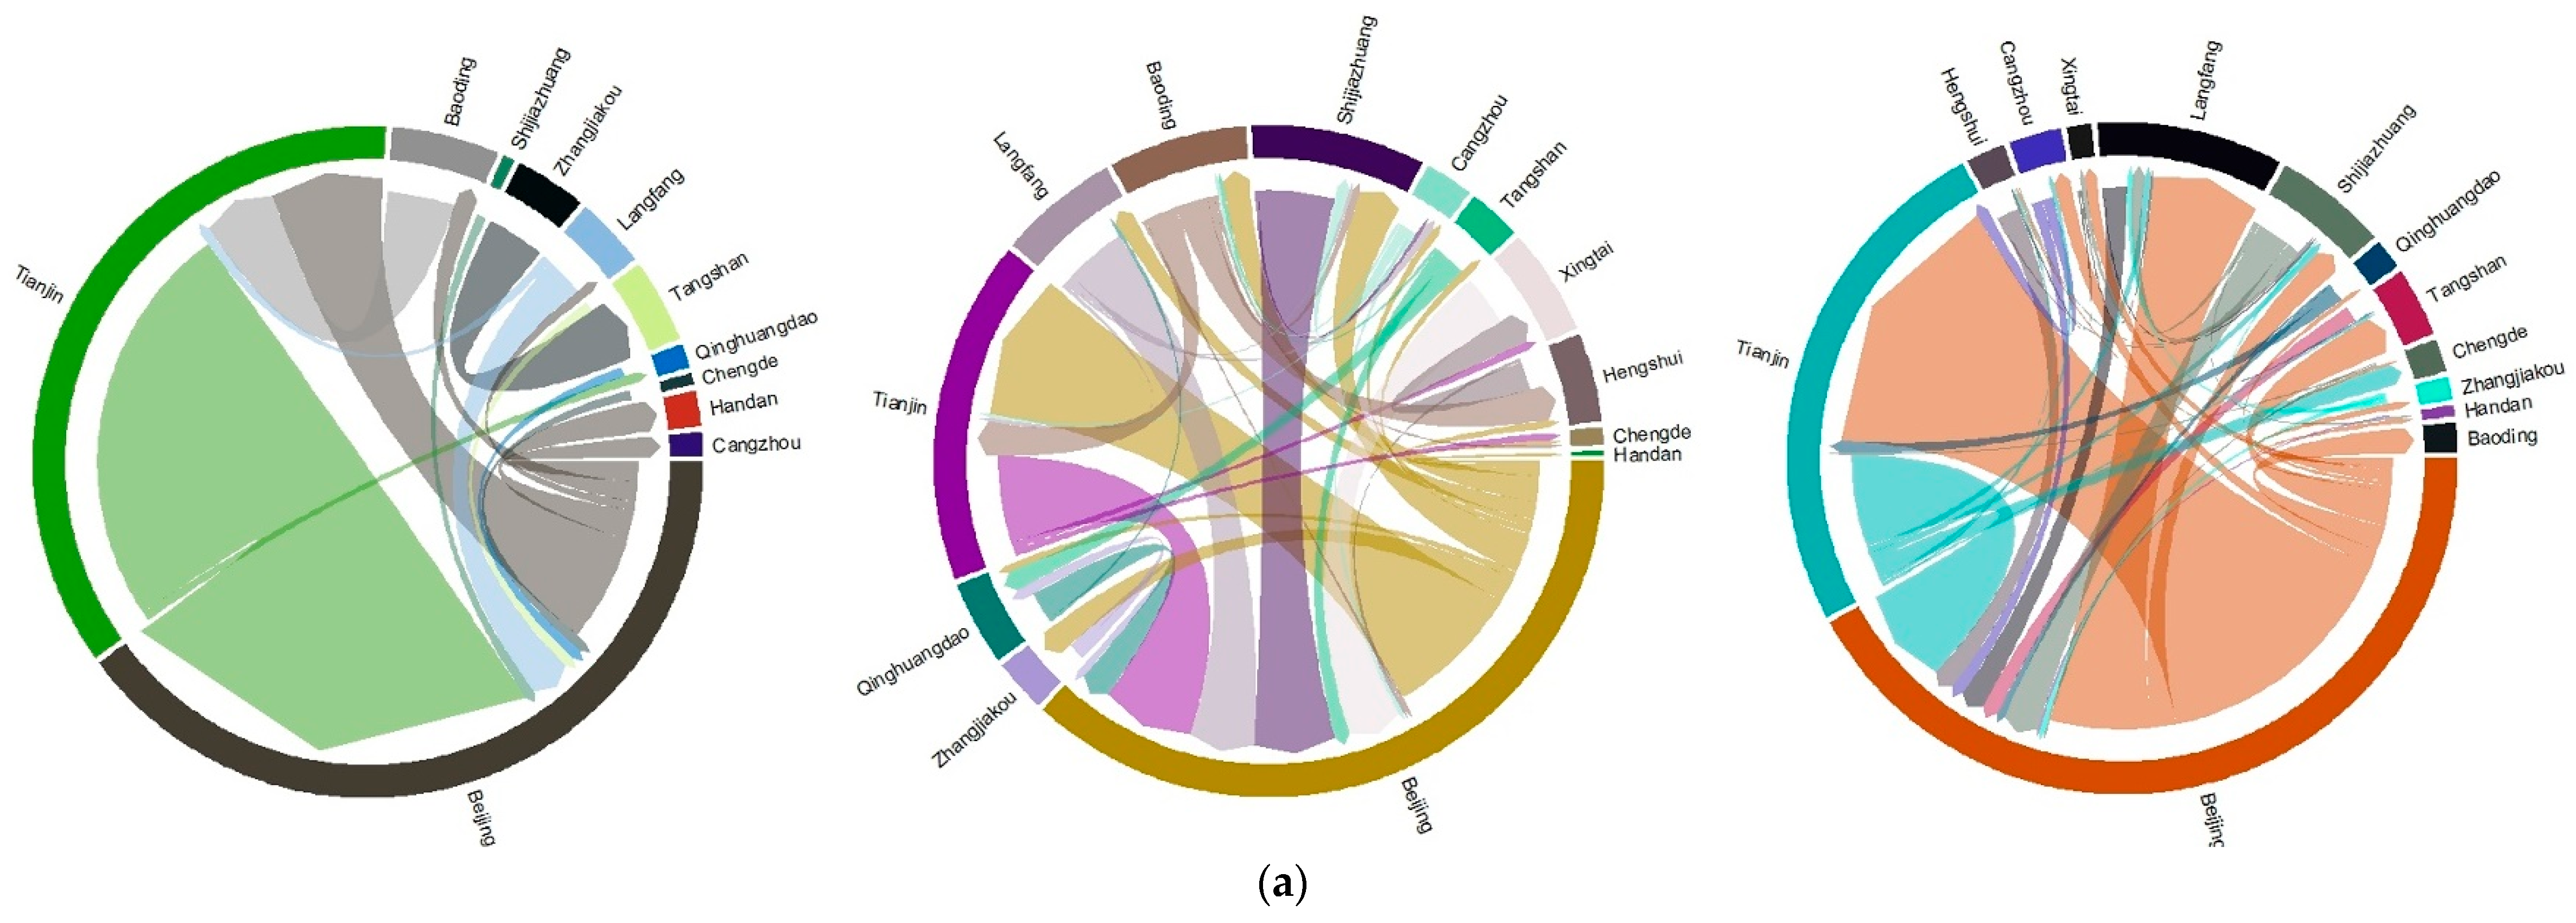
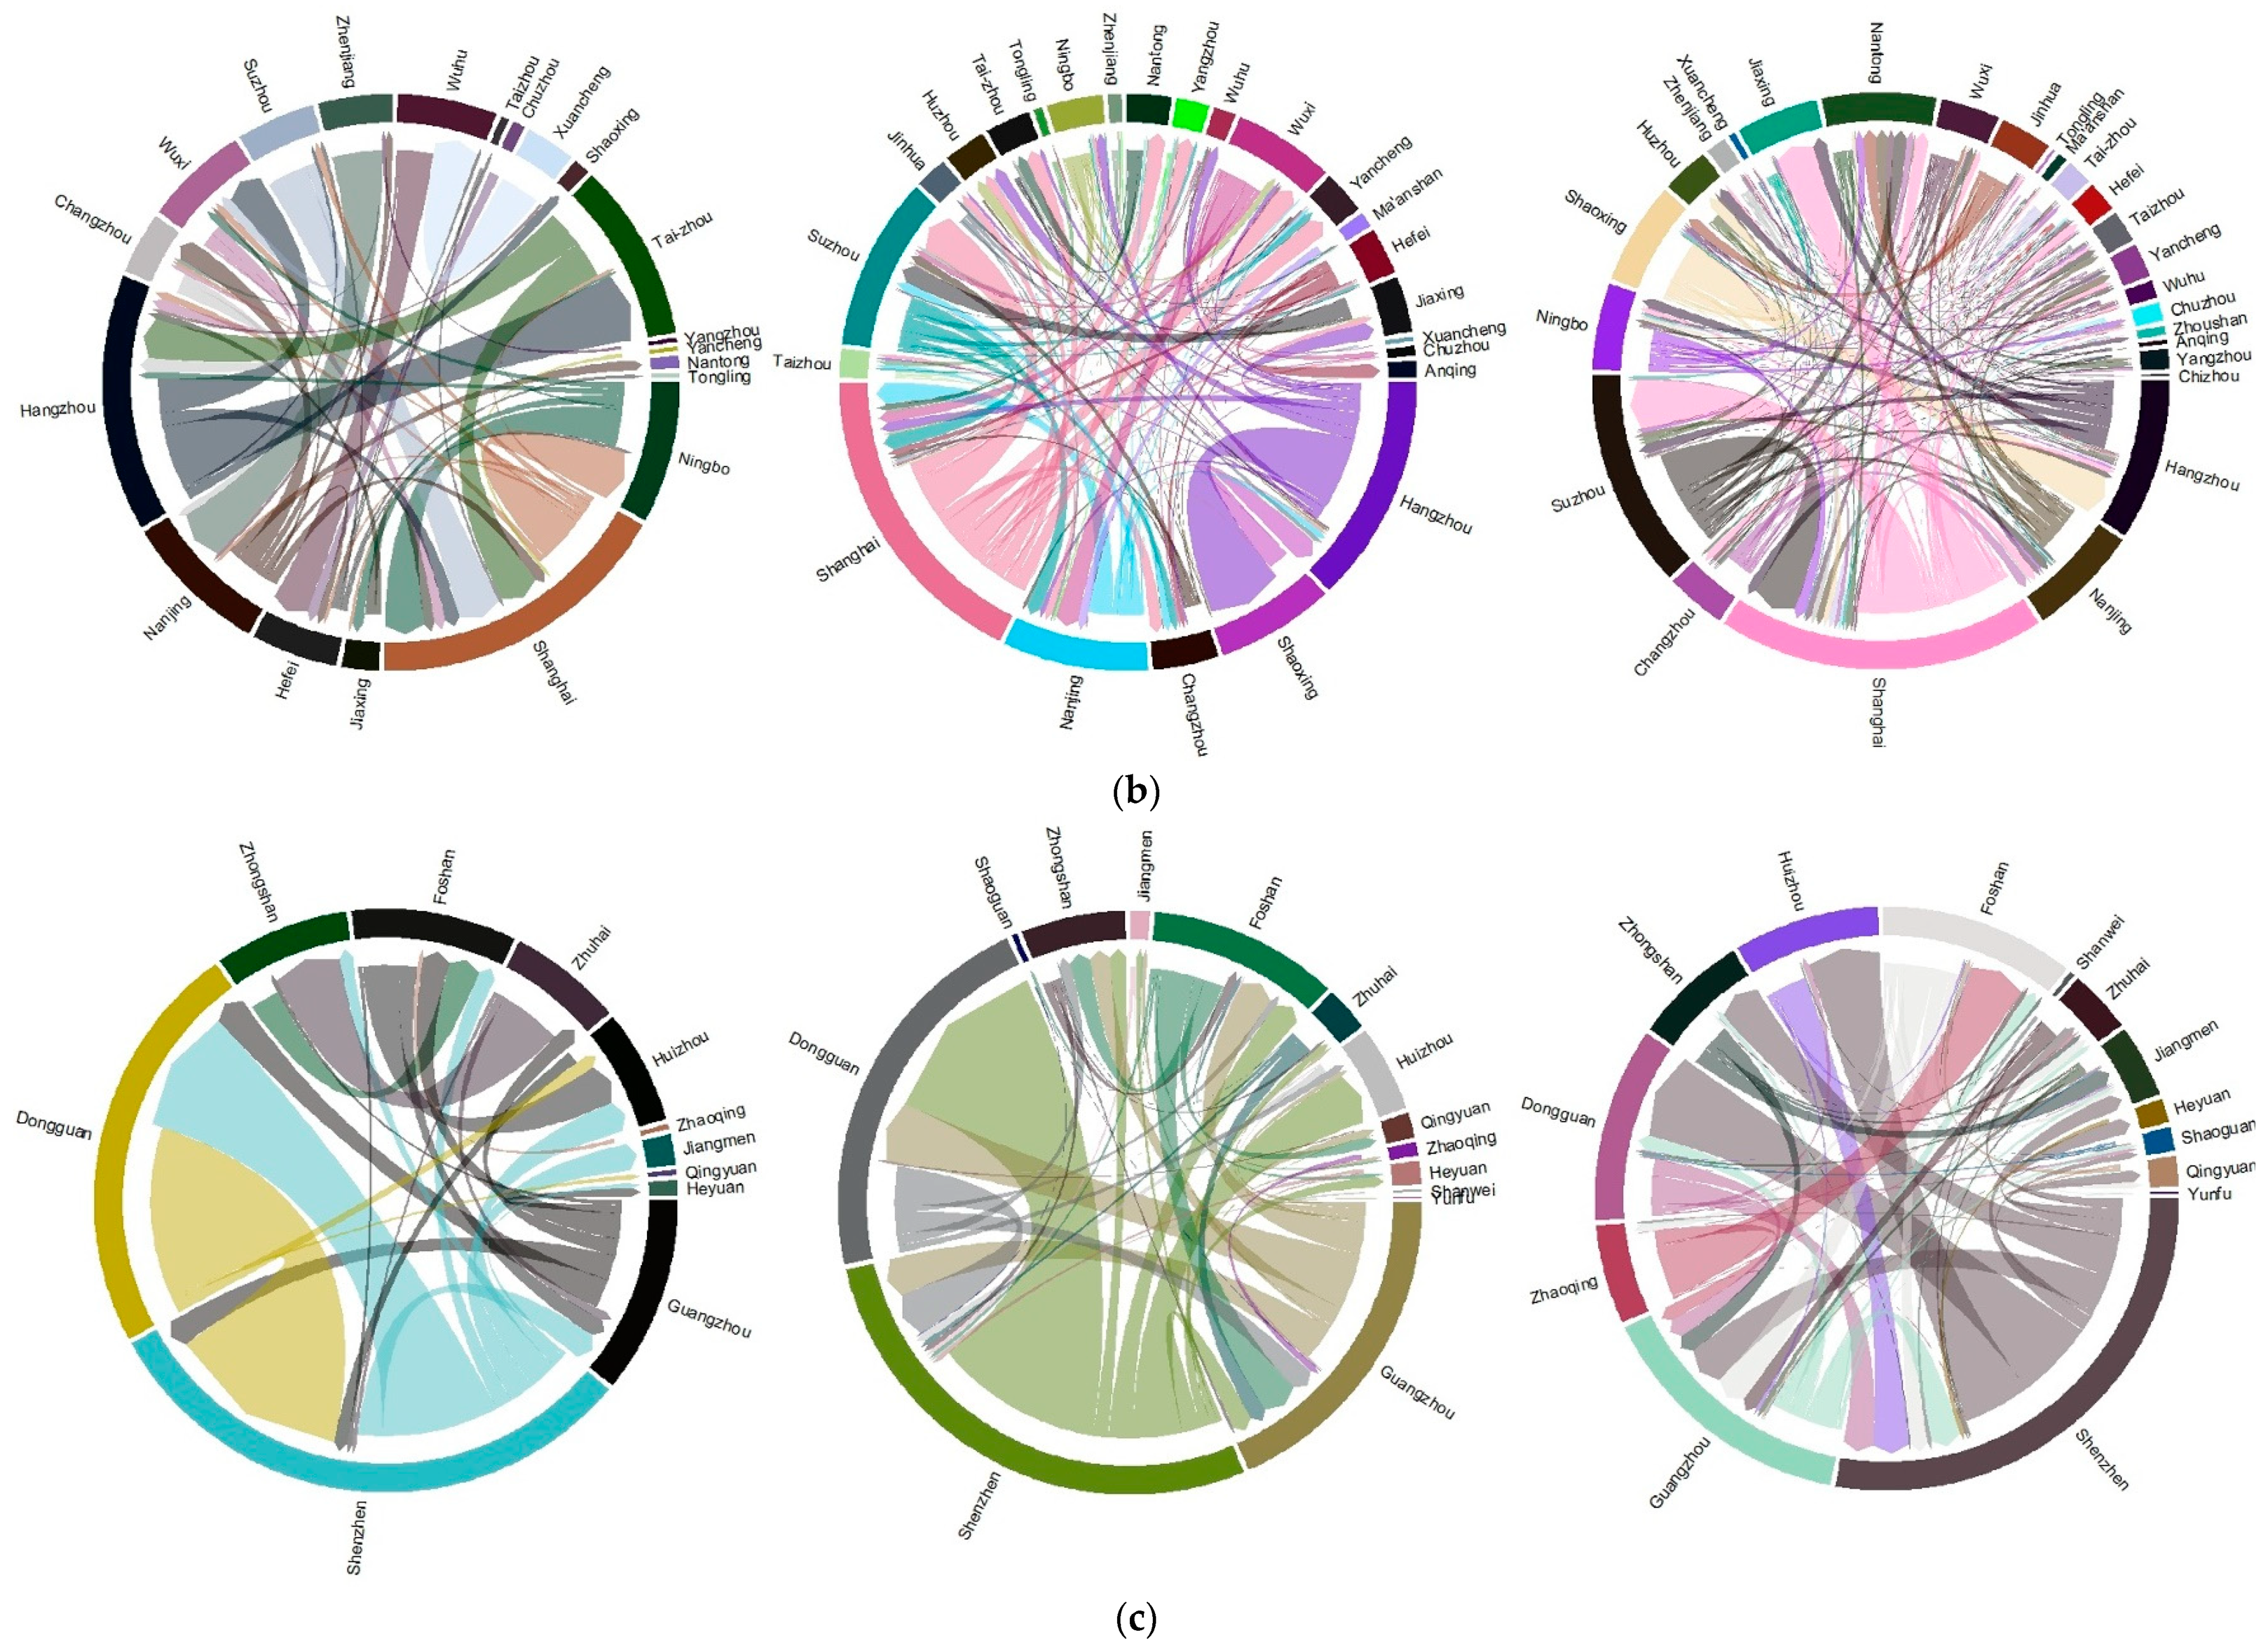
Figure 5a–c display the evolution and structure of intercity technology transfer networks in the BTH, YRD, and PRD during the study period. The technology transfer networks were visualized in ArcGIS 10.3 by employing linkage data between the source and destination city. The width and direction of the link represented the number of trades from origin to destination. The weighted connections were divided into four grades using natural breaks classification. The chord diagram plot is a useful instrument to investigate the bilateral flows by identifying the source, destination, direction, and volume [71,72,73]. Thus, a chord diagram plot was used to visualize intercity technology transfer flows with the help of the circlize package in R [74]. The chord diagram plots present the direction and volume of the flows within the three major urban agglomerations from 2008 to 2015 (Figure 6, also see in Table A3 of Appendix A).
Generally, the structural characteristics of technology transfer networks from a patent transaction perspective featured some similarities. The technology transfer connections among cities continued to grow over time, resulting in increased network density. This implies that the cities within the urban agglomerations became more densely connected. Moreover, the strength of technology transfer linkages increased during the study period. This is not surprising as the Chinese government emphasized the importance of trans-regional technology transfers and issued policies to promote and support technology flows in the marketplace.
The spatial distribution of intercity technology flows was found to be unbalanced, which resulted in the emergence of a hierarchy of linkages. An analysis of the spatial flow patterns revealed that there was significant technology diffusion within the urban agglomerations. Technology diffusion was mainly focused on neighborhood and hierarchy diffusion, with major cities as the source. For instance, Shijiazhuang and Langfang emerged as third-tier cities in 2015 as a result of the effects of hierarchical diffusion (jump diffusion) and contagious diffusion (neighboring diffusion). Similarly, neighboring and hierarchical diffusions were also present in the YRD. Nanjing was observed to remain in the secondary tier as a result of the effects of hierarchical diffusion, while its surrounding cities had lower WD values. Conversely, Nantong was observed to climb the network hierarchy as a result of the influence of neighboring diffusion. Neighboring diffusion was also apparent in the PRD, similar to the geographical proximity effect. For example, Dongguan and Huizhou gained considerable technological innovations from Shenzhen and had the largest weight values in 2015 (Figure 6). Furthermore, there was a significant path-dependence effect due to the embeddedness found in the technology transfer networks [75]. For instance, a lock-in effect was found in the intercity technology flows in the BTH, which was mainly concentrated between Beijing and Tianjin, as well as in Langfang and Shijiazhuang (Figure 6a). The strength of connections among the three fixed city-dyads (between Beijing and the above-mentioned three cities) accounted for more than 50% of all connections during the study period. The locking effect also existed in the YRD and PRD, as indicated by the sustainable growth of the weight value for Shanghai–Suzhou and Shaoxing–Hangzhou from 2008 to 2015 (Figure 6b and Table A3). The strength of connections between Shenzhen–Dongguan, Shenzhen–Guangzhou, and Shenzhen–Huizhou also intensified over time in the PRD (Figure 6c). This indicated that the dynamic evolution of technology transfer networks followed the retention mechanism of place dependence and maintained notable spatiotemporal inertia. In other words, the connections among fixed city-dyads maintained strong self-reinforcement. However, it is worth noting that the path breaking effect was also significant in the YRD and PRD. This suggests that there was a variation mechanism that generated new technology transfer paths in the intercity technology transfer networks. There was a sudden emergence of city-dyads, such as Shanghai–Jiaxing, Nanjing–Nantong, Jinhua–Nantong, Shaoxing–Huzhou, and Jinhua–Shaoxing in the YRD during the study period (Figure 6b). There were also new paths in the PRD, such as in Guangzhou–Huizhou, Guangzhou–Jiangmen, and Foshan–Jiangmen. Additionally, there were new linkages between peripheral and leading cities during the considered period (Figure 6c). These links expanded to new growth frameworks in technology transfer networks and promoted network connectivity.
In the BTH, Beijing possessed an overwhelming superiority within the network compared with other cities (Figure 5a). Beijing was located at the center of the network in 2008 and was surrounded by other cities, forming a star network. This network was continuously extended over time, and featured an increase in the number of connections. The star network gradually evolved into a tree network that was centralized in Beijing in 2015. The technology transfer network in the BTH maintained a monocentric structure that was based on dynamic connections. The linkages between Beijing and Tianjin were always at the top of the hierarchy for all linkages among other city-dyads. The two cities had more technology-intensive enterprises with a greater capacity for technology transformation and application. Thus, Beijing and Tianjin had the most active technology transfers in the region. However, there was a large economic gap between Hebei Province and the two mega cities. It is theorized that cities within the province may have had a lesser technology absorption from other cities because of Hebei’s lack of industrial development. However, regions can promote technological demand by upgrading urban industrial structures. Thus, there is a need for the cities within Hebei Province to absorb technology to enable enterprise development. On the basis of these results, we can conclude that technology transfer is a result of not only the technological gap between cities, but also the active demand of enterprises.
Figure 5b displays the spatial patterns for intercity technology flows in the YRD. The technology transfer network in the YRD evolved from a monocentric structure centered on Shanghai to a polycentric structure during the 2008–2015 period. In 2008, Shanghai was overwhelmingly dominant compared with other cities. In 2015, Shanghai, Suzhou, Nanjing, and Ningbo were situated at the top of the network hierarchy. The tree structure in the YRD demonstrated a complex net-like structure, which indicated that most cities were positively joined to the technology transfer network. There may have been technology transactions even among small cities in the YRD. Conversely, technology transfers with small cities in the BTH were limited to Beijing. Furthermore, most intercity links were mainly generated by the cities in the eastern part of the region. In contrast, there was less connectivity and lower weight values for cities in the western part of the region. Most of the cities with the lowest urban degree tiers were located in Anhui Province. This was expected as the cities in Anhui had a weaker connection with other cities in the YRD.
The technology transfer network in the PRD was observed to evolve from a simple tree network to a multi-star structure network centered on Shenzhen and Guangzhou, followed by Foshan (Figure 5c). The linkages in the network increased and strengthened during the 2008–2015 period. Shenzhen possessed the largest number of strength transfer links with other cities within the PRD. Dongguan, rather than Guangzhou, had the largest number of links with Shenzhen during the study period. This was unexpected as Guangzhou had an essential position in the PRD. However, this also explained why Dongguan had a higher weighted degree than urban degree. The connection between Shenzhen and Huizhou was upgraded to the top of the hierarchy in 2015. There are several possible explanations for this phenomenon. One reason is that Shenzhen has become China’s innovation capital. The data show that there are more than 30,000 high-tech enterprises in Shenzhen, forming a strong group of ladder-type innovation enterprises. Moreover, 46 invention patents are produced daily on average. The city has been praised by international media as China’s “Silicon Valley”. Another reason is that the cities of Dongguan and Huizhou are located next to Shenzhen and are likely to be influenced by the neighborhood diffusion of technology. Meanwhile, Shenzhen’s external technology transfer is accompanied by an industrial transfer to neighboring cities. Neighboring cities such as Dongguan and Huizhou were provided an opportunity for economic development. Industrial transfer has been observed to occur in Shenzhen’s traditional manufacturing and high-tech industrial areas. Additionally, improvements in transportation have enabled technology transfers from Shenzhen to Dongguan and Huizhou. Foshan also occupies an important position in the network, and the city has a strong connection to Guangzhou. Urban integration has also promoted technology transfer between these two cities.
3.4. Potential Determinants of the Strength of Intercity Patent Transfer
Table 3 presents the results of the regression, in which the dependent variable is the number of intercity patent transactions in 2015. Generally, the results confirmed that geographical distance and technological gap matter for technology transfer in urban agglomerations. Moreover, the economic gap and the key cities also affect the strength of intercity patent transfers.
First, we tested the effect of the control variables. In Model 1, the region variable coefficient is non-significant, which shows that the effect of the region on technology transfer is not significant. Thus, the data of three urban agglomerations can be analyzed together. In Model 2, the coefficients of the economic gap and key city output are significant at the p < 0.001 level, with a negative effect, which indicates the larger economic gap between cities is not beneficial to their technology transfer. The key city output has a positive sign, which demonstrates that key cities are promoting external technology flows. The coefficient of geographical distance is negative and significant at p < 0.001 in Models 3–6, further indicating that, owing to spatial proximity, intercity technology transfer tends to diffuse to cities with close distances, confirming the neighborhood diffusion effect of technology transfer within urban agglomerations [24,27]. The effect of industrial structure similarity is non-significant in Models 5 and 6, which might be because competition will inhibit the transfer of patents if the industrial structure between cities is very similar. It is also possible that the industrial structure between cities is similar, providing learning opportunities, which promotes the transfer of patents. Thus, the effect of industrial similarity is non-significant. The indicator of a technology gap is significant and positive in Models 3, 4, and 6, which means that an appropriate technology gap may promote intercity technology transfer, a finding consistent with technology gap theory [66]. When we only add the key city output as the control variable, the coefficient of geographical distance is non-significant. This indicates that the effect of the technology gap does not equate to “the bigger the better”. If the technology gap between key cities and the destination cities is too large, technology transfer may not occur. Generally speaking, the technological absorptive capacity of developed cities is stronger than that of undeveloped cities. The coefficient of absorptive capacity is non-significant in Models 3–6, which may be because cities with good absorptive capacity are more likely to accept new and difficulty technology, while cities with weak absorptive capacity also need to introduce ordinary technology to advance their development.
4. Conclusions
Urban innovation networks have emerged as an important topic in economic and innovation geography. In this paper, we explored intercity technology transfer networks from a patent transaction perspective within three major urban agglomerations in China using intercity patent right transaction data. We compared the construction method for existent undirected innovation networks, and constructed a directed and weighted intercity innovation network. The network surpassed previous limitations using market technology transactions. This paper also helped reveal the evolution of urban innovation networks and the spatial patterns of urban agglomerations.
The results revealed that Beijing, Shanghai, and Shenzhen were observed to hold the dominant position in technology transfer networks within their three respective urban agglomerations. The three cities were identified as having the strongest innovation capacity. The networks in the YRD and PRD were discovered to be more integrated compared with networks in the BTH. This finding was consistent with the inter-firm network concept by Pan et al. (2017) [61]. Moreover, the network position of the city is related to its economy, R&D investment, and self-innovation. Shanghai had the highest WD value, followed by Shenzhen and Beijing. The spatial distribution of D and WD was significantly heterogeneous and hierarchical. Cities located at the top of the network hierarchy acted more as technology diffusers than technology absorbers over time. The peripheral cities in the network mostly acted as technology absorbers. This result suggests that innovation transfer has become an important function of the megalopolis.
The technology transfer networks within the three urban agglomerations became more densely connected and technology transfer linkages strengthened over time. There was a significant technology diffusion effect, namely neighborhood and hierarchical diffusion. Moreover, there were also significant path dependence and path breaking effects. This indicates that the dynamic evolution of technology transfer networks followed the retention mechanism of path dependence and the variation mechanism of new path development [10]. Meanwhile, the network also had strong expandability with the emergence of new paths. An analysis of the spatial structure of urban agglomerations revealed that the network in the BTH was a single-core network that transformed from a star network to a tree network. The YRD featured a polycentric network that evolved from a single network centered on Shanghai. The network in the PRD had evolved from a simple tree network to a multi-star structure network centered on Shenzhen and Guangzhou, followed by Foshan. Furthermore, we explored the determinants of intercity technology transfer, finding that geographical proximity and technology gaps have a significant influence on the patent transaction volume of city-pairs.
Although this paper has generated some insights into urban innovation networks within urban agglomerations, it should be noted that there are some limitations in the study. These questions deserve our further investigation. First, is the absence of inter-agglomeration technology transfers. We only considered intra-agglomeration technology connections. Therefore, future research should focus on intercity technology transfers both within and among urban agglomerations. Second, aside from patent right transactions, technology transfer can be detected by other ways such as license transactions, strategic alliances, technology consulting services, and industry–university–research cooperation. Additionally, patent citation and licensing could be taken into account. Third, on the basis of the limits of cross-sectional data, a spatial panel regression analysis is appropriate for dynamic determinants of intercity technology transfer.
Author Contributions
C.L. developed the original idea of this study, revised the manuscript and supervised the research project. C.N. performed the data analysis and original draft preparation under the supervision of the corresponding authors. J.H. directed research comments and provided quality assurance. All authors read and approved the final manuscript.
Funding
This research was funded by the National Natural Science Foundation of China PRC, grant number 41571123, the Shanghai Pujiang Program, grant number 17PJC030, and the Strategic Priority Research Program of the Chinese Academy of Sciences, grant number XDA20100311.
Acknowledgments
The authors are thankful to Mingming Guan and Qinchang Gui for their data preparations and visualizations.
Conflicts of Interest
The authors declare no conflict of interest.
Appendix A

Table A1.
Urban hierarchical system of three major urban agglomerations (BTH, YRD, and PRD; pop: million).
Table A1.
Urban hierarchical system of three major urban agglomerations (BTH, YRD, and PRD; pop: million).
| Regions | BTH | YRD | PRD |
|---|---|---|---|
| Municipality | Beijing (Capital 13.63) Tianjin (10.44) | Shanghai (14.50) | |
| Provincial capital | Shijiazhuang (10.38) | Nanjing (6.63)/Hangzhou (7.36)/Hefei (7.30) | Guangzhou (8.70) |
| Vice-provincial city | Ningbo (5.91) | Shenzhen (3.85) | |
| Prefecture level city | Xingtai (7.88) Baoding (1.207) Hengshui (4.55) Cangzhou (7.80) Langfang (4.70) Zhangjiakou (4.70) Tangshan (7.60) Handan (10.55) Qinghuangdao (2.98) | Nantong (7.67)/Shaoxing (4.45) Suzhou (6.78)/Yancheng (8.31) Jiaxing (3.52)/Xuancheng (2.80) Ma’anshan (2.29)/Huzhou (2.65) Changzhou (3.75)/Wuxi (4.86) Chuzhou (4.54)/Zhoushan (9.70) Taizhou (6.00)/Yangzhou (4.62) Tongling (1.71)/Anqing (5.29) Zhenjiang (2.72)/Wuhu (3.88) Jinhua (4.81)/Chizhou (1.62)/Taizhou (5.08) | Dongguan (2.01)/Zhuhai (1.15) Jiangmen (3.94)/Huizhou (3.64) Qingyuan (4.32)/Yunfu (3.01) Zhaoqing (4.44)/Heyuan (3.73) Zhongshan (1.61)/Foshan (4.00) Shaoguan (3.34)/Shanwei (3.62) |
Table A2.
Correlation analysis between centrality and influencing variables.
| Pearson Correlation | GDP | Input | Output | |
|---|---|---|---|---|
| DC | 0.796 ** | 0.695 ** | 0.815 ** | |
| Sig. (two-tailed) | 0.000 | 0.000 | 0.000 | |
| BC | 0.441 ** | 0.863 ** | 0.727 ** | |
| Sig. (two-tailed) | 0.001 | 0.000 | 0.000 |
Notes: The three influencing variables are measured by per capita gross domestic product (GDP), research and development (R&D) investment amount, and the number of patent grants. Source: China Urban Statistics Yearbook and State Intellectual Property Office. ** Correlation is significant at the 0.01 level (two-tailed). DC—degree centrality; BC—betweenness centrality.
Table A3.
Top five pairs of intercity technology transfer connections in three major urban agglomerations in 2008, 2012, and 2015.
Table A3.
Top five pairs of intercity technology transfer connections in three major urban agglomerations in 2008, 2012, and 2015.
| Regions | Beijing–Tianjin–Hebei | Yangtze River Delta | Pearl River Delta | ||||||
|---|---|---|---|---|---|---|---|---|---|
| From | To | Weight | From | To | Weight | From | To | Weight | |
| 2008 | Tianjin | Beijing | 42 | Hangzhou | Taizhou | 19 | Dongguan | Shenzhen | 41 |
| Beijing | Tianjin | 11 | Shanghai | Ningbo | 14 | Shenzhen | Dongguan | 28 | |
| Baoding | Tianjin | 7 | Zhenjiang | Nanjing | 14 | Zhuhai | Zhongshan | 15 | |
| Zhangjiakou | Tangshan | 6 | Suzhou | Shanghai | 12 | Foshan | Huizhou | 9 | |
| Langfang | Beijing | 4 | Xuancheng | Wuhu | 12 | Guangzhou | Dongguan | 7 | |
| 2012 | Beijing | Tianjin | 38 | Hangzhou | Shaoxing | 97 | Shenzhen | Dongguan | 184 |
| Tianjin | Beijing | 24 | Shanghai | Suzhou | 52 | Guangzhou | Dongguan | 62 | |
| Shijiazhuang | Beijing | 21 | Shaoxing | Hangzhou | 30 | Shenzhen | Huizhou | 53 | |
| Langfang | Beijing | 17 | Wuxi | Nanjing | 29 | Dongguan | Shenzhen | 44 | |
| Xingtai | Beijing | 14 | Nanjing | Shanghai | 27 | Guangzhou | Shenzhen | 39 | |
| 2015 | Beijing | Tianjin | 115 | Shanghai | Suzhou | 166 | Shenzhen | Dongguan | 128 |
| Beijing | Langfang | 45 | Suzhou | Shanghai | 148 | Shenzhen | Huizhou | 108 | |
| Tianjin | Beijing | 41 | Shaoxing | Hangzhou | 135 | Zhaoqing | Foshan | 82 | |
| Beijing | Tangshan | 16 | Shanghai | Jiaxing | 134 | Shenzhen | Zhongshan | 64 | |
| Shijiazhuang | Beijing | 15 | Hangzhou | Jiaxing | 46 | Shenzhen | Guangzhou | 60 | |
References
- Sorenson, O.; Rivkin, J.W.; Fleming, L. Complexity, networks and knowledge flow. Res. Policy 2006, 35, 994–1017. [Google Scholar] [CrossRef] [Green Version]
- Van Egeraat, C.; Kogler, D.F. Global and regional dynamics in knowledge flows and innovation networks. Eur. Plan. Stud. 2013, 21, 1317–1322. [Google Scholar] [CrossRef]
- Krätke, S. Regional knowledge networks: A network analysis approach to the interlinking of knowledge resources. Eur. Urban Reg. Stud. 2010, 17, 83–97. [Google Scholar] [CrossRef]
- Romer, P.M. Endogenous technological change. J. Polit. Econ. 1990, 98, S71–S102. [Google Scholar] [CrossRef]
- Teece, D.J. Technology transfer by multinational firms: The resource cost of transferring technological know-how. Econ. J. 1977, 87, 242–261. [Google Scholar] [CrossRef]
- Ferraro, G.; Iovanella, A. Technology transfer in innovation networks: An empirical study of the enterprise Europe network. Int. J. Eng. Bus. Manag. 2017, 9, 1847979017735748. [Google Scholar] [CrossRef]
- Freeman, C. Networks of innovators: A synthesis of research issues. Res. Policy 1991, 20, 499–514. [Google Scholar] [CrossRef]
- Grimaldi, M.; Hanandi, M. Evaluating the intellectual capital of technology transfer and learning public services. Int. J. Eng. Bus. Manag. 2013, 5, 5–7. [Google Scholar] [CrossRef]
- Katz, J.S. Geographical proximity and scientific collaboration. Scientometrics 1994, 31, 31–43. [Google Scholar] [CrossRef]
- Glückler, J. Economic geography and the evolution of networks. J. Econ. Geogr. 2007, 7, 619–634. [Google Scholar] [CrossRef]
- Chen, Z.; Guan, J. Mapping of biotechnology patents of China from 1995–2008. Scientometrics 2011, 88, 73–89. [Google Scholar] [CrossRef]
- Gao, X.; Guan, J.; Rousseau, R. Mapping collaborative knowledge production in China using patent co-inventorships. Scientometrics 2011, 88, 343–362. [Google Scholar] [CrossRef]
- Grillitsch, M.; Nilsson, M. Innovation in peripheral regions: Do collaborations compensate for a lack of local knowledge spillovers? Ann. Reg. Sci. 2015, 54, 299–321. [Google Scholar] [CrossRef] [Green Version]
- Hu, X.; Du, D. Inter-city innovation linkage and its spatial structure in megalopolis: A case study of the Yangtze River Delta, China. In Proceedings of the 2011 19th International Conference on GeoInformatics, Shanghai, China, 24–26 June 2011. [Google Scholar] [CrossRef]
- Yun, J.J.; Jeong, E.; Yang, J. Open innovation of knowledge cities. J. Open Innov. Technol. Mark. Complex. 2015, 1, 16. [Google Scholar] [CrossRef]
- Bell, R. Industrial cites in turnaround. In Proceedings of the Remarks Presented at the Smart Communities Conference, Santa Monica, CA, USA, 22–23 September 1997. [Google Scholar]
- Duranton, G.; Puga, D. Micro-foundations of urban agglomeration economies. In Handbook of Regional and Urban Economics; Elsevier: Amsterdam, The Netherlands, 2004; Volume 4, pp. 2063–2117. ISBN 1574-0080. [Google Scholar]
- Li, Y.; Phelps, N.A. Knowledge polycentricity and the evolving Yangtze River Delta megalopolis. Reg. Stud. 2017, 51, 1035–1047. [Google Scholar] [CrossRef]
- Li, Y.; Phelps, N. Megalopolis unbound: Knowledge collaboration and functional polycentricity within and beyond the Yangtze River Delta Region in China, 2014. Urban Stud. 2018, 55, 443–460. [Google Scholar] [CrossRef]
- Chen, H.; Xie, F. How technological proximity affect collaborative innovation? An empirical study of China’s Beijing–Tianjin–Hebei region. J. Manag. Anal. 2018, 5, 287–308. [Google Scholar] [CrossRef]
- Amin, A.; Wilkinson, F. Learning, proximity and industrial performance: An introduction. Camb. J. Econ. 1999, 23, 121–125. [Google Scholar] [CrossRef]
- Gui, Q.; Liu, C.; Du, D. International knowledge flows and the role of proximity. Growth Chang. 2018, 49, 532–547. [Google Scholar] [CrossRef]
- Boschma, R.A. Proximity and innovation: A critical assessment. Reg. Stud. 2005, 39, 61–74. [Google Scholar] [CrossRef]
- Hoekman, J.; Frenken, K.; van Oort, F. The geography of collaborative knowledge production in Europe. Ann. Reg. Sci. 2009, 43, 721–738. [Google Scholar] [CrossRef]
- Ma, H.; Fang, C.; Pang, B.; Li, G. The effect of geographical proximity on scientific cooperation among Chinese cities from 1990 to 2010. PLoS ONE 2014, 9, e111705. [Google Scholar] [CrossRef]
- Crescenzi, R.; Nathan, M.; Rodríguez-Pose, A. Do inventors talk to strangers? On proximity and collaborative knowledge creation. Res. Policy 2016, 45, 177–194. [Google Scholar] [CrossRef] [Green Version]
- Marek, P.; Titze, M.; Fuhrmeister, C.; Blum, U. R&D collaborations and the role of proximity. Reg. Stud. 2017, 51, 1761–1773. [Google Scholar] [CrossRef]
- Hoekman, J.; Frenken, K.; Tijssen, R.J.W. Research collaboration at a distance: Changing spatial patterns of scientific collaboration within Europe. Res. Policy 2010, 39, 662–673. [Google Scholar] [CrossRef]
- Elkan, R. Catching up and slowing down: Learning and growth patterns in an open economy. J. Int. Econ. 1996, 41, 95–111. [Google Scholar] [CrossRef]
- Cohen, W.M.; Levinthal, D.A. Absorptive capacity: A new perspective on learning and innovation. Adm. Sci. Q. 1990, 35, 128–152. [Google Scholar] [CrossRef]
- Tsai, K.H.; Wang, J.C. External technology sourcing and innovation performance in LMT sectors: An analysis based on the Taiwanese technological innovation survey. Res. Policy 2009, 38, 518–526. [Google Scholar] [CrossRef]
- Huggins, R.; Prokop, D. Network structure and regional innovation: A study of university–industry ties. Urban Stud. 2017, 54, 931–952. [Google Scholar] [CrossRef]
- Kill, C.; Torossian, A.; Freisburger, C.; Dworok, S.; Massmann, M.; Nohl, T.; Henning, R.; Wallot, P.; Gockel, A.; Steinfeldt, T. Basic life support with four different compression/ventilation ratios in a pig model: The need for ventilation. Resuscitation 2008, 77, 1060–1065. [Google Scholar] [CrossRef]
- Gui, Q.; Liu, C.; Du, D. Does network position foster knowledge production? Evidence from international scientific collaboration network. Growth Chang. 2018, 49, 594–611. [Google Scholar] [CrossRef]
- Yun, J.H.J.; Jeong, E.S.; Park, J.S. Network analysis of open innovation. Sustainability 2016, 8, 729. [Google Scholar] [CrossRef]
- De Araújo, I.F.; Gonçalves, E.; Taveira, J.G. The Role of Patent Co-Inventorship Networks in Regional Inventive Performance. Int. Reg. Sci. Rev. 2018, 0160017618770. [Google Scholar] [CrossRef]
- Tseng, C.-Y.; Lin, S.-C.; Pai, D.-C.; Tung, C.-W. The relationship between innovation network and innovation capability: A social network perspective. Technol. Anal. Strateg. Manag. 2016, 28, 1029–1040. [Google Scholar] [CrossRef]
- Capello, R.; Lenzi, C. Territorial Patterns of Innovation and Economic Growth in European Regions. Growth Chang. 2013, 44, 195–227. [Google Scholar] [CrossRef]
- Andersson, D.E.; Gunessee, S.; Matthiessen, C.W.; Find, S. The geography of Chinese science. Environ. Plan. A 2014, 46, 2950–2971. [Google Scholar] [CrossRef]
- Serrano, C.J. The dynamics of the transfer and renewal of patents. RAND J. Econ. 2010, 44, 686–708. [Google Scholar] [CrossRef]
- Gambardella, A.; Giuri, P.; Luzzi, A. The market for patents in Europe. Res. Policy 2007, 36, 1163–1183. [Google Scholar] [CrossRef]
- Burhop, C. The transfer of patents in Imperial Germany. J. Econ. Hist. 2010, 70, 921–939. [Google Scholar] [CrossRef]
- Shen, H.; Huang, C.; Mao, H.; Sharif, N. To License or Sell: A Study on the Patent Transaction Modes in China; Social Science Electronic Publishing: Rochester, NY, USA, 2018; pp. 27–31. [Google Scholar] [CrossRef]
- Caviggioli, F.; Ughetto, E. The drivers of patent transactions: Corporate views on the market for patents. R D Manag. 2013, 43, 318–332. [Google Scholar] [CrossRef]
- Galasso, A.; Schankerman, M. Trading and enforcing patent rights.pdf. J. Econ. 2014, 44, 275–312. [Google Scholar]
- Akcigit, U.; Celik, M.; Greenwood, J. Buy, Keep or sell: Economic growth and the market for ideas. Econometrica 2013, 84, 943–984. [Google Scholar] [CrossRef]
- Sánchez-Sellero, P.; Rosell-Martínez, J.; García-Vázquez, J.M. Absorptive capacity from foreign direct investment in Spanish manufacturing firms. Int. Bus. Rev. 2014, 23, 429–439. [Google Scholar] [CrossRef] [Green Version]
- Marrocu, E.; Paci, R.; Usai, S. Proximity, networking and knowledge production in Europe: What lessons for innovation policy? Technol. Forecast. Soc. Chang. 2013, 80, 1484–1498. [Google Scholar] [CrossRef]
- Levinthal, D.A. Economic security for a better world. Indian J. Labour Econ. 2004, 47, 601–607. [Google Scholar] [CrossRef]
- Sun, Y.; Liu, K. Proximity effect, preferential attachment and path dependence in inter-regional network: A case of China’s technology transaction. Scientometrics 2016, 108, 201–220. [Google Scholar] [CrossRef]
- Song, J.-D. Agglomeration economies of China’s three major urban agglomerations, 1994–2008. Int. Area Stud. Rev. 2010, 13, 25–58. [Google Scholar] [CrossRef]
- Jaffe, A.B.; Trajtenberg, M.; Henderson, R. Geographic localization of knowledge spillovers as evidenced by patent citations. Q. J. Econ. 1993, 108, 577–598. [Google Scholar] [CrossRef]
- Maurseth, P.B.; Verspagen, B. Knowledge spillovers in Europe: A patent citations analysis. Scand. J. Econ. 2002, 104, 531–545. [Google Scholar] [CrossRef]
- De Marco, A.; Scellato, G.; Ughetto, E.; Caviggioli, F. Global markets for technology: Evidence from patent transactions. Res. Policy 2017, 46, 1644–1654. [Google Scholar] [CrossRef]
- Fischer, T.; Henkel, J. Patent trolls on markets for technology—An empirical analysis of NPEs’ patent acquisitions. Res. Policy 2012, 41, 1519–1533. [Google Scholar] [CrossRef]
- Scott, J.; Carrington, P.J. The SAGE Handbook of Social Network Analysis; SAGE Publications: Thousand Oaks, CA, USA, 2011; ISBN 1847873952. [Google Scholar]
- Liu, C.; Wang, J.; Zhang, H. Spatial heterogeneity of ports in the global maritime network detected by weighted ego network analysis. Marit. Policy Manag. 2018, 45, 89–104. [Google Scholar] [CrossRef]
- Borgatti, S.P. Centrality and network flow. Soc. Netw. 2005, 27, 55–71. [Google Scholar] [CrossRef] [Green Version]
- Freeman, L.C. Centrality in social networks conceptual clarification. Soc. Netw. 1978, 1, 215–239. [Google Scholar] [CrossRef] [Green Version]
- Wasserman, S.; Faust, K. Social Network Analysis: Methods and Applications; Cambridge University Press: Cambridge, UK, 1994; Volume 8, ISBN 0521387078. [Google Scholar]
- Scherngell, T.; Hu, Y. Collaborative knowledge production in China: Regional evidence from a gravity model approach. Reg. Stud. 2011, 45, 755–772. [Google Scholar] [CrossRef]
- Hilbe, J.M. Negative Binomial Regression; Cambridge University Press: Cambridge, UK, 2011; ISBN 0521198151. [Google Scholar]
- Cameron, A.C.; Trivedi, P.K. Econometric models based on count data. Comparisons and applications of some estimators and tests. J. Appl. Econom. 1986, 1, 29–53. [Google Scholar] [CrossRef]
- Nepelski, D.; De Prato, G. The structure and evolution of ICT global innovation network. Ind. Innov. 2018, 25, 940–965. [Google Scholar] [CrossRef]
- Sigler, T.J.; Martinus, K. Extending beyond ‘world cities’ in World City Network (WCN) research: Urban positionality and economic linkages through the Australia-based corporate network. Environ. Plan. A 2017, 49, 2916–2937. [Google Scholar] [CrossRef]
- Glass, A.J.; Saggi, K. International technology transfer and the technology gap. J. Dev. Econ. 1998, 55, 369–398. [Google Scholar] [CrossRef]
- National Bureau of Statistics. China City Statistical Yearbook; China Statistics Press: Beijing, China, 2016.
- Barabási, A.-L.; Albert, R. Emergence of scaling in random networks. Science 1999, 286, 509–512. [Google Scholar] [CrossRef]
- Liu, C.; Guan, M.; Duan, D. Spatial pattern and influential mechanism of interurban technology transfer network in China. Acta Geogr. Sin. 2018, 73, 1462–1477. [Google Scholar] [CrossRef]
- Pan, F.; Bi, W.; Lenzer, J.; Zhao, S. Mapping urban networks through inter-firm service relationships: The case of China. Urban Stud. 2017, 54, 3639–3654. [Google Scholar] [CrossRef]
- Qi, W.; Abel, G.J.; Muttarak, R.; Liu, S. Circular visualization of China’s internal migration flows 2010–2015. Environ. Plan. A 2017, 49, 2432–2436. [Google Scholar] [CrossRef] [Green Version]
- Gui, Q.; Liu, C.; Du, D.; Duan, D. The changing geography of global science. Environ. Plan. A 2018. [Google Scholar] [CrossRef]
- Baptista, E.A.; Abel, G.J.; Campos, J. Internal migration in Brazil using circular visualization. Reg. Stud. Reg. Sci. 2018, 5, 361–364. [Google Scholar] [CrossRef]
- Gu, Z.; Gu, L.; Eils, R.; Schlesner, M.; Brors, B. Circlize implements and enhances circular visualization in R. Bioinformatics 2014, 30, 2811–2812. [Google Scholar] [CrossRef]
- Gulati, R.; Gargiulo, M. Where do interorganizational networks come from? Am. J. Sociol. 1999, 104, 1439–1493. [Google Scholar] [CrossRef]
Figure 1.
Study area and location of the Beijing–Tianjin–Hebei (BTH), Yangtze River Delta (YRD), and Pearl River Delta (PRD) urban agglomerations in China.
Figure 1.
Study area and location of the Beijing–Tianjin–Hebei (BTH), Yangtze River Delta (YRD), and Pearl River Delta (PRD) urban agglomerations in China.

Figure 2.
The number of total patent transactions and the intercity transactions in the BTH, YRD, and PRD urban agglomerations.
Figure 2.
The number of total patent transactions and the intercity transactions in the BTH, YRD, and PRD urban agglomerations.
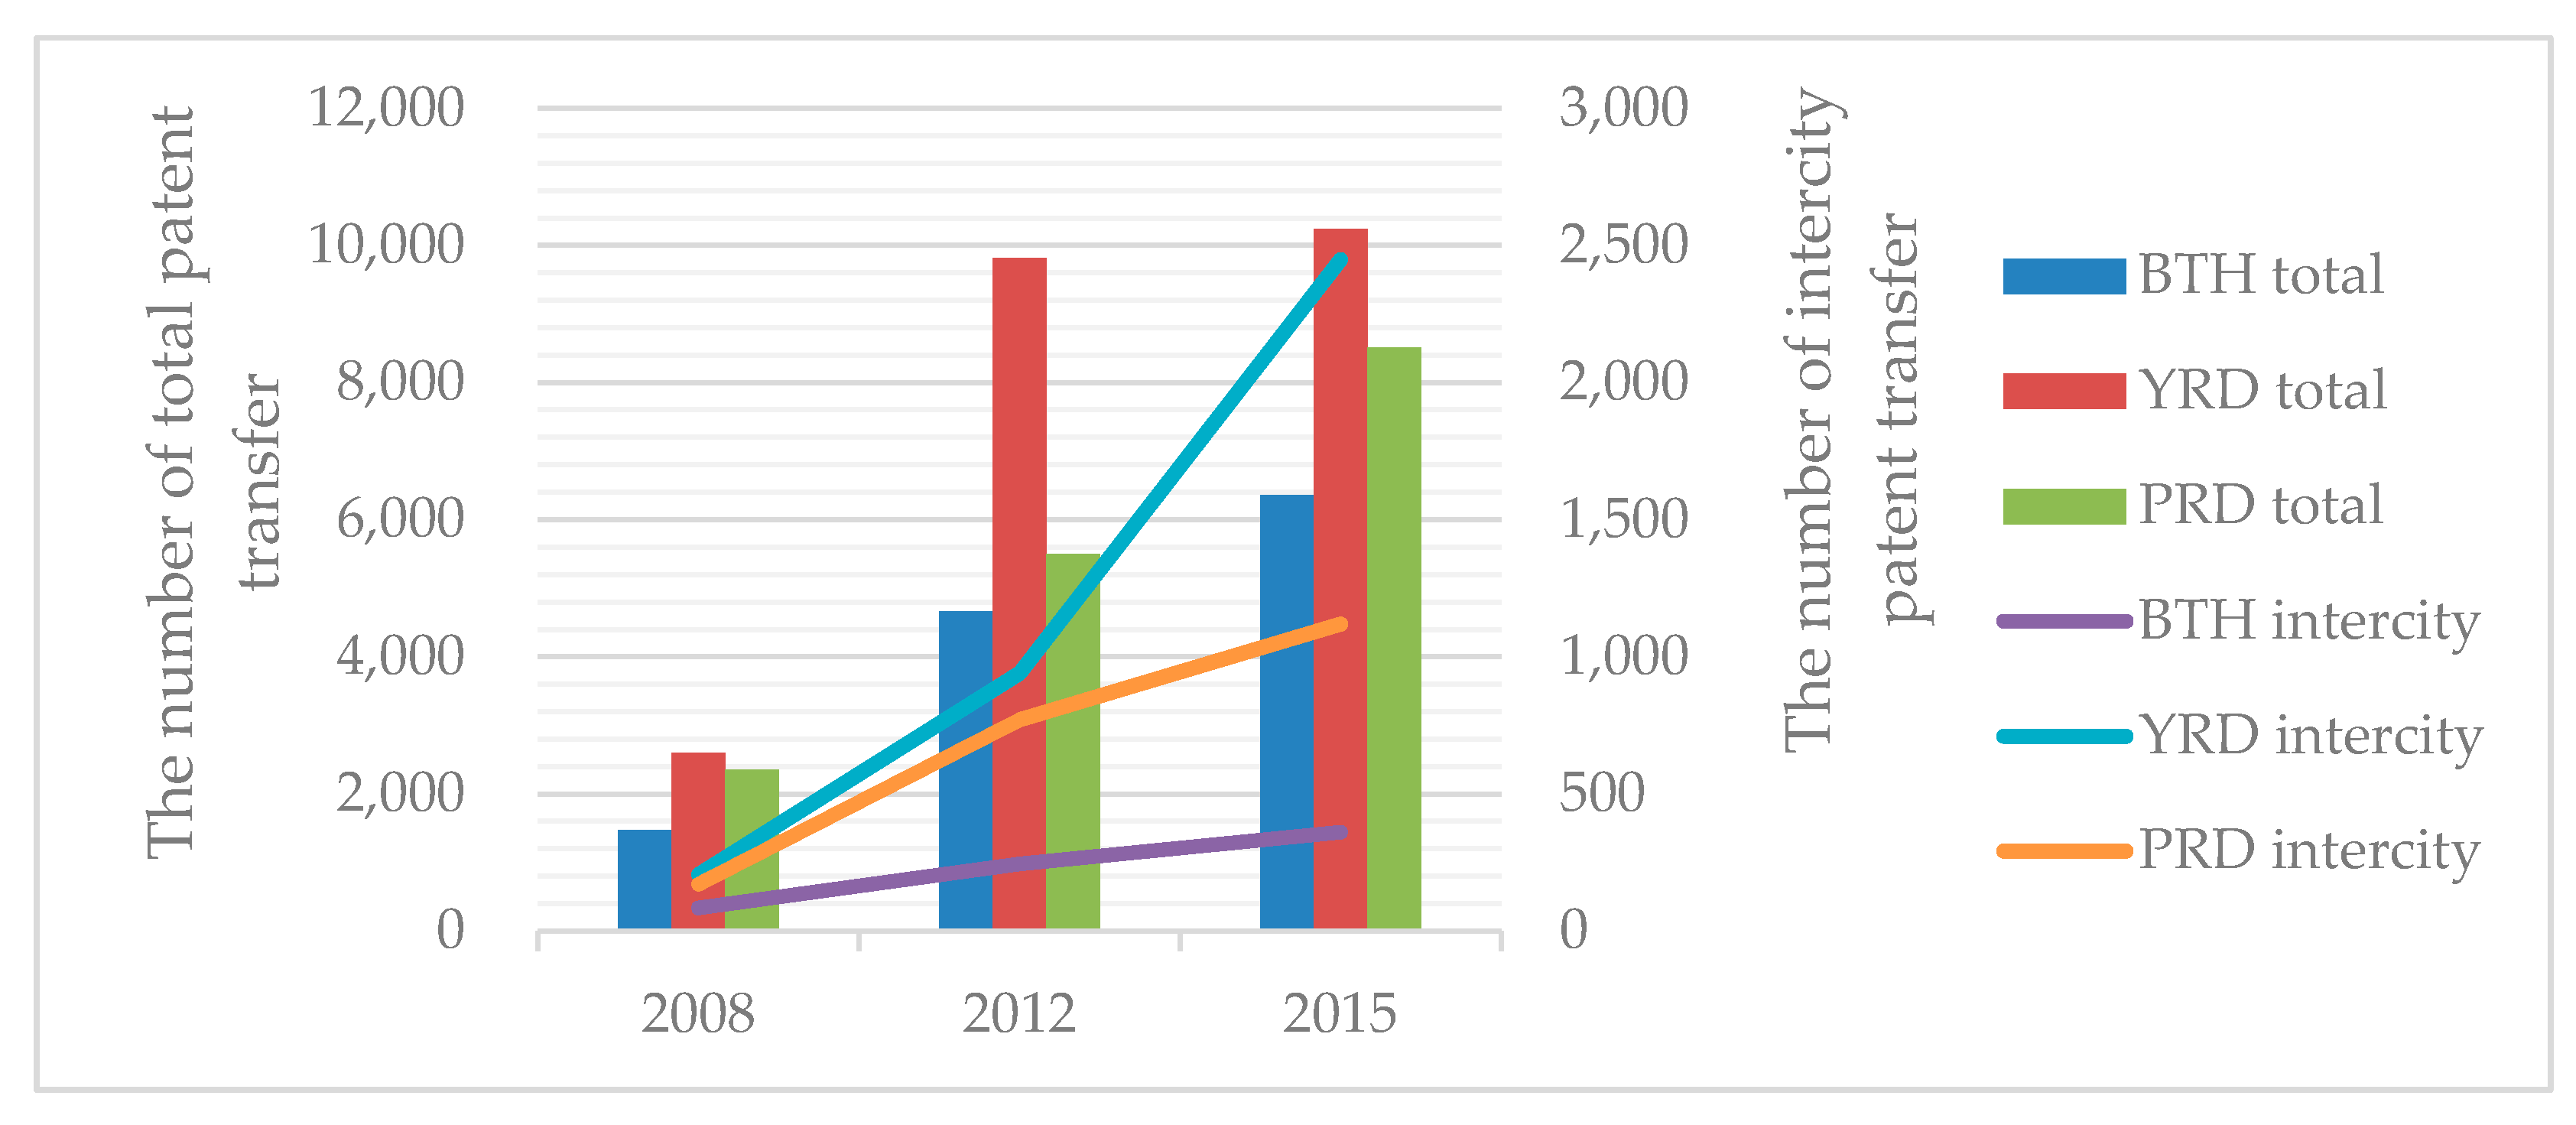
Figure 3.
Proportion of different types of assignors and assignees in the BTH, YRD, and PRD urban agglomerations in 2015.
Figure 3.
Proportion of different types of assignors and assignees in the BTH, YRD, and PRD urban agglomerations in 2015.

Figure 4.
Degree and weighted degree of cities within three urban agglomerations. (BTH, YRD, and PRD) in 2008, 2012, and 2015.
Figure 4.
Degree and weighted degree of cities within three urban agglomerations. (BTH, YRD, and PRD) in 2008, 2012, and 2015.
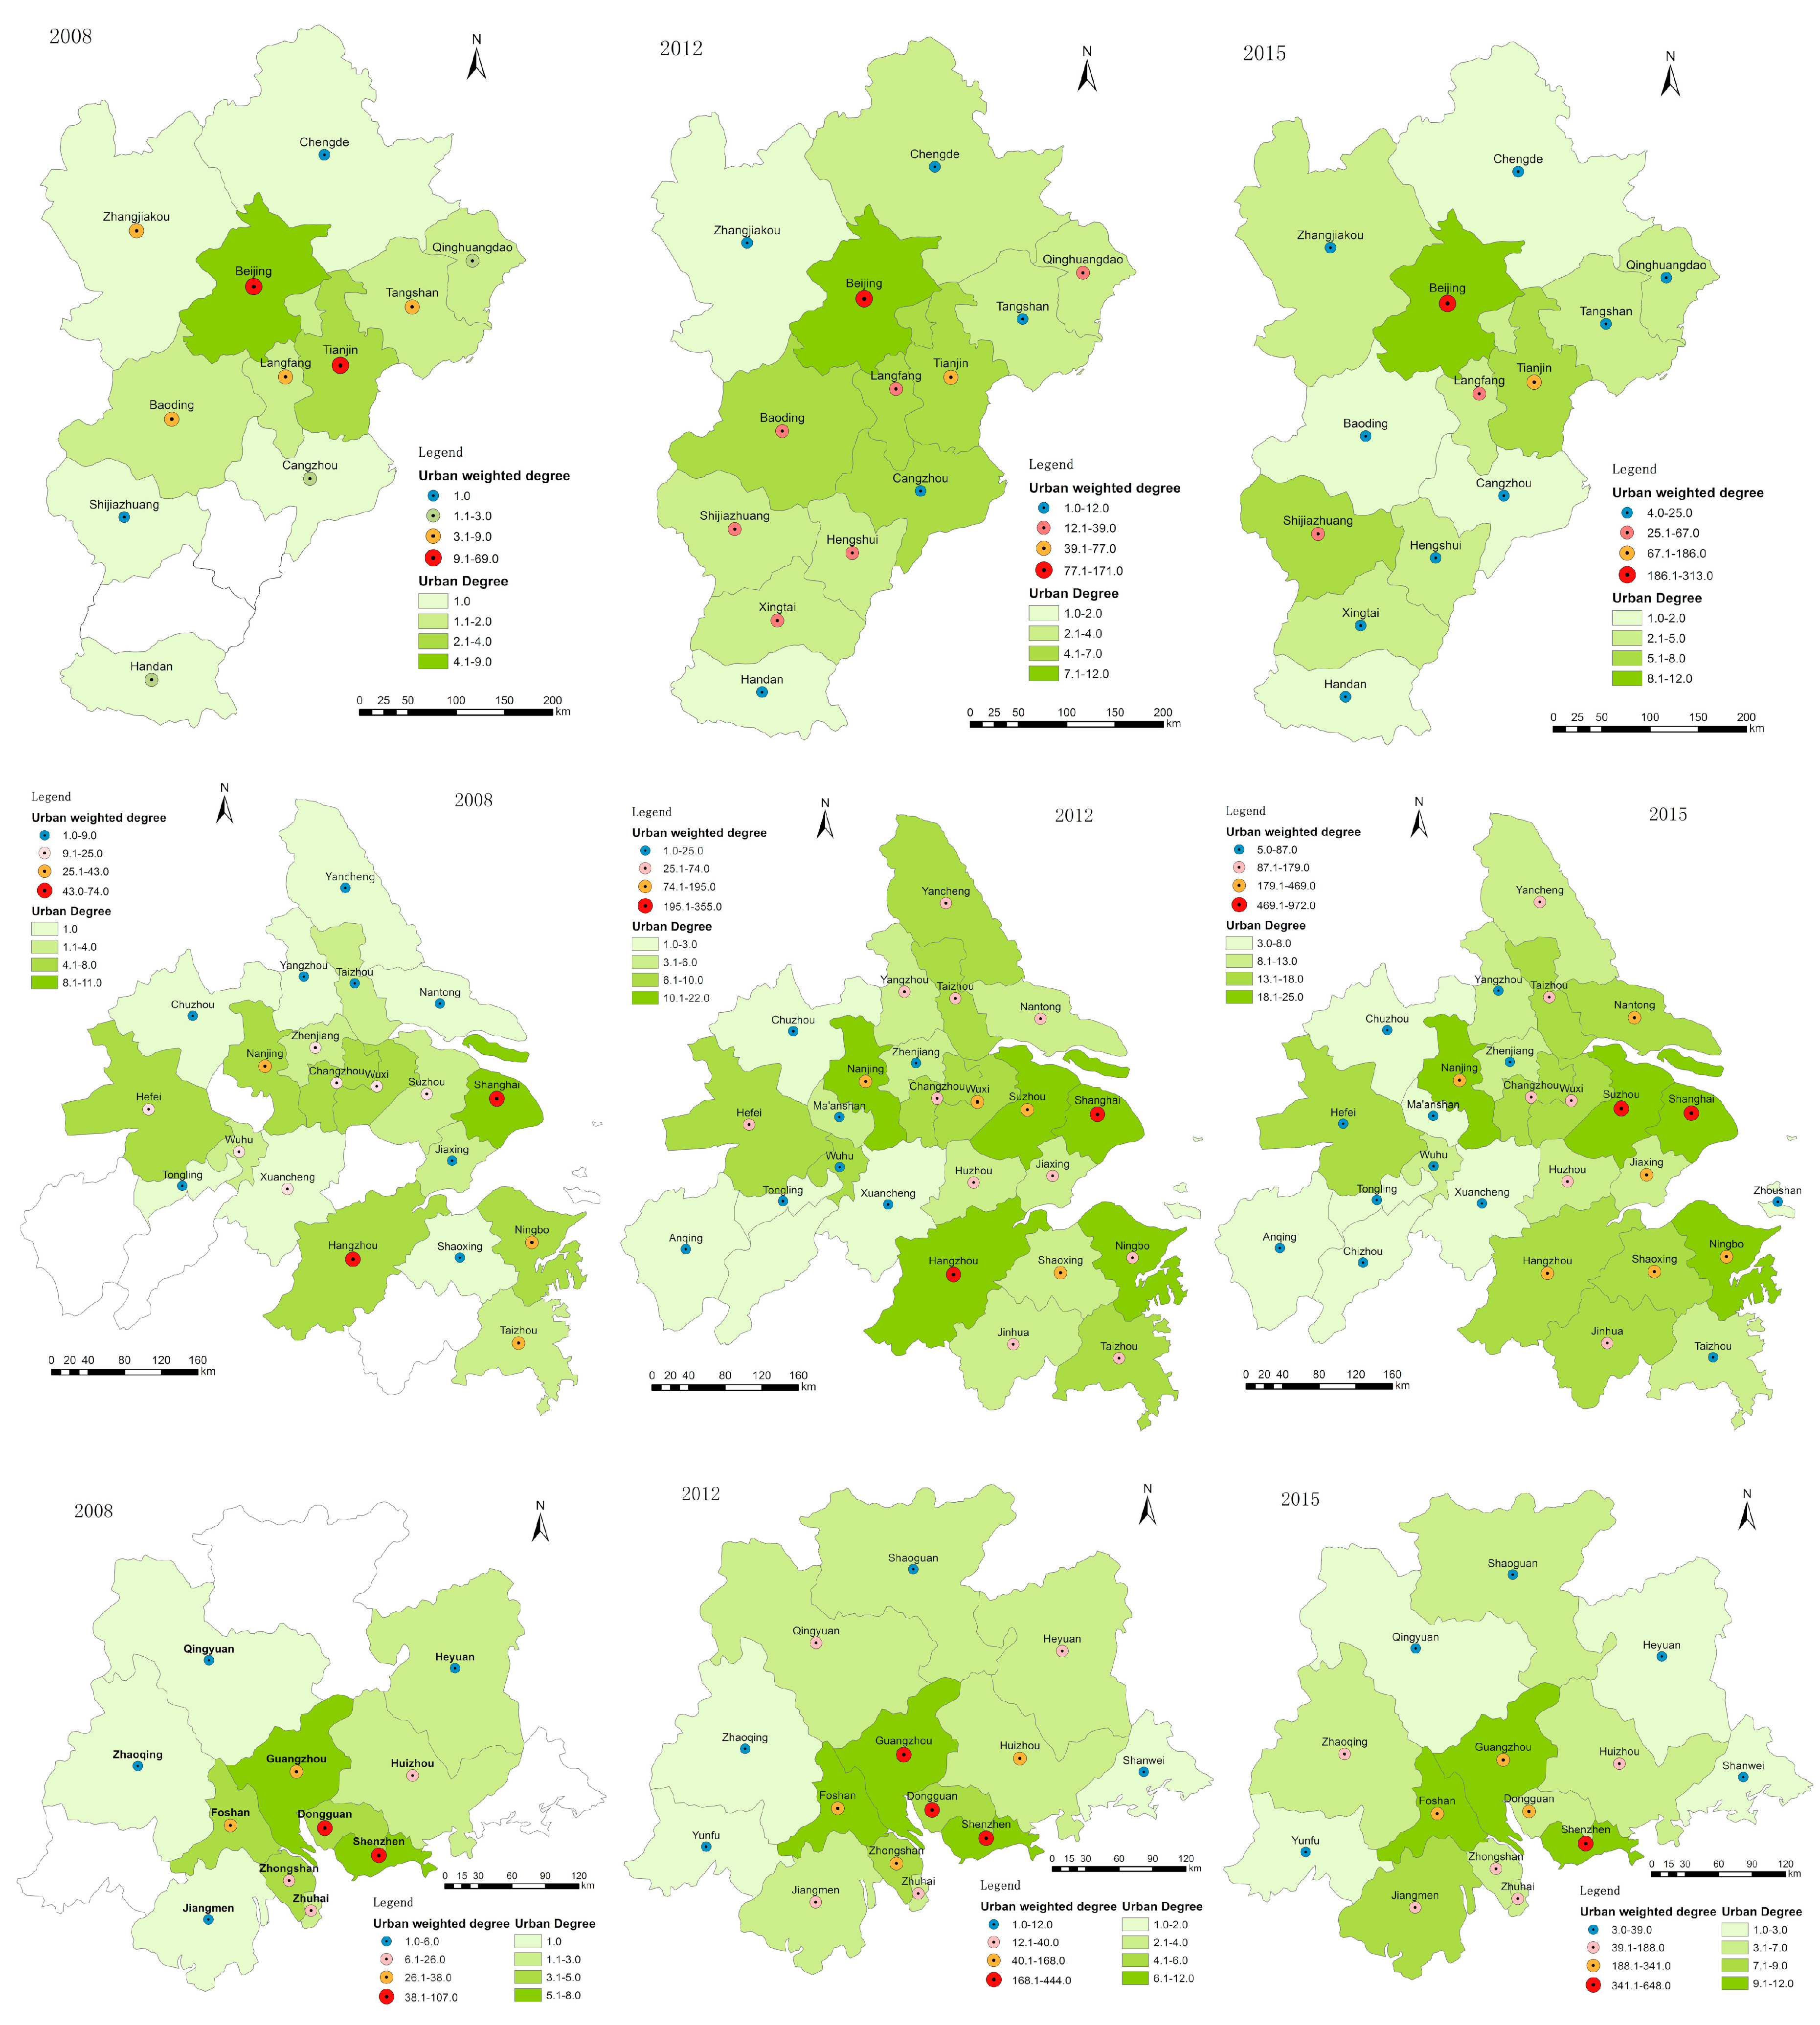
Figure 5.
Intercity technology transfer network for the three urban agglomerations from 2008 to 2015. (a) Beijing–Tianjin–Hebei; (b) Yangtze River Delta; (c) Pearl River Delta.
Figure 5.
Intercity technology transfer network for the three urban agglomerations from 2008 to 2015. (a) Beijing–Tianjin–Hebei; (b) Yangtze River Delta; (c) Pearl River Delta.


Figure 6.
Intercity technology flows in the three major urban agglomerations from 2008 to 2015. (a) Beijing–Tianjin–Hebei; (b) Yangtze River Delta; (c) Pearl River Delta.
Figure 6.
Intercity technology flows in the three major urban agglomerations from 2008 to 2015. (a) Beijing–Tianjin–Hebei; (b) Yangtze River Delta; (c) Pearl River Delta.


Table 1.
Top five cities featuring the largest urban degree centrality and betweenness centrality within three major urban agglomerations in 2008, 2012, and 2015.
Table 1.
Top five cities featuring the largest urban degree centrality and betweenness centrality within three major urban agglomerations in 2008, 2012, and 2015.
| Beijing–Tianjin–Hebei (BTH) | Degree Centrality | Betweenness Centrality | ||||||||||
| 2008 | 2012 | 2015 | 2008 | 2012 | 2015 | |||||||
| Beijing | 0.75 | Beijing | 0.92 | Beijing | 1.00 | Beijing | 0.43 | Beijing | 0.60 | Beijing | 0.66 | |
| Tianjin | 0.33 | Baoding | 0.54 | Tianjin | 0.67 | Tianjin | 0.12 | Tianjin | 0.05 | Tianjin | 0.06 | |
| Baoding | 0.17 | Tianjin | 0.46 | Shijiazhuang | 0.58 | Tangshan | 0.08 | Shijiazhuang | 0.03 | Shijiazhuang | 0.05 | |
| Langfang | 0.17 | Cangzhou | 0.38 | Langfang | 0.42 | Langfang | 0.00 | Baoding | 0.02 | Hengshui | 0.04 | |
| Tangshan | 0.17 | Langfang | 0.38 | Xingtai | 0.33 | Qinghuangdao | 0.00 | Langfang | 0.01 | Langfang | 0.04 | |
| Yangtze River Delta (YRD) | Degree Centrality | Betweenness Centrality | ||||||||||
| 2008 | 2012 | 2015 | 2008 | 2012 | 2015 | |||||||
| Shanghai | 0.44 | Shanghai | 0.88 | Shanghai | 1 | Shanghai | 0.33 | Shanghai | 0.29 | Shanghai | 0.19 | |
| Hangzhou | 0.32 | Suzhou | 0.64 | Suzhou | 0.88 | Hefei | 0.2 | Suzhou | 0.13 | Nanjing | 0.09 | |
| Hefei | 0.32 | Hangzhou | 0.6 | Ningbo | 0.8 | Nanjing | 0.2 | Hangzhou | 0.09 | Suzhou | 0.07 | |
| Nanjing | 0.28 | Ningbo | 0.56 | Nanjing | 0.8 | Hangzhou | 0.12 | Nanjing | 0.09 | Hefei | 0.07 | |
| Ningbo | 0.24 | Nanjing | 0.56 | Hangzhou | 0.72 | Wuhu | 0.06 | Ningbo | 0.06 | Hangzhou | 0.05 | |
| Pearl River Delta (PRD) | Degree Centrality | Betweenness Centrality | ||||||||||
| 2008 | 2012 | 2015 | 2008 | 2012 | 2015 | |||||||
| Shenzhen | 0.62 | Guangzhou | 0.92 | Shenzhen | 0.92 | Shenzhen | 0.31 | Guangzhou | 0.28 | Shenzhen | 0.26 | |
| Guangzhou | 0.46 | Shenzhen | 0.85 | Guangzhou | 0.85 | Foshan | 0.19 | Shenzhen | 0.24 | Guangzhou | 0.14 | |
| Foshan | 0.38 | Foshan | 0.77 | Foshan | 0.85 | Guangzhou | 0.15 | Foshan | 0.15 | Foshan | 0.11 | |
| Dongguan | 0.31 | Dongguan | 0.46 | Jiangmen | 0.69 | Dongguan | 0.08 | Dongguan | 0.08 | Jiangmen | 0.02 | |
| Zhongshan | 0.31 | Zhongshan | 0.38 | Dongguan | 0.54 | Zhongshan | 0.00 | Zhongshan | 0.01 | Dongguan | 0.02 | |
Table 2.
Urban weighted degree (WD) and net flow in-degree (NFD) in the three major urban agglomerations in 2008, 2012, and 2015.
Table 2.
Urban weighted degree (WD) and net flow in-degree (NFD) in the three major urban agglomerations in 2008, 2012, and 2015.
| (a) Beijing–Tianjin–Hebei | ||||||||
| 2008 | 2012 | 2015 | ||||||
| City | WD | NFD | City | WD | NFD | City | WD | NFD |
| Beijing | 69 | 31(50/19) | Beijing | 171 | 15(93/78) | Beijing | 313 | −125(94/219) |
| Tianjin | 62 | −24(19/43) | Tianjin | 77 | 21(49/28) | Tianjin | 186 | 66(126/60) |
| Baoding | 9 | −5(2/7) | Shijiazhuang | 39 | −5(17/22) | Langfang | 67 | 45(56/11) |
| Tangshan | 7 | 5(6/1) | Baoding | 31 | −13(9/22) | Shijiazhuang | 41 | −7(17/24) |
| Langfang | 6 | −4(1/5) | Langfang | 27 | −15(6/21) | Tangshan | 25 | 11(18/7) |
| Zhangjiakou | 6 | −6(0/6) | Xingtai | 24 | −4(10/14) | Cangzhou | 19 | −1(9/10) |
| Handan | 3 | 3(3/0) | Hengshui | 20 | 2(11/9) | Hengshui | 14 | −6(4/10) |
| Qinghuangdao | 2 | 0(1/1) | Qinghuangdao | 19 | 1(10/9) | Chengde | 12 | 8(10/2) |
| Cangzhou | 2 | 2(2/0) | Tangshan | 12 | −8(2/10) | Qinghuangdao | 11 | −7(2/9) |
| Shijiazhuang | 1 | −1(0/1) | Zhangjiakou | 12 | 2(7/5) | Baoding | 11 | 11(11/0) |
| Chengde | 1 | −1(0/1) | Cangzhou | 11 | −1(5/6) | Xingtai | 9 | 5(7/2) |
| Xingtai | 0 | 0(0/0) | Chengde | 4 | 4(0/4) | Zhangjiakou | 8 | −2(3/5) |
| Hengshui | 0 | 0(0/0) | Handan | 1 | 1(1/0) | Handan | 4 | 2(3/1) |
| (b) Yangtze River Delta | ||||||||
| 2008 | 2012 | 2015 | ||||||
| City | WD | NFD | City | WD | NFD | City | WD | NFD |
| Shanghai | 74 | 24(49/25) | Shanghai | 355 | −129(113/242) | Shanghai | 972 | −174(399/573) |
| Hangzhou | 62 | −12(25/37) | Hangzhou | 257 | −143(57/200) | Suzhou | 647 | −67(290/357) |
| Taizhou | 43 | −1(21/22) | Suzhou | 195 | 39(117/78) | Hangzhou | 469 | −21(224/245) |
| Nanjing | 35 | 1(18/17) | Nanjing | 164 | 10(87/77) | Nantong | 341 | 195(268/73) |
| Wuxi | 34 | −4(15/19) | Shaoxing | 133 | 71(102/31) | Nanjing | 331 | −33(149/182) |
| Hefei | 25 | 11(18/7) | Wuxi | 114 | −20(47/67) | Shaoxing | 305 | −147(79/226) |
| Ningbo | 24 | 2(13/11) | Changzhou | 74 | 26(50/24) | Ningbo | 258 | −48(105/153) |
| Wuhu | 21 | 11(16/5) | Ningbo | 63 | −15(24/39) | Jiaxing | 244 | 154(199/45) |
| Changzhou | 19 | −11(4/15) | Jiaxing | 63 | −1(31/32) | Changzhou | 179 | −29(75/104) |
| Suzhou | 18 | −12(3/15) | Hefei | 53 | −29(12/41) | Wuxi | 176 | −36(70/106) |
| Jiaxing | 15 | 3(9/6) | Taizhou | 51 | 35(43/8) | Jinhua | 154 | −78(38/116) |
| Zhenjiang | 12 | −12(0/12) | Nantong | 50 | 6(28/22) | Huzhou | 140 | 48(94/46) |
| Shaoxing | 9 | −1(4/5) | Yancheng | 49 | 39(44/5) | Yancheng | 100 | 74(87/13) |
| Nantong | 4 | 2(3/1) | Huzhou | 48 | 40(44/4) | Taizhou | 95 | 59(77/18) |
| Taizhou | 3 | −3(0/3) | Yangzhou | 37 | 27(32/5) | Hefei | 87 | 53(70/17) |
| Tongling | 3 | 3(3/0) | Jinhua | 36 | 4(20/16) | Taizhou | 71 | −13(29/42) |
| Yancheng | 2 | 0(1/1) | Taizhou | 33 | 11(22/11) | Zhenjiang | 62 | −10(26/36) |
| Chuzhou | 1 | 1(1/0) | Wuhu | 25 | 15(20/5) | Yangzhou | 61 | 33(47/14) |
| Xuancheng | 1 | −1(0/1) | Anqing | 19 | 19(19/0) | Chuzhou | 56 | 16(36/20) |
| Yangzhou | 1 | −1(0/1) | Ma’anshan | 17 | −7(5/12) | Wuhu | 52 | 16(34/18) |
| Zhoushan | 0 | 0(0/0) | Zhenjiang | 16 | −2(7/9) | Ma’anshan | 27 | 5(16/11) |
| Chizhou | 0 | 0(0/0) | Chuzhou | 11 | 11(11/0) | Zhoushan | 27 | 17(22/5) |
| Anqing | 0 | 0(0/0) | Tongling | 10 | −6(2/8) | Xuancheng | 19 | −1(9/10) |
| Jinhua | 0 | 0(0/0) | Xuancheng | 5 | −1(2/3) | Anqing | 12 | −6(3/9) |
| Huzhou | 0 | 0(0/0) | Zhoushan | 0 | 0(0/0) | Tongling | 8 | −8(0/8) |
| Ma’anshan | 0 | 0(0/0) | Chizhou | 0 | 0(0/0) | Chizhou | 5 | 1(3/2) |
| (c) Pearl River Delta | ||||||||
| 2008 | 2012 | 2015 | ||||||
| City | WD | NFD | City | WD | NFD | City | WD | NFD |
| Shenzhen | 107 | −3(52/55) | Shenzhen | 444 | −210(117/327) | Shenzhen | 648 | −262(193/455) |
| Dongguan | 80 | −10(35/45) | Dongguan | 344 | 154(249/95) | Guangzhou | 341 | 107(224/117) |
| Guangzhou | 38 | −14(12/26) | Guangzhou | 294 | −70(112/182) | Dongguan | 252 | 70(161/91) |
| Foshan | 32 | 4(18/14) | Foshan | 168 | 2(85/83) | Foshan | 250 | 12(131/119) |
| Zhongshan | 26 | 12(19/7) | Zhongshan | 93 | 51(72/21) | Huizhou | 188 | 54(121/67) |
| Zhuhai | 22 | −14(4/18) | Huizhou | 77 | 55(66/11) | Zhongshan | 146 | 8(77/69) |
| Huizhou | 22 | 16(19/3) | Zhuhai | 40 | −14(13/27) | Zhaoqing | 128 | −94(17/111) |
| Jiangmen | 6 | 6(6/0) | Qingyuan | 22 | 18(20/2) | Jiangmen | 94 | 50(72/22) |
| Heyuan | 3 | 3(3/0) | Heyuan | 21 | 9(15/6) | Zhuhai | 81 | 11(46/35) |
| Zhaoqing | 1 | −1(0/1) | Jiangmen | 17 | 5(11/6) | Qingyuan | 39 | 17(28/11) |
| Qingyuan | 1 | 1(1/0) | Zhaoqing | 12 | 0(6/6) | Shaoguan | 31 | 13(22/9) |
| Shaoguan | 0 | 0(0/0) | Shaoguan | 5 | 1(3/2) | Heyuan | 31 | 17(24/7) |
| Yunfu | 0 | 0(0/0) | Shanwei | 2 | −2(0/2) | Shanwei | 6 | −6(0/6) |
| Shanwei | 0 | 0(0/0) | Yunfu | 1 | 1(1/0) | Yunfu | 3 | 3(3/0) |
Table 3.
Variable definitions and multiple regression results.
| Dependent Variable: The Volume of City-Pair Patent Transactions in 2015 | ||||||
|---|---|---|---|---|---|---|
| (1) | (2) | (3) | (4) | (5) | (6) | |
| Explanatory variables | ||||||
| Distance | −2.284 *** | −1.915 *** | −2.096 *** | −1.784 *** | ||
| (−5.37) | (−4.81) | (−4.97) | (−4.48) | |||
| Industrial similarity | −1.331 * | −2.705 *** | 0.476 | −0.835 | ||
| (−2.28) | (−4.06) | (0.91) | (−1.53) | |||
| Technology gap | 0.191 ** | 0.371 *** | 0.0775 | 0.270 *** | ||
| (2.73) | (5.37) | (1.12) | (4.00) | |||
| Absorptive capacity | 0.0430 | 0.0182 | 0.0453 | 0.0232 | ||
| (1.49) | (0.76) | (1.40) | (0.77) | |||
| Control Variables | ||||||
| Region | 0.314 | |||||
| (1.74) | ||||||
| Economic gap | −0.467 *** | −0.548 *** | −0.608 *** | |||
| (−4.97) | (−4.92) | (−5.93) | ||||
| Key city output | 1.356 *** | 1.048 *** | 1.116 *** | |||
| (7.46) | (5.63) | (6.69) | ||||
| cons | 1.695 *** | 2.898 *** | 2.426 * | 1.515 | 2.926 ** | 1.968 * |
| (4.12) | (12.86) | (2.38) | (1.77) | (2.98) | (2.46) | |
| lnalpha_cons | 0.331 *** | 0.103 | 0.153 * | 0.0308 | 0.0738 | −0.0746 |
| (3.98) | (1.18) | (2.09) | (0.36) | (1.03) | (−0.81) | |
| N | 368 | 368 | 368 | 368 | 368 | 368 |
Note: t statistics in parentheses, * p < 0.05, ** p < 0.01, *** p < 0.001.
© 2019 by the authors. Licensee MDPI, Basel, Switzerland. This article is an open access article distributed under the terms and conditions of the Creative Commons Attribution (CC BY) license (http://creativecommons.org/licenses/by/4.0/).
Share and Cite
MDPI and ACS Style
Liu, C.; Niu, C.; Han, J. Spatial Dynamics of Intercity Technology Transfer Networks in China’s Three Urban Agglomerations: A Patent Transaction Perspective. Sustainability 2019, 11, 1647. https://doi.org/10.3390/su11061647
AMA Style
Liu C, Niu C, Han J. Spatial Dynamics of Intercity Technology Transfer Networks in China’s Three Urban Agglomerations: A Patent Transaction Perspective. Sustainability. 2019; 11(6):1647. https://doi.org/10.3390/su11061647
Chicago/Turabian StyleLiu, Chengliang, Caicheng Niu, and Ji Han. 2019. "Spatial Dynamics of Intercity Technology Transfer Networks in China’s Three Urban Agglomerations: A Patent Transaction Perspective" Sustainability 11, no. 6: 1647. https://doi.org/10.3390/su11061647
Note that from the first issue of 2016, this journal uses article numbers instead of page numbers. See further details here.