Article

Movement-Based Biosecurity Zones for Control of Highly Infectious Animal Diseases: Application of Community Detection Analysis to a Livestock Vehicle Movement Network

1
Department of Urban & Transportation Engineering, Korea National University of Transportation, Chungju 27469, Korea
2
College of Veterinary Medicine and Institute of Veterinary Science, Kangwon National University, Chuncheon 24341, Korea
3
Veterinary Epidemiology Division, Animal and Plant Quarantine Agency, Gimcheon 39660, Korea
4
Department of Urban Engineering, Chungbuk National University, Cheongju 28644, Korea
*
Author to whom correspondence should be addressed.
Sustainability 2019, 11(6), 1642; https://doi.org/10.3390/su11061642
Submission received: 11 January 2019 / Revised: 13 March 2019 / Accepted: 13 March 2019 / Published: 19 March 2019
(This article belongs to the Section Sustainable Urban and Rural Development)

Abstract

:
Zoning is crucial for controlling animal infectious diseases and movement plays a major role in disease transmission. However, movement-based zoning has received little research attention. This study aimed to identify biosecurity zones divided by administrative unit, based on communities detected in movement network. We used vehicle entry data from November 2013 to January 2017. We split the data to analyze changes in networks over time and seasons (3 summer and 4 winter). The HN algorithm for mega-scale networks was used to detect communities. We identified biosecurity zones based on the geographical concentration of facilities belonging to the same communities. Jenks Natural Breaks Method was used to determine whether facilities were agglomerated. The zone classifications derived for seven seasons were overlaid to identify an integrated zone classification. The number of significant communities declined from 10 to 7 over time, from which we inferred that separated communities tended to aggregate. Therefore, biosecurity zones that were separate in the past merged and the number of zones decreased. From the overlay, seven biosecurity zones were derived. These zones are different from the conventional control zones, which do not consider movement. Therefore, these biosecurity zones can be used as an alternative control zone to complement existing zoning systems in Korea.

1. Introduction

In Korea, the amount of direct damage caused by foot-and-mouth disease (FMD) and avian influenza (AI) between 2010 and 2018 was 4 trillion won (about $3.5 billion) [1]. In addition, the incidence of livestock epidemics results in large-scale stamping out. Between 2013 and 2016, 47,922,000 livestock were killed in Korea to prevent the spread of AI, which is the second highest number in the world after the United States (49,241,700) [2]. Korea had the highest number of livestock killed to prevent the spread of FMD globally (208,000) [2]. Stamping out makes large-scale burial sites where animal carcasses are buried, and the environmental pollution caused by wastewater generated from these burial sites is very serious. In other words, repetitive livestock epidemics pose a serious threat to Korea’s economic and environmental sustainability.
For many animal infectious diseases, OIE (Office International des Épizooties) member countries have traditionally applied the concept of zoning to control epidemics [3]. A zone is a part of a country defined by the veterinary authority for the purpose of international trade or disease prevention or control, which contains an animal population or subpopulation with a specific health status with respect to an infection or infestation [4]. OIE recommends zoning as a means to limit the impact of animal disease epidemics [4]. The rationale behind this recommendation is that zones may be selectively targeted as part of an intensive quarantine program and used to determine the boundaries for movement restriction. Therefore, zone boundaries should be established that take into consideration epidemiological, economic, social, administrative and legal factors and they should act as a biosecurity barrier against the spread of disease [5]. However, the OIE has not provided specific procedures and criteria for establishing the zones [6]. Thus, in many countries, the boundaries of administrative districts have been used as the zone boundaries [5]. However, the boundaries of administrative districts do not take into account the epidemiological situation. In addition, the most widely used standard for setting zones is the straight-line distance from the epidemic facility. Korea, China, Thailand, Australia and many other countries use 10 km as a standard [7,8,9]. In Korea, when an epidemic occurs, the area within a 10 km radius of the epidemic facility is designated as a control zone [10,11] and the high-ranked administrative division in which the epidemic facility is located is designated as the secondary control zone [10,11].
In this situation, the boundaries of zones may readily be breached through numerous epidemiological pathways [3]. Thus, the relatively recent concept of compartments is emerging as a means to prevent and control animal infectious diseases. Compartments are defined as animal subpopulations contained in one or more establishments, separated from other susceptible populations by a common biosecurity management system, and with a specific animal health status with respect to one or more infections or infestations for which the necessary surveillance, biosecurity and control measures have been applied for the purposes of international trade or disease prevention and control in a country or zone [4]. Compared to zones, compartments consider non-spatial factors other than geographical proximity that may jeopardize the biosecurity of a compartment [12]. Generally, these non-spatial factors include the movement of animals, equipment, other fomites, feed and people [12]. In short, compartments are set up on a facility basis, while zones are based on geographical boundaries. In addition, compartments are established based on many epidemiological factors, such as movement, while zones are established based on animal’s health status.
Many studies have reported that animal movement is one of the leading causes of animal infectious disease transmission [13,14,15,16,17,18]. However, in Korea, not only animal movement but also vehicle movements for various purposes between livestock facilities play a major role in spreading infectious diseases [18]. In the case of FMD, vehicles for animal movement are the most important cause of transmission (54.2%); feed-carrier vehicles (18.9%) and other vehicles (8.4%) also contribute significantly to transmission [17] (as cited in [2], p. 3). Even in the case of AI, vehicle contact (28.9%) is a more important cause of transmission than animal movement (7.1%) [18]. Studies have been conducted on the relationship between movement networks and animal infectious diseases. Kao et al. [19] introduced network-based frameworks for analyzing the spread of epidemics, and subsequent studies [12,15,16,20,21,22] analyzed network characteristics and simulated the spread of disease through animal movement networks. In these studies, the spread of disease through a network has been analyzed in both ungulates [15,16,19,22] and poultry [12,20,21]. In other words, previous studies assume that both AI and FMD can propagate through a movement network.
Studies have also been conducted to identify compartments through the structure of animal movement networks [12,15,19,22], as these have a considerable effect on the spread of disease. In networks, groups of actors appear that frequently interact with each other. Social Network Analysis (SNA) refers to these groups as communities (sometimes referred to as clusters, subgroups, etc.) and identifying these various communities is one of the main aims of SNA. In an animal movement network, a community is a group of livestock facilities where frequent movements occur between them. As mentioned earlier, animal movement plays a significant role in the propagation of animal epidemics. Therefore, if an infectious disease occurs within a particular community, the infection risk at the facilities belonging to that community is very high. In other words, communities derived from movement networks can be determined as compartments that focus on the infection risk from movement. Green et al. [15] and Kao et al. [19] used community detection analysis in the SNA to identify communities containing several facilities. Nickbakhsh et al. [12] and Martınez-Lopez et al. [22] derived communities by analyzing the connections in the network and presented them as compartments for managing infectious diseases.
Using the compartments derived from a movement network structure is possible to clearly identify high-risk subpopulations, in contrast to zones based on administrative boundaries or geographical proximity. In Korea, however, the main body managing the quarantine process is the local government, and it conducts disinfection of general vehicles at the boundary of administrative districts. In this situation, facility-based compartments have some disadvantages, and there are still advantages to zones that are divided into administrative units for effective quarantine. Therefore, it is necessary to establish zones divided by administrative units, with the advantages of compartments that also consider the risk of facilities. However, compared to network-based compartments, network-based zones have received relatively little attention.
Community structure in animal movement networks is highly regional; facilities belonging to the same community are concentrated in specific areas [15]. Therefore, it is possible to identify zones based on the geographical distribution of compartments. We aimed to identify zones divided by administrative unit, based on communities detected in a movement network. As mentioned earlier, if an infectious disease occurs within a particular community of a movement network, the infection risk at the facilities belonging to same community is very high. In this study, we refer to this zone as the biosecurity zone. The main research question of this study was whether biosecurity zones could be identified based on communities of livestock vehicle movement networks in Korea. This was split into sub-questions as follows: How do communities detected using movement networks change over time? 2. How are facilities in the same community spatially distributed? 3. What is the difference between the movement-based biosecurity zone and the conventional control zone?

2. Materials and Methods

2.1. General Approach

As shown in Figure 1, this study consisted of five steps. First, we establish the vehicle movement network between livestock facilities by converting vehicle entry data from the livestock facilities into a form that enabled SNA. In Figure 1a, dots represent livestock facilities and lines between dots represent movement between facilities. The thickness of the line represents the volume of movement.
Second, we identified communities through community detection analysis. Each community included several livestock facilities and facilities in the same community were those where frequent vehicle contact occurred between facilities. As you can see from the four communities in Figure 1b, there is more movement between facilities in the same community than between those in different communities. Therefore, identified communities can be thought of as a network-based compartment. Sometimes there were very isolated small communities in the network that did not have connections with other facilities, such as “Community D” shown in Figure 1b. For the identification of appropriate biosecurity zones, we excluded these small communities from the next step of the analysis. We used an HN (Heuristic based on Node ration) algorithm to detect communities.
Third, we geocoded the location of the facilities and identified the geographical distribution of the facilities for each community. In Figure 1c, each square represents one administrative unit, the point refers to the location of the facilities, and the color of the points represents the community containing the facilities. For example, the red dots represent facilities in community A and the blue dots represent facilities in community B. Communities that included too few facilities, such as Community D, were difficult to analyze and small communities were, therefore, excluded from the analysis.
Fourth, we identified biosecurity zones based on the administrative unit. According to previous studies [15,19], facilities included in the same community are expected to be geographically concentrated in a specific area. We judged that the administrative units in which facilities belonging to the same community were concentrated, were the same zone. For example, we identified administrative units with many red dots as zone “A”. For this, we used the Jenks Natural Breaks Method.
Finally, we integrated the results of the seven time periods through the overlay. Seasonal movement patterns are known to affect epidemic risk [23]. In Korea, livestock vehicle movement networks change over time and with season [24]. Therefore, we repeated the analysis from step 1 to step 4 for separate data sets for each time period. After that, it was necessary to integrate the results. For this, we overlaid the zones identified for different time periods.
The spatial scope of this study was South Korea. Korea’s administrative units are divided into two stages: high-ranked and low-ranked administrative units. High-ranked administrative units are largely divided into Si (Metropolitan Cities) and Do (Province), which are combination of urban and rural areas. Low-ranked administrative units are divided into Gu (city wards), Si (municipal cities) and Gun (counties). Figure 2 shows the high-ranked and low-ranked administrative units of Korea. The analytical unit of this study was low-ranked administrative units.

2.2. Data Source

This study used data provided by the Korea Animal Health Integrated System (KAHIS). KAHIS is an integrated information system to support the quarantine processing of livestock diseases, by collecting and managing vehicle entry data for livestock facilities. Vehicle entry data is generated and stored in the KAHIS database (DB) in real time when the vehicle enters the facility, through a GPS system installed on the livestock vehicle.
As describe above, in Korea, not only animal movement but also vehicle movements for various purposes between livestock facilities play a major role in spreading infectious diseases [18]. KAHIS collects and manages all registered vehicle entry data. Therefore, we analyzed all vehicle movements between livestock facilities.
Korea’s livestock vehicle movement network is dynamic and both the size and density of the network decrease in the winter season [24]. Therefore, analyzing seasonal changes is important for deriving appropriate biosecurity zones. This study used data from November 2013 to January 2017 (based on the possibility of data acquisition). We segmented the data based on date and constructed and analyzed the networks over time.
The OIE states that highly pathogenic avian influenza (HPAI)’s maximum incubation period is 21 days [25], and FMD’s maximum incubation period is 14 days [26]. In other words, there may be an effect up to about 3 weeks before and after the occurrence of the disease. Therefore, this study segmented the vehicle entry data into three-month periods. In addition, data from the summer and winter seasons were used to analyze differences in seasonal characteristics.
Kim et al. [24] reported that the size of Korea’s livestock movement network has shown a long-term increase, but within the same year, it is bigger in summer and smaller in winter. Of the 2016 datasets segmented by three months, the dataset included May to July had the largest number of facilities in the network. As a result, data for May, June and July were selected as representative of the summer season. Similarly, the data from November to January included the fewest facilities and were selected as representative of winter. Table 1 summarizes the data sets for the seven time periods used in the analysis and the periods included in the data set.

2.3. Methodology

2.3.1. Construction of the Vehicle Movement Network

SNA is concerned with understanding the linkages among social entities and the implications of these linkages [27]. The social entities are referred to as actors and the linkages are referred to as relationships. Actors are linked to one another by relationships such as the transfer of material resources, behavioral interaction, movement and so on [27]. In this study, we established the vehicle movement network by defining the livestock facilities as actors and defining the vehicle movements between facilities as relationships. KAHIS generates log data when the vehicle enters the facility. Therefore, we were able to compile data for facilities that a particular vehicle visits sequentially. We transformed these data into movement data, to establish the vehicle movement networks of the livestock facilities.
Figure 3 shows this process. In the figure, the rectangles represent livestock-related vehicles and circles represent livestock facilities. KAHIS is constructed in the form shown on the left side of Figure 3. For example, Vehicle 1 enters facilities A, B and C in that order. We converted this record into two movements in the form of A→B and B→C. In this way, the number of movements is counted. Based on the four vehicles in the figure, there are two movements each for A→B, B→C and B→D, and one movement each for D→A and C→E. The vehicle movement network was constructed as shown on the right side of Figure 3, by aggregating the converted movement data for each vehicle. As shown in Table 1, we used data sets from seven periods, so we constructed seven vehicle movement networks.

2.3.2. Community Detection of Vehicle Movement Network

Modularity is an indicator of how well communities are distinguished and it reflects the concentration of interactions within communities compared with a random distribution of interactions between all actors, regardless of communities [28]. Therefore, high modularity means that there are dense connections between the actors within communities but sparse connections between actors in different communities. Clauset et al. [29] proposed the CNM (Clauset, Newman and Moore) algorithm that can detect communities quickly in a large network using the modularity gain, which is obtained after merging a pair of vertices and nested heap structures of modularity gain for all pairs of vertices. It iteratively selects and merges the best pair of vertices (which has the largest modularity gain), from the heap until no pairs improve the modularity [30]. Since the CNM Algorithm was introduced, the scale of networks subject to social network analysis has continued to grow. In a mega scale network, such as the movement network of this study, the CNM algorithm requires excessive analysis time and computing resources. Wakita and Tsurumi [31] identified a bottleneck in the CNM algorithm. Its inefficiency resulted from unbalanced growth of communities and Wakita and Tsurumi attempted to balance the size of communities being merged. The paper proposes three algorithms (HE, HE’, HN) that differ in the way they measure the size of the communities: the HE algorithm measures the size of the community by the number of edges; the HE’ measures the number of communities by the number of edges, but does not consider size in the first stage; and the HN algorithm measures the size of the communities by the number of included nodes. These three algorithms have a lower degree of modularity in the communities detected but can be performed quickly in mega scale networks. We used the HN algorithm, which had the shortest analysis time among the three and used the NetMiner 4 [32] program for the analysis. Vehicle movement networks constructed in this study contained over 100,000 actors and over 7,000,000 relationships, so they could not be analyzed using other methods (CNM, HE or HE’ Algorithms). The HN Algorithm was the only algorithm that could return community detection results with reasonable computational time.

2.3.3. Identification of the Biosecurity Zone for Livestock Infectious Disease

To identify the biosecurity zones divided by administrative units, based on the detected communities in the movement network, the national territory was divided into administrative units through the geographical distribution of facilities by communitieshkive r, the ultimate goal of.
We geocoded livestock facilities and aggregated the number of facilities in each community by administrative units. If the administrative unit included more facilities belonging to a particular community than other units, we determined that that administrative unit was the unit in which the facilities belonging to the community were agglomerated. Figure 4 shows this process. Each square represents an administrative unit, and the points refer to the locations of facilities and the color of points refers to the community containing the facility. For example, the red dots represent facilities in community A, and more red dots are located in administrative units ① and ② than in the other administrative units. Therefore, we determined that ① and ② are the units where facilities belonging to community A are agglomerated. To do this, we divided the number of red dots included in the administrative units into two levels through the Jenks Natural Breaks method (sometimes referred to as Jenks Optimization Method). This method was developed in the field of cartography and is widely used for dividing classes. Some studies have reported that choropleth maps using Jenks optimization method are more easily interpreted than those based on traditional classification methods (Equal Interval, Quantile and Standard Deviation) [33]. This method distinguishes classes minimizing each class’s average deviation from the class mean, while maximizing each class’s deviation from the means of the other groups [34,35].
This method allowed us to identify the administrative units where a particular community’s facilities were agglomerated, and we then grouped these administrative units into the same zone. For example, as shown in Figure 4, administrative units ① and ② were grouped into the same biosecurity zone (A).

2.3.4. Integration of Periodic Analysis Results through Overlays

In order to utilize the biosecurity zone in the quarantine process, a single integrated zone classification is required. We derived an integrated zone classification based on winter 2016. This is because the data from winter of 2016 were the most up-to-date. In Figure 5, each square represents an administrative unit and gray squares refer to administrative units belonging to the same zone. As shown in Figure 5a, we first selected a particular zone from the 2016 winter data.
We then selected all zones from other time periods that shared one or more administrative units with the zone in winter 2016. As the biosecurity zones from this study will be utilized in the process of quarantine, we were as conservative as possible in establishing zones. Therefore, even if only one administrative unit was shared, the zone was selected for integration. Figure 5b shows the zones with administrative units shared with the winter 2016 zone in Figure 5a; the hatched squares represent shared administrative units.
The zones in Figure 5a and the zones in Figure 5b were overlaid to derive the integrated zone (Figure 5c). The red line represents the boundary of the zone and the darker the administrative unit, the more zones it was included in. This process was used to derive one integrated zone across time periods. Therefore, we conducted the same process for all zones in winter 2016 to derive an integrated zone classification.

3. Results and Discussion

3.1. Construction of Vehicle Movement Network

Table 2 and Figure 6 show the results of the construction of the vehicle movement networks for all seven time periods.
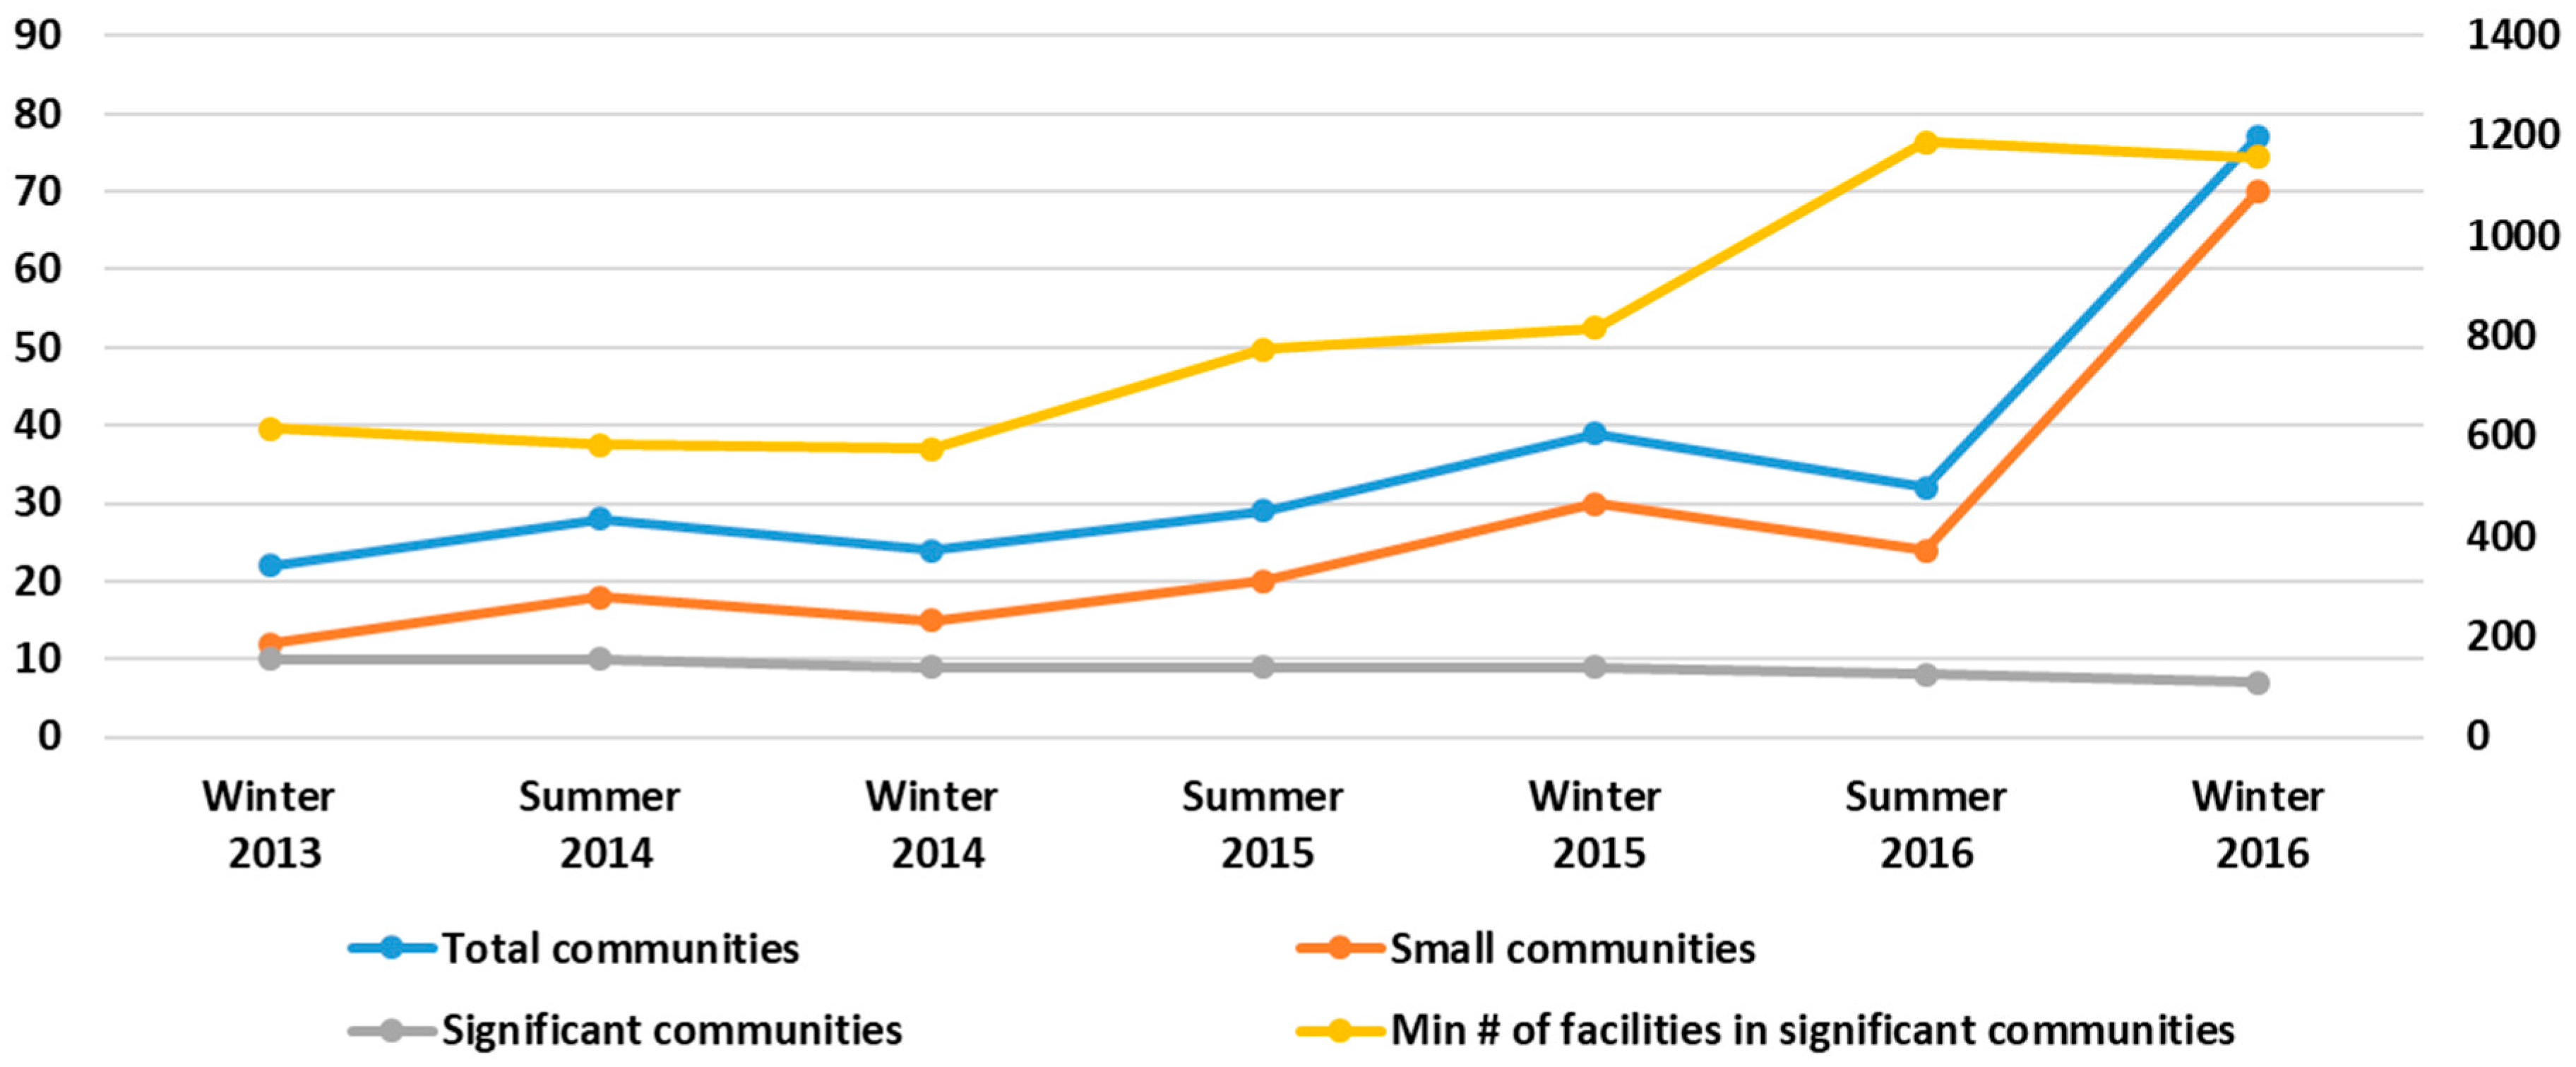
Facilities, total connection and total movement are indicators of the size of the network. As shown in Figure 6a–c, from winter of 2013 to summer of 2016, these three indicators tend to gradually increase. This means that the size of the network gradually increases. In the winter of 2016, these three indicators decreased. This means that the network was reduced in size in that period, which is thought to be due to the large-scale AI outbreak in winter 2016.
Connections per facilities shows, on average, how many connections one facility has. The higher this value means that each facility has more connections with other facilities. And it can be judged that the facilities of the network are more closely connected. Movements per facilities shows, on average, how many vehicle contacts have been made to single facility. These two indicators indicate how dense the network is, and the higher the value of these indicators, the more closely the facilities are connected with each other. As shown in Figure 6d,e, The values of these two indicators tend to increase in summer and decrease in winter. This means that the density of the networks increases in summer compared to winter.
On average, each network contains 96,047 facilities and 1,095,910 connections. And there are 7,069,043 vehicle movements in each network. A single facility, on average, has connections with 11 other facilities and 74 vehicle movements occur in three months.

3.2. Detecting Communities

Table 3 shows the analysis results of community detection through the HN algorithm. The average value of modularity is 0.62 and the modularity values at all periods are 0.6 or higher. The modularity value lies in the range (−1–1), and the optimal value is 1. However, in practice, modularity values above 0.7 are rare [28], and modularity value above 0.3 is a good indicator of significant community structure [29]. Therefore, it can be judged that the communities are appropriately detected in all seven periods.
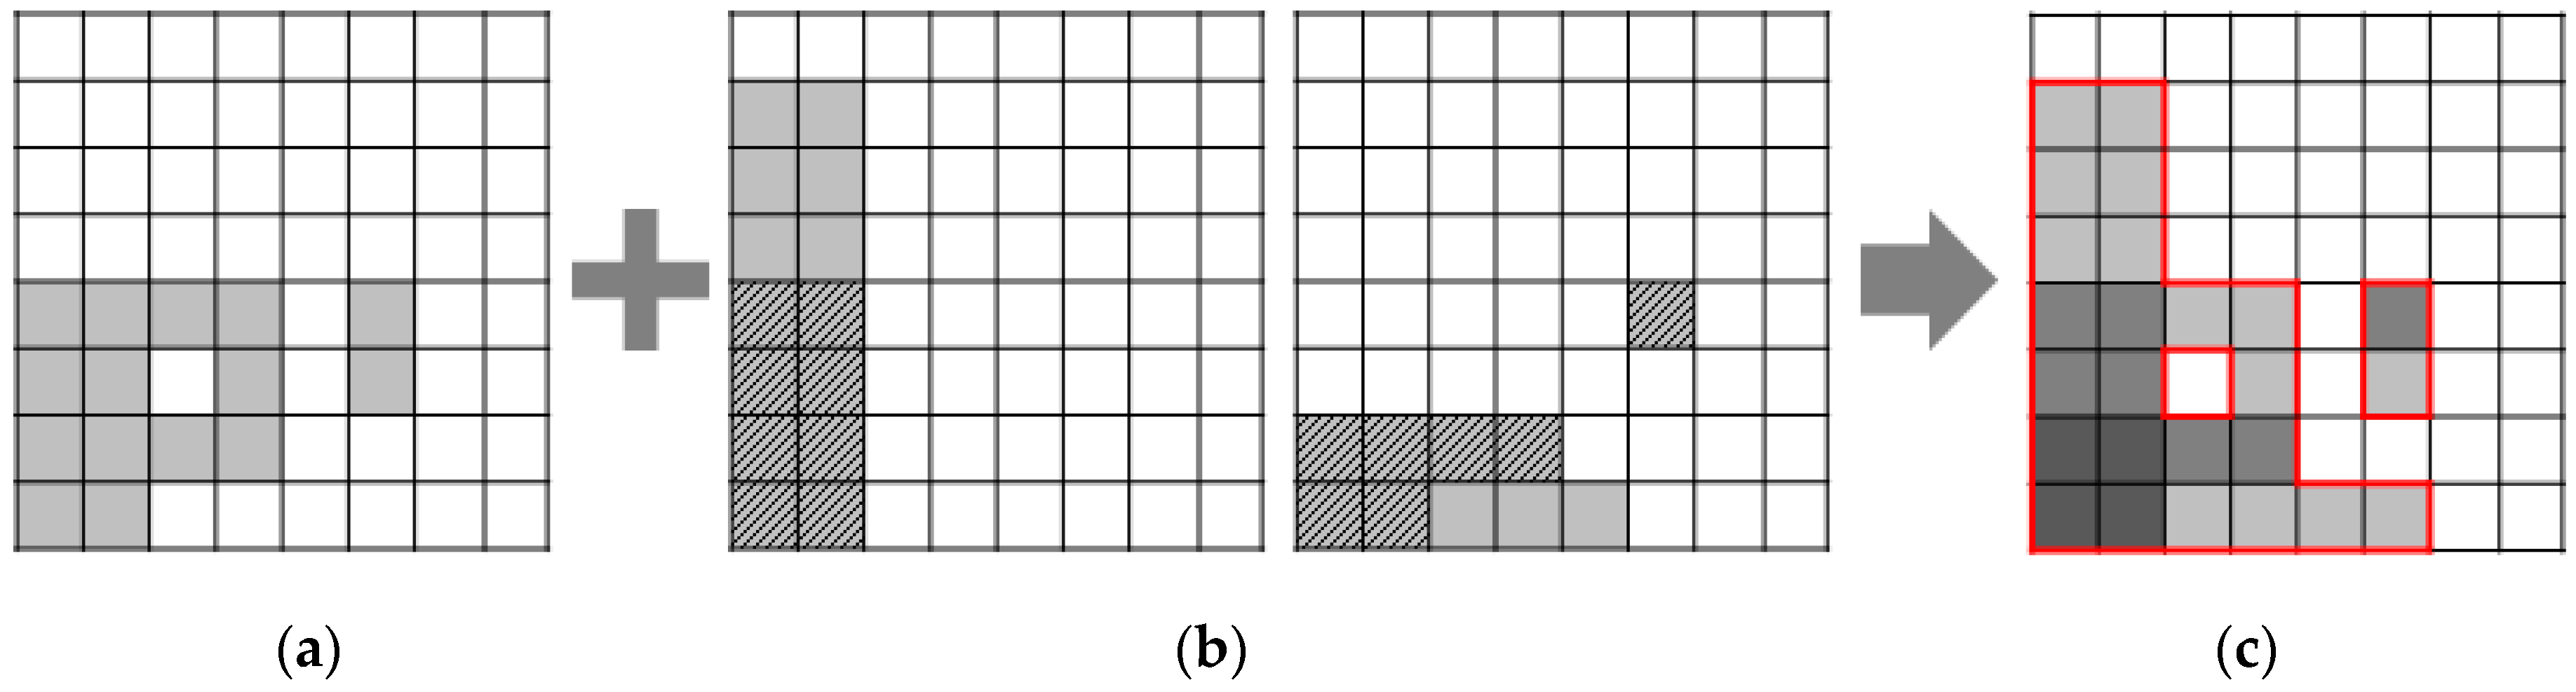
In the process of detecting the communities, small communities such as community D in Figure 1 were also detected. Significant communities are communities that contain a significant number of facilities from which a geographical distribution can be identified. The sum of the number of significant communities and small communities is the number of entire communities.
By comparing the max # of facilities in small communities and min # of facilities in significant communities, it is possible to see how much smaller the small communities were than the significant communities. As shown in Table 3, the min # of facilities in significant communities is, on average, 105.8 times the max # of facilities in small communities. In addition, many small communities have only two facilities. Therefore, small communities are so small that it made no sense to analyze the geographical distribution and they did not have meaningful roles in the movement network. Therefore, we excluded these small communities from the next step of the analysis.
Figure 7 shows that the pattern of change in the total number of communities was exactly the same as the change in the number of small communities. That is, the increase in the total number of communities was due to the increase in the number of fragmented small communities.
The number of significant communities showed a slight decrease, and the min # of facilities in significant communities showed an overall increase. The number of significant communities decreased over time, and the size of each significant community increased over time indicating that significant communities that were separated in the past tended to aggregate over time.
Figure 8 and Figure 9 show the geographical distribution of facilities belonging to nine significant communities from the summer 2015 data, which had the most representative aspects. As expected, the figure shows that livestock facilities belonging to the same community are clustered in a particular geographical area. However, the clustered area is very large compared to the 10 km boundary that is currently set as the control zone in Korea and extends beyond the boundaries of high-ranked administrative divisions. These results confirm the need to establish biosecurity zones based on the movement networks.
It is not possible to report the distribution of facilities for all seven networks here. For all periods, facilities belonging to the same community were clustered geographically. Therefore, we could distinguish zones based on the distribution of facilities.

3.3. Biosecurity Zone for Livestock Infectious Disease

Figure 10 shows the distribution of administrative units according to the number of facilities that they contained. As shown in Figure 10, few administrative units contained more than 50 facilities in any community (8.82% of the total administrative units). It is possible, therefore, to clearly distinguish between the administrative units in which the facilities belonging to the same community are concentrated and the administrative units where they are not.
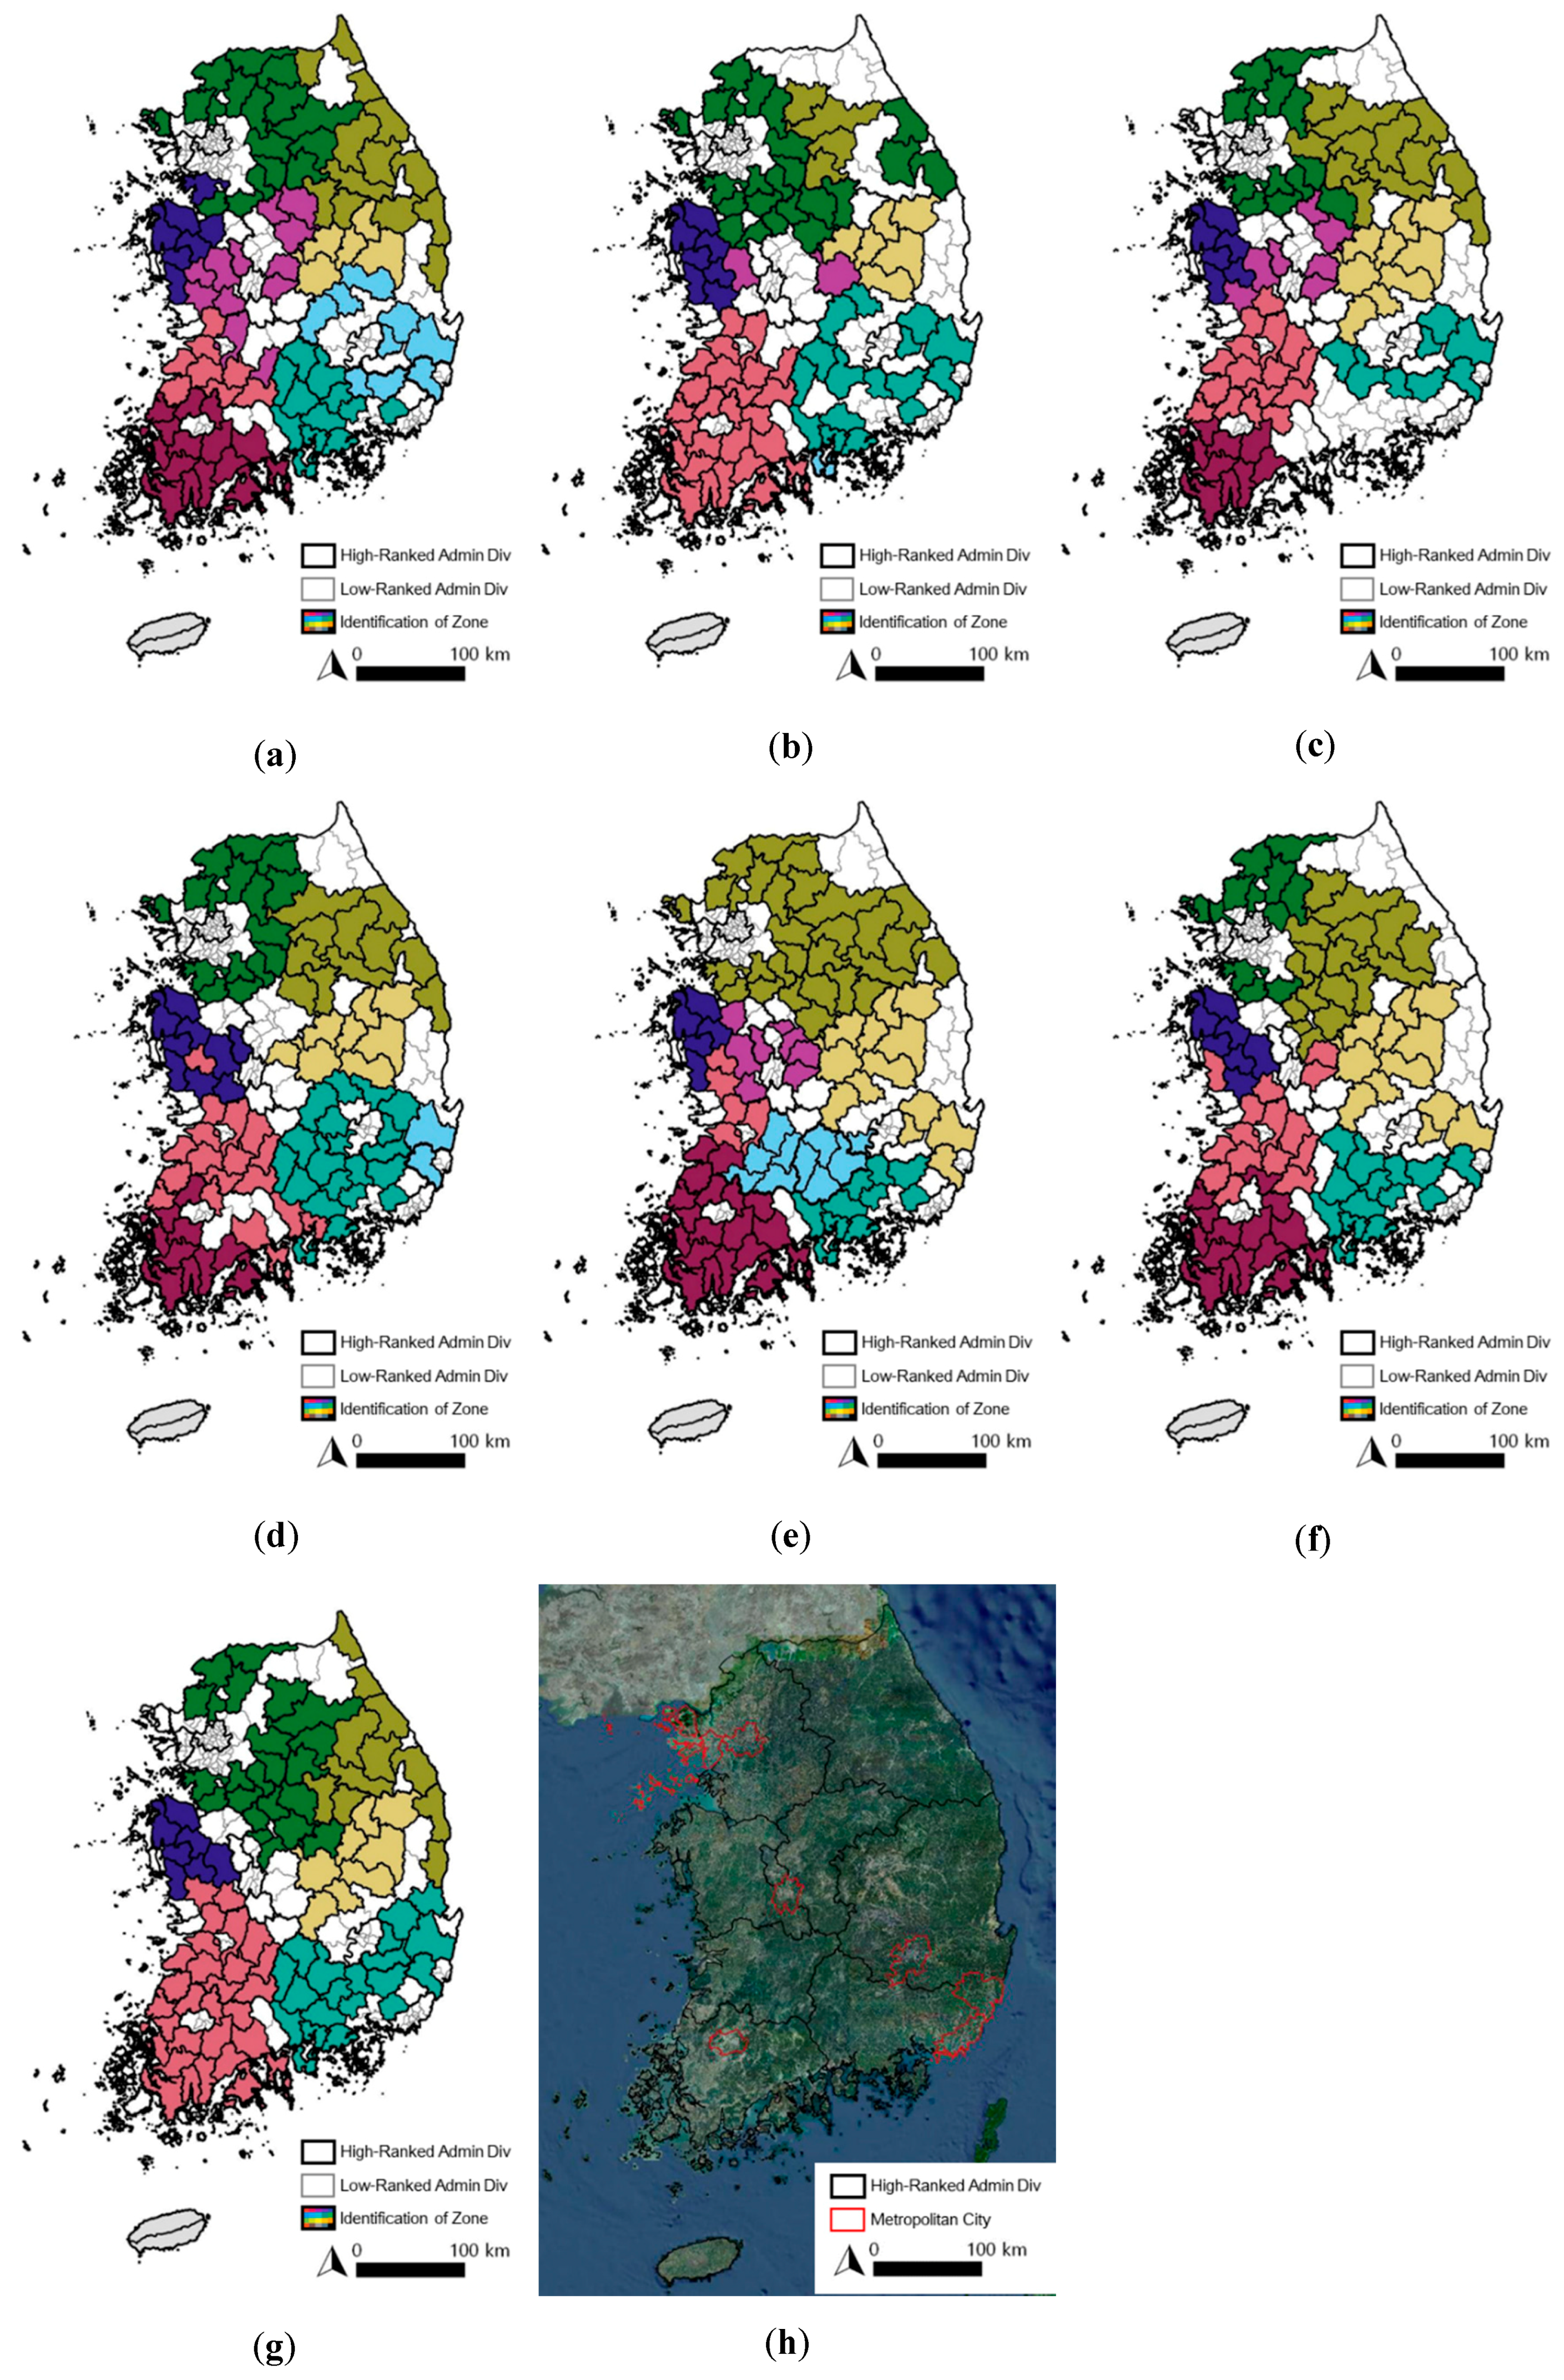
Figure 11 shows the results of identification of zone by time period. The administrative units in which the facilities belonging to a certain community are concentrated are painted in the same color. As described above, the administrative units were divided into two classes through the Jenks Natural Breaks method, and the administrative units included in the upper classes were judged as administrative units in which the facilities were agglomerated. For example, the administrative units painted in blue in Figure 11d are the administrative units where facilities belonging to community F in Figure 8f are agglomerated. Comparing Figure 9 and Figure 11d, we can see that the administrative units where the same community’s facilities are agglomerated are identified as the same zone. The area indicated by the same color in Figure 11 can be judged as the biosecurity zone of the time periods.
Figure 11 shows some administrative units in white, which are administrative units with no agglomerated facilities. In Figure 11h, the dark areas are mountainous areas and red lines on the map represent metropolitan cities. From Figure 11a–g, areas marked in white are mainly found in metropolitan cities and surrounding areas, mountainous areas and coastal areas. In other words, these areas did not contain many livestock facilities.
As the Korean livestock vehicle movement networks changes over time [24], the results of community detection also varied with time. Therefore, the results for the biosecurity zones also differed for each time period. Figure 11 shows the changing patterns of the biosecurity zones that were derived for each time period. As time progressed, the biosecurity zones tended to merge, and the geographical area of a single zone tended to expand. In other words, the area over which facilities had close contact became broader over time.

3.4. Integrated Biosecurity Zone for Livestock Infectious Disease

As expected, Figure 11 shows that the classification of zones varied over time. These results show that it is not appropriate to distinguish biosecurity zones based on data for one particular period.
Seven biosecurity zones were derived by overlaying the zone classifications for each time period. Figure 12 shows the integrated biosecurity zones. In these biosecurity zones, facilities in which vehicle movement frequently occurs are agglomerated. Therefore, if an epidemic occurs in a particular area, the epidemic may spread rapidly within the zone. Currently, a 10 km radius and high-ranked administrative divisions are being used as the control zones in Korea. However, as shown in Figure 12, the biosecurity zones are much larger than 10 km and differ considerably from high-ranked administrative unit boundaries. Therefore, these biosecurity zones are expected to complement conventional control zones.

3.5. Implication

The results of this study have a number of policy implications. First, it is necessary to establish biosecurity zones that take epidemiological situations into consideration. In Korea, high-ranked administrative divisions are simply used as secondary control zones. However, the results of this study show that the spatial range in which vehicle movements between facilities occur differs from the spatial range of the high-ranked administrative divisions. Therefore, there is a high possibility that the current control zones will fail to effectively prevent the spread of an epidemic.
Second, the establishment of collective inter-municipality governance beyond the boundary of each municipality is necessary. As described above, the biosecurity zones based on the movement of livestock vehicles are very different from the boundaries of the present administrative units. Therefore, it is necessary to establish governance that enables uniform quarantine activities beyond the boundaries of the individual administrative unit and the central government should provide institutional and financial support for this.

3.6. Limitations and Future Study

A limitation of this study is that it considers only the movement of livestock vehicles as an epidemiological factor for deriving the biosecurity zones. However, in addition to vehicle movements, many factors are involved in the propagation of livestock epidemics. For example, migratory birds play an important role in the propagation of AI. Therefore, future studies should examine a range of epidemiological factors in order to derive more specialized biosecurity zones.
To comprehensively consider potential epidemiological situations, separate analyses for different species are needed. In Korea, some farms raise different kinds of animals together, but the KAHIS DB only lists the representative species of each farm, that is, it does not provide information on all species. Under these circumstances, it is less useful and reliable to construct networks separated by species and in this study, all the livestock related facilities were included in one network without distinguishing the species. In the future, additional data should be collected to support studies that derive biosecurity zones by species.
Using only three years of data is an additional limitation of this study. If longer-term data are available in the future, it will be possible to monitor the changing patterns in vehicle movement networks over longer time periods and to forecast the changes in the biosecurity zones.

4. Conclusions

This study derived biosecurity zones based on vehicle movement networks, which have received relatively little attention. To accomplish this, we constructed seven vehicle movement networks based on vehicle entry data and applied community detection analysis, Jenks natural breaks method and overlay techniques to identify biosecurity zones.
The size and density of livestock vehicle movement networks change with time. The density of networks tended to increase in summer and decrease in winter. The total number of communities increased over the study period, due to the increase in the number of fragmented small communities. However, the number of significant communities declined and tended to aggregate over time.
Facilities belonging to the same community were clustered geographically and it was possible, therefore, to distinguish between those administrative units that included many facilities belonging to a particular community and administrative units that did not. As the number of significant communities decreased over time, the number of biosecurity zones also decreased. As a result, biosecurity zones tended to merge, and the geographical range of any single zone expanded. Therefore, the danger of propagation when diseases occur is also increased.
Seven biosecurity zones were identified, and these are very different from the conventional control zones used in Korea. Therefore, these biosecurity zones can be used as an alternative control zone to complement existing zoning systems in Korea. It is well known that zoning is crucial to prevent the spread of animal infectious diseases and that movement networks play a major role in spreading these diseases. Nonetheless, network-based zones have received less research attention than network-based compartments. Furthermore, many countries do not consider the full suite of epidemiological factors, but simply establish the zones based on straight-line distance or administrative boundaries. In this situation, this study is meaningful in that it suggests biosecurity zones to control the spread of infectious diseases based on movement networks.

Author Contributions

Conceptualization, G.-J.L., S.-I.P., K.-N.L. and S.H.; Writing—original draft preparation, S.H.; Data Curation, G.-J.L.; Methodology, G.-J.L. and S.H.; Resources, K.-N.L.; Writing—review and editing, G.-J.L., S.-I.P., K.-N.L. and S.H.

Funding

This research was supported by a grant from the Animal and Plant Quarantine Agency (APQA), Republic of Korea. (No. 1545015379).

Conflicts of Interest

The authors declare no conflict of interest.

References

  1. Park, J. Livestock Epidemic When It Gets Cold...It Is Useless to Use the 4 Trillion Won. Available online: http://www.edaily.co.kr/news/read?newsId=01390726616121456&mediaCodeNo=257&OutLnkChk=Y (accessed on 9 January 2019).
  2. Lee, S.; Lee, E.; Hong, S.; Kim, U. Issue & Analysis (272); Gyeonggi Research Institute: Suwon, Korea, 2017; pp. 1–26. [Google Scholar]
  3. Scott, A.; Zepeda, C.; Garber, L.; Smith, J.; Swayne, D.; Rhorer, A.; Kellar, J.; Shimshony, A.; Batho, H.; Caporale, V.; et al. The concept of compartmentalisation. Rev. Sci. Tech. 2006, 25, 873–879. [Google Scholar] [CrossRef]
  4. Office International des Epizooties. OIE Terrestrial Animal Health Code; OIE: Paris, France, 2018. [Google Scholar]
  5. Livingstone, P.G.; Ryan, T.J.; Hancox, N.G.; Crews, K.B.; Bosson, M.A.J.; Knowles, G.J.E.; McCook, W. Regionalisation: A strategy that will assist with bovine tuberculosis control and facilitate trade. Vet. Microbiol. 2006, 112, 291–301. [Google Scholar] [CrossRef]
  6. Gemmeke, E.A.; Batho, H.; Bonbon, E.; de Leeuw, P.W.; Bruschke, C. Compartmentalisation and zoning: The Dutch perspective. Rev. Off. Int. Epizoot. 2008, 27, 679–688. [Google Scholar] [CrossRef]
  7. Garner, M.G.; Lack, M.B. An evaluation of alternate control strategies for foot-and-mouth disease in Australia: A regional approach. Prev. Vet. Med. 1995, 23, 9–32. [Google Scholar] [CrossRef]
  8. Stone, D.M. OIE Standards on Zoning and Compartmentalisation and Their Implementation; OIE: Paris, France, 2017; p. 31. [Google Scholar]
  9. Farsang, A.; Frentzel, H.; Kulcsár, G.; Soós, T. Control of the Deliberate Spread of Foot-and-Mouth Disease Virus. Biosecur. Bioterror. Biodef. Strateg. Pract. Sci. 2013, 11, S115–S122. [Google Scholar] [CrossRef]
  10. Ministry of Agriculture, Food and Rural Affairs Guidelines for the Prevention of FMD; Ministry of Agriculture, Food and Rural Affairs: Sejong, Korea, 2018.
  11. Ministry of Agriculture, Food and Rural Affairs Guidelines for the Prevention of Avian Influenza; Ministry of Agriculture, Food and Rural Affairs: Sejong, Korea, 2018.
  12. Nickbakhsh, S.; Matthews, L.; Reid, S.W.J.; Kao, R.R. A metapopulation model for highly pathogenic avian influenza: Implications for compartmentalization as a control measure. Epidemiol. Infect. 2014, 142, 1813–1825. [Google Scholar] [CrossRef]
  13. Büttner, K.; Krieter, J.; Traulsen, A.; Traulsen, I. Static network analysis of a pork supply chain in Northern Germany-Characterisation of the potential spread of infectious diseases via animal movements. Prev. Vet. Med. 2013, 110, 418–428. [Google Scholar] [CrossRef]
  14. Fèvre, E.M.; de Bronsvoort, B.M.C.; Hamilton, K.A.; Cleaveland, S. Animal movements and the spread of infectious diseases. Trends Microbiol. 2006, 14, 125–131. [Google Scholar] [CrossRef]
  15. Green, D.M.; Kiss, I.Z.; Kao, R.R. Modelling the initial spread of foot-and-mouth disease through animal movements. Proc. R. Soc. B Biol. Sci. 2006, 273, 2729–2735. [Google Scholar] [CrossRef] [Green Version]
  16. Lentz, H.; Koher, A.; Hövel, P.; Gethmann, J.; Sauter-Louis, C.; Selhorst, T.; Conraths, F. Disease Spread through Animal Movements: A Static and Temporal Network Analysis of Pig Trade in Germany. PLoS ONE 2016, 11, e0155196. [Google Scholar] [CrossRef]
  17. Park, C. Current Status and Causes of foot-and-mouth disease and Fundamental Preventive Measures; Open Forum Kyeongbuk National University: Daegu, Korea, 2015; p. 13. [Google Scholar]
  18. Jung, K.; Kim, M.; Song, C. Follow-Up Measures for Improvement of the AI Prevention System; Ministry of Agriculture, Food and Rural Affairs: Sejong, Korea, 2015; p. 36.
  19. Kao, R.R.; Danon, L.; Green, D.M.; Kiss, I.Z. Demographic structure and pathogen dynamics on the network of livestock movements in Great Britain. Proc. R. Soc. B Biol. Sci. 2006, 273, 1999–2007. [Google Scholar] [CrossRef] [Green Version]
  20. Dent, J.E.; Kiss, I.Z.; Kao, R.R.; Arnold, M. The potential spread of highly pathogenic avian influenza virus via dynamic contacts between poultry premises in Great Britain. BMC Vet. Res. 2011, 7, 59. [Google Scholar] [CrossRef]
  21. Dent, J.E.; Kao, R.R.; Kiss, I.Z.; Hyder, K.; Arnold, M. Contact structures in the poultry industry in Great Britain: Exploring transmission routes for a potential avian influenza virus epidemic. BMC Vet. Res. 2008, 4, 27. [Google Scholar] [CrossRef]
  22. Martínez-López, B.; Perez, A.M.; Sánchez-Vizcaíno, J.M. Combined application of social network and cluster detection analyses for temporal-spatial characterization of animal movements in Salamanca, Spain. Prev. Vet. Med. 2009, 91, 29–38. [Google Scholar] [CrossRef]
  23. Kiss, I.Z.; Green, D.M.; Kao, R.R. The network of sheep movements within Great Britain: Network properties and their implications for infectious disease spread. J. R. Soc. Interface 2006, 3, 669–677. [Google Scholar] [CrossRef]
  24. Kim, H.; Park, S.; Lee, K.; Lee, G.; Hong, S. Time-Series Changes in Vehicle Contact Network of Livestock Facilities; Korea Academia-Industrial Cooperation Society: Cheonan, Korea, 2018. [Google Scholar]
  25. Office International des Épizooties Infection with Avian Influenza Viruses. Available online: http://www.oie.int/fileadmin/Home/eng/Health_standards/tahc/current/chapitre_avian_influenza_viruses.pdf (accessed on 15 December 2018).
  26. Office International des Épizooties Foot and Mouth Disease. Available online: http://www.oie.int/fileadmin/Home/eng/Animal_Health_in_the_World/docs/pdf/Disease_cards/FOOT_AND_MOUTH_DISEASE.pdf (accessed on 15 October 2018).
  27. Wasserman, S.; Faust, K. Social Network Analysis: Methods and Applications; Cambridge University Press: Cambridge, UK, 1994; ISBN 978-0-521-38707-1. [Google Scholar]
  28. Newman, M.E.J.; Girvan, M. Finding and evaluating community structure in networks. Phys. Rev. E 2004, 69, 026113. [Google Scholar] [CrossRef]
  29. Clauset, A.; Newman, M.E.J.; Moore, C. Finding community structure in very large networks. Phys. Rev. E 2004, 70, 066111. [Google Scholar] [CrossRef] [Green Version]
  30. Shiokawa, H.; Fujiwara, Y.; Onizuka, M. Fast algorithm for modularity-based graph clustering. In Proceedings of the 27th AAAI Conference on Artificial Intelligence, AAAI 2013, Bellevue, WA, USA, 14–18 July 2013; pp. 1170–1176. [Google Scholar]
  31. Wakita, K.; Tsurumi, T. Finding Community Structure in Mega-scale Social Networks. arXiv 2007, arXiv:cs/0702048. [Google Scholar]
  32. NetMiner—Social Network Analysis Software. Available online: http://www.netminer.com/main/main-read.do (accessed on 11 January 2019).
  33. Cromley, R.G. A comparison of optimal classification strategies for choroplethic displays of spatially aggregated data. Int. J. Geogr. Inf. Syst. 1996, 10, 405–424. [Google Scholar] [CrossRef]
  34. Jenks, G. The Data Model Concept in Statistical Mapping. Int. Yearb. Cartogr. 1967, 7, 186–190. [Google Scholar]
  35. McMaster, R.; McMaster, S. A History of Twentieth-Century American Academic Cartography. Cartogr. Geogr. Inf. Sci. 2002, 29, 305–321. [Google Scholar] [CrossRef]
Figure 1. Analysis process: (a) construction vehicle movement network; (b) community detection analysis; (c) geographical distribution of facilities by community; (d) identification of biosecurity zones; (e) overlaying the periodic results.
Sustainability 11 01642 g001
Figure 2. (a) High-ranked administrative divisions; (b) low-ranked administrative divisions.
Sustainability 11 01642 g002
Figure 3. Construction of Vehicle Movement Network.
Sustainability 11 01642 g003
Figure 4. Identification of biosecurity zones.
Sustainability 11 01642 g004
Figure 5. Integration of the results for different time periods: (a) a particular zone for winter 2016; (b) zones that share one or more administrative units with the zone of winter 2016; (c) integrated biosecurity zone.
Sustainability 11 01642 g005
Figure 6. Vehicle Movement Networks by Periods: (a) Total facilities; (b) Total Connection (c) Total Movement; (d) Connections per facility; (e) Movements per facility.
Sustainability 11 01642 g006
Figure 7. Number of communities and facilities.
Sustainability 11 01642 g007
Figure 8. Geographical distribution of livestock facilities by community (summer of 2015): (a) Community A; (b) Community B; (c) Community C; (d) Community D; (e) Community E; (f) Community F; (g) Community G; (h) Community H; (i) Community I.
Sustainability 11 01642 g008
Figure 9. Geographical distribution of livestock facilities belonging to all communities (summer of 2015).
Sustainability 11 01642 g009
Figure 10. Number of administrative units according to the number of community facilities that it contains (summer of 2015): (a) Interval: 10; (b) Interval: 50.
Sustainability 11 01642 g010
Figure 11. Biosecurity zones by time period: (a) winter 2013; (b) summer 2014; (c) winter 2014; (d) summer 2015; (e) winter 2015; (f) summer 2016; (g) winter 2016; (h) topography of Korea.
Sustainability 11 01642 g011
Figure 12. Biosecurity Zones for Livestock Infectious Disease: (a) SMA Zone; (b) Gangwon Zone; (c) Chungnam Zone; (d) Jeonnam Zone; (e) Gyungbuk Zone; (f) Gyungnam Zone; (g) Jeju Zone. Note: Darker grays indicate that the administrative units were more often classified into the same zone at different periods.
Sustainability 11 01642 g012
Table 1. Configuration of data sets by time period.
Data SetTime Periods Included
Winter 2013November 2013, December 2013, January 2014
Summer 2014May 2014, June 2014, July 2014
Winter 2014November 2014, December 2014, January 2015
Summer 2015May 2015, June 2015, July 2015
Winter 2015November 2015, December 2015, January 2016
Summer 2016May 2016, June 2016, July 2016
Winter 2016November 2016, December 2016, January 2017
Table 2. Vehicle Movement Networks by Season.
PeriodFacilitiesTotal ConnectionTotal MovementsConnections Per FacilityMovements Per Facility
Winter 201366,128664,9354,506,59810.0668.15
Summer 201470,043786,4595,304,23411.2375.73
Winter 201475,139821,1935,752,67210.9376.56
Summer 201591,9241,131,4347,314,33612.3179.57
Winter 2015102,6951,095,7377,451,06210.6772.56
Summer 2016134,5201,683,05910,190,75012.5175.76
Winter 2016131,8811,488,5518,963,64611.2967.97
Average96,0471,095,9107,069,04311.2873.76
Note: Facilities shows the number of total facilities contained in the network. If there was one or more vehicle movements between facilities, it was judged that there was a connection between the facilities. Movements refers to the number of vehicle movements between facilities. For example, if there were five vehicle movements between facility A and facility B at that time, the movements between A and B are 5, while the connection between A and B is 1. Total connection is the total number of connections in the network and total movement is the total number of vehicle movements in the network.
Table 3. Results of Community Detection.
PeriodModularityEntire CommunitiesSmall CommunitiesSignificant CommunitiesMax # of Facilities in Small CommunitiesMin # of Facilities in Significant Communities
Winter 20130.642212102615
Summer 20140.6328181014583
Winter 20140.61241594576
Summer 20150.63292093775
Winter 20150.62393098816
Summer 20160.633224881187
Winter 20160.6177707151158
Average0.6235.86278.867.71815.71
Note: Entire communities shows the total number of communities derived from the HN (Heuristic based on Node ration) algorithm for that period. Max # of facilities in small communities refers to the largest number of facilities in small communities and min # of facilities in significant communities means the minimum number of facilities in the significant communities.

