Onshore Oil and Gas Design Schedule Management Process Through Time-Impact Simulations Analyses


1
Dae-Woo Engineering and Construction Co., Project Management Team, 75 Saemunan-Ro, Jongro-Ku, Seoul 03182, Korea
2
Graduate Institute of Ferrous Technology (GIFT), Pohang University of Science and Technology (POSTECH), 77 Cheongam-Ro, Nam-Ku, Pohang 37673, Korea
3
Department of Industrial and Management Engineering, Pohang University of Science and Technology (POSTECH), 77 Cheongam-Ro, Nam-Ku, Pohang 37673, Korea
4
Florida Institute of Technology, 150 West University Blvd., Melbourne, FL 32901, USA
*
Author to whom correspondence should be addressed.
Sustainability 2019, 11(6), 1613; https://doi.org/10.3390/su11061613
Submission received: 30 December 2018
/
Revised: 13 March 2019
/
Accepted: 14 March 2019
/
Published: 17 March 2019
(This article belongs to the Special Issue Project Management Practices for Sustainable EPC Projects Submission)
Abstract
:Korean oil and gas contractors have recently incurred significant losses due to improper engineering performance on EPC (engineering procurement and construction) projects in overseas markets. Several previous studies have verified the significant impact engineering has on EPC construction cost and project lifecycle. However, no literature has studied the time impact engineering has on EPC projects, representing a gap in the existing body of knowledge. To fill this gap, a Monte Carlo simulation was performed with the Pertmaster, Primavera risk analysis software for three sample onshore oil and gas projects. From said simulation of all major EPC critical activities, the authors found that the engineering phase is up to 10 times as impactful as the procurement and construction phases on the overall schedule duration. In assessing the engineering activities, the authors found the piping design activities to have the greatest impact on the overall schedule performance. Using these findings, the authors present a design schedule management process which minimizes the delays of project completion in EPC projects. Said process includes the following six steps: (1) Milestone management, (2) drawing status management, (3) productivity management of engineering, (4) interface management, (5) management of major vendor documents, and (6) work front management. The findings of this paper add to the body of knowledge by confirming the design phase to be the most impactful on the overall project schedule success. Furthermore, the presented design schedule management will aid industry with successfully executing the design phase in a timely manner, including examples from case study projects for a greater understanding.
1. Introduction
The Korean oil and gas industry has suffered significant market difficulties recently due to a multitude of reasons. A downturn in demand due to falling oil prices, concentration on downstream versus upstream sectors, and a heavy dependency on the Middle East and Southeast Asia have all negatively impacted the industry. Furthermore, Korean oil and gas contractors have experienced a loss in profitability due to project management issues caused by executing Engineer, Procure, and Construct (EPC) megaprojects. This has mainly included inefficiencies of the project management system, errors in the design phase, and inefficiency of logistics management due to vendor departure. While all important areas of study, the design must be carried out precisely so that procurement and construction can proceed smoothly. Many EPC projects are fast-tracked with detailed design, procurement, and construction occurring concurrently. As such, the detailed design cannot be achieved properly, often damaging the project via schedule and/or cost impacts. Thus, this paper identifies the most impactful activities, developing a design management system to maximize engineering resources and minimize delays.
1.1. Existing Literature on Front-End Loading and EPC Scheduling
Existing literature has frequently emphasized the importance of front-end planning and front-end loading (FEL) as they relate to design excellence. Morgan identified the most impactful front-end planning, pre-EPC contract execution, factors that affect project management to maximize project efficiencies [1]. Van der Weijde analyzed the impact of front-end loading (FEL) on cost and schedule performance based on a holistic FEL literature review finding correlations between cost predictability, cost-effectiveness, schedule predictability, and schedule effectiveness [2]. Jergeas focused on the FEL 1, 2, and 3 planning phases in mega projects such as Alberta oil sands projects. They present the effort needed to deliver mega projects, provide schedule comparisons of key engineering milestones, and analyze scope changes and contingencies [3]. The Construction Industry Institute (CII) analyzed the effect of front-end schedule reduction by applying the Project Development Rating Index (PDRI) to evaluate project completeness [4]. Shlopak et al. addressed issues related to planning within the pre-contract phase and their impact on lean construction on shipbuilding projects [5]. Through case studies on the application of the FEL process on several mega shipbuilding projects, they present a FEL process tailored to the shipbuilding industry [5]. Through several case studies and subject matter experts, Baron presents the oil and gas design process as performed by the EPC contractor through the front-end engineering design (FEED) in great detail [6]. The examples in the literature presented above have all found the FEL process and activities, specifically the design/engineering activities, to have a significant impact on the life cycle performance of EPC projects.
To ensure EPC contractors maximize their design/engineering efficiencies, Merrow suggests owners perform extensive FEED activities to lessen the contractor’s design burden [7]. The EPC technical committee of the Korea Plant Institute (KPI) finds design efficiencies to be most important in EPC fast track projects, often implemented in oil and gas projects [8]. However, many Korean EPC onshore and offshore oil and gas contractors have concentrated on achieving highly accurate field designs, leaving their FEED capability poorly developed compared to their global competitors [9,10]. Several studies have attempted to aid the EPC contractor’s FEED efficiencies through schedule optimization. Yeo and Ning proposed an enhanced framework for procurement, combining the concepts of supply chain management and critical chain project management (CCPM) [11]. Their proposed framework widely accommodates cultural, process, and technical approaches. Jo et al. also used the CCPM to develop a schedule delay prevention method for piping construction, found to be essential for project success, incorporating material procurement processes [12]. Lee et al. utilized the Program Evaluation and Review Technique and Critical Path Method (PERT/CPM) and Monte Carlo simulations (MCS) for estimating the appropriate construction duration of coal-fired power plant projects at the planning stage or contracting stage [13].
Alternatively, there have been a number of research papers that utilize Last Planner System (LPS) as a means to maximize schedule efficiencies, though none explicitly discuss EPC projects. El-Sabek and McCabe [14] suggest a framework they developed for managing international megaprojects utilizing lean construction methods and LPS. They argue that the results, findings, and recommendations can be adopted to different types of projects that require integration of subprojects for the success of the project. Castillo et al. [15] found a positive relationship between the implementation level of LPS practices and project performance. The paper suggests potential interrelationships among project social network properties, LPS management practices, and project performance.
1.2. Existing Literature on Scheduling Risks on Infrastructure Construction
Along with proper planning, proper schedule risk management, assessment, and prevention processes can aid in the overall schedule success. Thus, many practitioners and researchers have applied the risk management approach to the assessment and prevention of construction schedule delay [16,17,18,19,20]. Mulholland and Christian [16] propose a system to estimate schedule risks at project initiation developed through subject matter expert knowledge, project-specific information, decision analysis techniques, and a resultant analytical model. Luu et al. applied the Bayesian belief network (BBN) to quantify the probability of construction project delays, identifying sixteen risk factors and eighteen cause-effect relationships through subject matter expert surveys and interviews [17]. Nasir et al. developed an ‘Evaluating Risk in Construction–Schedule Model’ to assist in the determination of the lower and upper activity duration values to be used on PERT and/or MCS schedule risk analyses [18]. Schatteman et al. [19] and Okmen and Oztas [20] have also presented integrated risk management models with correlated scheduling analyses, built off Nasir et al.’s findings. Specific to cost risks in Korean construction, Cha proposed a systematic approach to assessing the effects risk factors which have the greatest impact on the cost performance of EPC projects [21]. Kang et al. also aided international Korean contractors by analyzing the range of cost fluctuations per major risk factors experienced on all EPC stages on overseas plant projects [22]. From a broader perspective, the seminal Project Management Institute “Project Management Body of Knowledge 5th Edition” describes the relationship between risk, uncertainty, and cost/schedule throughout a project’s life cycle [23].
Many researchers have used their identified risk factors to develop optimal risk responses such as schedule acceleration [24,25,26]. Al-Momani [24] and Khodakarami et al. [25] developed quantitative assessment models for construction schedule risk uncertainty. Al-Gahtani [26] proposed a mathematical model that works with the time-cost-trade-off method to estimate the increase in project risk caused by schedule acceleration. Alternatively, several researchers have studied the most common and impactful schedule risks, contractor resource constraints [27,28]. Omer and Cengiz considered fuzzy and crisp multi-mode resource-constrained project scheduling to minimize project duration [27]. Arashpour et al. developed an analytical model to define the optimal product sequencing to maximize production using optimization-based metaheuristics for off-site manufacturers of building elements [28].
Many researchers and practitioners adopted probabilistic analysis approaches for scheduling analysis. Liu performed a holistic literature review, presenting the advantages and disadvantages of common construction schedule risk analysis methods used in the past several decades (i.e., CPM, PERT, MCS, BBN) [29]. Love et al. [30] used a ‘best fit’ probability distribution to ascertain the probability of schedule overruns, based on the schedule performance of 276 construction and engineering projects in Australia. Kirytopoulos et al. [31] argue that MC simulations generate better results than PERT and stress that accurate historical data and suitable distribution are the keys to achieving accurate activity duration estimating. A study by Aziz [32] mentioned software that can generate the expected project completion probability of a contract duration, called repetitive-projects evaluation and review technique (RPERT). Some researchers such as Ahong and Zhang [33], Sakka and El-sayegh [34], and Al-Gahtani [35] focused on the allocation and consumption of float in scheduling analysis, based on the application of PERT and/or MCS. More specifically, Ahong and Zhang’s research proposed a method which calculates the noncritical path float through PERT analysis to identify scheduling uncertainties and reduce the misleading information. Their results showed the consistent path float under required completion probability and required duration [33]. Al-Gahtani introduced a total risk approach for float allocation among project parties to address the controversial issues in the schedule delay claims. They took into consideration the changes in float that may occur as a result of actions that delay or accelerate the project’s schedule [35].
1.3. Point of Departure
As mentioned earlier, there have been many studies on the impact of detailed design on the project cost in EPC project execution. Although there have been some studies on the impact of the detailed design on the project schedule, none of them analyzed the time impact on EPC projects due to the detailed design delays utilizing simulation. Only the approximate schedule impact is analyzed based on the risks of the EPC stage [6]. This paper’s findings most significantly build on Baron’s presented oil and gas engineering guide, presenting specific examples of the proposed oil and gas engineering management process.
2. Data Collection and Research Methodology
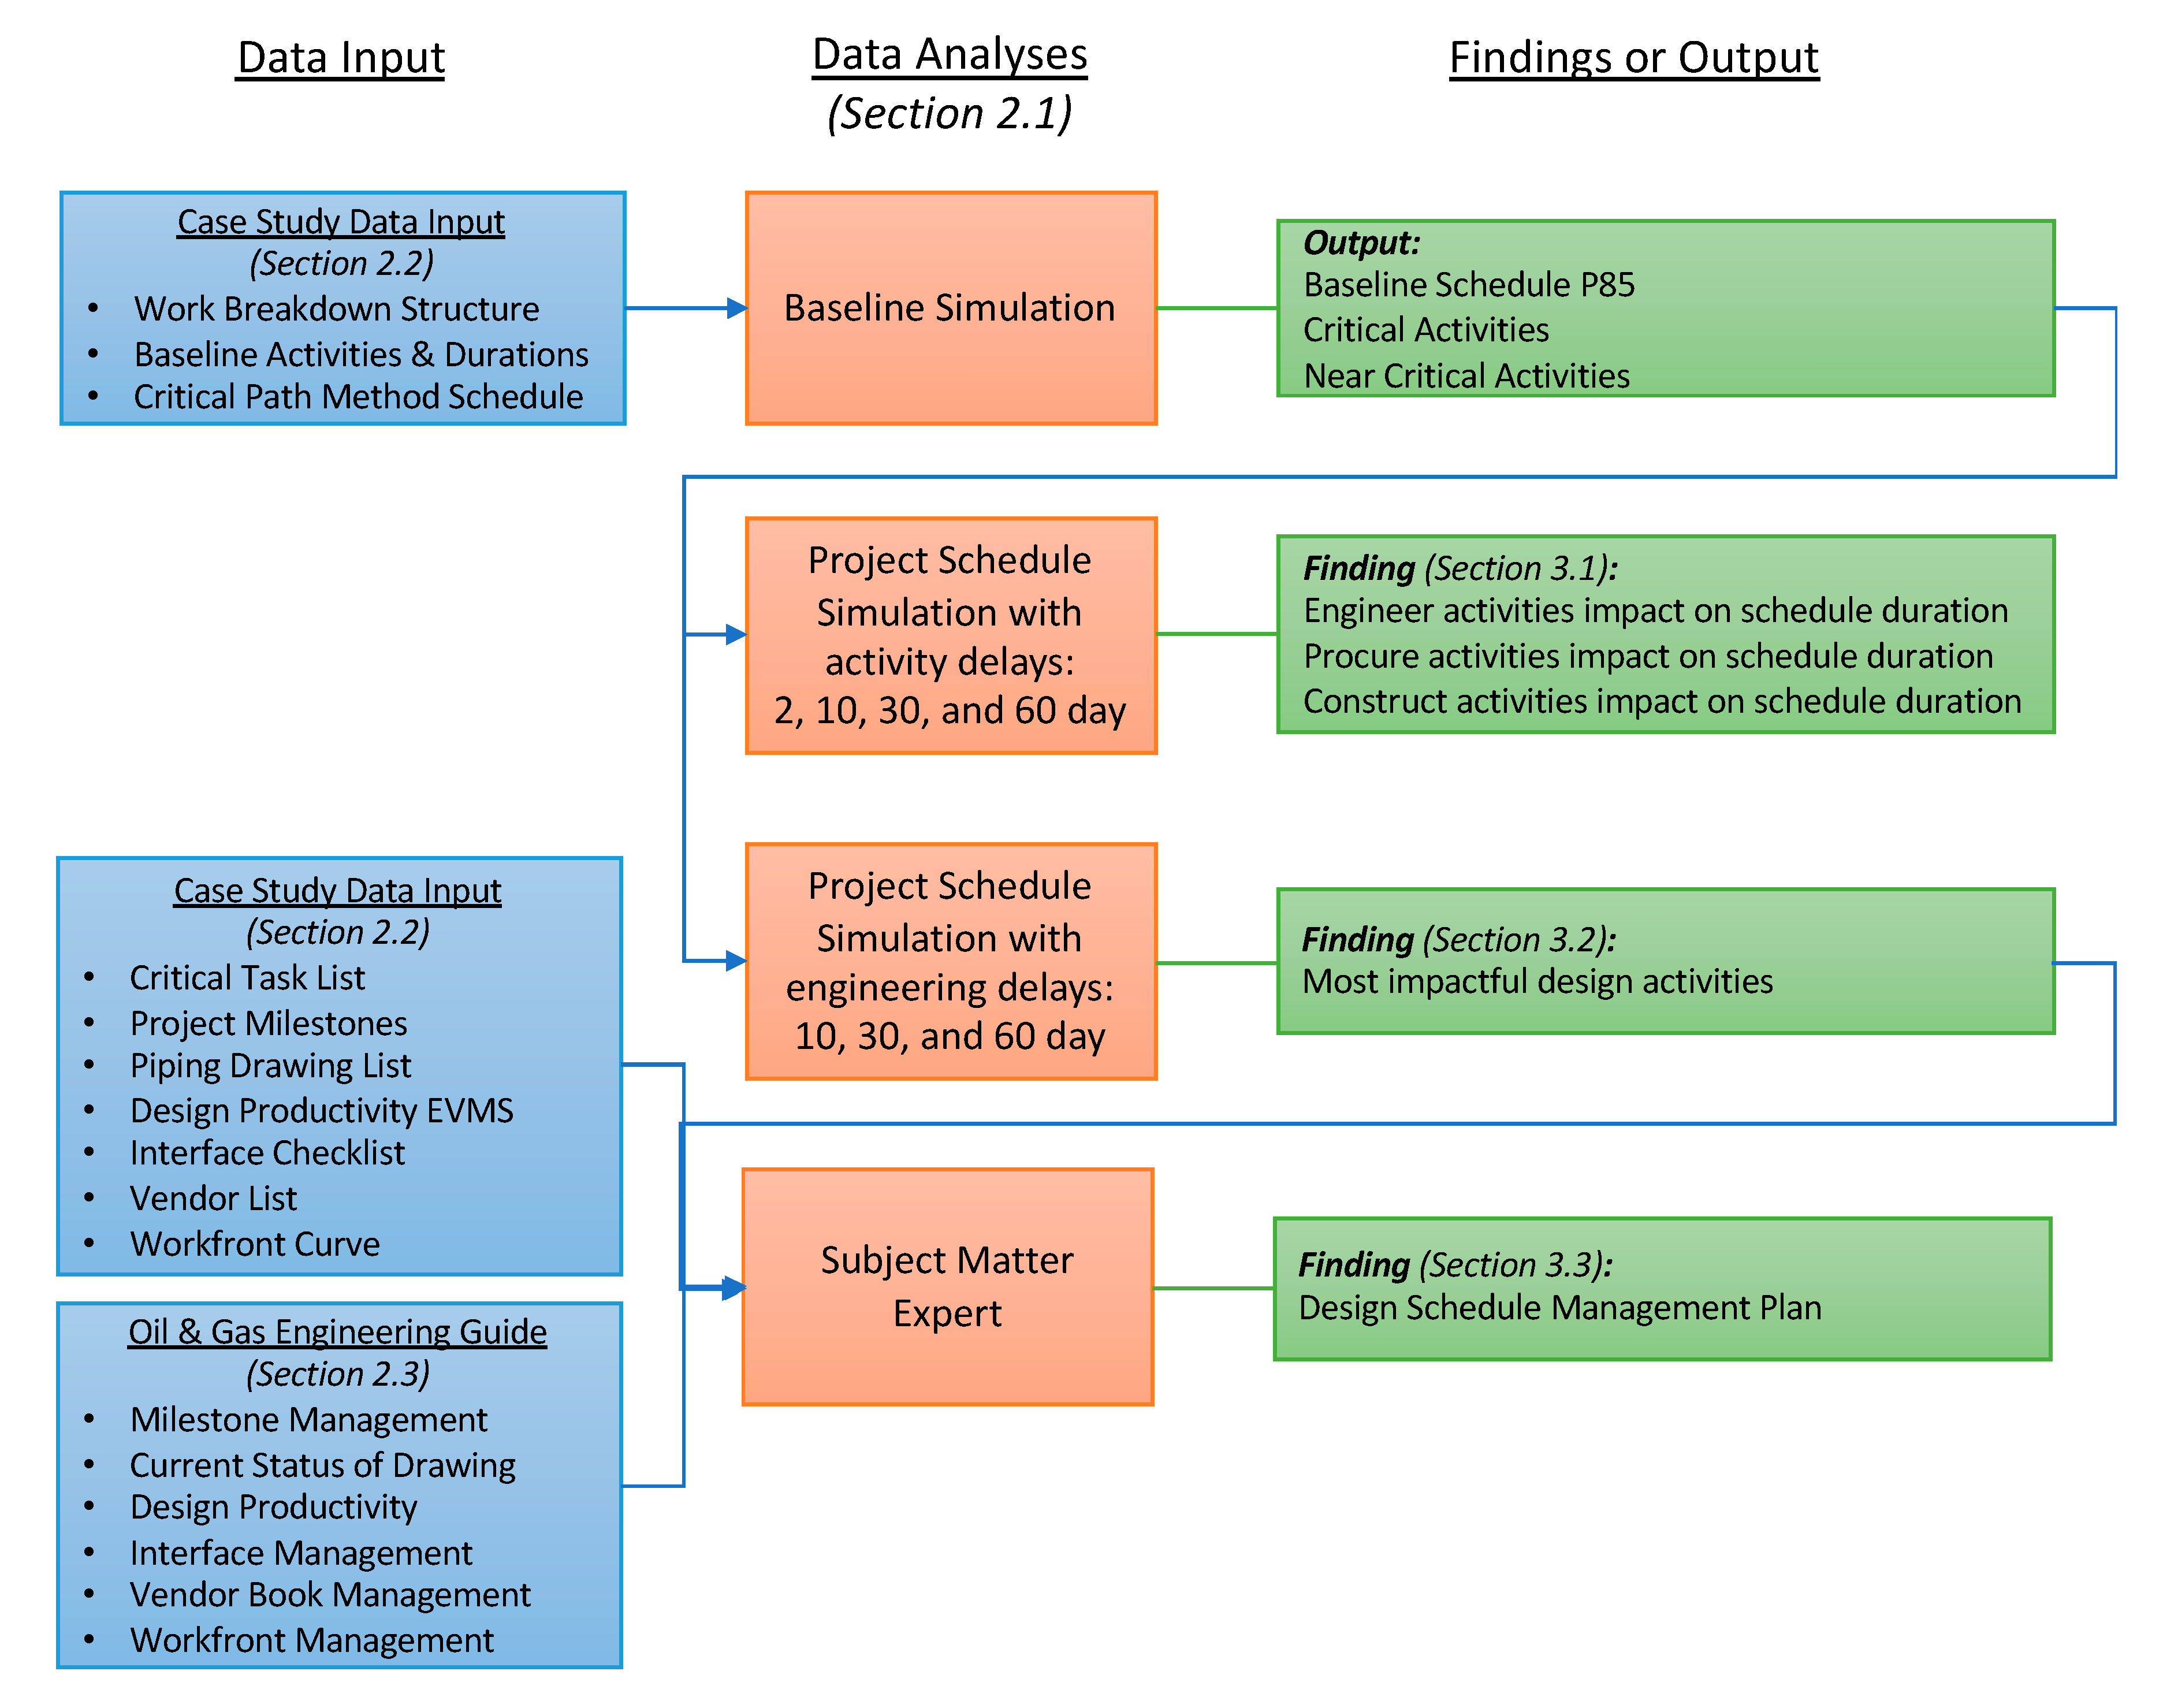
The objective of this study is to investigate the impact design delays have on the schedule performance of an EPC oil and gas project. From these findings, the authors also propose a design management plan which best utilizes contractor resources in the engineering phase. A flow chart of the data collection and research methodology is shown below in Figure 1 and detailed in the following subsections.
2.1. Data Analyses
In order to find the EPC oil and gas activities that have the greatest impact on the project schedule, the authors used MCS analyses. To develop the template design schedule management plan for oil and gas projects, the authors relied on the findings of the MCS supported by subject matter experts. These data analyses methods are described in greater detail below.
2.1.1. Pertmaster Monte Carlo Schedule Simulations
This study performs MCS through the Primavera risk analysis add-on software, Pertmaster, to analyze the schedule and delay impacts. Pertmaster is a comprehensive risk management program with a methodology based on the Project Management Body of Knowledge outlined process. It is a schedule-based risk management tool that applies activity uncertainty and event risk to schedules created by process management such as PERT/CPM, MCS, and Latin Hypercube Simulation. For this study, the Pertmaster Monte Carlo analysis was performed to develop the baseline schedules along with simulating the impacts of the activity delays with the following processes and assumptions:
- The simulation is executed 1000 times for each activity.
- The period risk for each activity is entered as a triangular distribution (pessimistic, most likely, optimistic).
- The impact on the overall schedules is determined as a comparison of the baseline simulation and schedule simulation with delay P85 results. P85 means an 85% probability that the schedule will be completed. After a scheduling simulation, Primavera Risk Analysis can produce the expected completion date of various probabilities. However, in terms of reliability, it is said that the probability of project completion at 80~90% is realistic [36]. Therefore, the research team determined to use the median value of 85%.
- Baseline schedules for case studies were built based on the collected critical path method schedule, activities, and pessimistic, most likely, and optimistic durations. External risks, namely unforeseen risks, were not included in the baseline assessment.
- Project schedule simulation with activity delays was performed on two of the identified most impactful activities for each of the engineering, procurement, and construction from the critical path or near critical path. The near-critical path is defined as tasks with less than 30 days of float. The activities are given 2, 10, 30, and 60 delay days recording the impact on the overall project schedule. From the results, the authors compared which phase’s delays (engineer, procure, or construct) have the most impact on the overall project schedule.
- Project schedule simulation with engineering delays was performed on the identified most impactful design activities on the critical path or near critical path. The activities are given 10, 30, and 60 delay days recording the impact on the overall project schedule. From the results, the authors compared which design activity’s delays have the most impact on the overall project schedule.
2.1.2. Subject Matter Expert: Design Schedule Management Plan
From the simulations, the most impactful design activities are identified. From these findings, along with subject matter experts, the authors developed an oil and gas design schedule management plan. Said plan is based on the oil and gas engineering guide outline, defined in Section 2.3. Subject matter experts included the authors with about 12 years of industry/academic oil and gas experience on average.
2.2. Case Study Projects
To understand the impact the design phase has on EPC schedule performance, the authors collected data on three overseas onshore oil and gas EPC projects performed by a Korean company. Furthermore, the selected projects were all fast-tracked with minimal float so that any delays would directly impact the schedule performance. The three EPC project case studies performed for this study are defined in the following paragraphs.
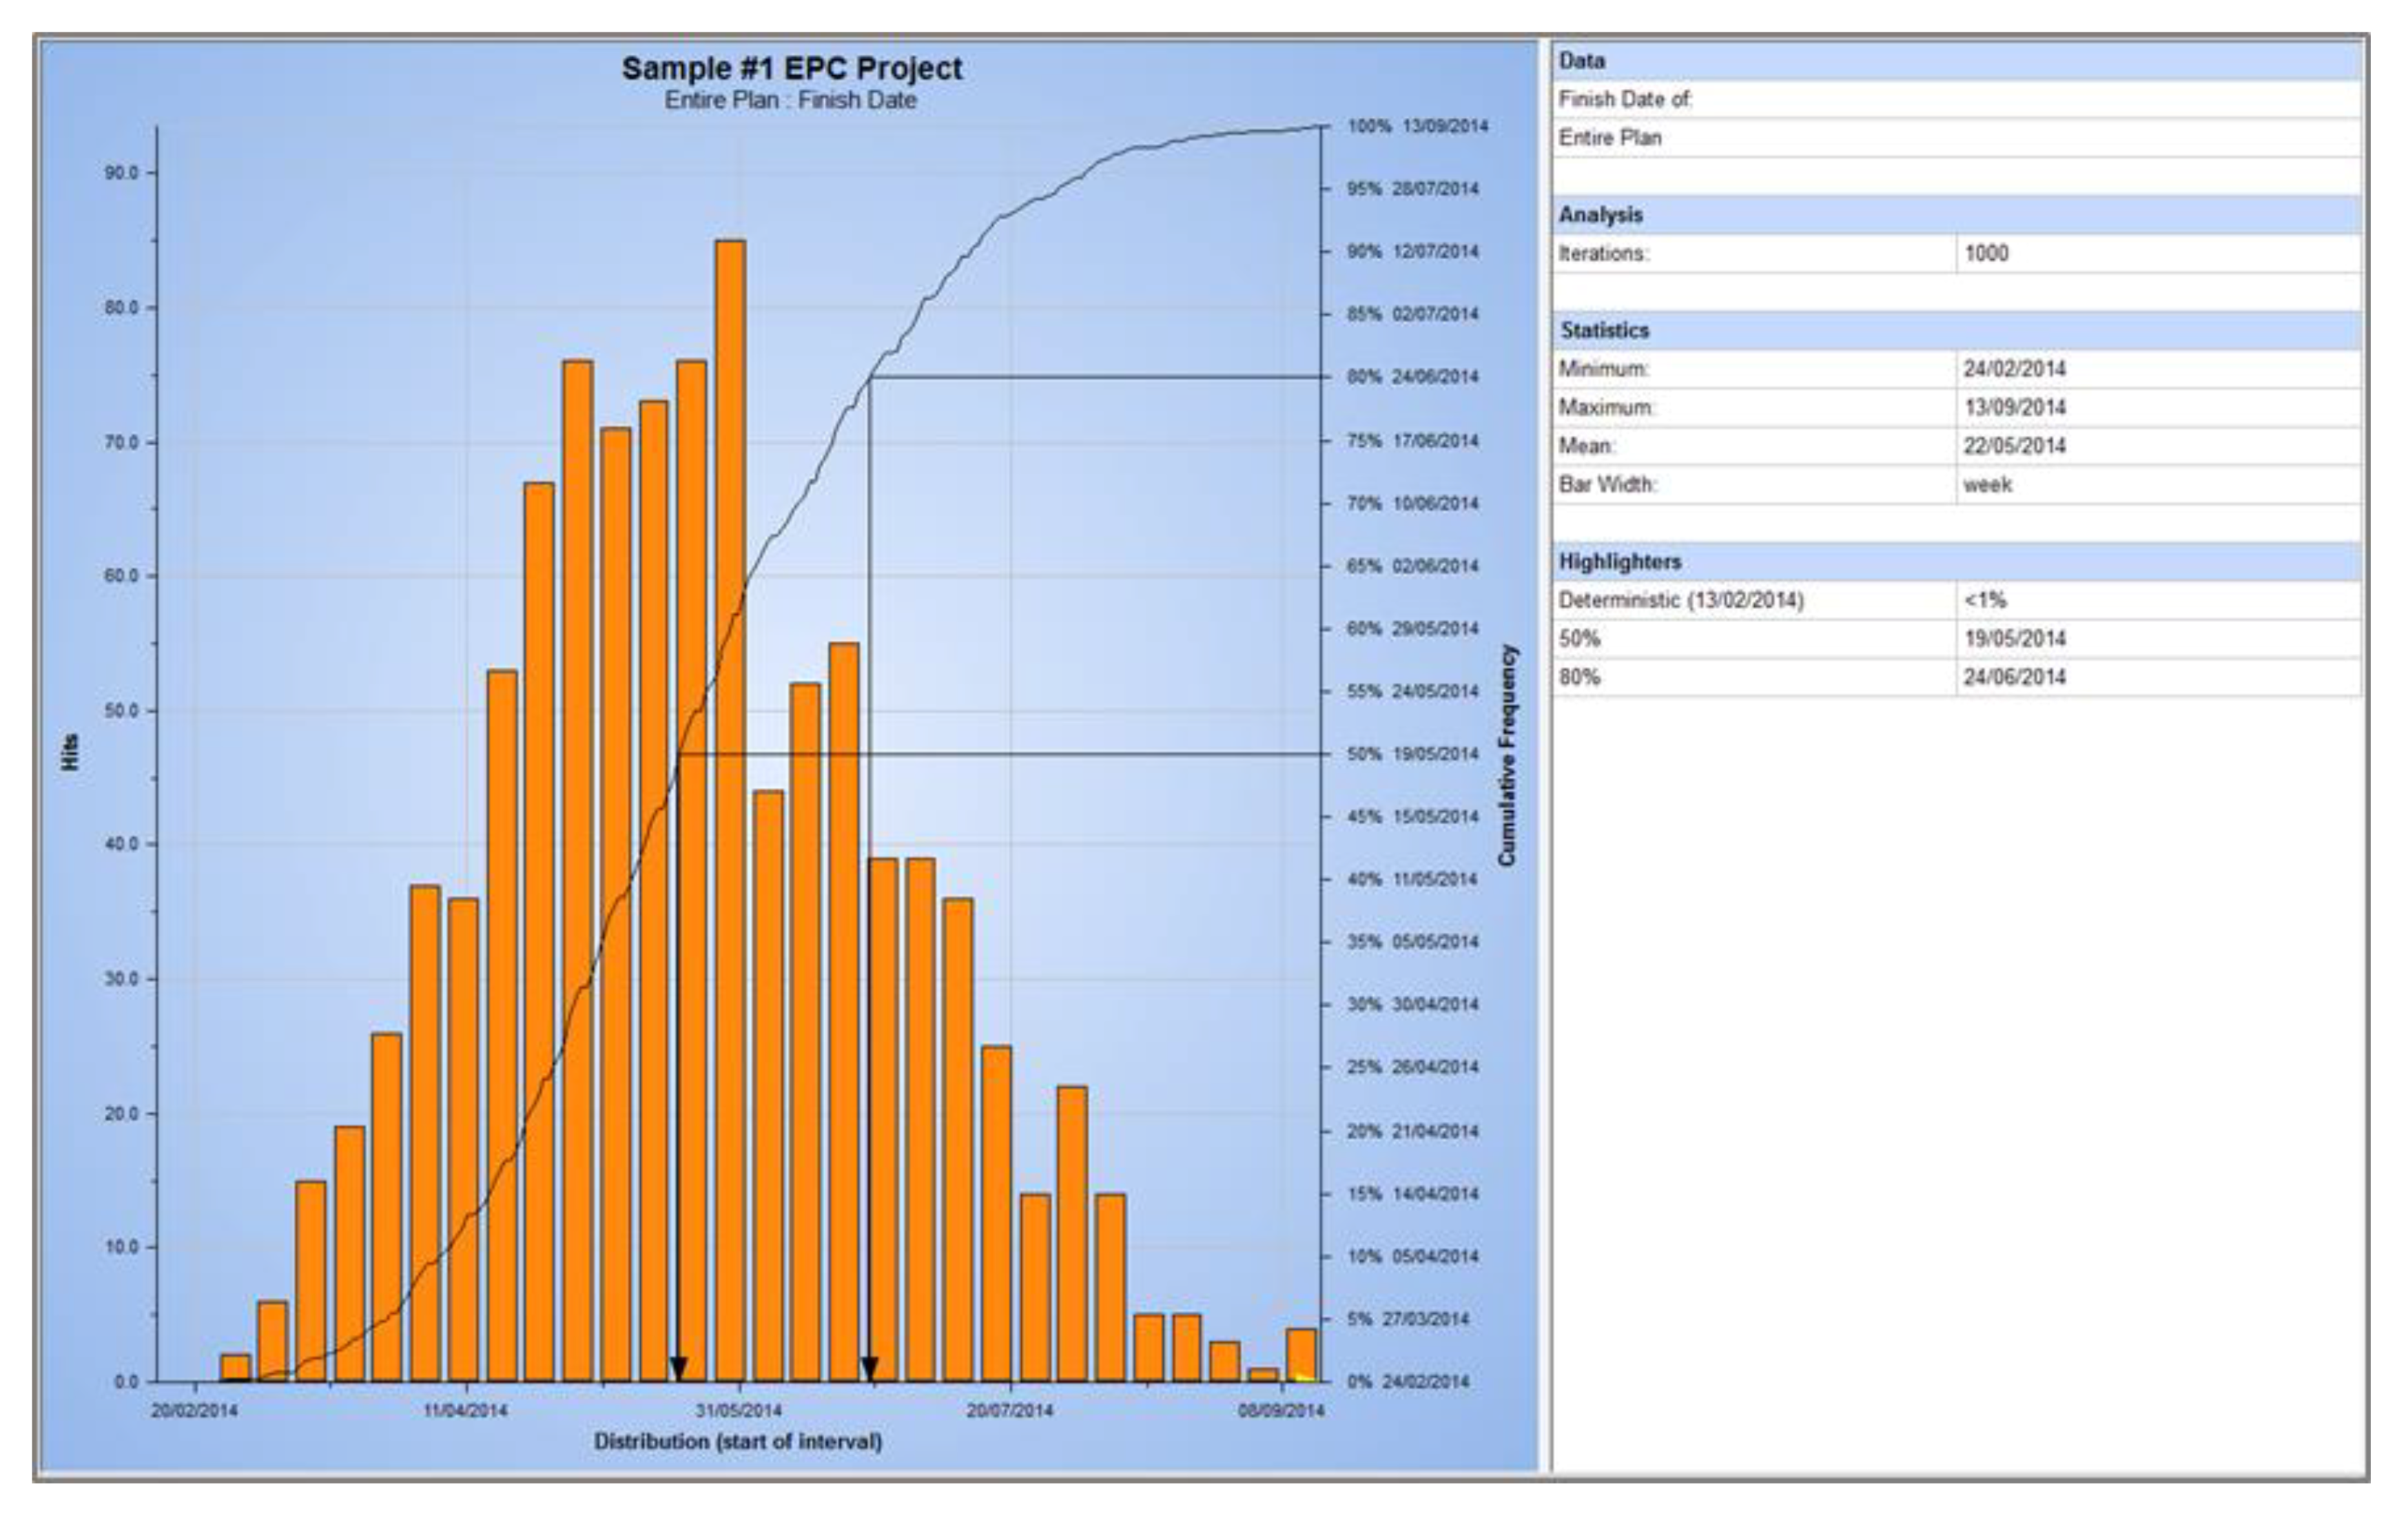
Project 1 has 4400 activities with 8500 relationships. The work breakdown structure (WBS) of the project includes 3% milestone activities (0 duration activities that identify milestones such as design finish, substantial completion, etc.), 41% home office service, 12% manufacturing and delivery, and 44% construction. The home office service tasks were the focus and variable portion of the investigation and include engineering, procurement support services, subcontract management, and contracting. The identified critical activities for Project 1 include the process design basis, piping arrangement drawings in the engineering phase, tank setup, piping, painting, insulation, and commissioning in the construction phase. The baseline, non-delayed schedule results are shown below in Figure 2. As can be seen, there was an 85% chance that the project completion (P85) date was 2 July 2014, which equates to 55 months. Please note, this study assumes no delays were experienced for Projects 1 to 3 as they are outside of the focus of this study. The actual duration of Projects 1 to 3 was longer due to experiencing unforeseen events.
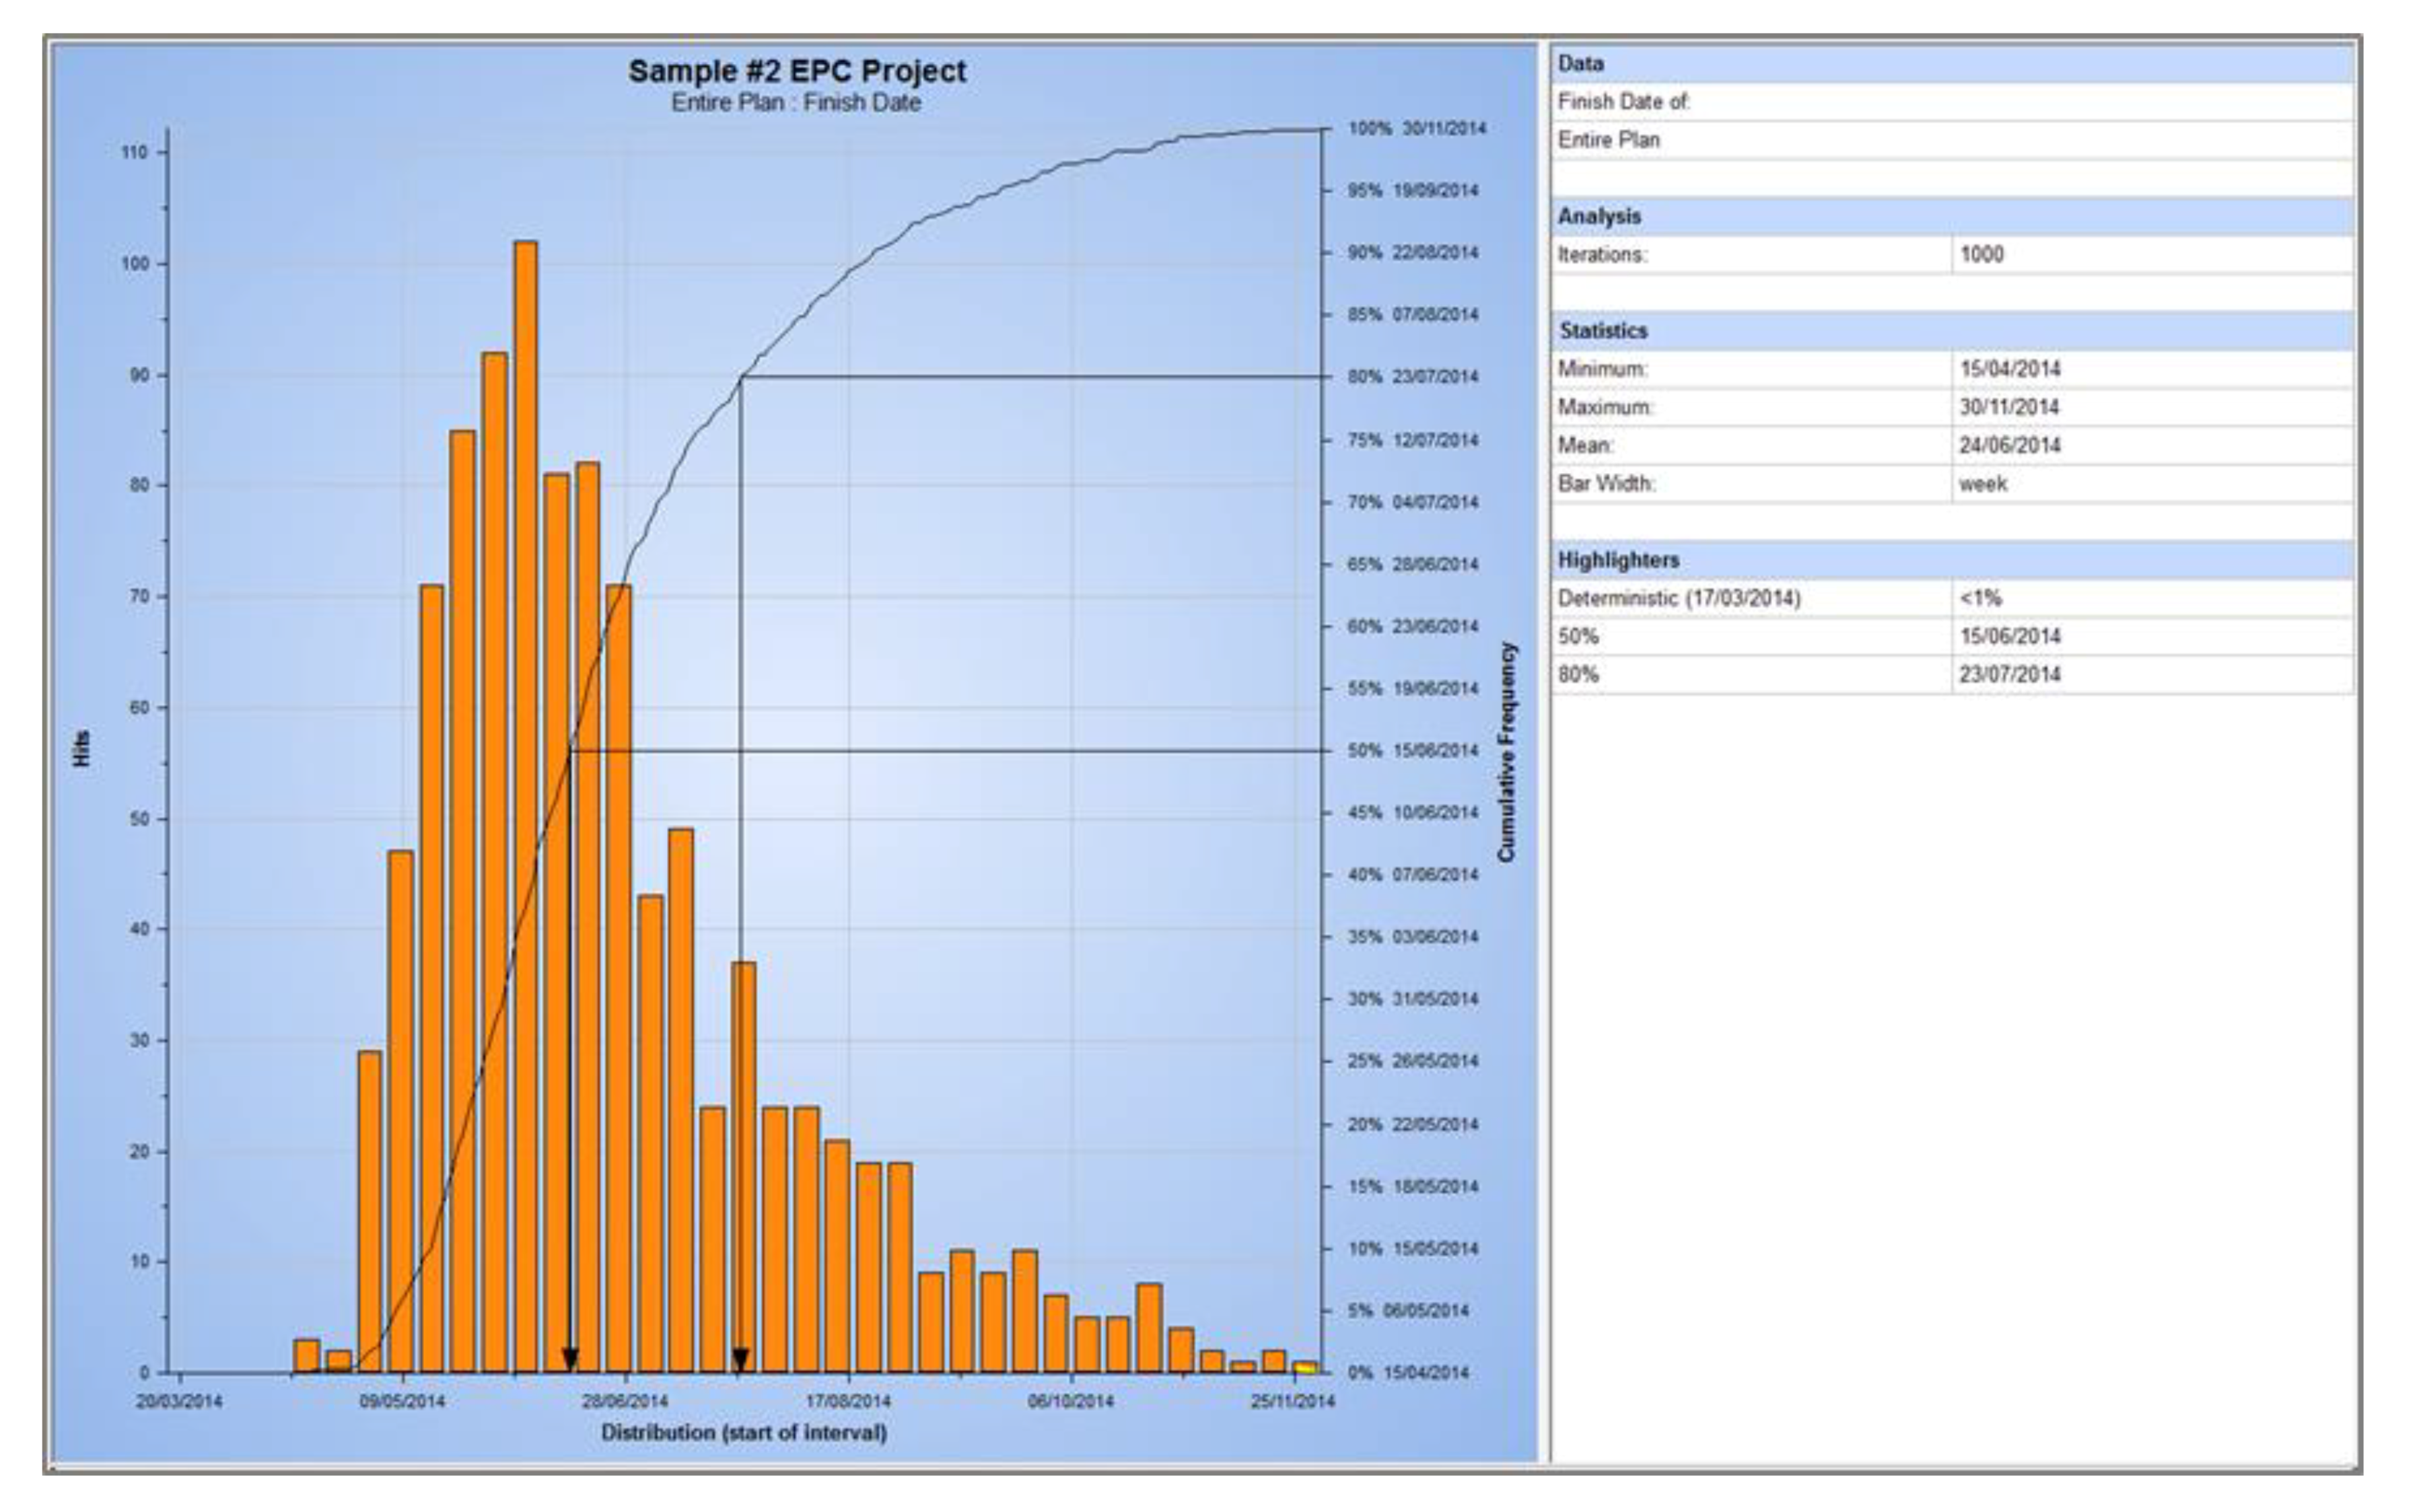
Project 2 has 2100 activities with 3300 relationships. The WBS of the project includes: key milestones (2%); mobilization and project management (1%); engineering (45%); procurement, fabrication and transportation (44%); and construction and site installation, hook-up and tie-ins, pre-commissioning and commissioning, and demobilization (8%). The engineering tasks were the focus and variable portion of the investigation. Critical activities include main compressor package fabrication and procurement, module #1 fabrication and transportation, and central processing facility commissioning. The baseline, non-delayed schedule simulation result is shown below in Figure 3. The simulation P85 showed that the project completion date was 7 August 2014, which required a duration of 42 months.
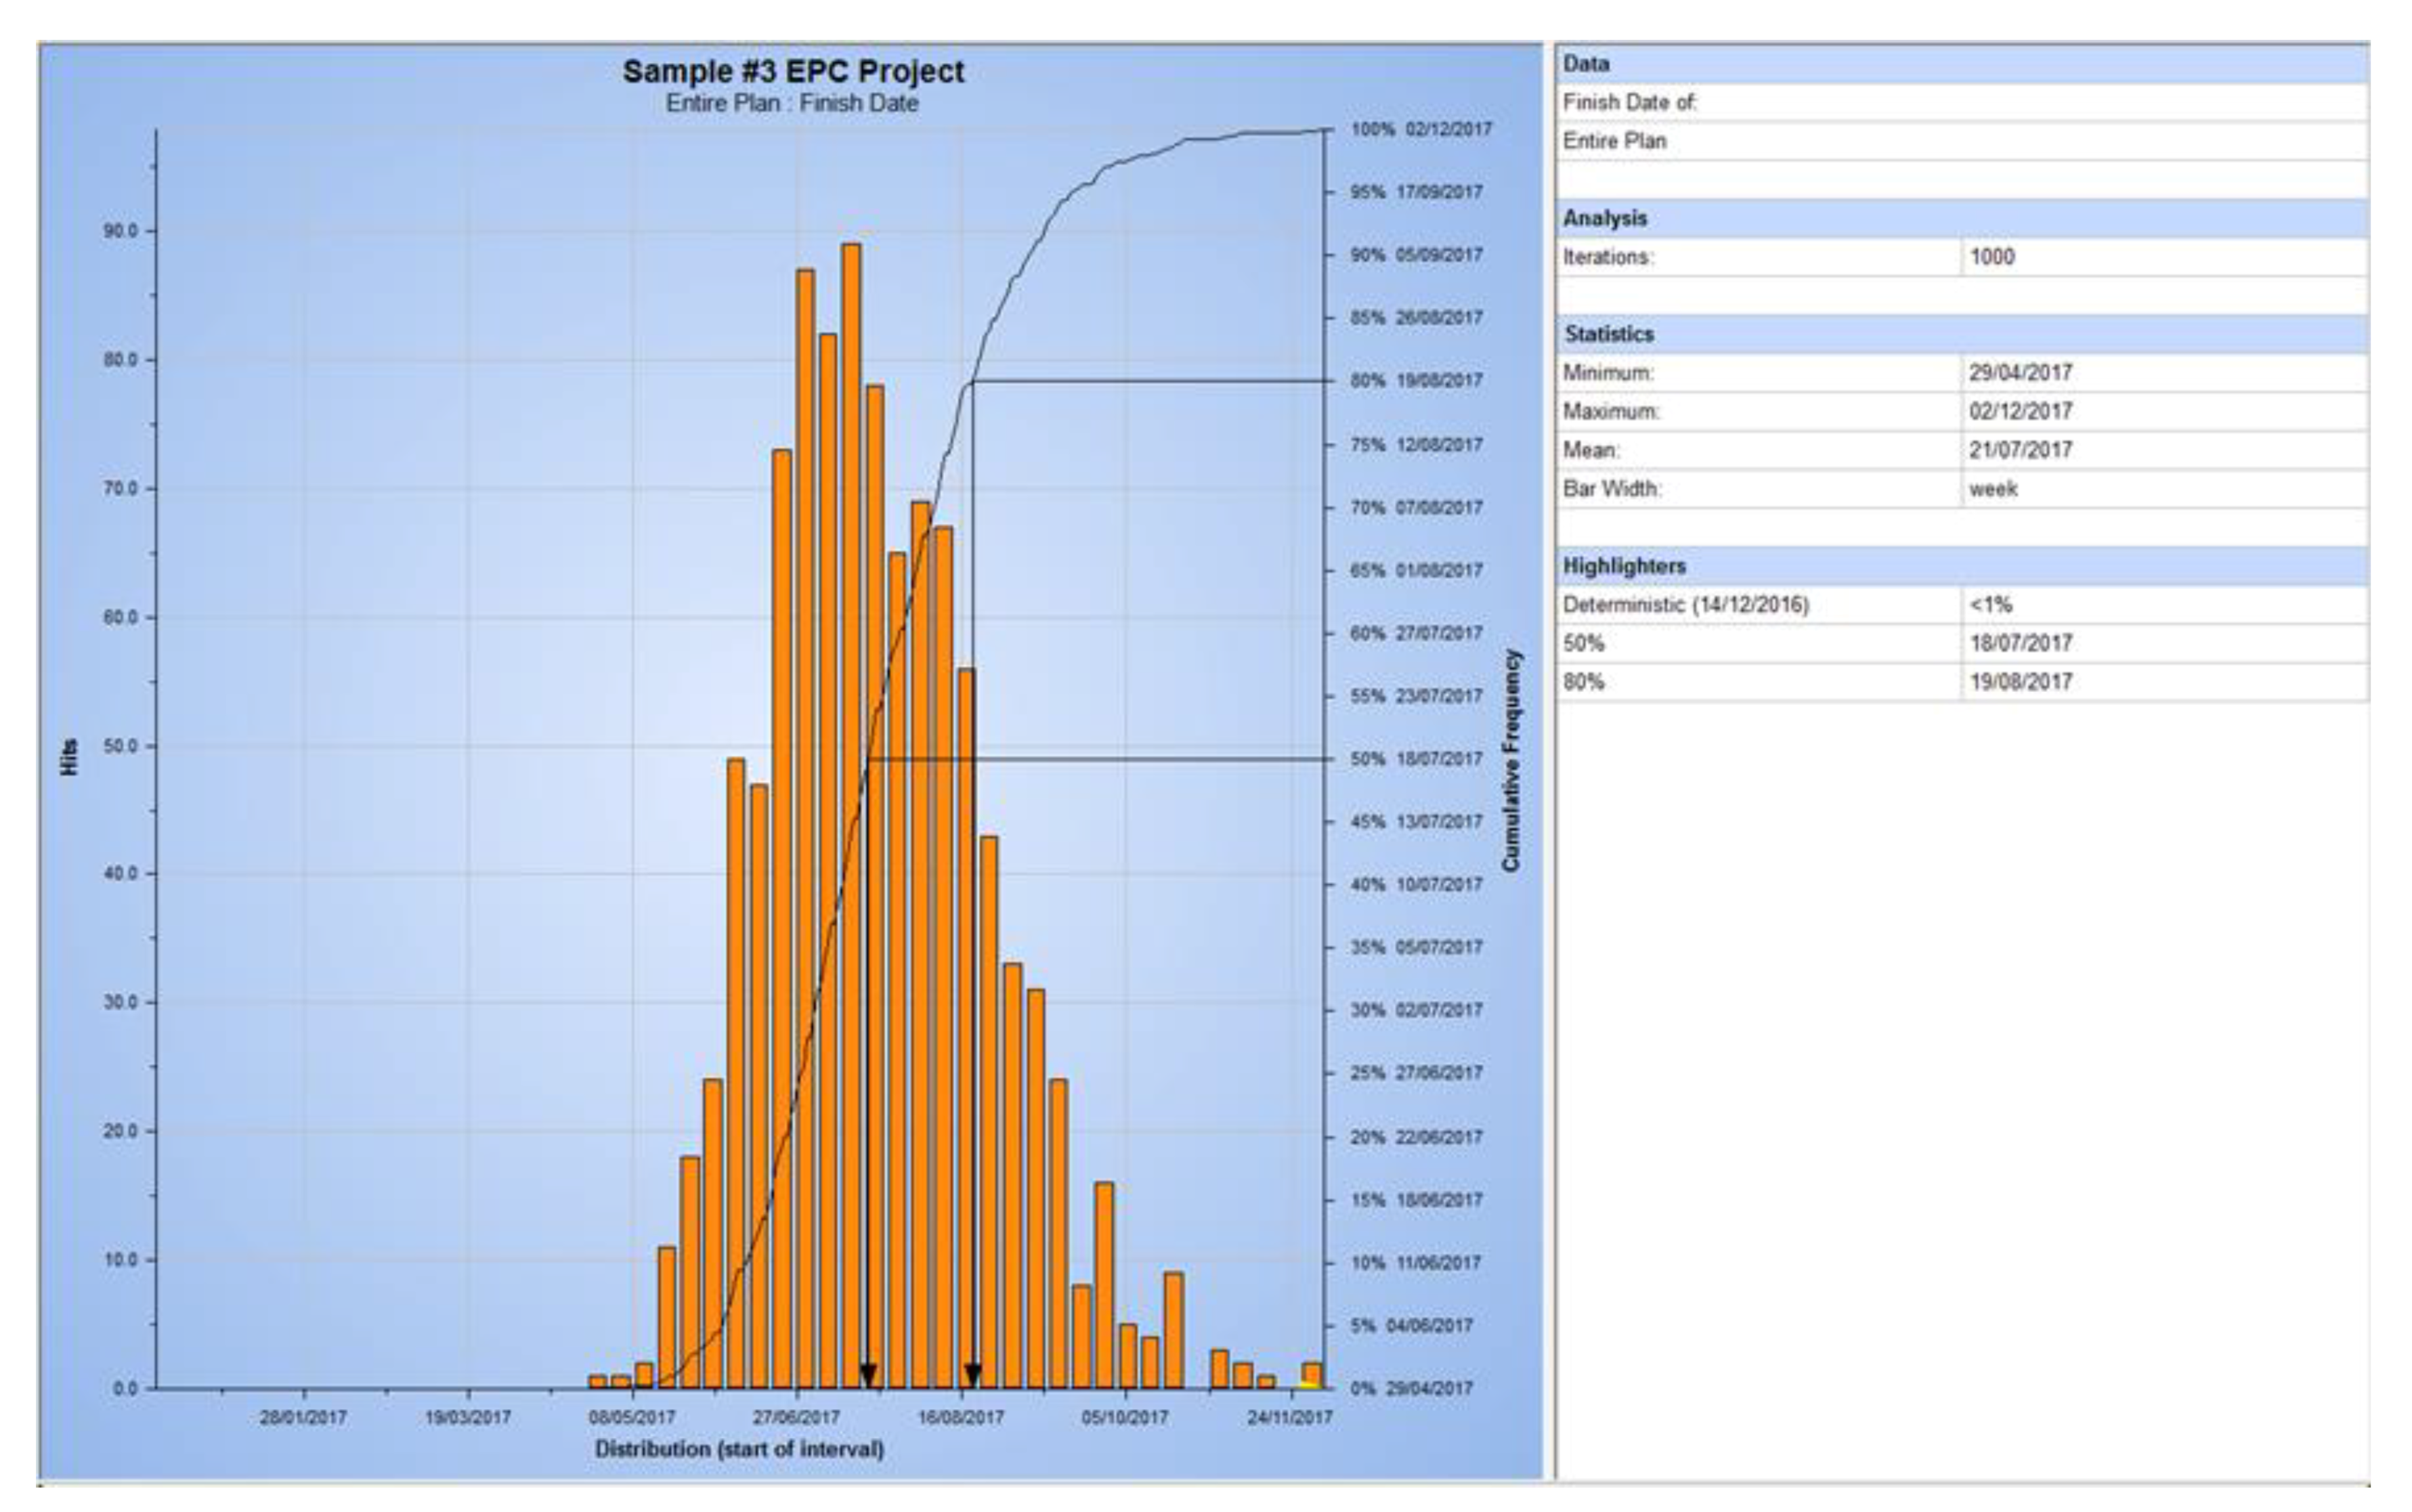
Finally, project 3 has 4000 activities with 13,100 relationships. The WBS of the project includes 1% milestone and project management, 16% engineering, 29% procurement, 42% construction and commissioning, and 12% optional parts. The engineering tasks were the focus and variable portion of the investigation. Critical activities include process, piping, and instrument and control in the engineering phase, mechanical, electrical, and steel structure in the procurement phase, central processing facility, and underground piping offsite in the construction phase. The baseline, non-delayed schedule simulation result is shown below in Figure 4. The simulation P85 showed that the project completion date was 26 August 2017; therefore, requiring a duration of 42 months.
From the CII PDRI, the authors identified eleven task types for industrial projects. Table 1 and Table 2 show the percentage of items in the critical and near critical paths of the three case study projects. As can be seen, the piping tasks have the highest frequency of being on the critical and near critical paths of the eleven tasks. As such, the piping design has the most significant impact on the schedule. The near critical paths are also shown as, when delays occur, said activities have a high probability of affecting the schedule, becoming critical activities.
2.3. Oil and Gas Engineering Guide
Baron developed an oil and gas engineering guide, detailing a suggested methodology to manage the design portion of a project [6]. The authors use said guide’s suggested outline to present a proposed critical and near critical path design management plan. Said proposed management plan uses the oil and gas suggested outline as follows [6]:
- Milestone Management
- Current Status of Drawing Export
- Design Productivity Management
- Interface Management with other design types
- Vendor Print Management
- Work front Management
3. Findings
The findings are presented as follows: Project schedule simulation with EPC activity delays, project schedule simulation with engineering delays, and design schedule management plan.
3.1. Project Schedule Simulation with EPC Activity Delays
Table 3 shows the results of the project simulation, increasing the two most impactful engineer, procure, and construct activities (total six activities) by 2, 10, 30, and 60 days. EPC delay results for each sample project. As can be seen, the engineering activities’ delays have up to 10 times the impact of the procurement and construction activities. When two or ten days are delayed from each engineering, procurement, and construction activities, the delay impact was negligible. However, with 30- and 60-days delay, the delay impact was significant. These findings confirm that the engineering activity schedule impacts are greater than that of procurement and construction. Based on these findings, the authors next investigated the tasks in the design that have the most significant impacts on the overall schedule.
3.2. Project Schedule Simulation with Engineering Activity Delays
Table 4 summarizes the results of delaying the engineering activities by 10, 30, and 60 days. Shown are the design activities with significant delays and minor delays. As can be seen, a relatively large delay occurs with the piping activity in most cases. In the case studies 1 and 3, the process activity also has a relatively big delay impact. The possible reason for this is that the process is closely related to the piping. Piping’s significance will be presented in greater detail in the discussion section of this paper.
3.3. Design Schedule Management Plan
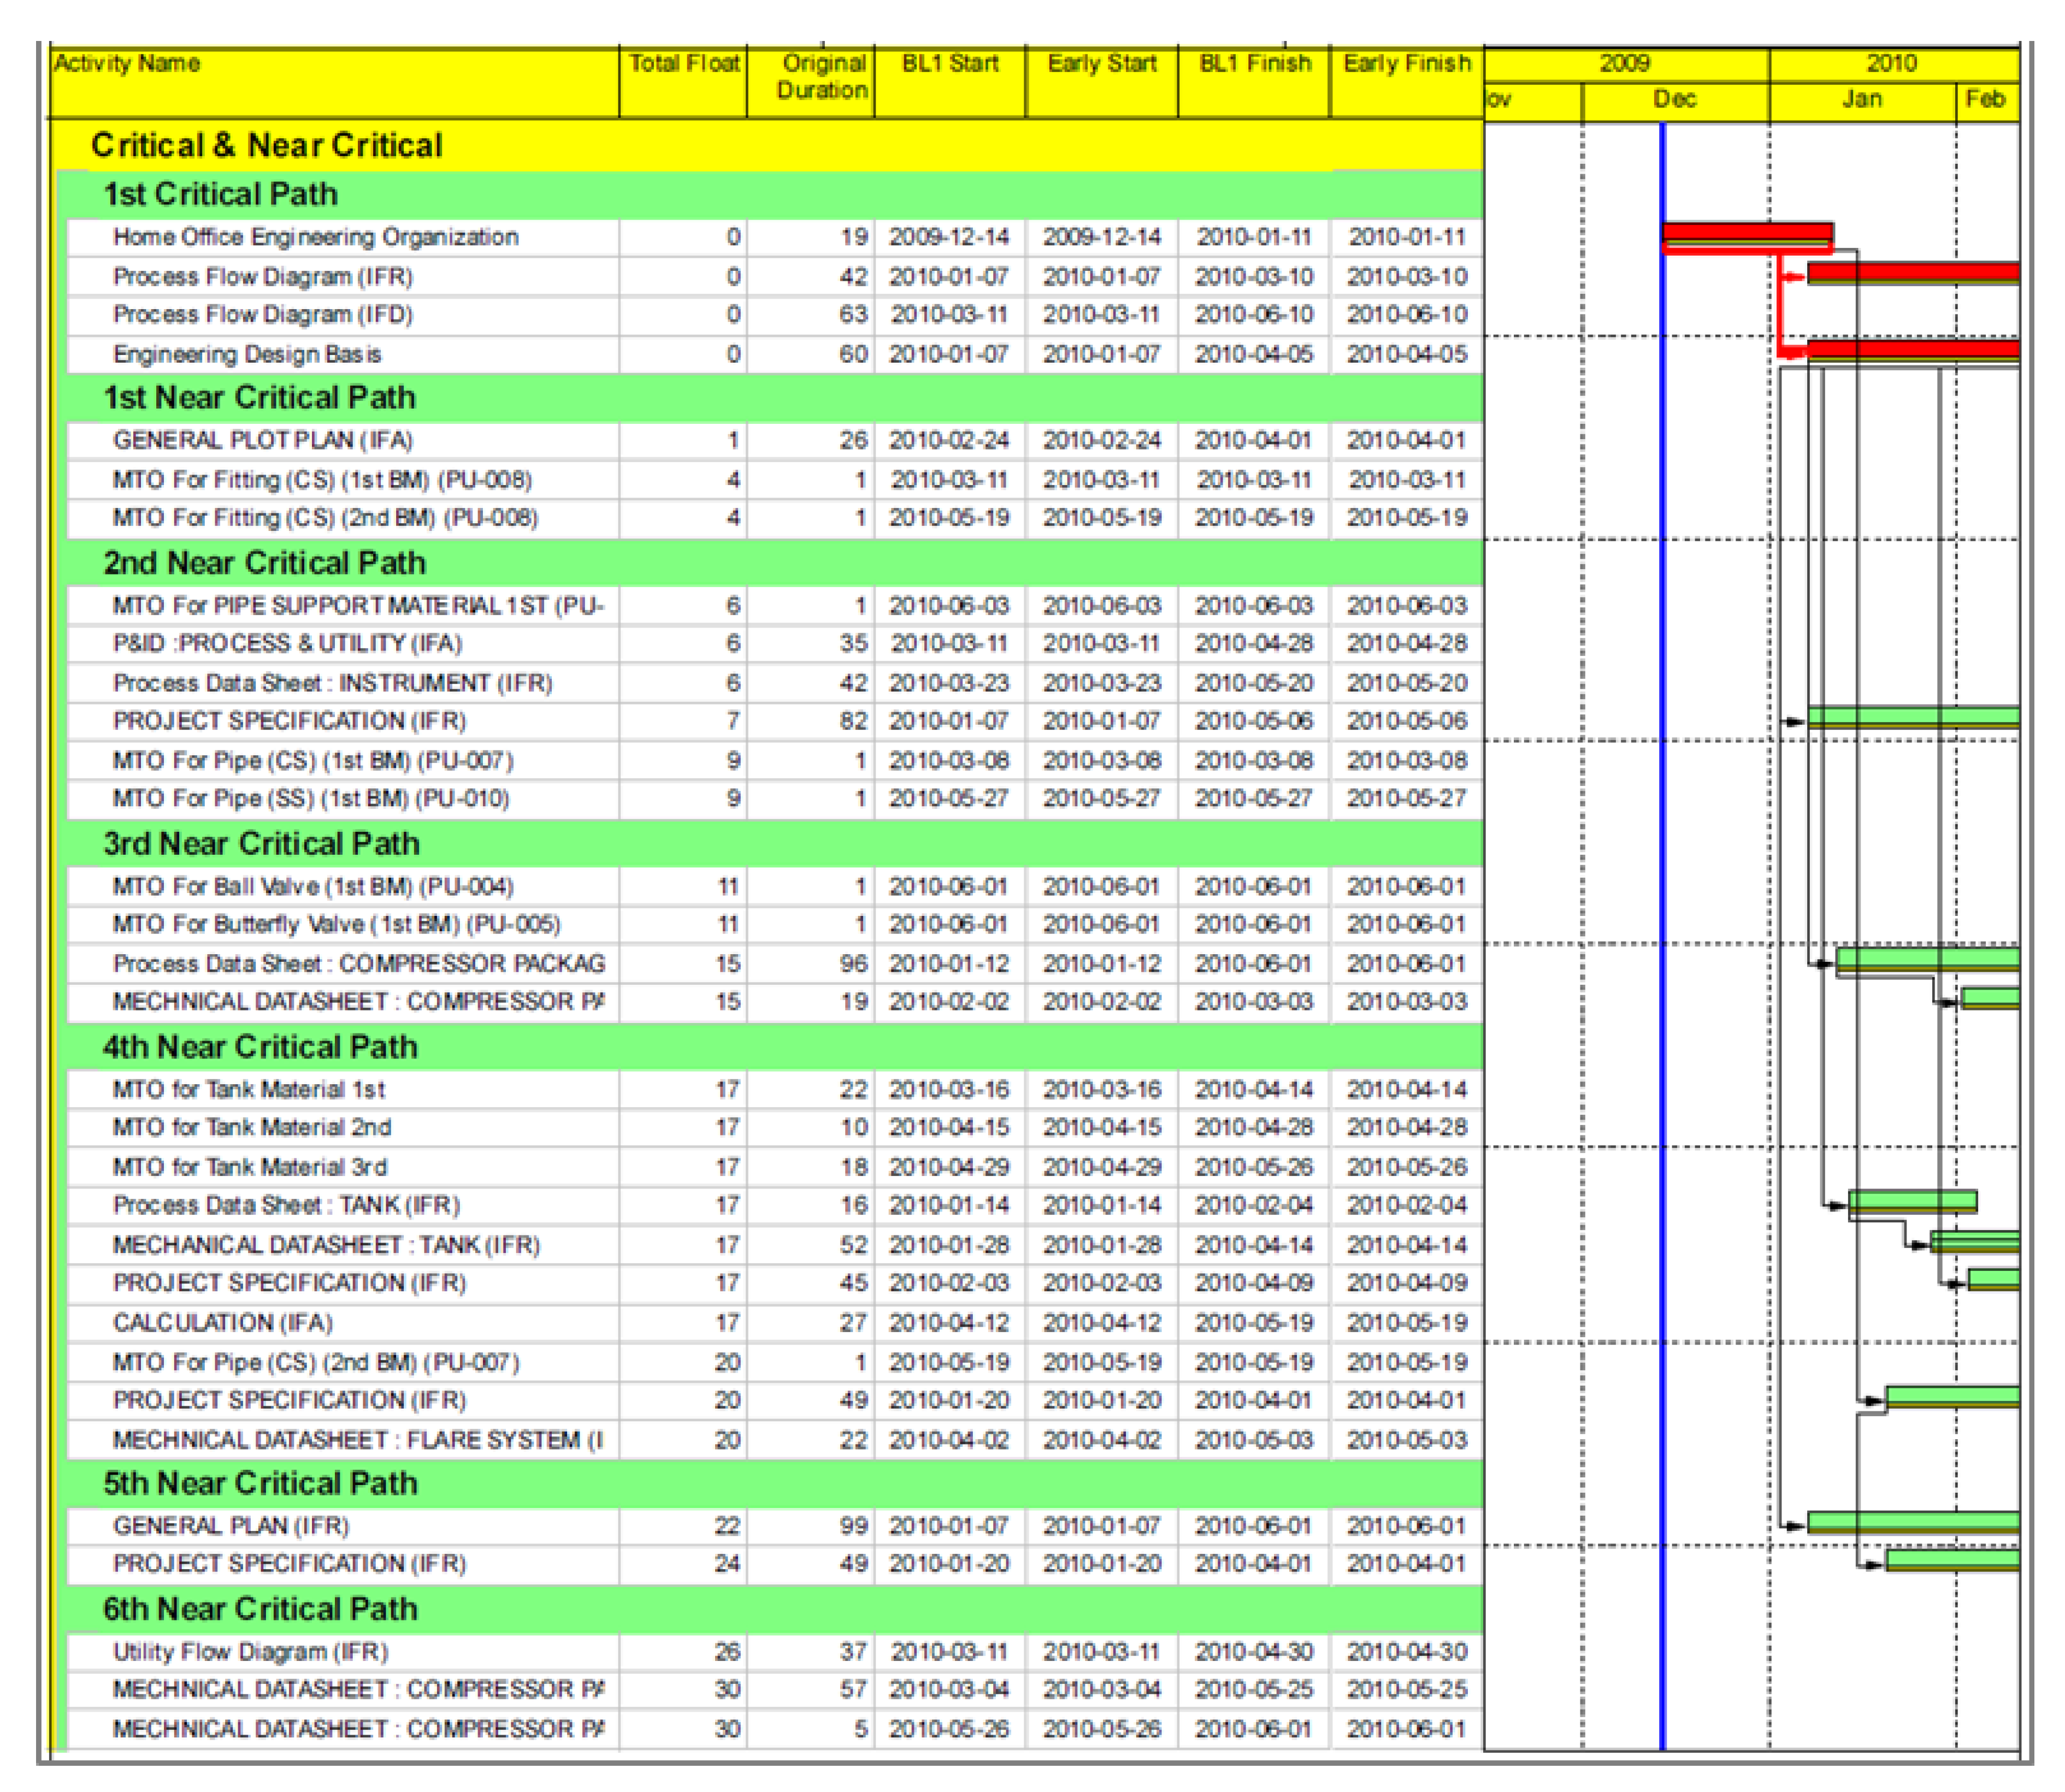
From the above findings and oil and gas engineering guide [6], the authors developed a design schedule management plan for power plant projects. This is detailed below using case study project 1 examples and the following sections: Milestone management, current status of the drawing, design productivity, interface management, vendor print management, and work front management. Prior to executing a design schedule management plan, the industry representative should compile a list of critical and near critical path tasks based on the baseline schedule. The critical path tasks are those on the path with a total float of 0 whose delays directly affect the completion date. The near critical tasks are those with 30 days or less of total float which have the potential to become critical since they have little float. The near critical task 30 delineation can be modified according to industry management. Figure 5 below shows task groups by the lengths of the total float for the critical and near critical path.
3.3.1. Milestone Management
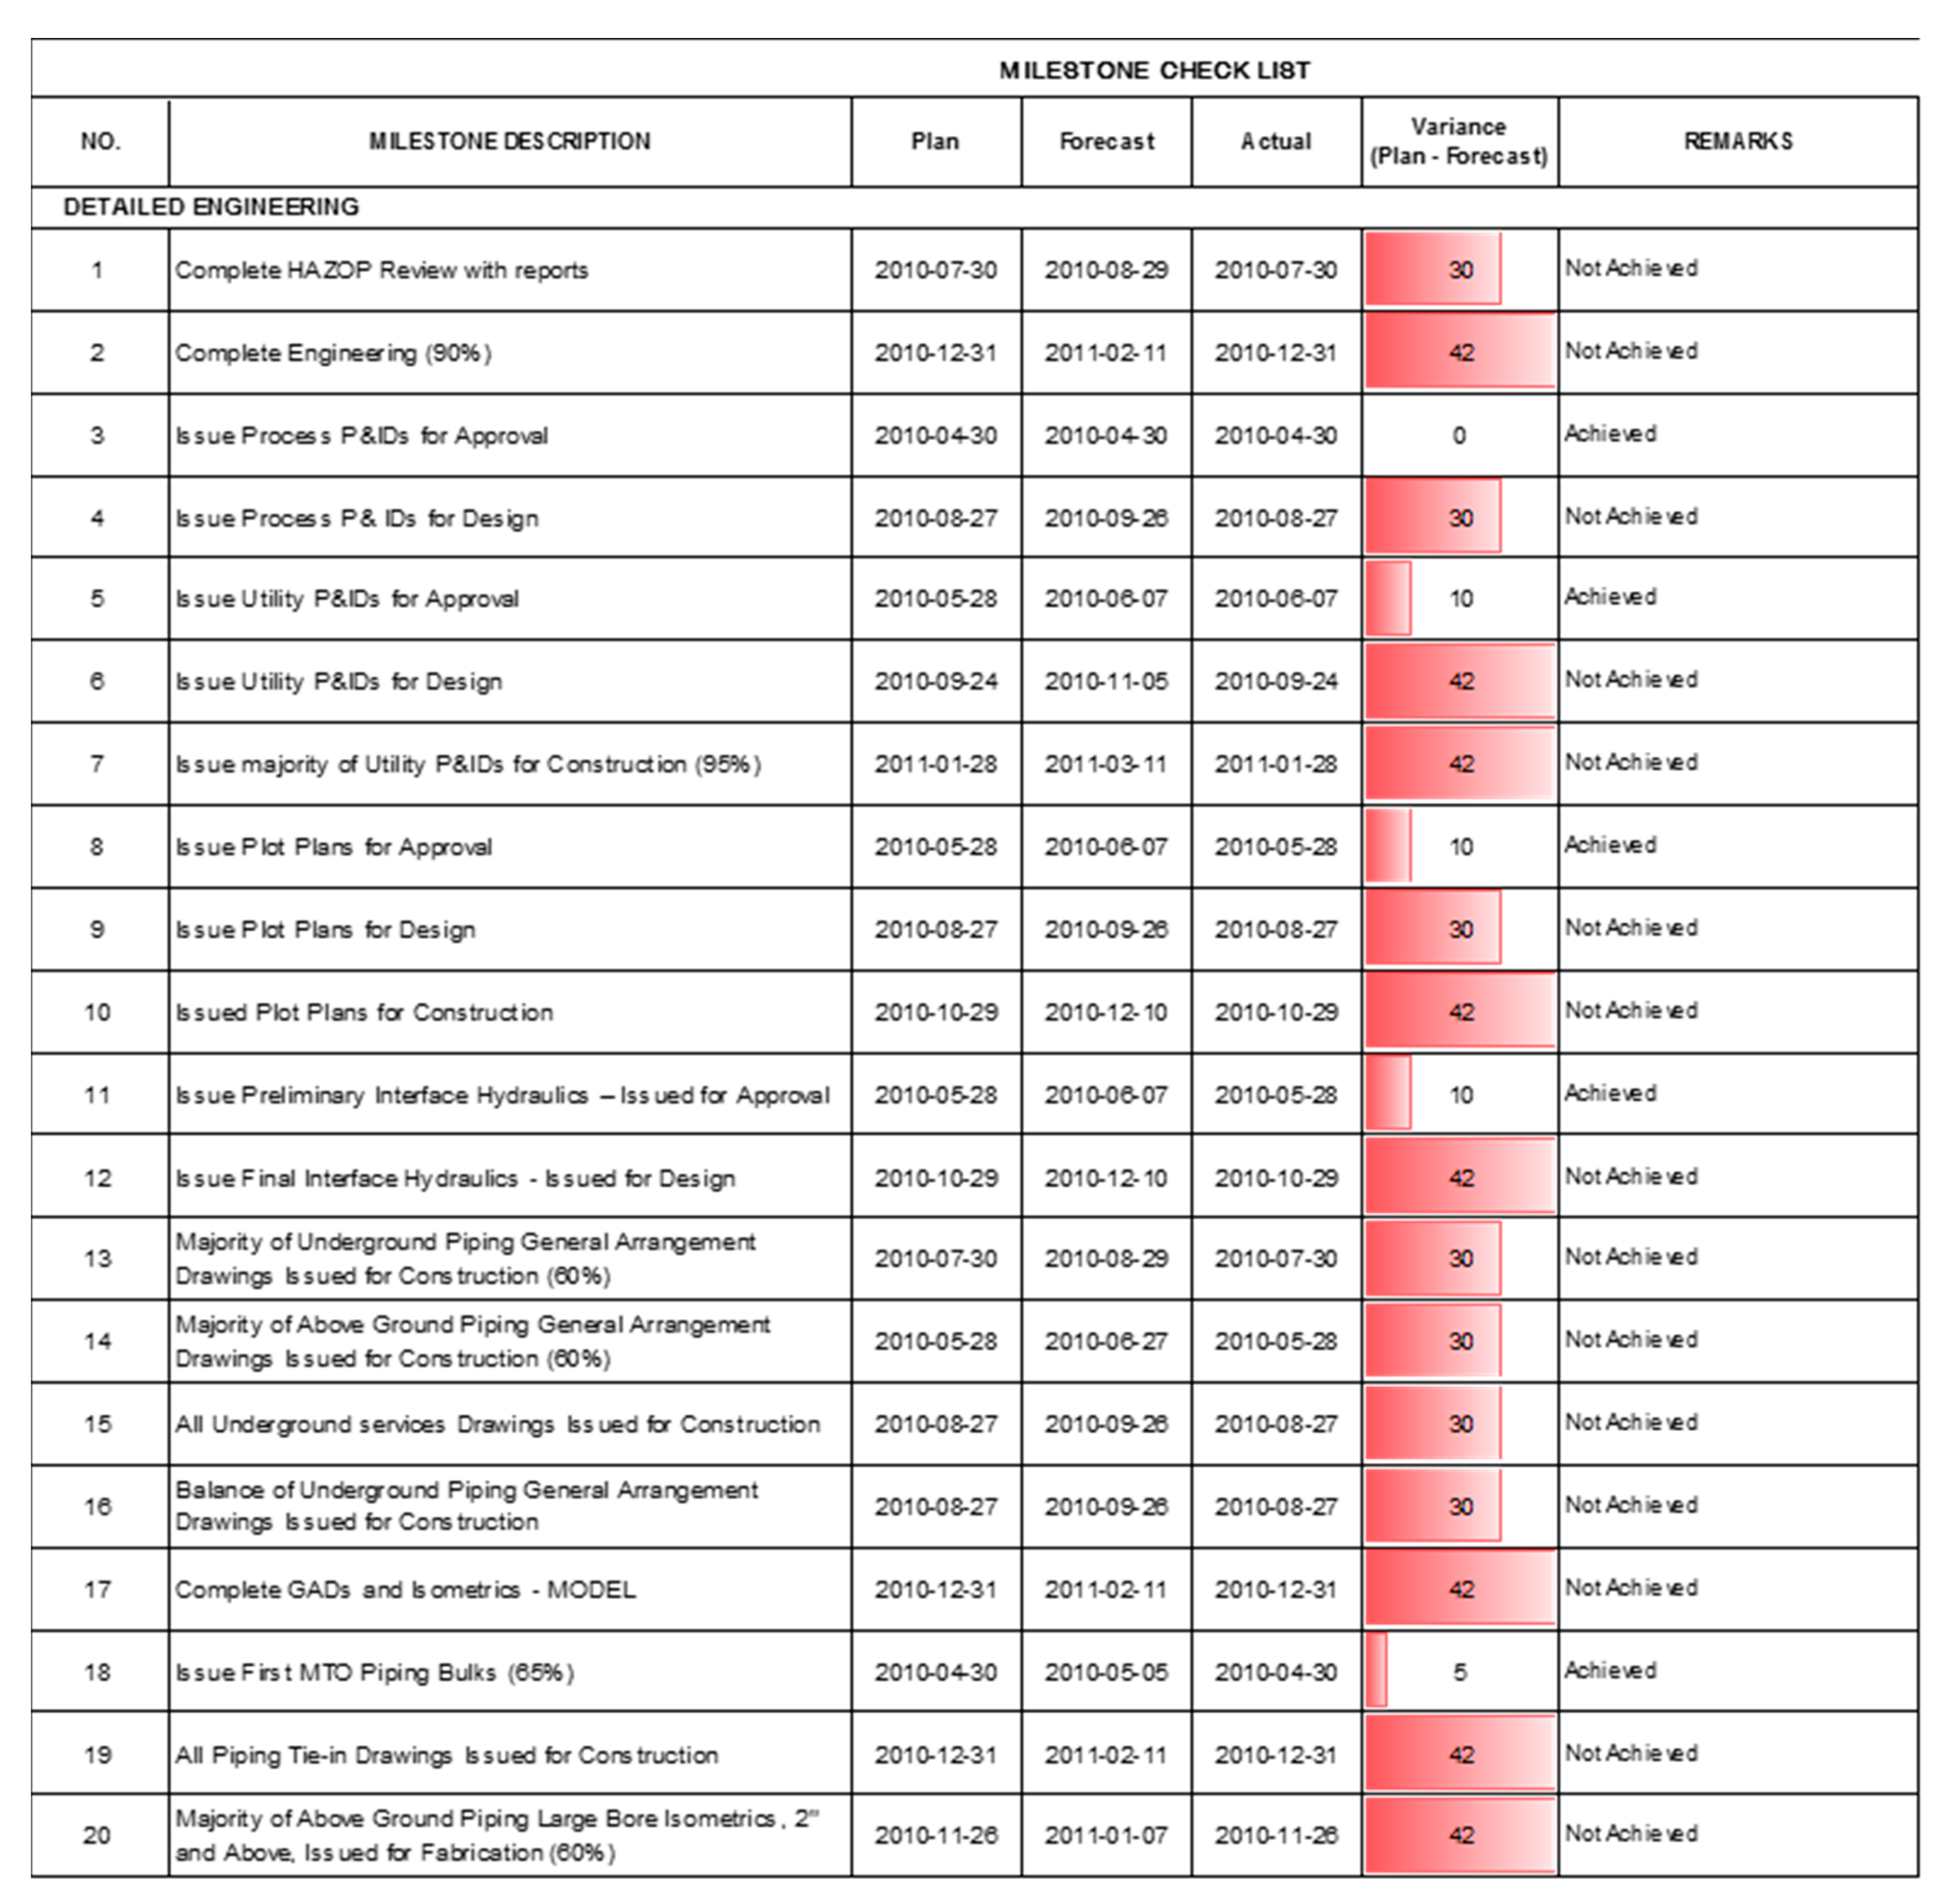
The first step in design schedule management is to identify and monitor target major milestones in the critical and near critical path. Figure 6, below, is an example milestone management checklist from project case study 1. As can be seen, there is a planned, forecasted, and actual date of completion with a variance calculation ([plan - forecast]/plan). The benefit of milestone management is that it is simple and clear, and a good method to set and achieve goals.
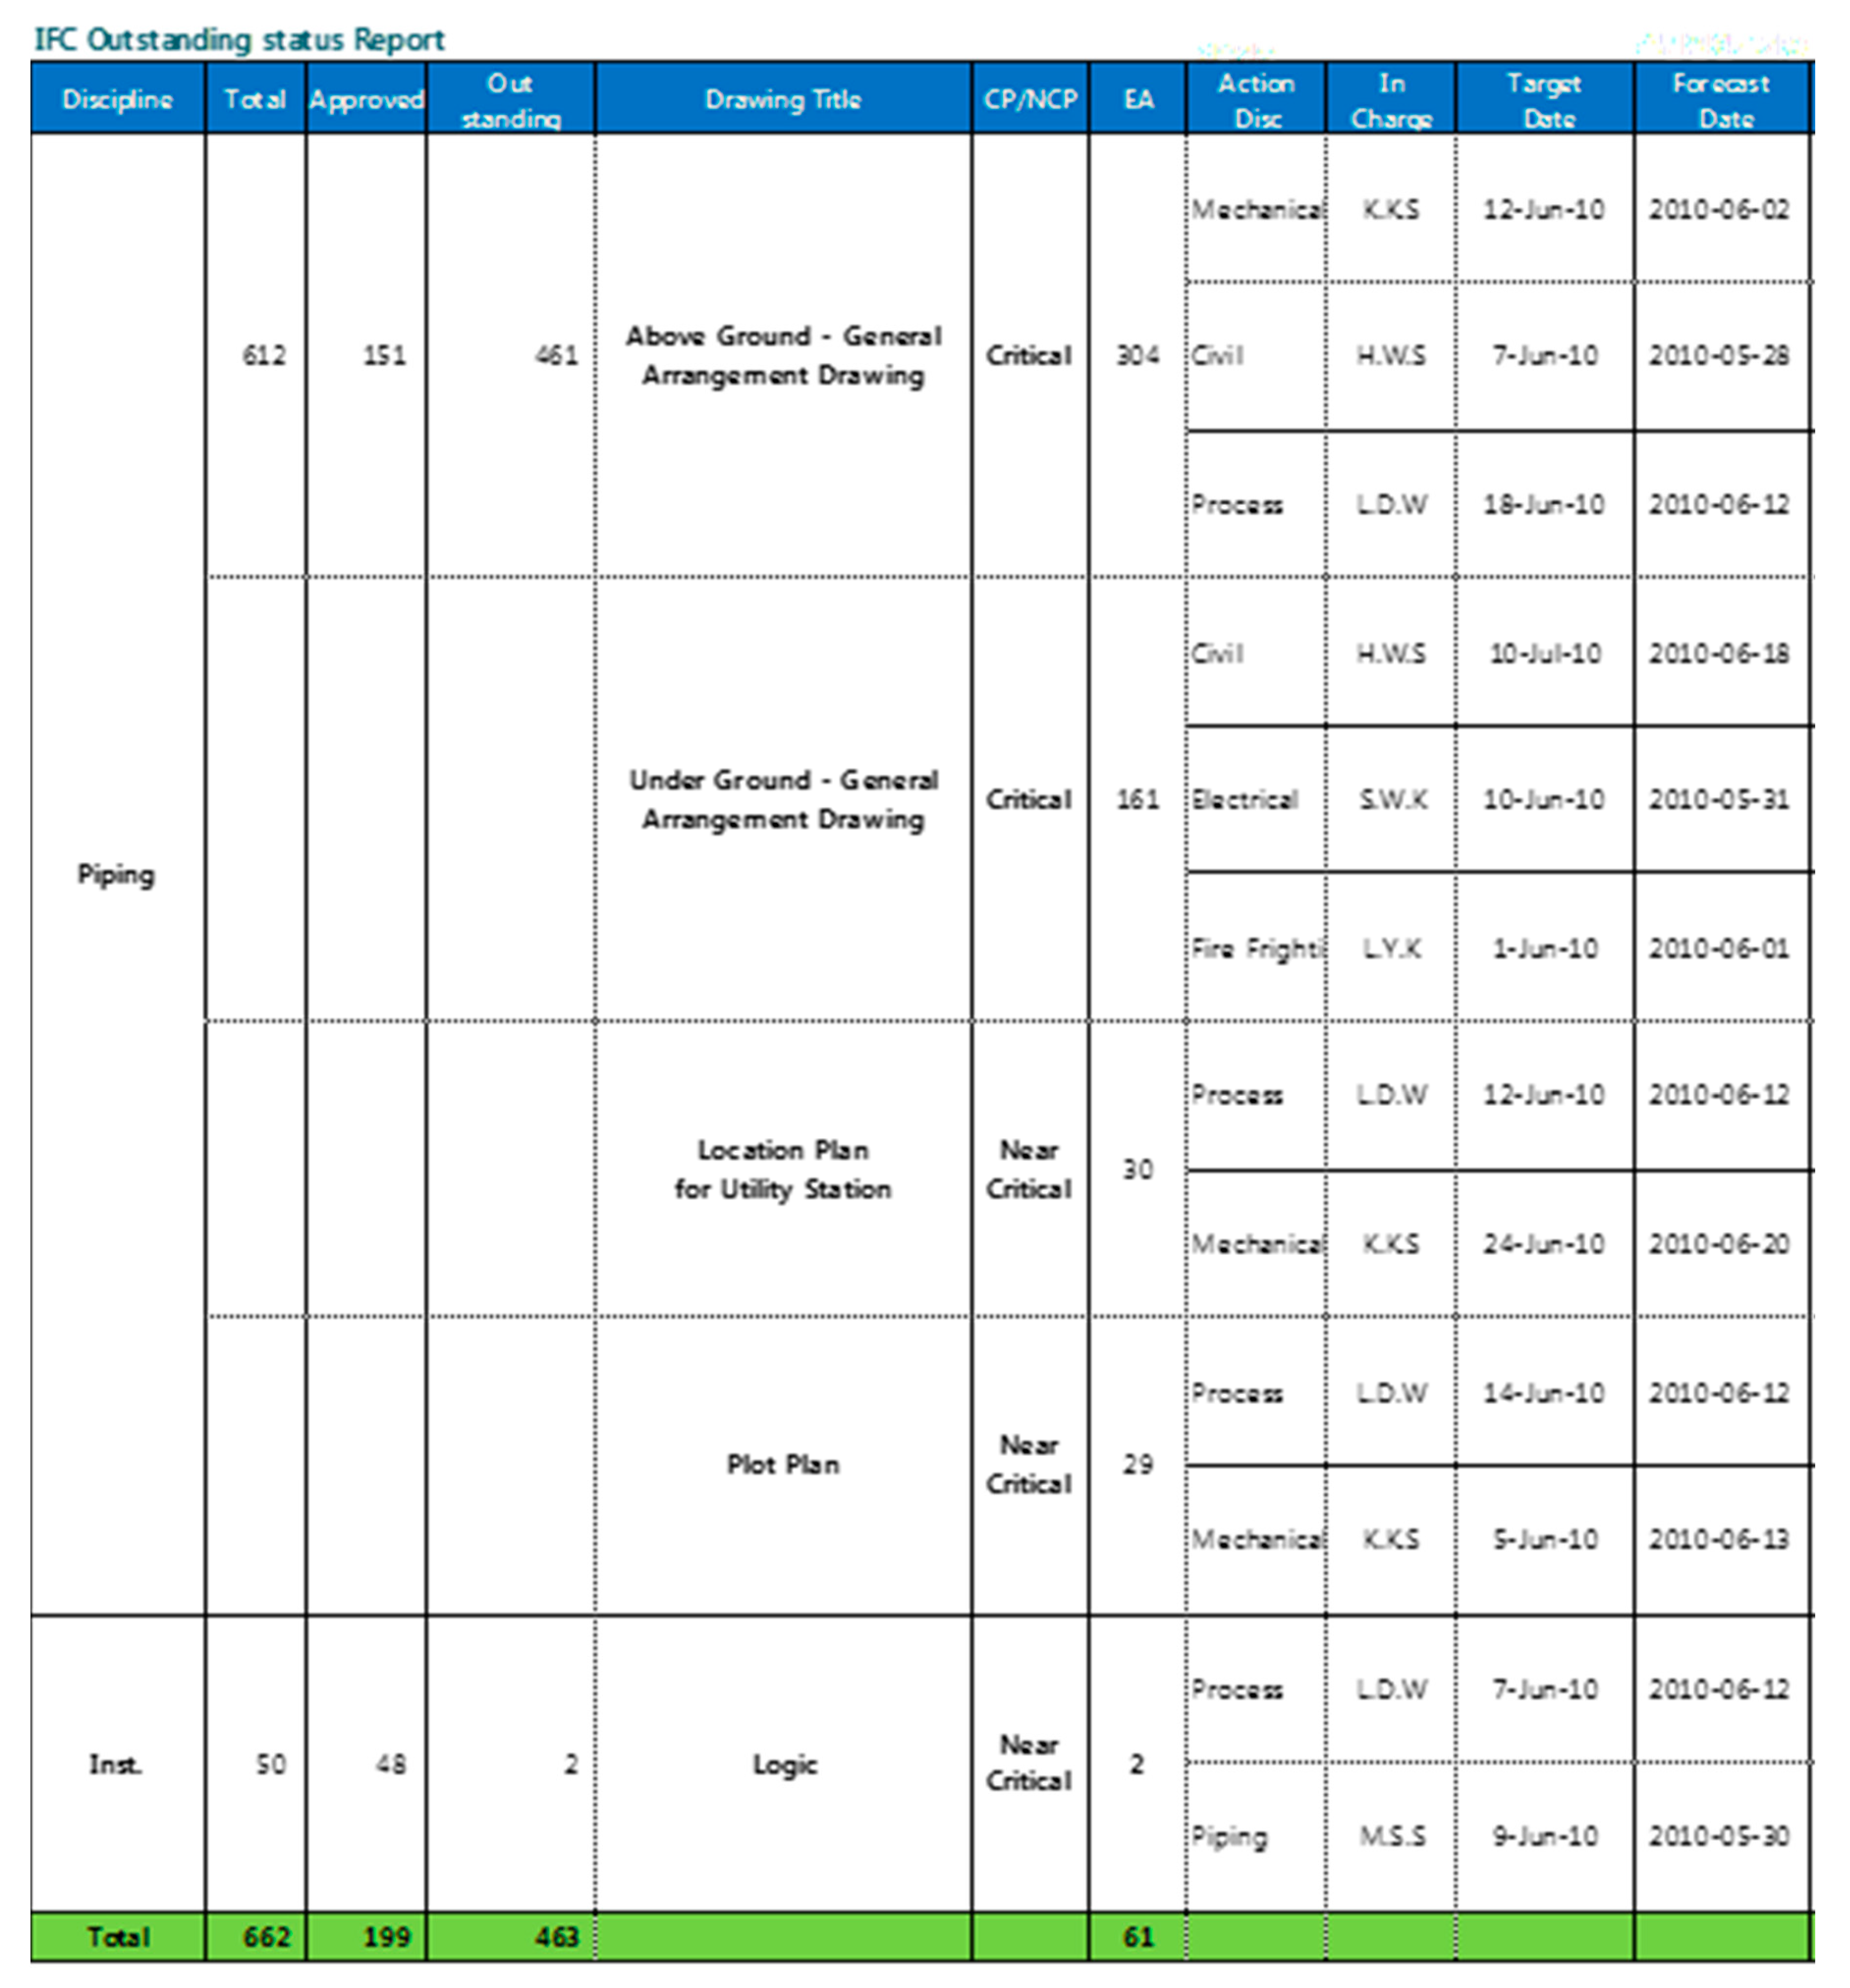
3.3.2. Current Status of Drawing
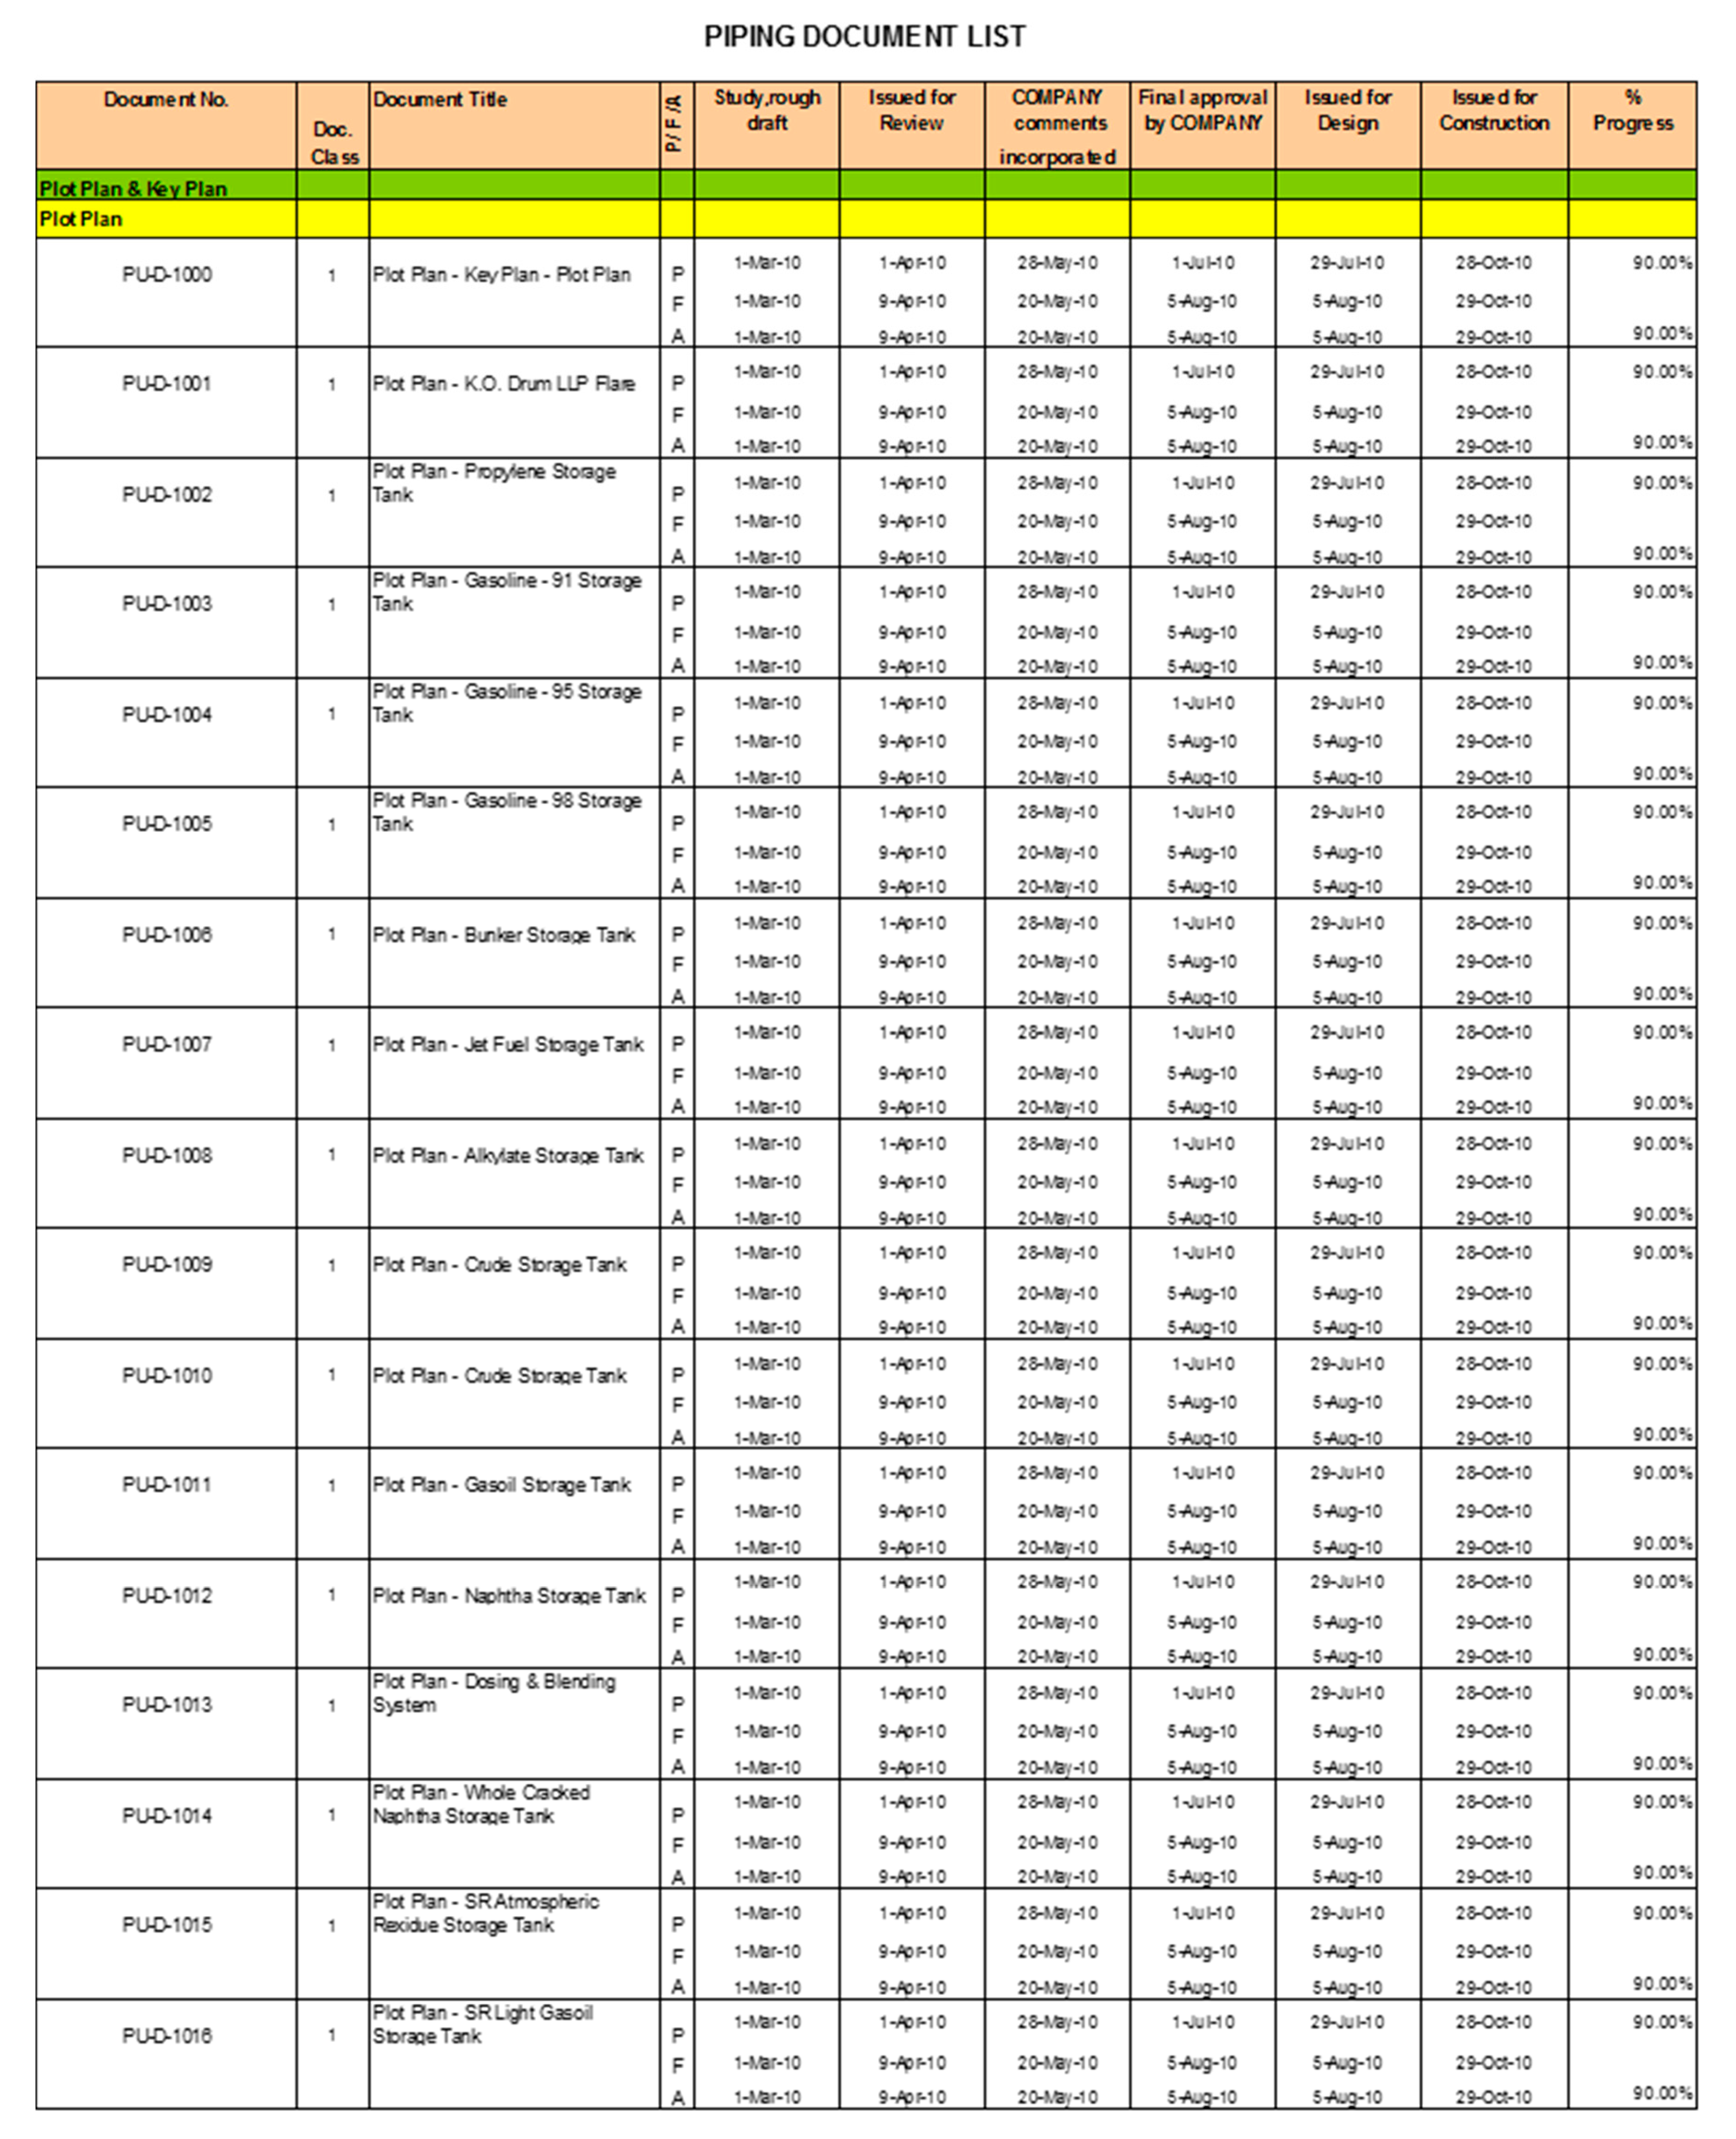
The most important measure of the progress of the design progress is the date of the drawing release. This is important as it is the step required to begin owner approval and directly correlated to the construction start. The release schedule of the drawings that constitute the critical and near critical paths are to be monitored. This document allows for weekly progress updates and proactive countermeasures if/when delays in anticipated completion occur. Figure 7 depicts the piping drawing list from case study project 1 and includes information of the drawings, target schedule, expected schedule, and percentage of progress.
3.3.3. Design Productivity Management
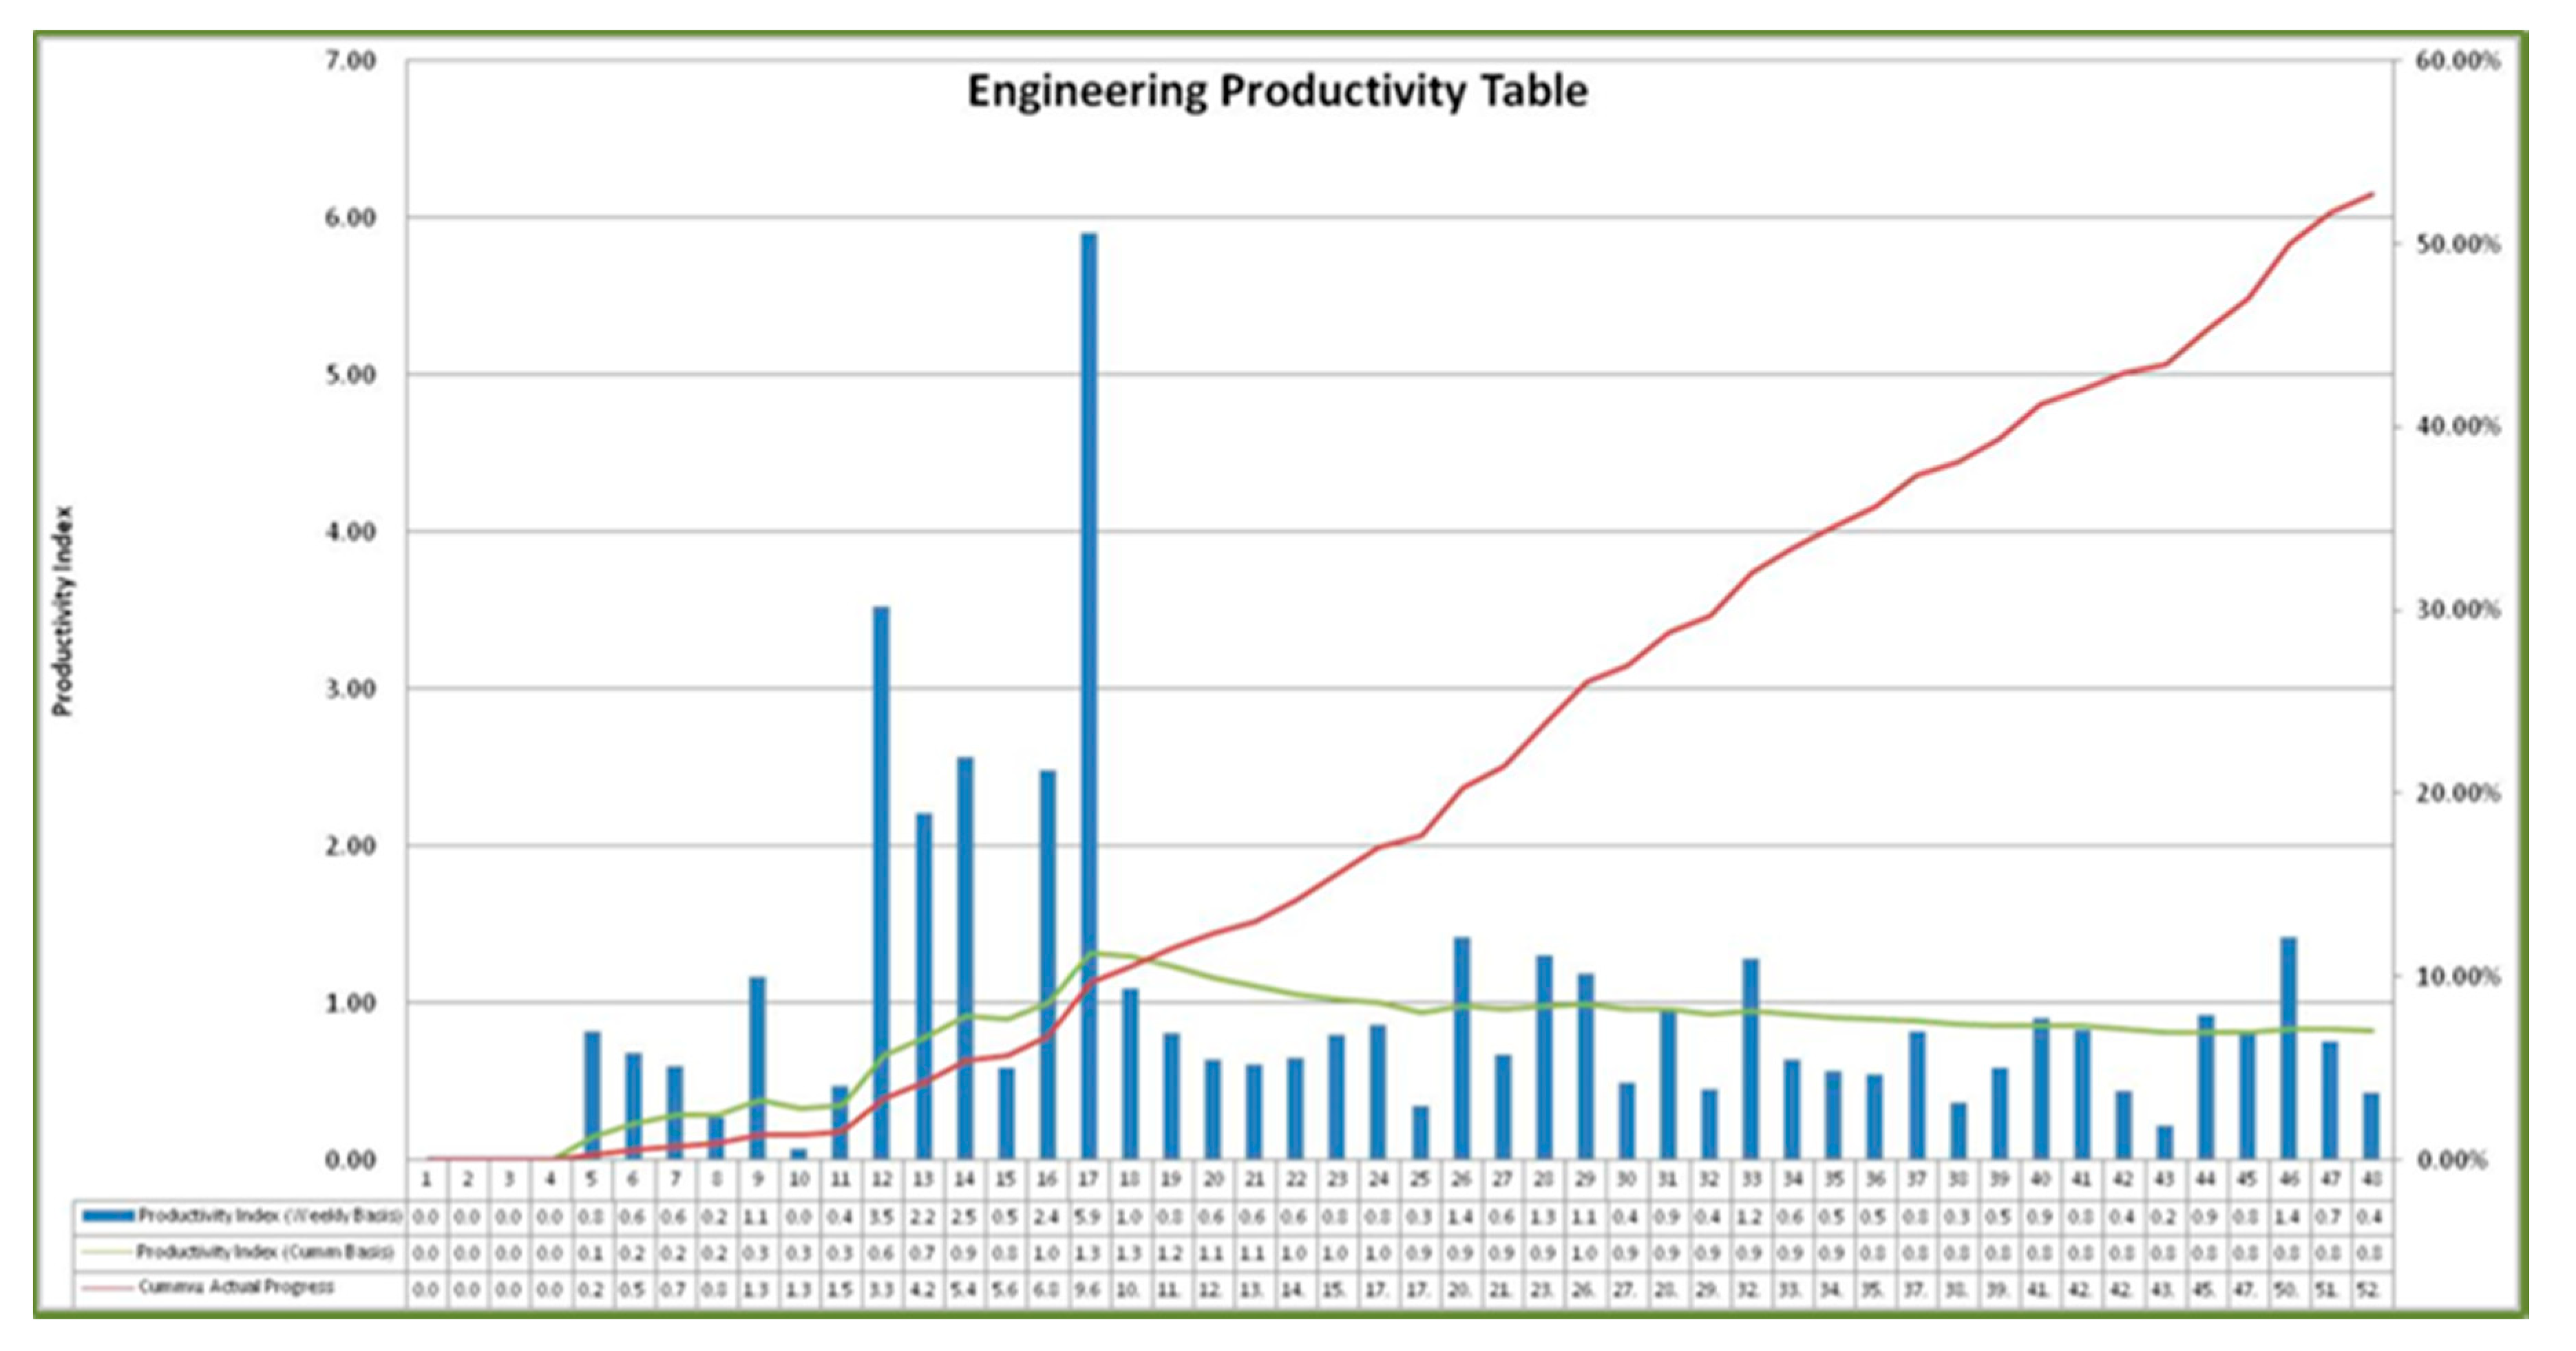
The next step in the design schedule management is assessing the engineering productivity. As can be seen in Figure 8, a sample design productivity management curve, the actual progress, productivity index, and cumulative productivity index are calculated. The productivity index is calculated as the number of drawings completed per time, as follows:
Productivity trends of drawings are managed on a weekly basis. If/when trends change, the identification of causes is required to resolve them. By managing the efficiency of resources for the output of drawings, it is possible to prevent the delays of detailed design progress in advance. Figure 8 is an example of a detailed design productivity management curve showing the drawing productivity and the progress of detailed design in weekly units.
3.3.4. Interface Management
Many of the design details have an impact on multiple design packages. Therefore, design progress requires an assessment of the design interface rather than singular designs and design teams. The checklist for necessary data and cooperation with the team of other design types is to be created and managed to complete the design work of the critical and near critical path list. Figure 9 is an example interface checklist for the major drawings of the case study 1 project.
3.3.5. Vendor Print Management
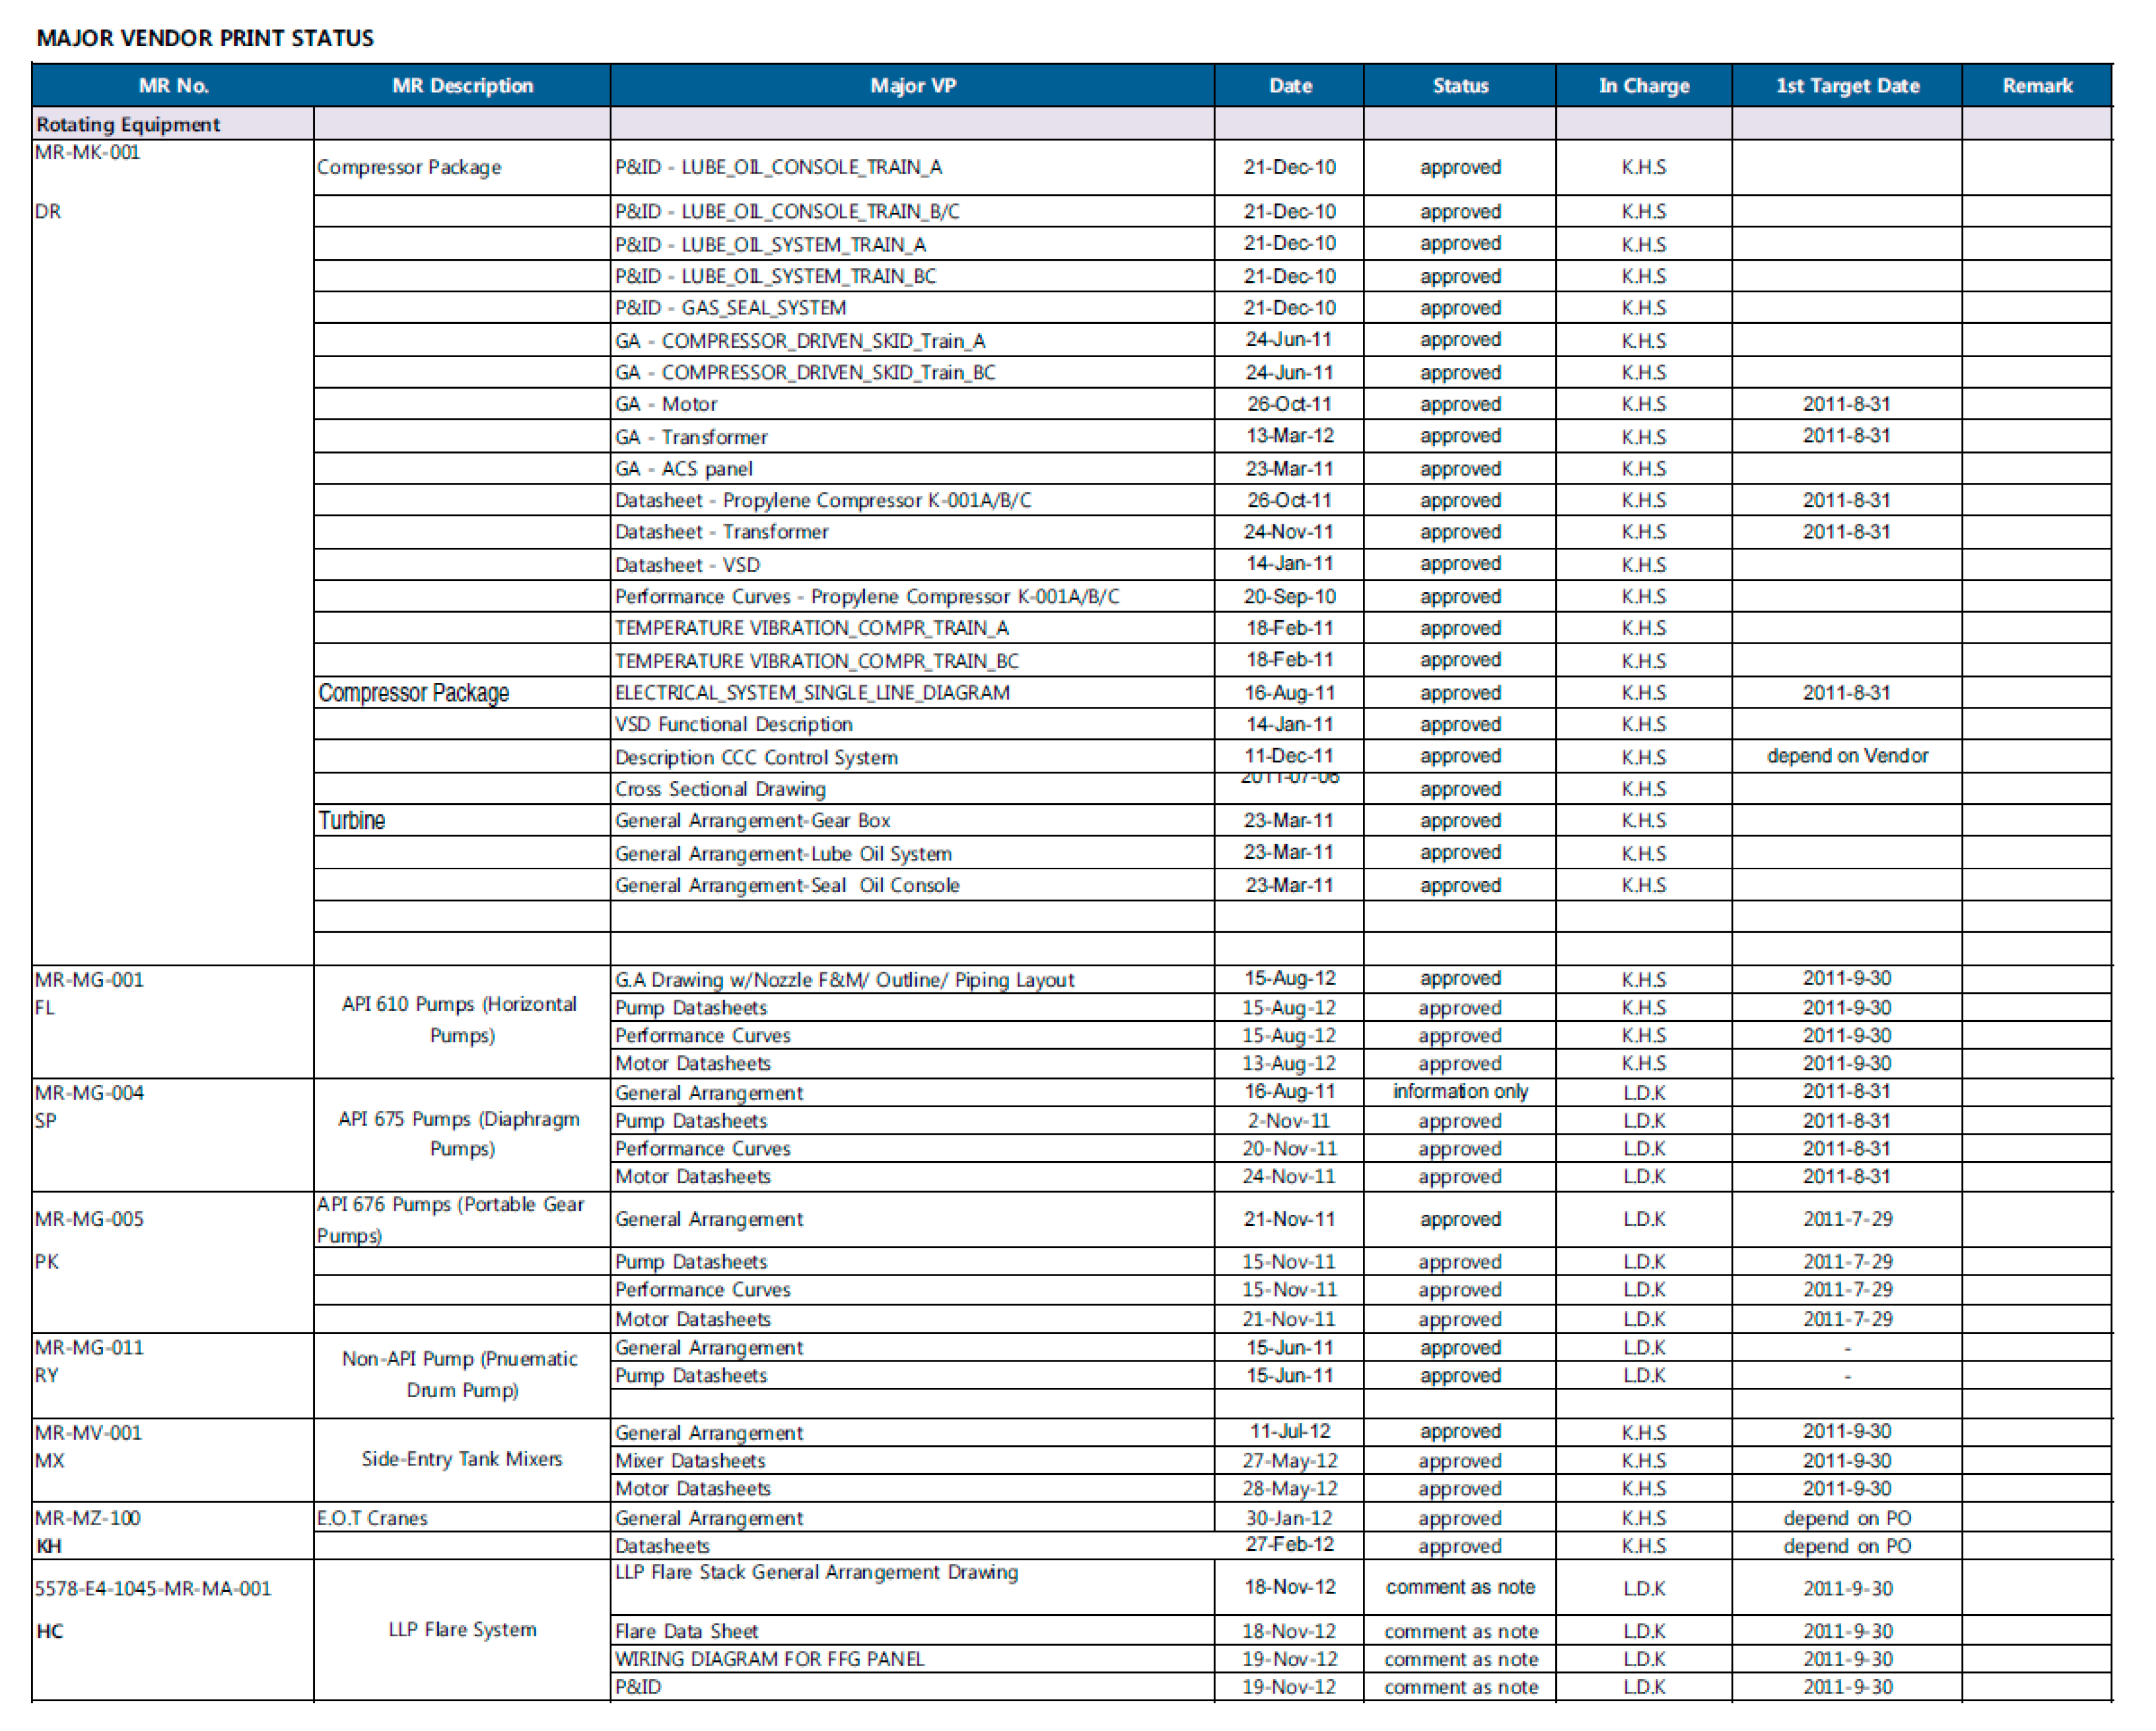
Design development can be carried out only when vendors of the devices and equipment provide crucial information in a timely manner. A list of major vendor prints is to be created and managed. Major vendor prints are identified as payment milestones when a purchase order is placed with vendors. Figure 10 is an example list of major vendor prints from the case study 1 project. According to each device and equipment, the list of major vendor prints, the schedule of the submission and its status, and the person in charge are provided.
3.3.6. Work Front Management
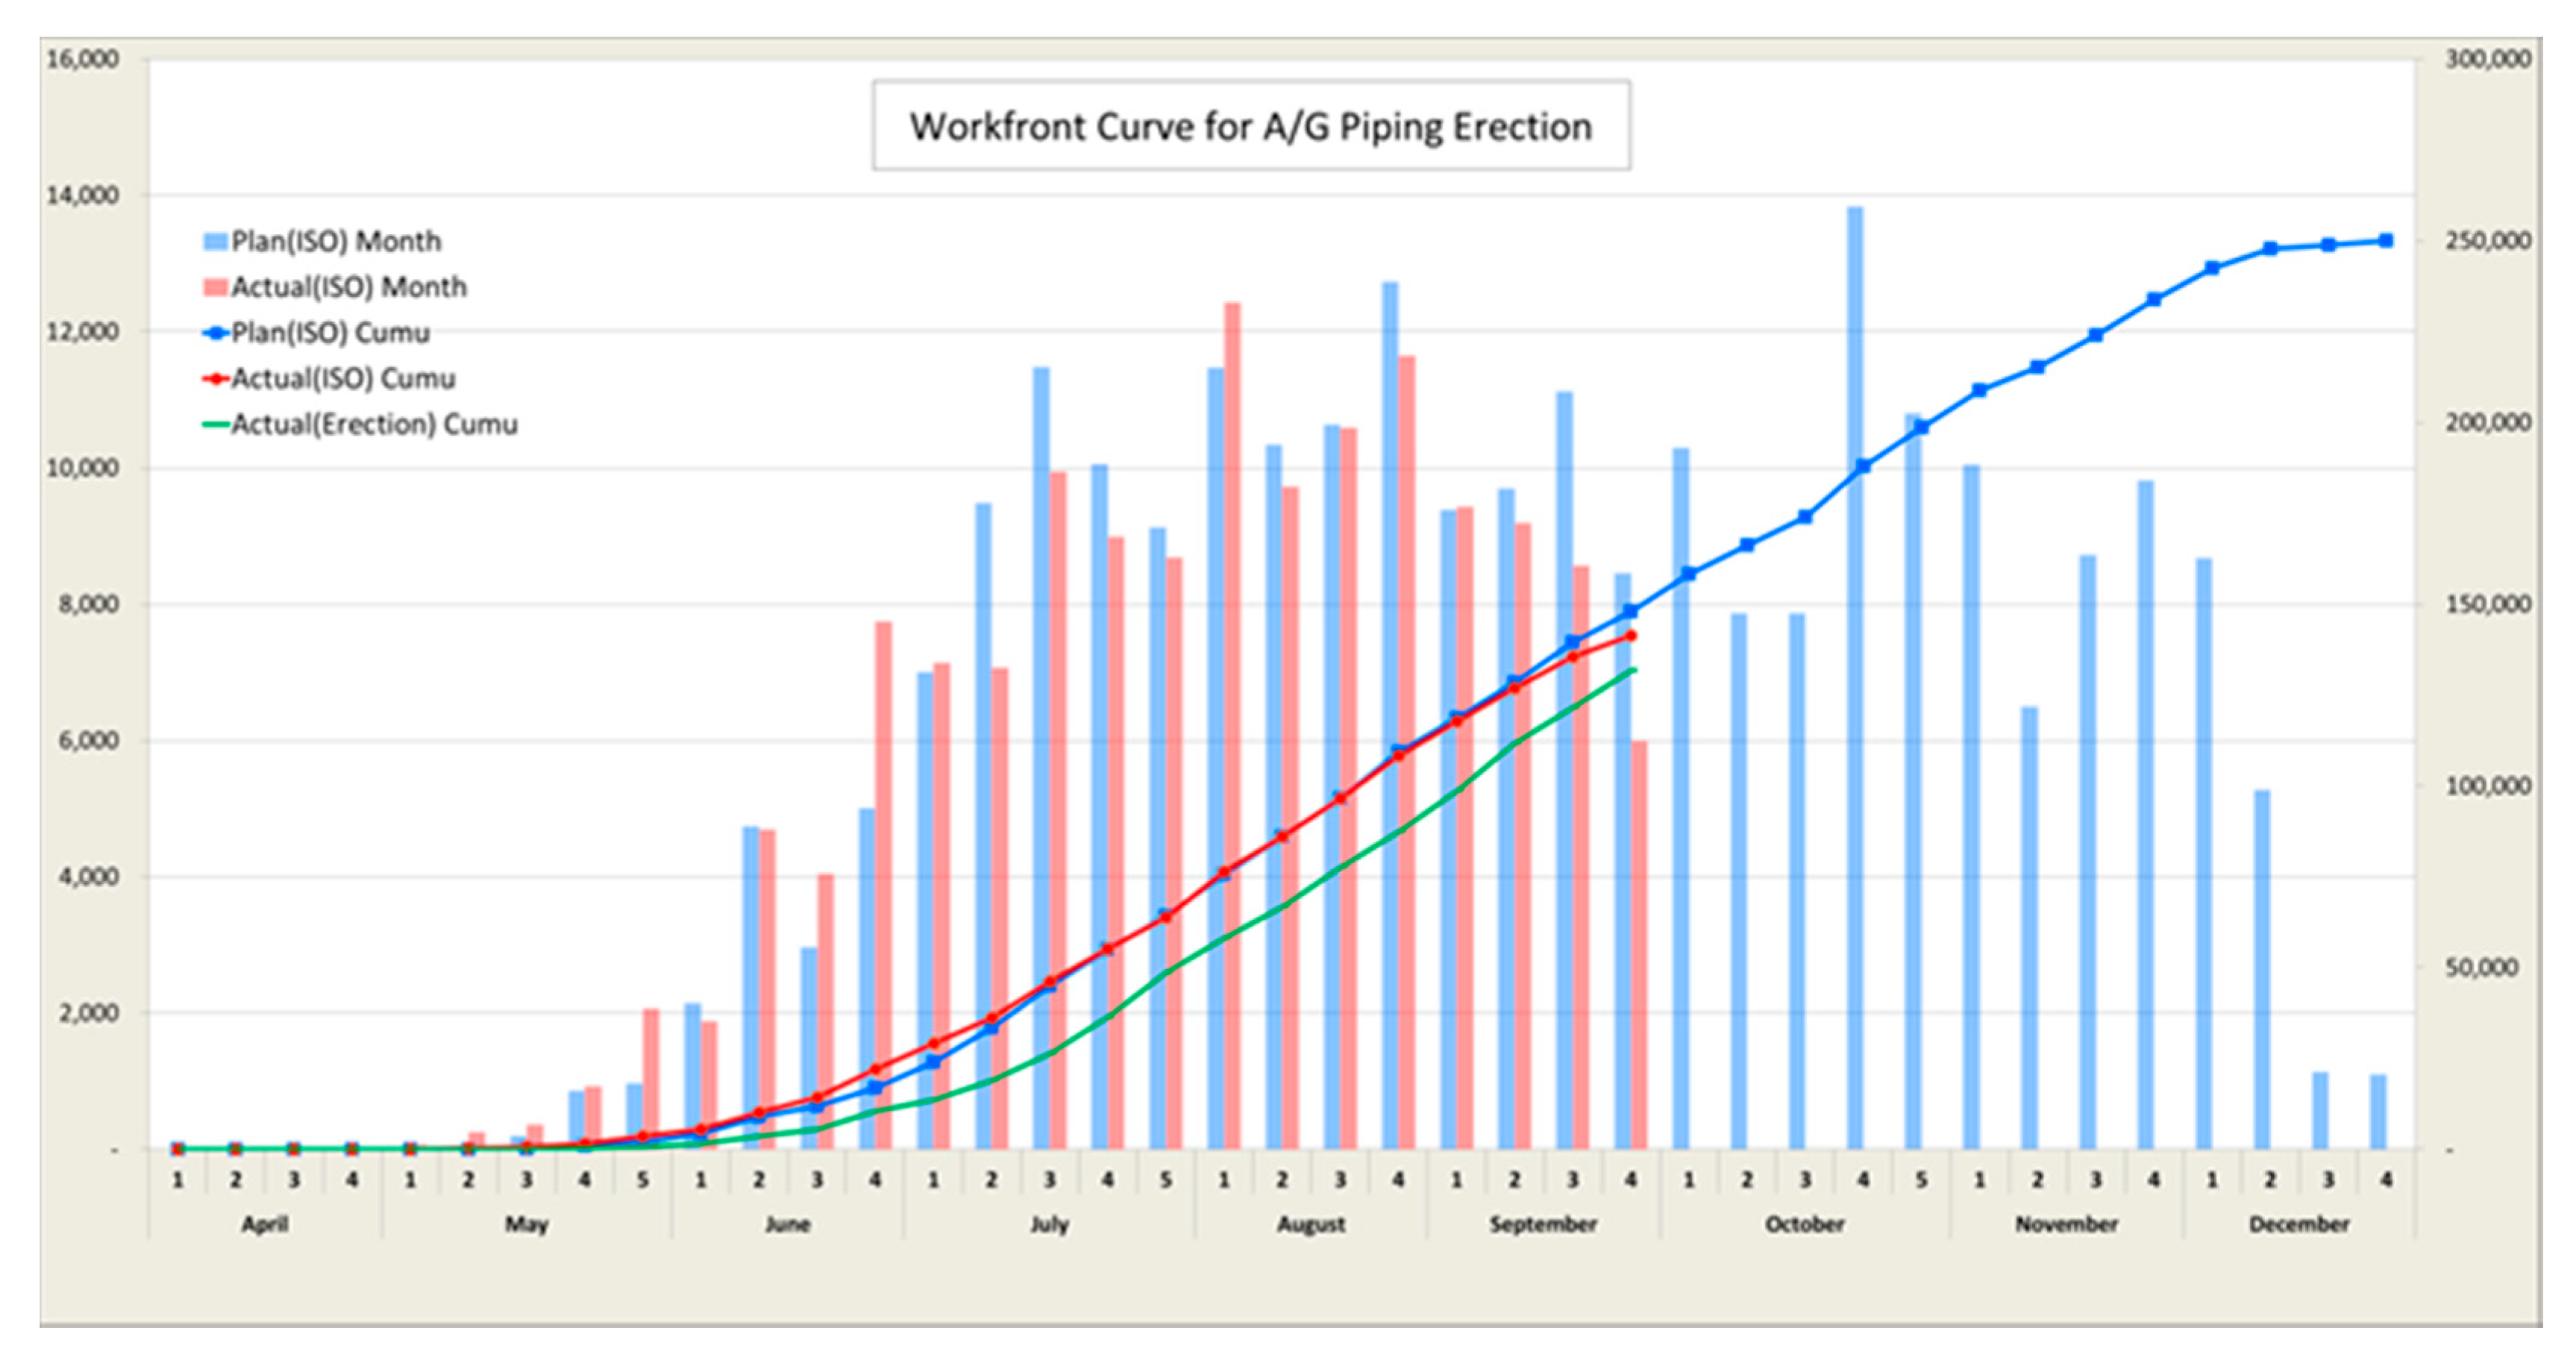
Work front refers to the predecessor to execute follow-up work. The work front of construction work can include manpower, equipment, materials, etc. In contrast, the construction drawing release status should be managed before the time of construction to prevent construction delay. Work front management items are mainly bulk construction items such as foundation, steel frame installation, piping spool, piping installation, and electric instrumentation cable. Figure 11 shows the work front curve for the installation of the ground piping, which compares the current state of isometric drawing versus the amount of installed ground piping so that the status of the isometric drawings can be managed.
4. Conclusions and Discussion
4.1. Study Conclusions
This study analyzed the impact the engineering phase has on the success of EPC projects. When projects are well-defined and well-focused in the early stage of the project, the chances of project success increase. To succeed, contractors need to properly execute the design phase through adequate resource allocation and design management. A Monte Carlo simulation was conducted using the Primavera Risk Analysis software, Pertmaster, for three sample EPC onshore oil and gas project schedules. To ascertain which stage of the EPC affects the project schedule most, the research team delayed the critical activities of engineering, procurement, and construction for 2, 10, 30, and 60 days, recording the estimated impact on the project completion date, respectively. The results of the simulation showed the design phase to be most impactful on the project schedule success. While two- or ten-day delays did not have much impact on the project schedule, 30- or 60-day delays have a significant impact on the project schedule, having up to 10 times the impact of the procurement and construction activities. As such, the most impactful tasks in the engineering phase were identified by delaying tasks in the critical path or near critical path. The results of the simulation confirmed that piping design work had the largest impact on the detailed design and hence, the project completion date. The reason for the above simulation results is that the detailed design has a lot of data to be exchanged among other types of work, so the work route is much more complicated than procurement or construction work. The influence of the engineering phase on the project schedule suggests that the front end of the EPC project should be managed very closely from the early stage of the project.
The authors also presented design schedule management processes milestone management, current status of the drawing export, detailed design productivity management, interface management with other detailed design types, vendor print management, and work front management. This is described in detail below:
- The design schedule milestone management process identifies and monitors target major milestones in the critical and near critical path. The project team identifies the planned, forecasted, and actual date of completion with a variance calculation ([plan – forecast]/plan). This process provides a simple, low resource intense method to set and achieve goals.
- The drawing release status monitoring is arguably the most important measure of the design progress as is the date of drawing release. This is because these are the dates which begin owner approval and are directly finish-start correlated to construction starting. In this process, only the most important drawing release dates (critical and near critical on CPM) are monitored. The project team is expected to perform weekly progress updates and proactive countermeasures as required.
- Detailed design productivity is presented as a curve which tracks the actual progress, productivity index (number of drawings/working hours of design staff), and cumulative productivity index. This curve is also expected to be managed on a weekly basis with issues identified proactively (negative changes in trends), along with the related solutions. Productivity trends of drawings are managed on a weekly basis. By performing these assessments, the project team may prevent delays associated with poor design productivity.
- Design interface management process monitors the interdependency of multiple design packages. This is performed with a checklist of required data, external team cooperation, and desired completion dates. This document ensures no drawing process stagnates due to teams not understanding or adequately preparing for their required input.
- Vendor management is required to monitor the vendors’ crucial device and equipment specification submittal progress. This is monitored through a simple table which includes a list of required vendor drawings, desired date, and status. This document ensures no drawing process stagnates due to not receiving vendor information. The authors suggest major vendor prints be identified as payment milestones for vendor purchase orders to ensure timely submittals.
- Work front management ensures that drawings are completed well ahead of construction. As most EPC projects include overlapping design and construction activities, it can be easy for detailed design teams to lose track of construction progress and allow construction activities to run out of designed work. This, of course, would be extremely detrimental to schedule performance. As such, work front management provides designers with a simple design versus a construction comparative graph comparing the current state of isometric drawing versus the amount installed.
4.2. Limitations and Future Research
The sample EPC project schedule used for the simulation in this study is limited to a total of three onshore oil and gas EPC project schedules due to limited projects with relevant data. As such, the research team could only analyze the approximate trend of the time effect on the schedule of the EPC task. If more EPC projects can be analyzed through schedule samples, it is possible to analyze the time effect and cost effect of each type of EPC project through various simulations. The findings of this work can be improved in the future. Therefore, it is expected that research on resource management of detailed design will be possible. Building on the findings of the activities which are most impactful to schedule performance, future research will also include methods to avoid schedule delays for overseas oil and gas projects. Future research utilizing LPS may be possible for qualitative analysis. However, securing a sufficient number of sample projects that adopt LPS and analyzing the results quantitatively may still be challenging.
Author Contributions
D.Y. developed the concept based on the analysis and drafted the manuscript. J.A. provided academic feedback on the study and revised the manuscript. E.-B.L. directed research contents and supervised the overall work. All authors read and approved the final manuscript.
Funding
The authors acknowledge that this research was sponsored by the Ministry of Trade Industry and Energy (MOTIE/KEIT) Korea through the Technology Innovation Program funding for: (1) Artificial Intelligence Big-data (AI-BD) Platform for Engineering Decision-support Systems (grant number = 20002806); and (2) Intelligent Project Management Information Systems (i-PMIS) for Engineering Projects (grant number = 10077606).
Acknowledgments
The authors would like to thank Dae-Woo Engineering and Construction for providing the data and information used for this study. The authors would like to thank S.W. Choi and D. Alleman for their academic feedbacks on this paper.
Conflicts of Interest
The authors declare no conflicts of interest.
Abbreviations
| CII | Construction Industry Institute |
| CPM | Critical Path Methods |
| EPC | Engineering, Procurement and Constriction |
| EVMS | Earned Value Management System |
| FEED | Front-End Design |
| FEL | Front-End Loading |
| KPI | Korea Plant Institute |
| LPS | Last Planner System |
| PDRI | Project Development Rating Index |
| P&ID | Ping and Instrumentation Drawing |
| PERT | Program Evaluation and Review Technique |
References
- Morgan, B.V. Benefits of project management at the front end. Int. J. Proj. Manag. 1987, 5, 102–119. [Google Scholar] [CrossRef]
- Van der Weijde, G. Front-End Loading in Oil and Gas Industry Towards a Fit Front-End Development Phase. Master’s Thesis, Delft University of Technology, Delft, The Netherlands, 2008. [Google Scholar]
- Jergeas, G. Analysis of the front-end loading of Alberta mega oil sands projects. Proj. Manag. J. 2008, 39, 95–104. [Google Scholar] [CrossRef]
- Construction Industry Institute (CII). Project Definition Rating Index—Industrial Projects Ver. 4.; Resource 113-2; Construction Industry Institute: Austin, TX, USA, 2013. [Google Scholar]
- Shlopak, M.; Emblemsvåg, J.; Oterhals, O. Front End Loading as an Integral Part of the Project Execution Model in Lean Shipbuilding. In Proceedings of the IGLC-22, Oslo, Norway, 25–27 June 2014. [Google Scholar]
- Baron, H. The Oil & Gas Engineering Guide, 2nd ed.; Editions TECHNIP: Paris, France, 2015; ISBN-13:978-2710811510. [Google Scholar]
- Merrow, E. Industrial Megaprojects: Concepts, Strategies, and Practices for Success; Wiley: Hoboken, NJ, USA, 2011; ISBN 978-0-470-93882-9. [Google Scholar]
- Korea Plant Institute EPC Technical Committee. Performance of Overseas Plant Project. Plant J. 2010, 6, 11–17. [Google Scholar]
- Lee, J.D. Time of Accumulation, Knowledge Nomad. College of Engineering. Master’s Thesis, Seoul National University, Soul, Korea, 2015. [Google Scholar]
- Kim, M.H.; Lee, E.B.; Choi, H.S. Detail Engineering Completion Rating Index System (DECRIS) for Optimal Initiation of Construction Works to Improve Contractors’ Schedule-Cost Performance for Offshore Oil and Gas EPC Projects. Sustainability 2018, 10, 2469. [Google Scholar] [CrossRef]
- Yeo, K.T.; Ning, J.H. Integrating supply chain and critical chain concepts in engineer-procure-construct (EPC) projects. Int. J. Proj. Manag. 2002, 20, 253–262. [Google Scholar] [CrossRef]
- Jo, S.H.; Lee, E.B.; Pyo, K.Y. Integrating a Procurement Management Process into Critical Chain Project Management (CCPM): A Case-Study on Oil and Gas Projects, the Piping Process. Sustainability 2018, 10, 1817. [Google Scholar] [CrossRef]
- Lee, H.C.; Lee, E.B.; Alleman, D. Schedule Modeling to Estimate Typical Construction Durations and Areas of Risk for 1000 MW Ultra-Critical Coal-Fired Power Plants. Energies 2018, 11, 2850. [Google Scholar] [CrossRef]
- El-Sabek, L.M.; McCabe, B.Y. Framework for Managing Integration Challenges of Last Planner System in IMPs. J. Constr. Eng. Manag. 2018, 144. [Google Scholar] [CrossRef]
- Castillo, T.; Alarcon, L.F.; Salvatierra, J.L. Effects of Last Planner System Practices on Social Networks and the Performance of Construction Projects. J. Constr. Eng. Manag. 2018, 144. [Google Scholar] [CrossRef]
- Mulholland, B.; Christian, J. Risk Assessment in Construction Schedules. J. Constr. Eng. Manag. 1999, 125. [Google Scholar] [CrossRef]
- Luu, V.T.; Kim, S.Y.; Tuan, N.V.; Ogunlana, S.O. Quantifying schedule risk in construction projects using Bayesian belief networks. Int. J. Proj. Manag. 2009, 27, 39–50. [Google Scholar] [CrossRef]
- Nasir, D.; McCabe, B.; Hartono, L. Evaluating Risk in Construction–Schedule Model (ERIC–S): Construction Schedule Risk Model. J. Constr. Eng. Manag. 2003, 129. [Google Scholar] [CrossRef]
- Schatteman, D.; Herroelen, W.; Vonder, S.V.; Boone, A. Methodology for Integrated Risk Management and Proactive Scheduling of Construction Projects. J. Constr. Eng. Manag. 2008, 134. [Google Scholar] [CrossRef]
- Okmen, O.; Oztas, A. Construction Project Network Evaluation with Correlated Schedule Risk Analysis Model. J. Constr. Eng. Manag. 2008, 134. [Google Scholar] [CrossRef]
- Cha, H.S. Development of Risk Assessment Methodology Based on Cognitive Analysis on the Influence of Project Risk Factors on Cost Performance. Archit. Inst. Korea 2006, 22, 125–132. [Google Scholar]
- Kang, H.W.; Min, B.J.; Kim, Y.S. Analysis of Cost Variation Scope through Risk Factors in Overseas Plant Construction Project. Archit. Inst. Korea 2010, 26, 2010–2017. [Google Scholar]
- Project Management Institute. A Guide to the Project Management Body of Knowledge, 6th ed.; Project Management Institute: Newtown Square, PA, USA, 2017. [Google Scholar]
- Al-Momani, A.H. Construction delay: A quantitative analysis. Int. J. Proj. Manag. 2000, 18, 51–59. [Google Scholar] [CrossRef]
- Khodakarami, V.; Fenton, N.; Neil, M. Project Scheduling: Improved Approach to Incorporate Uncertainty Using Bayesian Networks. Proj. Manag. J. 2007, 38. [Google Scholar] [CrossRef]
- Al-Gahtani, K.S. Risk Assessment for Scheduling Acceleration. Int. J. Appl. Innov. Eng. Manag. 2013, 2. Available online: http://www.ijaiem.org/Volume2Issue2/IJAIEM-2013-02-27-045.pdf (accessed on 15 March 2019).
- Omer, A.; Cengiz, K. Resource-constrained project scheduling problem with multiple execution modes and fuzzy/crisp activity durations. J. Int. Fuzzy Syst. 2014, 26, 2001–2020. [Google Scholar] [CrossRef]
- Arashpour, M.; Wakefield, R.; Abbasi, B.; Lee, E.W.M.; Minas, J. Off-site construction optimization: Sequencing multiple job classes with time constraints. Autom. Constr. 2016, 71, 262–270. [Google Scholar] [CrossRef]
- Liu, J.Y. Schedule Uncertainty Control: A Literature Review. Phys. Procedia 2012, 33, 1842–1848. [Google Scholar] [CrossRef] [Green Version]
- Love, P.E.D.; Sing, C.-P.; Wang, X.; Edwards, D.J.; Odeyinka, H. Probability distribution fitting of schedule overruns in construction projects. J. Oper. Res. Soc. 2013, 64, 1231–1247. [Google Scholar] [CrossRef]
- Kirytopoulos, K.A.; Leopoulos, V.N.; Diamantas, V.K. PERT vs. Monte Carlo Simulation along with the suitable distribution effect. Int. J. Proj. Organ. Manag. 2008, 1, 24–46. [Google Scholar] [CrossRef]
- Aziz, R.F. RPERT: Repetitive-Projects Evaluation and Review Technique. Alex. Eng. J. 2014, 53, 81–93. [Google Scholar] [CrossRef] [Green Version]
- Ahong, D.H.; Zhang, J.S. New Method for Calculating Path Float in Program Evaluation and Review Technique (PERT). J. Constr. Eng. Manag. 2003, 129. [Google Scholar] [CrossRef]
- Sakka, J.I.; El-sayegh, S.M. Float Consumption Impact on Cost and Schedule in the Construction Industry. J. Constr. Eng. Manag. 2007, 133. [Google Scholar] [CrossRef]
- Al-Gahtani, K.S. Float Allocation Using the Total Risk Approach. J. Constr. Eng. Manag. 2009, 135. [Google Scholar] [CrossRef]
- Goldratt, E.M. Critical Chain; North River Press: Great Barrington, MA, USA, 2002; ISBN 0-88427-153-6. [Google Scholar]
Figure 1.
Data collection and research methodology flow chart.

Figure 2.
Case study 1 baseline project simulation result (non-delayed schedule).

Figure 3.
Case study 2 project simulation result (non-delayed schedule).

Figure 4.
Case study 3 project simulation result (Non-delayed schedule).

Figure 5.
Case study project 1 critical and near critical path task list. (Note for abbreviations: IfA = Issue for Approval; IfD = Issue for Design; IfR = Issue for Review; MTO = Material Take Off; P&ID = Ping and Instrumentation Drawing).
Figure 5.
Case study project 1 critical and near critical path task list. (Note for abbreviations: IfA = Issue for Approval; IfD = Issue for Design; IfR = Issue for Review; MTO = Material Take Off; P&ID = Ping and Instrumentation Drawing).

Figure 6.
Sample milestone checklist. (Note for abbreviations: GAD = General Arrangement Drawing; HAZOP = Hazard and Operability (study)).
Figure 6.
Sample milestone checklist. (Note for abbreviations: GAD = General Arrangement Drawing; HAZOP = Hazard and Operability (study)).

Figure 7.
Sample list of drawing release status.

Figure 8.
Case study project 1 sample detailed design productivity management curve.

Figure 9.
Case study 1 sample interface checklist with other design types. (Note for abbreviations: CP = Critical Path; EA = Each; IFC = Issue for Construction; NCP = Near Critical Path).
Figure 9.
Case study 1 sample interface checklist with other design types. (Note for abbreviations: CP = Critical Path; EA = Each; IFC = Issue for Construction; NCP = Near Critical Path).

Figure 10.
Case study 1 sample major vendor print list. (Note for abbreviations: ACS = Automatic Control Service; CCC = Compressor Controls Corporation; FFG = Flame Front Generator; GA = General Arrangement; PO = Purchasing Order; VSD = Variable Speed Drive).
Figure 10.
Case study 1 sample major vendor print list. (Note for abbreviations: ACS = Automatic Control Service; CCC = Compressor Controls Corporation; FFG = Flame Front Generator; GA = General Arrangement; PO = Purchasing Order; VSD = Variable Speed Drive).

Figure 11.
Sample work front management curve. (Note for acronym: ISO = Isometric).


Table 1.
Percentage of task type in the critical path (CP) of the Sample engineering procurement and construction (EPC) Projects.
Table 1.
Percentage of task type in the critical path (CP) of the Sample engineering procurement and construction (EPC) Projects.
| Task Type | Critical Path (%) | |||
|---|---|---|---|---|
| Case Study 1 | Case Study 2 | Case Study 3 | Average | |
| Process | 38% | 2% | 16% | 18% |
| Civil | 38% | 12% | - | 17% |
| Building | - | - | - | - |
| HVAC * | - | 3% | - | 1% |
| Fire Fighting | - | - | - | - |
| Steel Structure | - | 8% | 21% | 9% |
| Mechanical | - | 13% | 14% | 9% |
| Piping | 26% | 24% | 35% | 28% |
| Electrical | - | 16% | 8% | 8% |
| Instrument and Control | - | 23% | 6% | 10% |
| Health and Safety | - | - | - | - |
| Sum | 100% | 100% | 100% | 100% |
* HVAC = Heating, Ventilation, and Air Conditioning.
Table 2.
Percentage of task type in the near critical path (NCP) of the Sample EPC Projects.
| Task Type | Near Critical Path (%) | |||
|---|---|---|---|---|
| Case Study 1 | Case Study 2 | Case Study 3 | Average | |
| Process | 5% | 2% | 11% | 6% |
| Civil | 29% | 12% | - | 14% |
| Building | - | - | - | - |
| HVAC * | 2% | 3% | 2% | 2% |
| Fire Fighting | - | - | - | - |
| Steel Structure | 2% | 8% | 6% | 5% |
| Mechanical | 12% | 13% | 47% | 24% |
| Piping | 27% | 24% | 22% | 24% |
| Electrical | 12% | 16% | 5% | 11% |
| Instrument and Control | 11% | 23% | 8% | 14% |
| Health and Safety | - | - | - | - |
| Sum | 100% | 100% | 100% | 100% |
* HVAC = Heating, Ventilation, and Air Conditioning.
Table 3.
Project schedule simulation with phase activity delay results.
| Case Study No. | Phase E = Engineering P = Procure C = Construction | Delay Impact Per Phase | |||
|---|---|---|---|---|---|
| 2 Days | 10 Days | 30 Days | 60 Days | ||
| 1 | E | Minimal Impact | 3 days delay | 17.5 days delay | 54.5 days delay |
| P | Minimal Impact | No delay | 1.8 days delay | 7.3 days delay | |
| C | Minimal Impact | No delay | 1.8 days delay | 7.3 days delay | |
| 2 | E | Minimal Impact | Minimal Impact | 2.5 days delay | 28 days delay |
| P | Minimal Impact | Minimal Impact | 2.5 days delay | 12 days delay | |
| C | Minimal Impact | Minimal Impact | 2.5 days delay | 12 days delay | |
| 3 | E | Minimal Impact | Minimal Impact | 12.5 days delay | 42.5 days delay |
| P | Minimal Impact | Minimal Impact | 4.5 days delay | 24 days delay | |
| C | Minimal Impact | Minimal Impact | 4.5 days delay | 24 days delay | |
Table 4.
Project schedule simulation with design activity delays.
| Case Study No. | Result Analysis | |||
|---|---|---|---|---|
| Delay Classification | 10 Days Delay | 30 Days Delay | 60 Days Delay | |
| 1 | Major | Piping | Process, Piping | Process, Piping |
| Minor | Process, Civil | Civil | Civil | |
| 2 | Major | - | Piping | Piping |
| Minor | Process, Piping, Installation, Steel Structure | Process, Piping, Installation, Civil, Steel Structure | Process, Installation, Civil, Steel Structure | |
| 3 | Major | - | Process, Piping | Process, Piping |
| Minor | Process, Steel Structure, Piping, Electrical | Steel Structure, Electrical | Steel Structure, Electrical | |
© 2019 by the authors. Licensee MDPI, Basel, Switzerland. This article is an open access article distributed under the terms and conditions of the Creative Commons Attribution (CC BY) license (http://creativecommons.org/licenses/by/4.0/).
Share and Cite
MDPI and ACS Style
Yi, D.; Lee, E.-B.; Ahn, J. Onshore Oil and Gas Design Schedule Management Process Through Time-Impact Simulations Analyses. Sustainability 2019, 11, 1613. https://doi.org/10.3390/su11061613
AMA Style
Yi D, Lee E-B, Ahn J. Onshore Oil and Gas Design Schedule Management Process Through Time-Impact Simulations Analyses. Sustainability. 2019; 11(6):1613. https://doi.org/10.3390/su11061613
Chicago/Turabian StyleYi, Daekyoung, Eul-Bum Lee, and Junyong Ahn. 2019. "Onshore Oil and Gas Design Schedule Management Process Through Time-Impact Simulations Analyses" Sustainability 11, no. 6: 1613. https://doi.org/10.3390/su11061613
Note that from the first issue of 2016, this journal uses article numbers instead of page numbers. See further details here.