China’s Energy Consumption Rebound Effect Analysis Based on the Perspective of Technological Progress

1
School of Economics and Management, University of Chinese Academy of Sciences, Beijing 100190, China
2
Institute for Urban and Environmental Studies, Chinese Academy of Social Sciences, Beijing 100028, China
*
Author to whom correspondence should be addressed.
Sustainability 2019, 11(5), 1461; https://doi.org/10.3390/su11051461
Submission received: 24 January 2019
/
Revised: 2 March 2019
/
Accepted: 5 March 2019
/
Published: 9 March 2019
Abstract
:Energy issues are the focus of global concern, and estimations of the energy rebound effect are very important for energy policy. Existing research has proved the existence of the energy rebound effect. This paper, based on the estimation of China’s capital stock in 1952, establishes three elements of the neoclassical production function to calculate the contribution rate of technological progress on economic growth. It then calculates China’s energy rebound effect over the past 20 years from the perspective of technological progress. The research results show that though China’s energy intensity has been declining from 1994 to 2017, the energy rebound effect each year is obviously different, with an average level of 54.4%. Technological progress leads to the improvement of energy efficiency, which reduces energy consumption, but the rebound effect makes energy savings less effective than expected. This paper proved the Granger causality between energy structure adjustment and the rebound effect. And the increase of coal consumption will enhance the rebound effect. So, upgrading the structure of energy consumption is considered helpful to reduce the energy rebound effect, which can promote energy conservation and emission reduction.
1. Introduction
Energy plays an important role in the development of the human civilization, and energy policies are related to national security and stability. As the crisis of fossil fuels (such as coal, etc.) deepens, more and more countries, especially small island developing states (SIDS) with limited resources, have sought to develop new and renewable energy resources [1]. Although China is the largest developing country in the world with abundant resources, it is also facing an energy crisis. In 2017, China’s total energy consumption reached 4.49 billion tons of standard coal, making it the world’s largest energy consumer. What’s more, the proportions of coal and oil consumption are the highest. Meanwhile, with the growing population and economy, the potential demand for energy in China is also increasing. The problems of energy shortages and environmental pollution caused by the increase in energy consumption need to be urgently solved. However, energy investment is an important driving force for China’s extensive economic growth. Reducing energy consumption is likely to bring about a decline in economic growth. Therefore, how to resolve the contradiction between rapid economic growth and energy conservation has become a hot topic and the focus of discussion.
At present, energy-saving measures, on-site power generation technology, demand side management, energy storage technology and the innovation of business models have reshaped the energy market [2]. The development of renewable energy is likely to become the most important engine of economic growth in the future, and it is an important strategic opportunity for developing countries to promote the development of the renewable energy industry. The report of the 19th National Congress of the Communist Party of China pointed out that optimizing the energy structure and achieving clean and low-carbon development are essential requirements for promoting China’s energy revolution and the associated urgent demands for China’s economic and social transformation and development. Technological progress through innovation and development is an important way to reduce energy consumption. Technological progress can help reduce unit energy consumption, improve energy efficiency, and thus reduce energy consumption. Therefore, technological progress should be an important part of energy policies to achieve energy conservation and emission reductions. However, the goal of energy conservation and emission reductions may not be achieved as planned, because the energy rebound effect is ignored in technological progress policies. At the Climate Change Conference held in Paris in 2015, China promised to peak CO2 emissions by around 2030 and strive to achieve it as soon as possible, and by 2030, to reduce CO2 per unit of GDP by 60–65% compared with 2005 levels. The energy rebound effect can offset the effect brought about by technological progress on energy conservation and emission reductions, which is the necessary measure to keep our promises. Therefore, this paper takes the rebound effect as the main indicator, which is also an important basis for the formulation of energy policies.
The rebound effect is one of the most important topics of energy economics, and it can directly affect the implementation effect of energy policies. However, the academic community has not reached a consensus on whether energy efficiency improvements can promote energy conservation, and if so, how much it can reduce energy consumption. Is it possible to achieve energy conservation and emission reduction by technological progress? That’s a question which many researchers are asking.
Improving energy efficiency through technological progress is an important policy for China to achieve energy conservation and emission reductions, but it is a question of policy whether technological progress can really reduce the energy consumption. Therefore, this paper analyzes the energy rebound effect of energy based on the perspective of technological progress, which is helpful to make more accurate estimations of China’s macro energy rebound effect. The exploration of how technological progress affects energy consumption can provide support for the Chinese government to formulate scientific, rational and effective energy policies, as well as theoretical bases and policy guarantees for the sustainable social and economic development under the “new normal”. From a practical point of view, studying the relationship between energy restructuring and the rebound effect can contribute to a reduction of the rebound effect, and provide references and bases for making feasible energy plans. From the perspective of technological progress, although the energy rebound effect does exist, it has not been so strong as to obviously affect China’s energy conservation and emission reduction in the past 20 years. However, we must realize that the rebound effect does have a negative influence on energy policies, and technological progress can’t be the only means to solve the problems of energy limits. Other supporting policies are also necessary.
2. Literature Review
Energy policies are relevant to national security and stability. And the development of renewable energy has become a new economic growth point, as the crisis brought about by fossil fuels is deepening. Renewable energy projects are usually assessed with the method of Levelized Cost of Energy (LCOE), which is specified by Pawel [3]. However, according to the study of Jacqueline Yujia Tao and Anton Finenko, grid parity based on LCOE estimates is an incomplete benchmark, because LCOE fails to take financing constraints into account. Financing details strongly influence the economic feasibility of renewable energy projects. Thus, accessing low cost financing should be taken into consideration when formulating energy polices [4]. The evaluation of energy policies usually focuses on the assessment of energy security and environmental protection. Both the quantitative and qualitative analyses which are conducted within the evaluation system involve the government, third-party institutions and the public. What’s more, by taking the balance among technical, economic and social rationality as the initial point, energy policies can be assessed with the indicators of energy, economy and society [5]. Shen et al. analyzed the development stages of sustainable energy policies in China and their disadvantages by establishing a sustainability evaluation system for sustainable energy policies in four aspects, i.e., the integrity of the energy polices, energy supply security, the sustainability of energy consumption, and the energy technology and education [6]. With the evolution of energy policies, the decline of energy intensity has become the most important factor associated with energy consumption reduction [7], which proved that technological progress plays an important role in achieving the goal of energy conservation and emission reductions. However, the effect brought about by technological progress has been greatly offset by the rebound effect.
In 1865, William Stanley Jevons described in detail in The Coal Question [8] that the demand of a resource would increase as its efficiency improved, and then he proposed the concept of the energy rebound effect. According to Jevons, the rebound effect is the energy consumption resulting from efficiency. Improvements in energy efficiency will lead to a decline in energy prices, which can stimulate the demand for energy; therefore, the reduction of energy consumption caused by increased efficiency may be offset, partially or completely.
Although there has not been consensus on how much the rebound effect is caused by energy efficiency improvements, the existence of the rebound effect is generally accepted. There are many ways to calculate the energy rebound effect. For example, Smeets et al. estimated the EU’s policy of adding 10% biofuels to traditional fuels to reduce carbon dioxide emissions with the Computable General Equilibrium (CGE) Model, and pointed out that in 2020, the rebound effect of this policy would be 22–30%, which means that the reduction in carbon dioxide emissions would be far less than expected, and the effectiveness of the biomass fuel policy would be reduced significantly by the rebound effect [9]. Luo et al. measured the evolution characteristic of China’s energy efficiency from 1995 to 2011 with the Geographically and Temporally Weighted Regression (GTWR) Model, and calculated the energy rebound effect with the neoclassical economic model [10]. The results showed that there was a great fluctuation in China’s energy rebound effect. Hong et al. calculated the energy rebound effect of energy subsidy policies with the Input-Output Method [11]. Liu et al. simulated many different scenarios and studied the rebound effects of different types of energy with the CGE model. The results showed that compared with the efficiency improvement of primary energy, that of secondary energy was more effective [12].
Since the rebound effect can directly affect the implementation effect of a country’s energy policies, worldwide scholars have actively explored the existence and degree of the rebound effect in their own countries’ energy utilization. The results showed that the energy rebound effect of the UK was 30–50% when the overall energy efficiency improved 5% [13], that of Sweden was 40–70% for a 5% improvement of industrial energy, and the energy rebound effect would be higher if only the energy efficiency of energy-intensive products were improved [14]. In Norway, the rebound effect of oil and electrical energy was highest in the manufacturing sector, while in other sectors it was almost non-existent [15]. Technological progress is an important means of solving the energy crisis, although it has also been proven that energy efficiency improvements could cause an energy consumption rebound effect [16]. The price fluctuations caused by energy efficiency improvements are an important contributor to the energy rebound effect. Take Sudan as an example; due to the low flexibility of the fuel market, there was a drastic fluctuation in fuel prices resulting from the efficiency improvement of stove during Sudan’s stove reform in the 1990s, which offset about 42% of the energy saved by the efficiency improvement [17]. The existing estimates of China’s energy rebound effect varied with the selected method, time and perspective. Liu et al. estimated China’s energy consumption rebound effect based on the technological progress with the provincial panel data, and found that the average energy rebound effect in China from 1986 to 2005 was 58.63% [18]. Kong et al. estimated the energy rebound effect of China in terms of output, and believed that, due to the existence of the rebound effect, the energy efficiency improvements and energy conservation are not equal [19]. Huang & Hu determined that the average energy rebound effect for China from 1979 to 2009 was 132% [20]. They believed that energy conservation and emission reduction couldn’t rely solely on technological progress, and that it also requires the implementation of policies such as energy price reforms. It is too risky to promote energy transformation by subsidy policies [21], which were not able to effectively alleviate increases in energy consumption. Studying the energy rebound effect can help to find the root causes of energy consumption increases. Wang et al. have studied the mechanisms of the rebound effect; they showed that improvements in energy efficiency did not necessarily reduce energy consumption because of the existence of income effect and substitution effect in economics [22].
Economic growth is the main driving force behind energy consumption [23]. The energy rebound effect exists in both developing and developed countries; the differences lies in how strong the energy rebound effect is, and in which industrial sectors it exists. Hymel and Small estimated the energy rebound effect of car travel in the US from 1966 to 2009, and found that it showed a downward trend, with a long-term rebound effect of 30%, and a short-term effect (i.e., annual average) of about 4.7% [24]. Also, the energy rebound effect was higher when energy prices increased compared to when they declined. Frondel et al. found that in Germany, the average energy rebound effect of private transport was 57–62% from 1997 to 2009 [25]. Meanwhile, the rebound effect increased as fuel prices dcreased. Therefore, the energy rebound effect must be taken into full consideration when energy policies are being formulated. Liu & Lin studied the energy rebound effect of China’s construction industry and found that, from 2003 to 2012, China’s construction industry saved 27.11 million tons of standard coal due to energy efficiency improvements, and if there was no energy rebound effect, 7.57 million more tons of standard coal would have been saved, that is, the energy rebound effect in the construction industry was about 21.8% [26]. Guo et al. estimated that the average energy rebound effect for China’s industrial sector was 46.38% from 1979 to 2007 [27]. Although the energy rebound effect in China’s industrial sector has been declining, it is still much higher than that of developed countries. Macro-control measures such as tax policy must be implemented to achieve the goal of energy conservation and emission reductions [28]. Wang & Lu analyzed the energy rebound effect for China’s highway freight transportation sector. The result showed that, from 1999 to 2011, the long-term energy rebound effect was 84%, and the regional rebound effect in the eastern, central and western region was 52%, 80% and 78%, respectively [29]. In the short term, the direct energy rebound effect in China’s transportation sector decreased as the urbanization rate declined. Sun et al. summarized the existing research on the rebound effect regarding household energy [30]. The research of Ouyang et al. showed that the energy rebound effect of Chinese household energy consumption was at least 30% higher than that in developed countries, which could be reduced in the following five ways: developing renewable resources, increasing energy prices, improving energy efficiency, establishing a reasonable energy price system and regulating consumer behavior [31].
In conclusion, domestic and overseas scholars have researched the energy rebound effect widely, from national perspectives to regional comparisons, from the whole energy system to various types of energy, from overall economic analyses to individual industries and sectors. The existence of the energy rebound effect and its disadvantages in terms of energy conservation and emission reductions have been both shown; however, consensus has not been reached on its extent, and there is still some debate about whether technological progress can affect energy consumption. What’s more, most of the existing research has focused on estimating the energy rebound effect, rather than exploring whether or how it might be regulated. Therefore, after exploring the influencing factors of the rebound effect, this paper found that the energy structure is the Granger cause, and that the adjustment of energy structures can be an important means to regulate the energy rebound effect.
Because of the rebound effect, improvements in energy efficiency do not reduce, but increase, energy consumption. This is a concrete reflection of the income effect, which means more energy will be consumed with the same expenditure under a fixed budget or income. As technological progress has encouraged energy efficiency improvements and economic development, it is hard to estimate the effect of technological progress with the method of statistics and econometrics, due to the statistic and meterage difficulties. So, with macro economic data, this paper took both the consumption increase caused by economic growth and that caused by energy efficiency improvements as the causes for an energy rebound effect associated with technological progress. Improvements of energy efficiency mainly depend on technological progress, and technological progress has always been regarded as an important way to energy conservation and emission reductions. In this context, estimating the energy rebound effect is of significant value to analyzing the implementation effect of energy policies. It can clarify problems in current economic and energy policies, and help to achieve the goal of energy conservation and emission reductions. This paper contains four parts; the first is the estimation of China’s capital stock with the year of 1952 as the benchmark; the second part then calculates the contribution-rate of technology progress to economic growth with a three-factor neoclassical production function; the third part is the estimation of China’s energy rebound effect and a test of the relationship between energy structures and the energy rebound effect with Granger causality; finally, this paper analyzes the problems existing in China’s current energy policies and makes policy recommendations.
3. Model and Data
3.1. Estimation Model of the Energy Rebound Effect
The energy rebound effect can be expressed as the difference between the estimated energy consumption savings and the actual energy consumption savings divided by the estimated energy consumption savings. The rebound effect caused by technological progress is equal to the ratio of the increase in energy consumption resulting from technological progress over the energy savings brought about by energy efficiency improvement [28]. In this paper, technological progress is expressed in terms of the total factor productivity, .
Let Yt be the output of year t, Et be the energy consumption of the year t, and EIt be the energy intensity of the year t, that is, the energy consumption per unit of output, dividing the total energy consumption by the output of the current year:
Technological progress can improve energy efficiency, reduce energy intensity and leading to a decline in energy consumption. Let Dt+1 be the energy savings of year t + 1, then:
According to Solow, economic growth can be attributed to capital accumulation, labor or population growth, and technological progress. That is, technological progress can be regarded as a driving force of economic growth, while at the same time, technological progress can also increase energy consumption due to falling energy prices. Let be the contribution rate of technological progress to economic growth; then, in year t + 1, the output growth brought about by technological progress will be , such that the increase of energy consumption brought about by technological progress is:
The energy consumption rebound effect brought about by technological progress can be calculated with:
In the above formula, output Y can be expressed as nominal GDP, and energy intensity EI can be calculated by the ratio of energy consumption over output. Since energy consumption can be obtained directly, all we need to calculate the energy consumption rebound effect of technological progress is the contribution rate of technological progress to economic growth, that is, the contribution rate of total factor productivity to economic growth.
Taking energy consumption into consideration, the three-factor neoclassical production function can be written as follows:
Here, Yt is the output of year t, Kt is the capital stock of year t, Lt is the labor input of year t, Et is the energy consumption of year t, and At = A0ert is the technological progress, where r is the rate of technical progress. Then, the three-factor production function is:
Take the logarithm of each side:
Let the output elasticity of capital, labor and energy be , and , and the growth rate of output, capital, labor and energy consumption be gY, gK, gL and gE, respectively. Generalized technological progress, gA, is the Solow Residual. The relationship among these five variables can be expressed as:
The contribution of total factor productivity to economic growth is:
Then, the energy consumption rebound effect of technological progress can be obtained by substituting into Formula (4).
3.2. Capital Stock Accounting
The Perpetual Inventory Method, first proposed by Gold-Smith in 1951, is the basic tool for capital stock accounting. The formula is:
Kt is the capital stock of year t, Kt−1 is the capital stock of year t − 1, It is the investment of year t, and is the depreciation rate of year t.
It can be seen from the formula that the capital stock accounting can be divided into three steps: first, selecting the base period and estimate the capital stock at that time; second, estimating the annual capital flow, which depends on the amount of investment and price indices of investment; and third, choosing the depreciation rate. The earlier the base period is selected, the less the influence of estimation error of capital stock on the subsequent years. This paper takes the year 1952 as the base period, and 80 billion as the amount of capital stock [32], which is the closest to the true value in existing research. The amount of investments and price indices of investment since 1994 can be checked in the Statistical Yearbooks, and the price indices of investment before 1994 can be calculated with the formula of “Fixed Asset Investment Price Index of year X (set the index of year 1952 is equal to 1) = Gross Fixed Capital Formation of year X (current price)/(Gross Fixed Capital Formation of 1952 (price of the year 1952) * Index of Fixed Capital Formation of year X)”. As China’s depreciation rate has not exceeded 7% since the 1980s, this paper takes 5% as the depreciation rate in capital stock accounting, which is widely accepted. It is shown in Figure 1 that China’s capital stock has been rapidly increasing since 1994. The growth rate in the 1990s was about 20%, and that of recent years was about 10%. Such a large amount of capital stock and a high growth rate have contributed to a sharp increase in annual net growth, which is in line with China’s rapid economic development.
3.3. Data Explanation
This paper analyzes the energy rebound effect brought about by technological progress in China from 1994 to 2017, with the China Statistical Yearbook 2018 as data source. Capital stock is calculated with the Perpetual Inventory Method. In order to eliminate the impact of price, price data are deflated, with the constant price in 1990 as benchmark.
4. Energy Consumption Rebound Effect
4.1. Estimation of Elasticity Coefficients of Related Factors
Stationarity test, or unit root test, should be conducted in time series analyses to avoid spurious regression. The ADF test results of the four variables, Y, K, L and E, are all unstable, but the first-order differences are stable. The result of the Johansen test, or co-integration test, of the four variables is shown in Table 1. It can be seen that there are co-integration relations among energy, capital, labor and output, that is, there is a long-term equilibrium among the four variables.
The correlation analysis of variables was shown in Table 2.
It can be seen that the correlation coefficients between each of the two variables are greater than 0.95, which indicates the existence of a correlation between the explanatory variables. An Ordinary Least Squares Regression Model was used to provide further explanation of the relationships between the variables, so as to avoid the problem of multicollinearity. The result of regression is:
The elasticity coefficients of the explanatory variables are between 0 to 1, which is valid. R2 is 0.9987, and the t-values are shown in parentheses. Since the fitting effect of this regression model is satisfactory and the regression effect is perfect, the result of this model can be used as the final result of the estimation of the three-factor production function from 1994 to 2017.
4.2. Contribution Rate of Technology Progress and Its Rebound Effect
The growth rate of output, capital, labor and energy from 1994 to 2017 can be calculated according to the basic data, and the contribution rate of technological progress on output can be obtained by substituting the growth rates and the results of ridge regression (i.e., the output elasticity of each input factor) into Formula (9). The increases in energy savings and energy consumption increases resulting from technological progress can be obtained through Formulas (2) and (3), respectively. Then, the energy rebound effect of technological progress can be calculated with Formula (4). The results are shown in Table 3.
Overall, the average energy rebound effect between 1994 to 2017 was 54.4% without “temper”, but the energy rebound effect of each year was quite different. The energy rebound effects in 2002, 2004 and 2005 were 113.58%, 176.62% and 174.36%, respectively. The reason for this “temper” was that the increase of energy consumption promoted by economic growth resulting from technological progress offset the decrease of energy intensity. It can be seen from Table 3 that China’s energy intensity has been declining, from 2.44 tce/ten thousand yuan GDP in 1994 to 0.54 tce/ten thousand yuan GDP in 2017. The speed of this descent has slowed in recent years, but it was over 10% in the 1990s, which was relatively high. This result is consistent with the reality of China’s technological progress and economic development. The introduction and re-creation of technology were the main tasks in the early stages of reform and the opening up of the economy, so energy efficiency improvements were significant, with rapid technology progress that was taking place at that time. Then, when independent innovation became the main driving force for technological progress, the improvement of energy efficiency slowed down due to the lag effect of the innovation.
In 2003, the contribution rate of technological progress to economic growth was negative, and the energy consumption increase brought about by technological progress was also negative. The negative energy savings in 2003 were closely related to the industrial restructuring in China at that time. What’s more, it is unscientific to regard the output increase brought about by other factors, rather than the increase of input as the effect of technological progress. The contribution rate of technological progress on economic growth depends on the selected factors and their estimation methods in production function, as does the rebound effect.
Table 3 shows that China’s energy rebound effect was very large from 2002 to 2005, and there were “tempers” in these three years. This can be explained as the great impact of international trade on China’s energy consumption after entering the World Trade Organization in 2001. In 2008, the occurrence of the US subprime mortgage crisis triggered a global economic crisis, which directly impacted the development of China’s steel industry, and resulted in the continuous decline in coal demand in China. In 2009, under the effects of the economic crisis, the energy consumption increase and energy savings caused by technological progress were significantly reduced, which has made the energy rebound effect drop from 38.14% in 2008 to 25.69%. In 2012, China’s economic growth slowed down with the second economic crisis, resulting in a decline in coal demand and a slow increase in oil demand. During this period, China increased the rate of strategic transformation of energy industry, and kept the rebound effect at around 40%, from 2009 to 2013, by reforming energy mechanisms and improving the energy price mechanism. In 2014, China’s development entered the “new normal”, and a series of measures to deepen reforms was gradually promoted. Notably, more emphasis has been placed on the construction of ecological civilization, which is helpful for the development of clean energy. The rebound effect in 2015 and 2016 was 27.95% and 26.37%, respectively. The increase of the rebound effect in 2017 was associated with the sudden increase of fossil fuel consumption, including oil consumption. Although China’s energy policy is stable, the effect of technological progress on energy conservation and emissions reductions is constantly changing. On the whole, China’s energy rebound effect is less than 100, which means that the energy efficiency improvements brought about by technological progress are a way of reducing energy consumption, and that China has made some achievements in terms of energy conservation and emissions reductions. However, there is still room for further reductions in China’s energy rebound effect. Since the implementation effect of the energy policy can be directly affected by the energy rebound effect, it must be taken into consideration when formulating further energy policies. Analysis of the influencing factors of the rebound effect can help reduce the rebound effect.
5. Energy Structure and Rebound Effect
5.1. Current Situation
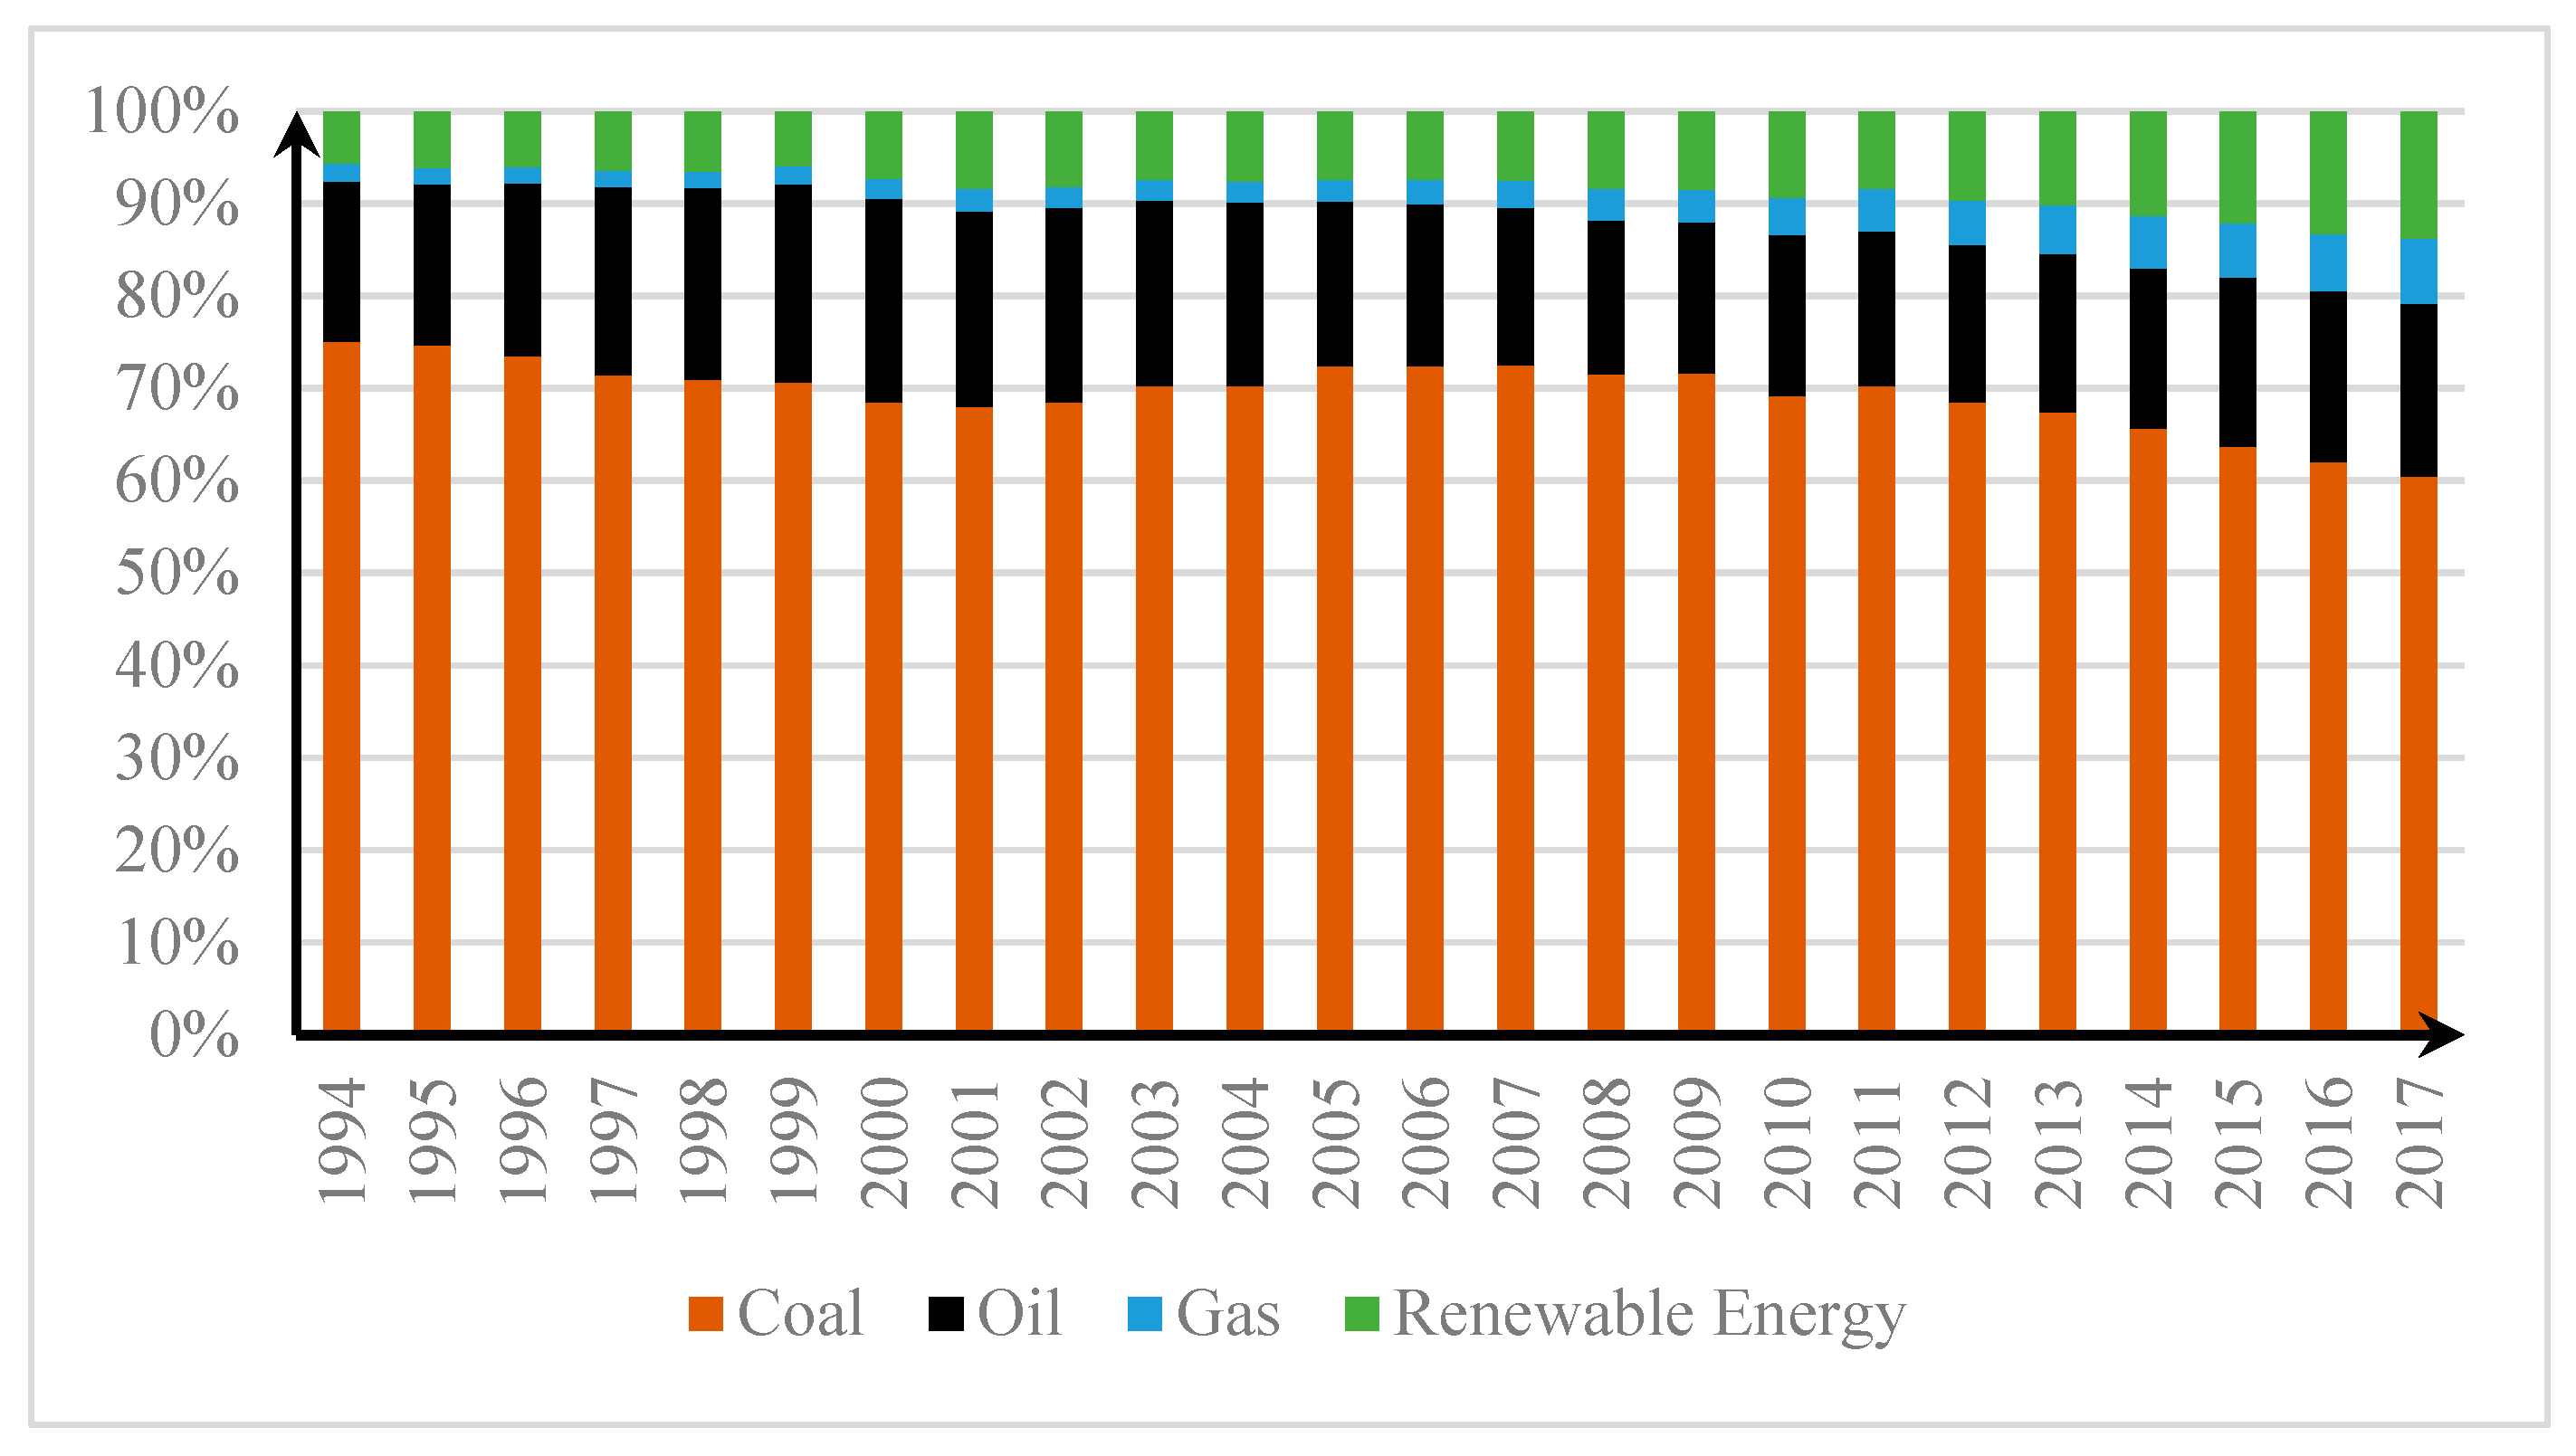
The resource endowment of “rich in coal, short in oil and poor in gas” determines the coal-dominant consumption structure of energy in China, and coal has become the main pollutant for China’s ecological environment. The energy structure must be adjusted for pollution control. Figure 2 shows the change of China’s energy structure since 1994. Though the proportion of coal consumption has been declining, it is still over 60%; the proportion of oil consumption rose in the first few years and then declined; it represents around 18% of the annual total at present; the proportions of natural gas and renewable energy consumption were 7% and 13.8% respectively in 2017, and this is increasing year by year. Overall, China’s energy consumption is still dominated by coal; this can be explained by the following three notions: First, coal in China is more abundant than other resources such as oil and natural gas, which results in a relatively low price of coal; furthermore, the transportation of coal is more convenient and safe. Second, in terms of technical constraints and costs, it is much more difficult and costly to use solar energy, wind energy, nuclear energy, geothermal resources, tidal energy, etc. Third, the heavy industry dominated conditions in China and the disadvantages of energy utilization technology make coal the irreplaceable, basic energy source in the industrial development of the country. In terms of the relationship between energy structure and the rebound effect, the proportion of coal consumption in 2002, 2004 and 2005 increased slightly, that is, the increase in coal consumption has a great effect on the energy rebound effect.
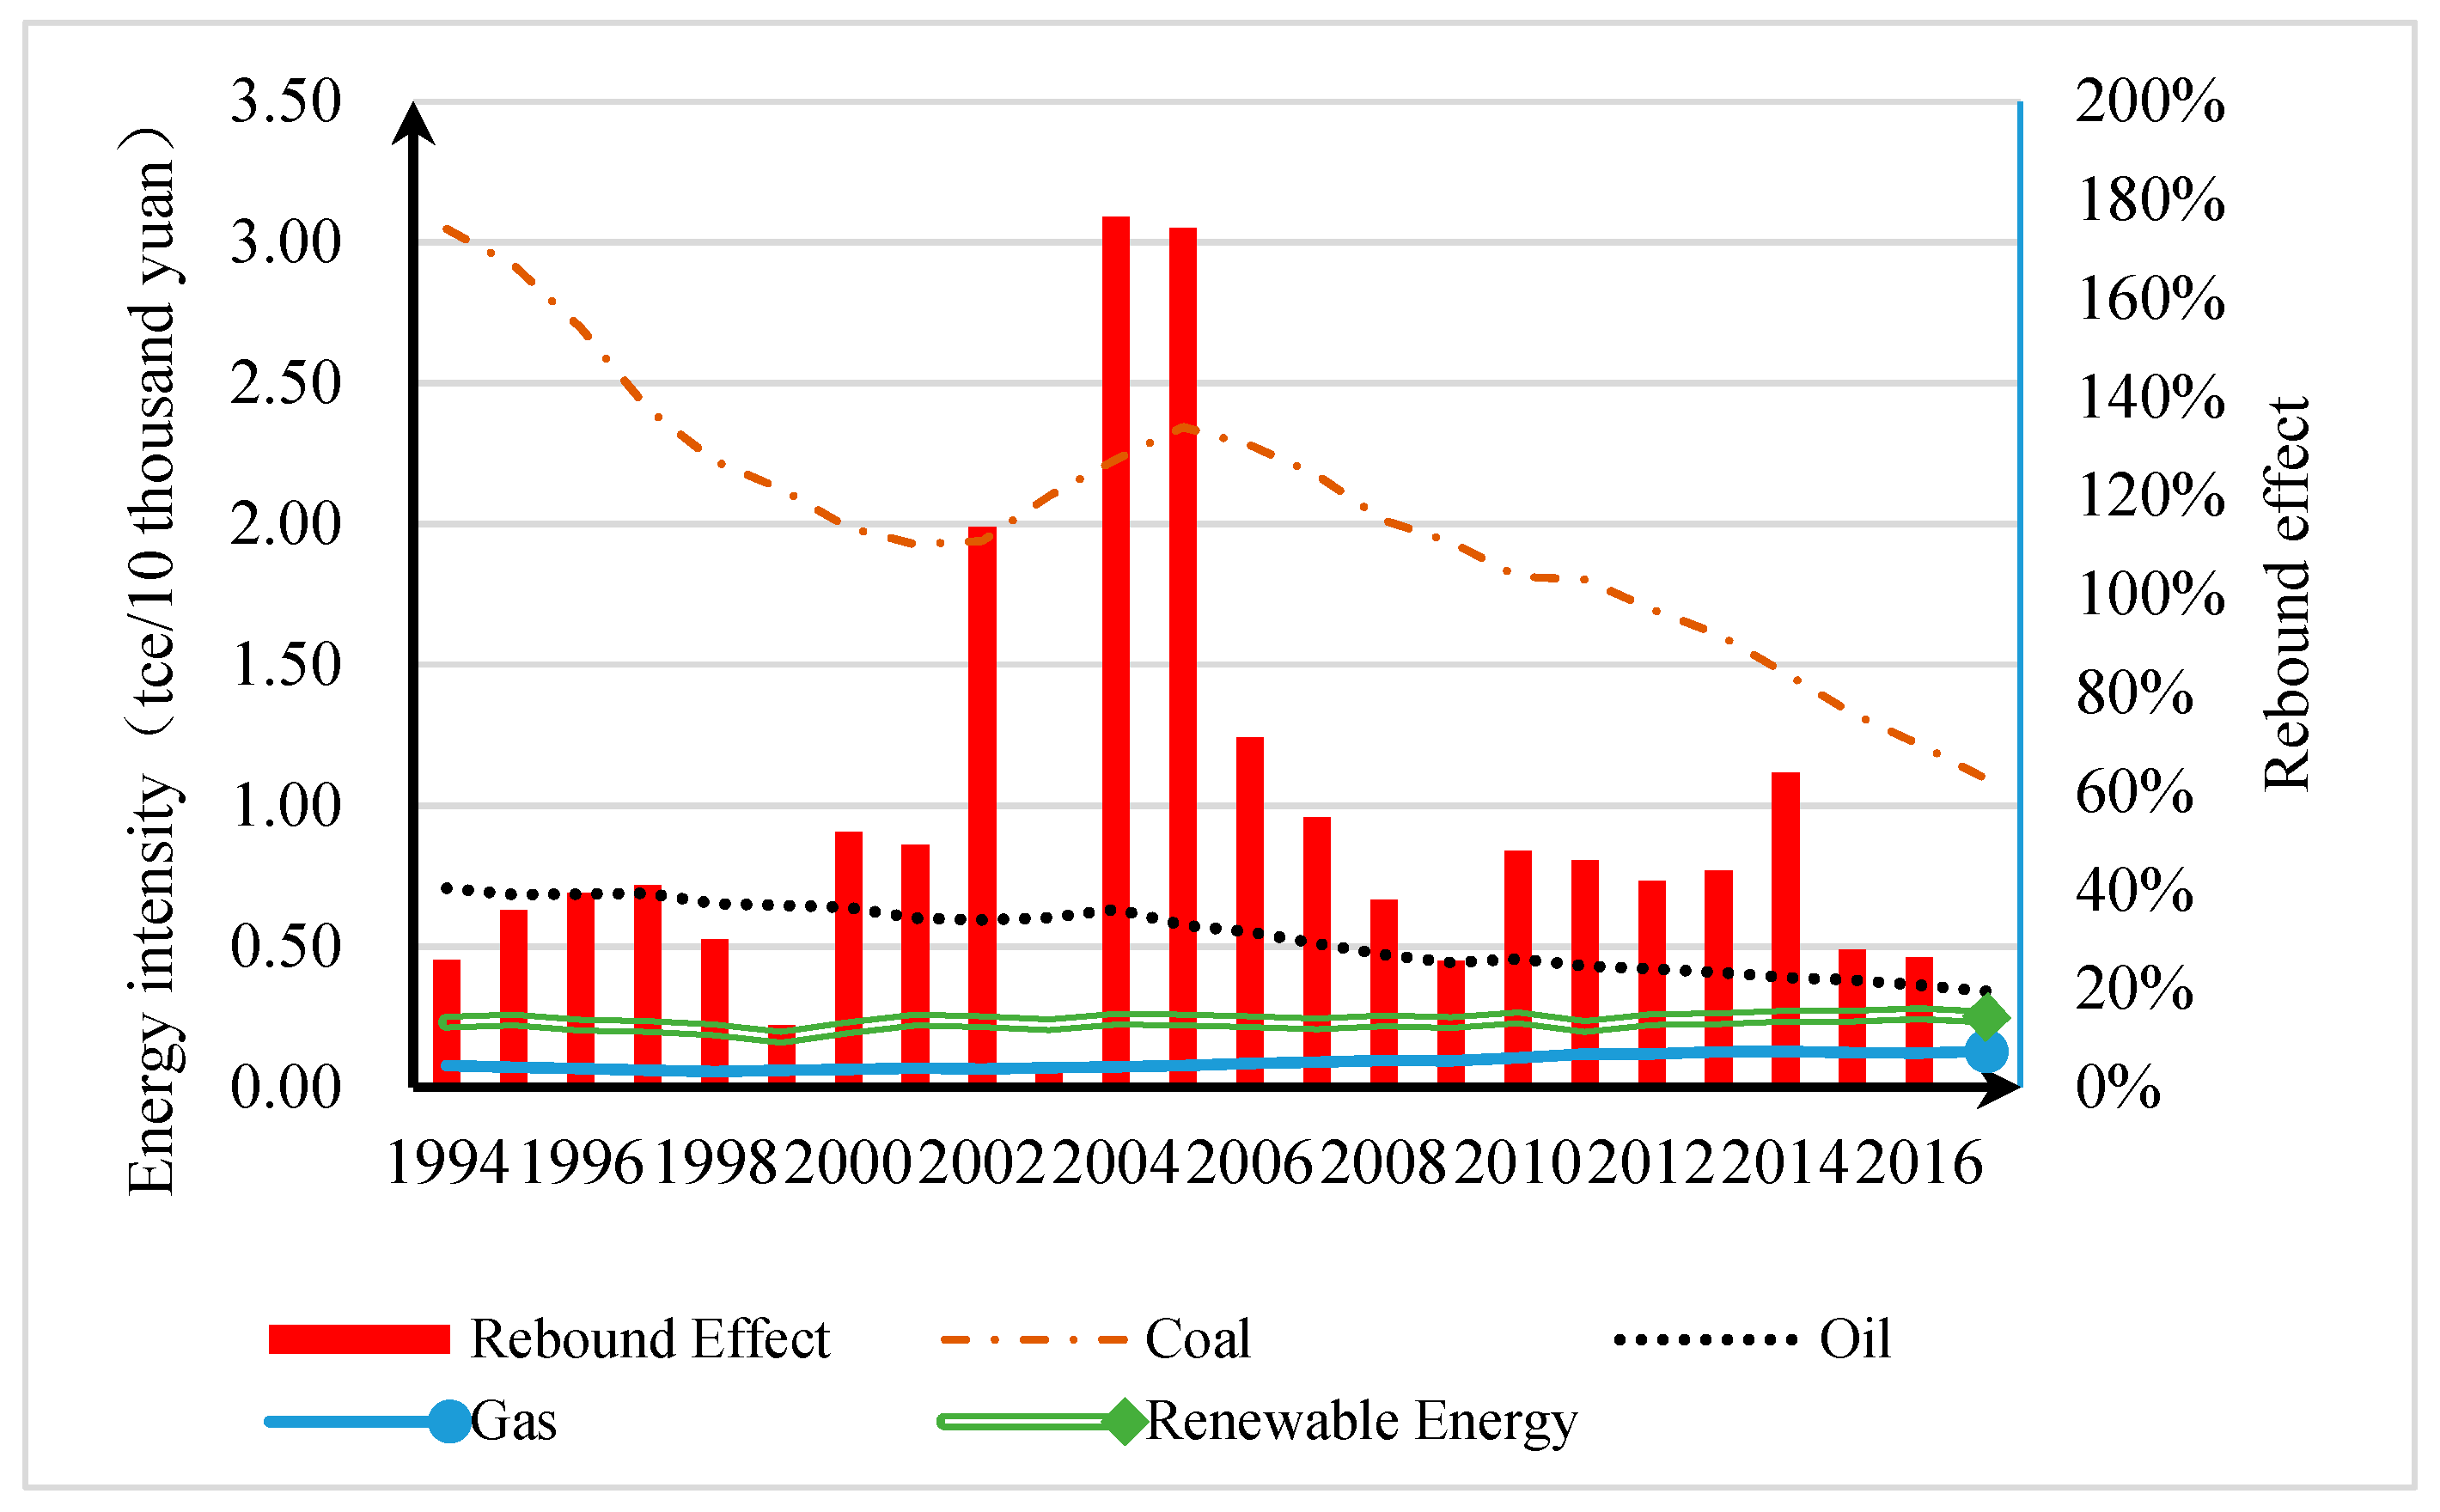
The essence of the energy rebound effect is the increase of energy consumption because of the reducing energy prices which result from energy efficiency improvements brought about by technological progress. Figure 3 shows the energy intensity and rebound effect of several kinds of energy in China. The energy intensity of coal from 1994 to 2016 shows a downward trend, from 3 tce/10 thousand yuan GDP to 1.1 tce/10 thousand yuan GDP, with a 63.3% of decline. However, the energy intensity of coal showed a short-term increase between 2002 and 2006, which may explain why the rebound effect at that time was over 100. An increase in coal energy intensity occurred after China’s accession into the World Trade Organization in 2001. At that time, the high-speed development of economy in China led to a rapid increase in energy consumption, especially in the demand for coal, which resulted in a rising proportion of coal consumption in energy consumption structures. The energy intensity of oil declined gradually from 0.7 tce/10 thousand yuan GDP to 0.34 tce/10 thousand yuan GDP, i.e., a decline about 50%. This can be attributed to the downswing trend of the proportion of oil consumption in the energy consumption structure which resulted from technological progress and the substitution effects of renewable energy. What’s more, China’s economy has shown a trend of high- to medium-to-high-speed growth. The decline of the energy intensity of oil has been a result of both the aforementioned situations. With energy restructuring, the proportion of natural gas and renewable energy has increased year by year. The energy intensity of natural gas has risen from 0.08 tce/10 thousand yuan GDP to 0.12 tce/10 thousand yuan GDP, and that of renewable energy has fluctuated at around 0.23 tce/10 thousand yuan GDP. Adjusting the energy structure by using clean energies such as natural gas, wind and solar will lead to an increase in the proportion of natural gas and renewable energy consumption in energy consumption, and the energy intensity of natural gas and renewable energy sources will increase as the increase in energy consumption is faster than that of the economy. However, the energy intensities of natural gas and renewable energy are still much lower than those of coal and oil. Energy intensity can be affected by both technological progress and energy structure adjustment. Certainly, improvements in the efficiency of industrial activities have also contributed to the decline of energy intensity in China. The energy revolution has been deepened with the advancement of industrialization. Since the energy consumption associated with industrial activities is more than half of China’s total, the efficiency improvement in industrial activities will surely lead to an overall decrease in energy intensity. Since 2007, the proportion of coal consumption has been decreasing, and the energy rebound effect has been stable, that is, the energy efficiency improvements brought about by technological progress have made some achievements in terms of reducing energy consumption.
A Granger causality test is applied to analyze the relationship between energy restructuring and the rebound effect, since it cannot be obtained directly.
5.2. Granger Causality Test
The Granger causality test is a statistical method of hypothesis testing proposed by Nobel Prize-winning economist, Clive Granger in 1969. It is mainly used to test whether changes in a set of time series variables can lead to changes in another set of time series variables. Granger causality describes the dynamic correlation between variables, rather than a kind of causal relationship. If the time series variables are non-stationary, there might be “spurious regression”, that is, the Granger causality test is only valid for stationary time series variables.
5.3. Data Description and Results Analysis
Energy restructuring (ST) can be expressed by the proportion of renewable energy consumption (the data of renewable energy consumption can be obtained from China Statistical Yearbook 2018); the energy rebound effect (RE) was obtained through the above formulas. Table 4 shows the results of the stationarity test.
According to the unit root test, the RE is stationary; the first-order difference of ST is also stationary, or is integrated of order 1. Since RE and △ST are stationary, and the Granger causality test can be conducted; the results are shown in Table 5.
ST is the Granger reason for RE, while RE is not the Granger reason for ST, that is, ST is the one-way Granger reason for RE. Since the energy rebound effect can be affected by energy restructuring, the size of the energy rebound effect can be predicted and regulated by adjusting the energy structuring.
Due to the rebound effect, the goal of energy conservation cannot solely be realized by technological progress; energy restructuring is also an important means to reduce energy consumption.
6. Conclusions and Recommendations
In the 40 years of reform and opening-up, China’s economy has been transformed from high- to medium-to-high speed development, with increases in energy demand and consumption. China, as the world’s second-largest economy, has a long-term equilibrium among its economy, capital, labor and energy sectors. The scale effect of China’s economic growth on the absolute amount of energy consumption should not be underestimated. Technological progress is the main driving force for economic growth, and energy efficiency improvements brought about by technological progress are an important policy means for achieving the goal of energy conservation and emissions reductions. However, the effects of this policy have almost been offset by the energy rebound effect. Although there was no “temper” in China in the past 20 years, an average energy rebound effect of 54.4% was still a barrier to energy conservation and emissions reductions. Since energy restructuring has been shown to be the Granger reason for the rebound effect, it can be used as an important policy means for energy conservation and emissions reductions. Here are some recommendations for reducing the energy rebound effect.
1. Promote energy technology innovation and generalize the application of energy conservation and emission reduction technologies. Technological progress is important for reducing energy intensity and for improving energy efficiency, and it is also the principal means of reducing the energy rebound effect. Keeping consistent with international standards, such as ISO 50001, can help to save money as well as to conserve resources and tackle climate change. Although it has been shown that the effect of technological progress on energy conservation and emissions reductions could be offset, to some extent, by the energy rebound effect, technological progress is still an effective means of energy conservation and emissions reductions, as the rebound effect is less than 100. Therefore, based on China’s national conditions, we should promote energy technology innovations, combine them with industry transformation and upgrades, achieve the goal of energy conservation and emissions reductions while exploring the new point of growth in economic development.
2. Deepen the reform of energy pricing. The effect of technological progress on energy conservation and emissions is affected by the degree of the energy rebound effect. And, since the energy rebound effect is essentially a reflection of the income effect, its degree is closely related to energy prices. Low energy prices, which are in conflict with the goal of energy conservation and emissions reductions, are one of the most important causes of energy consumption increases. Energy price mechanisms should reformed from multiple aspects, such as tax adjustments, subsidies adjustments, market regulations and so on, instead of simply raising energy prices. The scarcity of energy should be reflected reasonably on its price and the effectiveness of resource allocation should be ensured. Take the price reform of electricity, for example; in order to promote the reform, we should, on the one hand, improve the trading mechanism of marketization, lift price controls on electricity, build up an impartial and standardized trading platform, and let the market play a self-regulatory role in power generation plans. On the other hand, we should promote supply-side reforms as well as opening the market to social capital, and permit access to the grid. What’s more, the overall planning and scientific supervision of the government must be strengthened to ensure electrical safety. The abundant reserve of energy is the premise of the mechanism reform of energy prices, because it is difficult for the government to pass reforms when there is an energy shortage. The reform of energy prices in China is aimed at market-determined prices, and the energy plans, except for public welfare and regulatory functions, should be released gradually.
3. Optimize the energy structure to transform and upgrade the energy consumption structure. Renewable energy, such as wind and solar, as well as nuclear, can replace coal in the future. However, because of the limited technologies and high costs, it will take a long time to widely replace fossil energy. Therefore, we should not only devote more time and resources to the research and development of renewable energy, but also promote the effective utilization of fossil energy. Though the proportion of coal consumption declined from 90% in the 1950s to around 60% in 2017, it still represents the highest proportion. Coal consumption is more than an energy issue, but also an environmental one, which must be solved urgently. Energy restructuring is the Granger reason for the rebound effect, and the adjustment of energy structures can affect the strength of the rebound effect. The increase of coal consumption can lead to an increase in the rebound effect, which indicates that the reduction of coal consumption may, to some extent, lower the rebound effect. Therefore, the above issues can be solved by restructuring energy consumption, reducing the proportion of coal consumption, exploring new ways of cleanly and effectively utilizing coal, developing the non-coal industry, and forming a multi-drive energy supply system of coal, oil, gas, nuclear and renewable energy.
In this paper, we have discussed the existence and volatility of the rebound effect, as well as the Granger causality between the energy structure and the rebound effect. Further studies can be conducted to measure the strength of the rebound effect of different types of energy, so as to provide feasible measures for reducing the energy rebound effect and improving the efficiency of energy conservation and emission reduction policies.
In conclusion, we must seize the opportunity of the “new normal” of China’s economic growth, actively cope with the difficulties and challenges, optimize industrial structures, achieve industrial upgrades, lower the dependence of economic growth on energy, increase the proportion of the green economy, promote the implementation of energy conservation and emission reduction policies steadily, and reduce energy intensity and consumption in order to achieve the goal of energy conservation; in this way we can fulfill our promises to the world.
Author Contributions
Conceptualization, Y.W. and M.L.; methodology, Y.W.; software, Y.W.; validation, Y.W.; formal analysis, Y.W.; investigation, Y.W. and M.L.; resources, Y.W.; data curation, Y.W.; writing—original draft preparation, Y.W.; writing—review and editing, Y.W. and M.L.; visualization; Y.W. and M.L.; supervision, M.L.; project administration, M.L.; funding acquisition, M.L.
Funding
Program for Preponderant Discipline of Climate Change of Chinese Academy of Social Sciences (CASS201907); Program for Coordinated Governance in Beijing-Tianjin-Hebei of the Ministry of Science and Technology of China (2018YFA0606304); Program for National Conditions Survey of the Institute for UrbanDevelopment and Environment Studies (IUE02).
Conflicts of Interest
The authors declare no conflicts of interest.
References
- Doran, M. Access to electricity in Small Island Developing States of the Pacific: Issues and challenges. Renew. Sustain. Energy Rev. 2014, 31, 726–735. [Google Scholar] [CrossRef]
- Tronchin, L.; Massimiliano, M.; Benedetto, N. Energy efficiency, demand side management and energy storage technologies-A critical analysis of possible paths of integration in the built environment. Renew. Sustain. Energy Rev. 2018, 95, 341–353. [Google Scholar] [CrossRef]
- Pawel, I. The Cost of Storage—How to Calculate the Levelized Cost of Stored Energy (LCOE) and Applications to Renewable Energy Generation. Energy Procedia 2014, 46, 68–77. [Google Scholar] [CrossRef]
- Tao, J.Y.; Finenko, A. Moving beyond LCOE: impact of various financing methods on PV profitability for SIDS. Energy Policy 2016, 98, 749–758. [Google Scholar] [CrossRef]
- Tang, J.; Jiang, B.; Liu, C. International Trend and Characteristics of the Evaluation of Energy Policies. Mod. Manag. 2008, 3, 48–50, 65. [Google Scholar]
- Shen, L.; Liu, L. Sustainability Evaluation and Energy Policies Options in China. Resour. Sci. 2009, 8, 1264–1271. [Google Scholar]
- He, Z.; Yang, Y.; Song, Z.; Liu, Y. The mutual evolution and driving factors of China’s energy consumption and economic growth. Geogr. Res. 2018, 8, 1528–1540. [Google Scholar]
- Jevons, W.S. The Coal Question: An Inquiry Concerning the Progress of Nation, and the Probable Exhaustion of Our Coal-Mines; Hardpress Publishing: Los Angeles, CA, USA, 2010. [Google Scholar]
- Smeets, E.; Tabeau, A.; Berkum, S.V. The Impact of the Rebound Effect of the Use of First Generation Biofuels in the EU on Greenhouse Gas Emissions: A Critical Review. Renew. Sustain. Energy Rev. 2014, 38, 393–403. [Google Scholar] [CrossRef]
- Luo, H.; Fan, R.; Luo, M. Measure and Analysis on the Evolutionary Process of Energy Efficiency in China. J. Quant. Tech. Econ. 2015, 5, 54–71. [Google Scholar]
- Hong, L.; Liang, D.; Di, W. Economic and Environmental Gains of China’s Fossil Energy Subsidies Reform: A Rebound Effect Case Study with EIMO Model. Energy Policy 2013, 54, 335–342. [Google Scholar] [CrossRef]
- Liu, Y.; Zhou, M.; Wang, Y. Rebound effect and its decomposition by different types of energy: A CGE analysis for China. China Popul. Resour. Environ. 2016, 12, 133–139. [Google Scholar]
- Allan, G.; Hanley, N.; McGregor, P.; Swales, K. The Impact of Increased Efficiency in the Industrial Use of Energy: A Computable General Equilibrium Analysis for the United Kingdom. Energy Econ. 2007, 29, 779–798. [Google Scholar] [CrossRef]
- Broberg, T.; Berg, C.; Samakovlis, E. The Economy-wide Rebound Effect from Improved Energy Efficiency in Swedish Industries- A General Equilibrium Analysis. Energy Policy 2015, 83, 26–37. [Google Scholar] [CrossRef]
- Grepperud, S.; Rasmussen, I. A General Equilibrium Assessment of Rebound Effect. Energy Econ. 2004, 26, 261–282. [Google Scholar] [CrossRef]
- Gillingham, K.; Rapson, D.; Wagner, G. The Rebound Effect and Energy Efficiency Policy. Rev. Environ. Econ. Policy 2015, 10, 68–88. [Google Scholar] [CrossRef] [Green Version]
- Zein-Elabdin, E.O. Improved Stoves in Sub-Saharan Africa: The Case of the Sudan. Energy Econ. 1997, 19, 465–475. [Google Scholar] [CrossRef]
- Liu, Y.; Liu, F. Rebound Effect of Energy Consumption due to Technological Progress—Empirical Analysis based on Provincial Panel Data in China. Resour. Sci. 2008, 9, 1300–1306. [Google Scholar]
- Kong, P.; Wang, S. Measurement of Energy Rebound Effect in China Based on the Perspective of Output. Public Financ. Res. J. 2017, 6, 46–59. [Google Scholar]
- Huang, C.; Hu, R. Technological Progress, Energy Efficiency and Rebound Effect—Re-examination based on the Solow Neutral Technical Progress. Macroeconomics 2013, 4, 44–52. [Google Scholar]
- Qi, S.; Li, Y. Threshold effects of renewable energy consumption on economic growth under energy transformation. China Popul. Resour. Environ. 2018, 2, 19–27. [Google Scholar] [CrossRef]
- Wang, C.; Wang, Z.; Lu, M. An Economic Analysis on Energy Direct Rebound Effect: From Microcosmic Angle. J. Beijing Inst. Technol. (Soc. Sci. Ed.) 2013, 2, 28–33. [Google Scholar]
- Shao, Q. Economic growth and industrial energy consumption in China. Sci. Res. Manag. 2017, 1, 127–136. [Google Scholar]
- Hymel, K.M.; Small, K.A. The Rebound Effect for Automobile Travel: Asymmetric Response to Price Changes and Novel Features of the 2000s. Energy Econ. 2015, 49, 93–103. [Google Scholar] [CrossRef]
- Frondel, M.; Ritter, N.; Vance, C. Heterogeneity in the Rebound Effect: Further Evidence for Germany. Energy Econ. 2010, 34, 461–467. [Google Scholar] [CrossRef]
- Liu, H.; Lin, B. Incorporating Energy Rebound Effect in Technological Advancement and Green Building Construction: A Case Study of China. Energy Build. 2016, 129, 150–161. [Google Scholar] [CrossRef]
- Guo, J.; Guo, C.; Ling, Y. Estimating the Rebound Effect in China Industrial Sector Energy Consumption. J. Quant. Tech. Econ. 2010, 11, 114–126. [Google Scholar]
- Guo, J.; Ling, Y.; Guo, C. Estimating the Rebound Effect of Energy Consumption of Industrial Sectors in China Based on the Perspective of Technological Advancement. Resour. Sci. 2010, 10, 1839–1845. [Google Scholar]
- Wang, Z.; Lu, M. An Empirical Study of Direct Rebound Effect for Road Freight Transport in China. Appl. Energy 2014, 133, 274–281. [Google Scholar] [CrossRef]
- Sun, X.; Liu, J. The Rebound Effect of Household Consumption: A Review. China Popul. Resour. Environ. 2013, 5, 6–10. [Google Scholar]
- Ouyang, J.; Long, E.; Hokao, K. Rebound Effect in Chinese Household Energy Efficiency and Solution for Mitigating It. Energy 2010, 35, 5269–5276. [Google Scholar] [CrossRef]
- Zhang, J.; Zhang, Y. Recalculating the Capital of China and a Review of Li and Tang’s Article. Econ. Res. J. 2003, 7, 35–43. [Google Scholar]
Figure 1.
Estimation of capital stock in 1994–2017.

Figure 2.
China’s energy consumption structure from 1994 to 2017.

Figure 3.
Energy intensity and rebound effect.


Table 1.
Results of Johansen test.
| Number of CE | Eigenvalue | Trace Test | 5% Critical Value | p Value |
|---|---|---|---|---|
| None | 0.7336 | 73.4421 | 47.21 | 0.0000 |
| No more than 1 | 0.6376 | 43.0170 | 29.68 | 0.0003 |
| No more than 2 | 0.5544 | 19.6719 | 15.41 | 0.0000 |
| No more than 3 | 0.0460 | 1.0820 | 3.76 | 0.0000 |
Table 2.
Correlation analysis of variables.
| Output | Capital | Labor | Energy | |
|---|---|---|---|---|
| Output | 1.0000 | 0.9626 | 0.9866 | 0.9981 |
| Capital | 0.9626 | 1.0000 | 0.9509 | 0.9548 |
| Labor | 0.9866 | 0.9509 | 1.0000 | 0.9775 |
| Energy | 0.9981 | 0.9548 | 0.9775 | 1.0000 |
Table 3.
Estimation results of the energy rebound effect.
| Year | Contribution Rate of Technological Progress | Energy Intensity (tce/Ten Thousand Yuan GDP) | Energy Increase (Ten Thousand Tons of Standard Coal) | Energy Savings (ten Thousand Tons of Standard Coal) | Rebound Effect |
|---|---|---|---|---|---|
| 1994 | 0.64 | 2.44 | 5489.83 | 21,267.61 | 25.81% |
| 1995 | 0.69 | 2.05 | 4671.90 | 13,013.60 | 35.90% |
| 1996 | 0.51 | 1.84 | 3115.62 | 7909.71 | 39.39% |
| 1997 | 0.53 | 1.65 | 3000.45 | 7306.20 | 41.07% |
| 1998 | 0.26 | 1.56 | 1263.43 | 4204.27 | 30.05% |
| 1999 | 0.05 | 1.52 | 244.73 | 1933.61 | 12.66% |
| 2000 | 0.41 | 1.43 | 2313.05 | 4459.17 | 51.87% |
| 2001 | 0.31 | 1.36 | 1791.28 | 3638.86 | 49.23% |
| 2002 | 0.12 | 1.35 | 821.01 | 722.86 | 113.58% |
| 2003 | −0.01 | 1.39 | −103.37 | −2796.26 | 3.70% |
| 2004 | 0.24 | 1.38 | 2233.82 | 1264.80 | 176.62% |
| 2005 | 0.23 | 1.36 | 2552.81 | 1464.09 | 174.36% |
| 2006 | 0.46 | 1.26 | 5973.48 | 8415.68 | 70.98% |
| 2007 | 0.60 | 1.11 | 8666.56 | 15,830.48 | 54.75% |
| 2008 | 0.69 | 0.96 | 6626.43 | 17,375.46 | 38.14% |
| 2009 | 0.10 | 0.93 | 964.68 | 3754.47 | 25.69% |
| 2010 | 0.52 | 0.84 | 5769.75 | 12,018.68 | 48.01% |
| 2011 | 0.50 | 0.77 | 5005.85 | 10,860.94 | 46.09% |
| 2012 | 0.46 | 0.71 | 3804.88 | 9073.65 | 41.93% |
| 2013 | 0.35 | 0.68 | 2993.59 | 6819.62 | 43.90% |
| 2014 | 0.06 | 0.67 | 652.82 | 1021.71 | 63.90% |
| 2015 | 0.27 | 0.62 | 2751.34 | 9844.63 | 27.95% |
| 2016 | 0.23 | 0.59 | 2074.67 | 7867.21 | 26.37% |
| 2017 | 0.51 | 0.54 | 7212.36 | 11,310.91 | 63.76% |
Table 4.
ADF unit root test results of time series variables.
| Variables | ADF Statistic | 1% Critical Value | 5% Critical Value | 10% Critical Value | p-Value | Conclusion |
|---|---|---|---|---|---|---|
| RE | −3.581 | −3.750 | −3.000 | −2.630 | 0.0061 | Stationary |
| ST | 0.945 | −3.750 | −3.000 | −2.630 | 0.9937 | Non-stationary |
| △ST | −4.753 | −3.750 | −3.000 | −2.630 | 0.0001 | Stationary |
Table 5.
Granger causality test.
| Null Hypothesis | Lagged Period | F-Value | p-Value | Conclusion |
|---|---|---|---|---|
| △ST is not the Granger reason for RE | 1 year | 0.72 | 0.3862 | Rejected |
| RE is not the Granger reason for △ST | 1 year | 2.80 | 0.0720 | Accepted |
© 2019 by the authors. Licensee MDPI, Basel, Switzerland. This article is an open access article distributed under the terms and conditions of the Creative Commons Attribution (CC BY) license (http://creativecommons.org/licenses/by/4.0/).
Share and Cite
MDPI and ACS Style
Liao, M.; Wang, Y. China’s Energy Consumption Rebound Effect Analysis Based on the Perspective of Technological Progress. Sustainability 2019, 11, 1461. https://doi.org/10.3390/su11051461
AMA Style
Liao M, Wang Y. China’s Energy Consumption Rebound Effect Analysis Based on the Perspective of Technological Progress. Sustainability. 2019; 11(5):1461. https://doi.org/10.3390/su11051461
Chicago/Turabian StyleLiao, Maolin, and Yingjie Wang. 2019. "China’s Energy Consumption Rebound Effect Analysis Based on the Perspective of Technological Progress" Sustainability 11, no. 5: 1461. https://doi.org/10.3390/su11051461
Note that from the first issue of 2016, this journal uses article numbers instead of page numbers. See further details here.