Evaluating Ancillary Business Scale for PPP-BOT Projects: A Social Housing BOT Case in Taiwan

1
Department of Civil Engineering, National Chiao Tung University, Hsinchu 300, Taiwan
2
Grand Innovation. Inc., No. 552, Sec. 1, Chongde 10th Rd., Beitun Dist., Taichung 406, Taiwan
*
Authors to whom correspondence should be addressed.
Sustainability 2019, 11(5), 1415; https://doi.org/10.3390/su11051415
Submission received: 9 January 2019
/
Revised: 26 February 2019
/
Accepted: 28 February 2019
/
Published: 7 March 2019
Abstract
:Due to budgetary constraints, the government releases the right to ancillary business development for private investors to increase profits in PPP projects. However, the ancillary business scale is not specified in the regulations, and there is little relevant research on modeling the scale. Thus, our research aims to create a model with mathematical analysis to evaluate the ancillary business scale. The model is constructed based on the discounted cash flow model to calculate the ancillary business scale attracting private investors with a case study of a social housing project. For this case, the calculated ancillary business minimum scale (ratio of ancillary business to project in total floor area) based on the 7-year (2009–2016) and 17-year (2000–2016) data are 30.81% and 52.79%, respectively; neither is able to meet the scale listed in the tender condition regulated by the government, i.e., 25%. Moreover, this study performs a sensitivity analysis on the expected rate of return and rent discount of the case. The government needs to raise the proportion of ancillary businesses or to increase the rent of social housing to successfully attract private investors.
1. Introduction
Conceptually, a public-private partnership (PPP) can be defined as “a long-term contract between a private party and a government agency, for providing a public asset or service, in which the private party bears significant risk and management responsibility” [1]. A build-operate-transfer (BOT), one of the popular options of PPPs, is an agreement where a facility is designed, financed, operated and maintained by the concessionaire for the period of the concession. Legal ownership of the facility may or may not rest with the concession company [2]. A BOT has been applied around the world to attract private investment on public infrastructure, such as for the Channel Tunnel in the UK/France, Chinese Power Plants, Taiwanese High Speed Rail, Kaohsiung MRT and the Taipei Dome Complex.
In the past, the PPP-BOT projects funded by the government have caused disputes and higher investment risks. Therefore, in recent years, the government has adopted the zero-funding policy, and chosen to release the right to ancillary business development for private investors to increase their profits. However, there is a lack of literature examining the principal and ancillary scales and revenue in PPP-BOT projects [3]. Without reasonable limitations on the investment scale of the principal and ancillary businesses, some ancillary business projects may grow beyond their scales, such as the Taipei Dome Complex and Taipei Bus Station. These cases may result in public mistrust of PPP-BOT projects and hostility towards private consortiums, and further indicate the “misalignment of governance structure” of the government [4].
All of these also stimulate discussion about whether or not to impose restrictions on ancillary business in PPP-BOT projects. In order to respond to these discussions, some government agencies, such as Taipei City and Taichung City, started to impose the limitations on the total floor area of ancillary businesses. Currently, there are no regulations that specify the scale of ancillary businesses, and the relevant literature is sparse. The government attempts to avoid arousing public concern and suspicion by deciding the proportion of ancillary business in most PPP-BOT projects in meetings with fewer attendees or by inconclusive policies. Therefore, the result is often unverified and too conservative to attract private investors.
To discuss the reasonable ancillary business scale and successful cooperation of PPP-BOT projects, two facets have to be considered: policy and finance.
In terms of policy making, the scale of ancillary businesses should be lower than that of the principal business, and the complexity should not be too high, in order to avoid distractions from the main service provided by the concessionaire. In Taiwan, the government has adopted the following two policies in response to the concerns: (1) The upper bound of the ancillary business scale has been set and listed in the contract. For example, the ancillary business scale of Huilai House Social Housing was 25% and 30% in the first and the second open tender, respectively. Both values seem to be determined subjectively, without applying a thorough process of objective analysis; as a result, no private investor was interested in participating in the tender. (2) The Regulations of Land Use Control was adopted to limit the types of ancillary business. In the case, it was only able to operate hotels, small retail stores, and parking lots [5].
In financial terms, both financial feasibility and balance mechanism have to be considered. To enhance the financial feasibility, the government releases the operation of ancillary business, which should meet the following financial requirements: NPV>0, IRR>WACC, DPB< concession period, and SLR>1. The case study used the first two indicators to evaluate the financial feasibility. For the transparency and fairness in ROE calculation, the study adopted the average rate of return from the same listed companies as the ancillary business. The discount rate can be calculated based on the capital cost of private investors with the weighted average cost capital (WACC), and the study further calculated the ancillary business scale. To avoid an excess of ancillary income to the concessionaire, the government charges both fixed royalties and revenue-based royalties. In this case, if SLR is 100%, the fixed 2.5 million NTD is charged and annual royalty will be levied based on the operation revenue [5]. To develop the best practice of PPP-BOT projects will require thorough investigation of both policy and finance, and examination of reasonable ancillary business scale and operation.
Several researchers have provided fair scenarios, called Win-Win solutions, covering the concession period, revenue guarantee, and risk sharing [6,7,8,9]. These solutions lead to the concept that financial feasibility is a critical factor for the success of PPP projects [10]. Engel et al. [3] also pointed out a PPP-BOT airport case that illustrates the importance to model the ancillary facilities scale. Therefore, “to determine reasonable ancillary business scale means deciding reasonable ROE for a PPP-BOT project, one should consider: (1) the cost of capital; (2) the risks involved in the project; and (3) the rates of return of same type of projects in the current markets” [6].
Based on the above points, this research aims to investigate how to construct a practical financial model and define a reasonable (minimum level) scale of ancillary business for an objective negotiation reference to the government and private investors on the BOT investment. This systematic approach of the model can be adjusted according to local conditions and applied as an effective decision support tool for those projects. The study is an example of a general issue in BOT projects in concessions where there are ancillary commercial facilities that are not restricted only to the case of social housing.
2. Research Gaps and Paper Contributions
While assessing PPP project investment, private investors may consider various aspects, such as social, economic and political factors, among others, alongside the financially-focused evaluations which have a strong impact on the project [11]. In addition, Osei-Kyei et al. [10] mentioned that profitability is of decisive importance. According to the research of Engel et al. [3], they examined a concession contract for infrastructure that generates both user fee (principal) revenue and ancillary revenue.
“For example, airports charge user fees to passengers and airlines (aviation revenue) and collect revenue from shops, restaurants, parking lots and hotels (non-aviation revenue). It is worth noting that revenues from ancillary (non-aviation) services are almost as important as aviation revenues, and are responsible for a substantial fraction of the profits made by an airport [12]”.
Hence, to specify a reasonable scale of the ancillary business can not only attract investors, but also achieve the goal of public welfare. On the one hand, a low return rate will not attract any private investors; on the other hand, government agencies may consider the impacts on the operations and functions of the BOT principal business and the social expectation if the return rate is too high.
With a lack of relevant investigations, the research aims to create a financial model to evaluate the scale of BOT ancillary business to attract private investors; thus, both the government agencies and private investors can adopt this model to calculate the proportion of investment on ancillary business for policy promotion and investment reference.
The paper provides a BOT financial model based on the Discounted Cash Flow Model for calculating a minimum ancillary business scale (floor level) as a fair negotiation references between two parties. In Figure 1, there are two major types of cash flows: costs and revenues. The costs are derived from two periods of time, construction period and operation period. The revenues are from principal business and ancillary business. The internal rate of return serves as the boundary condition indicating the investment willingness of private investors, adopted in the financial model to calculate the scale of BOT ancillary business. Finally, this study performs a case study of a domestic BOT social housing project for further analysis and verification in order to evaluate its reasonable (minimum) scale of the ancillary business. In addition, the study conducts a sensitivity analysis to identify how IRR and rent discount influence the scale of ancillary business.
The contribution of the paper is threefold. First, it fills the gap in the existing literature on PPP-BOT ancillary business scale, which lacks methodology for setting minimum level in a way that is able to attract private investors, at the same time, to fairly allocate risks between two parties.
Second, the proposed model practically improves the negotiation process and may further promote public infrastructure as well as implement social welfare policy. Through the application of the methodology in the case study of Huilai House Social Housing in Taichung, the calculated ancillary business scale is higher than the limitation imposed by the government, which not only explains why no private investors are willing to participate in the project bidding, but also provides the reasonable scale of ancillary businesses in BOT negotiations.
Third, although some studies concerned the rate of return from same type of PPP projects in the current markets [6], this study estimates the net after-tax profit margin of ancillary business by adopting the average rate of return from the same listed companies as the ancillary business. A much larger sampling of rate of return from the listed companies in the market contributes to providing a fairer evaluation, and the expected rate of return may better meet the private investors’ expectations.
3. Literature Review
Social Housing or Public Rental Housing are houses or apartments that are made available to be rented at a low cost by poor people [13,14]. Chen [15] and Chang [16] pointed out that social housing (in Taiwan) is constructed or subsidized by the government to rent to, not sell to, low income families or the disadvantaged, with rents being lower than the market price, or free. For example, according to the Article 3 of Housing Act in Taiwan, social housing refers to the housing and necessary facilities built by the government or by private investors with subsidies from the government that is primarily rented, and at least 30% of social housing must be rented to economically- or socially-disadvantaged persons. Moreover, according to the relevant housing policy of Taichung City, the social housing in Taichung supports “3 Advantages and 1 Fairness: good location, well-constructed building, convenient life function, and affordable rent” [5]. Based on the policy, the rent of social housing must be 70% of the market price. Moreover, social housing is set to raise the living quality of the disadvantaged, as well as to allow lower-income families to live and work in the city with affordable rent.
Over the last decade, as a result of budgetary constraints, governments through PPP arrangements improve public infrastructure facilities such as social housings. For example, based on the analysis with four advantages, those renting-oriented affordable housing projects are very suitable for PPP in China [17]. Similarly, the Taiwanese government has planned to construct 200,000 units of social housing nationwide. To resolve the problem of insufficient budget, a large proportion of these social housing projects should be through the means of PPP.
Reviewing the PPP literature on the healthcare, transport, housing and education sectors, Roehrich et al. [18] identified three emerging PPP research themes: PPP outcomes, the policy of PPPs and PPP practice from macro to micro levels of analysis. Among the three themes, they further explored the policy of PPPs regarding “macro level reflections on finance issues such as accounting treatments, risk allocation, and policy concerns”. Similarly, this study mainly draws attention to the policy of PPP-BOTs; the subsections of the literature review are organized as follows: risk management, financial evaluation, contract negotiation, and ancillary business.
3.1. Risk Management
Risks can be broadly categorized as global or elemental. Global risks include political, legal, commercial and environmental risks, while elemental risks focus on construction, finance and revenue [19]. Risk evaluation is complex, requiring the analysis of risk from different perspectives of the public and private sector entities. Grimsey [19] presented a framework for assessing the risks and further identified nine risks facing any infrastructure projects, two of which are discussed in this study: financial and revenue risks. Several researchers have conducted research on relevant risk measurement and management in PPP projects. For instance, Liou [20] applied a Monte Carlo simulation to data from the Taiwan High Speed Rail Project to assess the subsidy-risk trade-off relationship. The results provided guidance for public-private negotiation. Tsai [21] used the Analytical Hierarchical Process (AHP) to establish relative weightings of the individual risk factors. Shahrara et al. [22] used a soft computing model to analyze the risk on the BOT contracts. Moreover, Doloi [23] revealed that site conditions and design complexity are among the most critical risk attributes influencing time performance in construction projects. Jun [24] developed the numerical model to assess the combined impact of the MRG (Minimum Revenue Guarantee) and RCP (Revenue Cap) agreements on the project value based on the option pricing theory and to suggest a theoretical framework to protect the government and the developer from operation risk. Sanni [25] assessed allocation, criteria and allotment effectiveness of performance risks in BOT.
3.2. Financial Evaluation
Financial feasibility is one of the most important critical success factors for PPP projects [10]. Some researchers explored financial feasibility and optimization, such as the private investor’s provision of PRHs (public rental housing) and graduate apartments in China [26,27]. Chang [28] introduced a useful BOT financial model used by the Bureau of THSR. Pi [29] utilized a real-option approach to evaluate multi-stage BOT projects. Further, Carbonara et al. [7] provided a win-win model to calculate the revenue floor and ceiling. In more depth, some researchers explored the royalty of the PPP-BOT projects. For the government, the royalties are set not only to reduce the financial risk, but also to charge for the excess profits of the concession companies, benefits of property rights, payments of the concessions and relevant cost recovery, as well as to be used as the criteria of investor selection [30,31]. Wu [32] developed the royalty model to calculate the optimum amount of royalty by year within the concession period. Chiou [33] constructed the model of royalty payment in uncertain environment based on the fuzzy theory. Hsiao [34] developed the royalty models for the transportation infrastructure BOT projects with consideration of managerial flexibility-application of real options. A number of researchers constructed royalty formulas using mathematical programming, fuzzy mathematical programming, simulation or financial engineering methods for BOT projects. For instance, Kang [35,36] used the financial concept to compare BOT projects with non-BOT projects, and constructed a new financial model to evaluate the royalties of BOT projects. Chiou [37] developed a royalty model using the methods of mathematical programming and fuzzy mathematical programming for analyzing different types of royalty formulas which are pre-tax profit-based, total revenue-based, and patronage-based. In addition, Kang [38,39] provided a royalty negotiation model based on the operation revenue for BOT projects.
3.3. Contract Negotiation
There are four bidding procedures for the award of public contracts within EU [40,41], namely: open procedure, restricted procedure, negotiated procedure, and competitive dialogue. Soliño [41] regroups the four procedures into non-negotiated procedures (open and restricted) and negotiated procedures, including competitive dialogue. Carbonara [40] and Soliño [41] further pointed out that negotiated procedure is adopted in certain highly innovative and complex PPP projects. Due to the complexity of its financial assessment and the right of ancillary business investment, negotiated procedure or competitive dialogue gives way to a more collaborative approach to defining the optimal deal solution for the social housing case in this study. Siemonsma et al. [42] also concluded that “...especially for particularly complex projects, early dialogue with candidates contributes to improved overall project value by decreasing expected transaction cost and increasing expected contract value”. PPP is a highly collaborative operation between the two parties [43]. Every public-private partnership involves risks for the private participant, and inevitably concerns both monetary and non-monetary benefits (e.g., reputational gains, implicit guarantees and start-up assistance provided). Monetary incentives [27], the focus of the research, involved in PPP negotiation are discussed and reviewed in this section. Several researchers have undertaken the win-win negotiation model to determine the concession period of a PPP project [6,8,44]. Furthermore, Hanaoka [45] produced a range of concession period for the two parties to negotiate through a simulation of a real case. Similarly, Zhang [46], using a mathematical model to determine the optimal project life span and concession period jointly, obtained a negotiation space of a concession period. Huang [47] proposed a model which allows the government and the sponsor to reach a consensus on the terms and further determines the financial return, as well as the risk of the project. The pro forma cash flow of a BOT project was developed and used to generate the probability distribution of net present values (NPV) from the owner’s perspective by the use of Monte Carlo simulation. These series of studies have provided effective methodologies for the development of PPP-BOT contracts.
3.4. Ancillary Business
In recent years, the government has changed the policy to allow private investment in the development and operation of ancillary businesses, such as restaurants, parking lots, shopping malls and hotels. However, in order to balance the excess profits of the private investors, the government not only limits the scale of the investment in the ancillary business, but also collects the royalties. Past studies on ancillary businesses include the operating strategy for ancillary business [48], the exploration on the financing restrictions and moral hazards of projects with ancillary businesses [49], the valuation on abandonment option of ancillary businesses with consideration of the relationship between the principal business and the ancillary business [50]. In addition, past literature has listed several general guidelines for ancillary business development. For example, the article, Research, Development and Evaluation Commission Taipei City Government [51], stated, “To practice the financial analysis of ancillary business, the organizer shall conduct a financial analysis of the public service facility first. Next, it shall conduct a financial analysis of the ancillary business, and then combine both results to conduct an overall financial calculation”. Since the government adopted the zero-funding policy in recent BOT projects, how to increase the self-liquidating ratio of BOT project by yielding the right of ancillary business development will be studied. For the reasonable investment scale of ancillary businesses, the government must consider whether the scale can meet both the policy goals and public expectations. If the scale of ancillary business is larger than that of the principal business, the public may doubt whether the government gives benefits to consortiums rather than to the public [51]. However, the scale of the ancillary business is not clearly specified, which often leads to disputes, for example the Taipei Dome Complex directed by the Taipei City Government and constructed by the Farglory Land Development Co., Ltd. Therefore, the self-liquidating capacity of projects is the key factor in attracting private investors. For projects with low investment returns and a low self-liquidating capacity for the principal business, the major financial self-liquidating capacity must be considered in the ancillary business [52]. Moreover, Liu et al. [14] indicated that staff quarters in an industrial park, with an ancillary commercial facility, is one of the available methods in three potential PPP types. Engel et al. [3] mentioned that the enlargement of the commercial area (ancillary businesses) played a major role in the profits reported by the concession during its first year of operation of EI Loa Airport, 2014. Above all, they illustrate the importance of developing the financial models of ancillary businesses in creating a fair and public negotiation foundation for BOT projects. However, there has thus far been relatively little research on the reasonable scale of ancillary businesses.
4. The Model
The study assumes a BOT project completely funded by private investors and the government increases investment willingness by yielding the ancillary business superficies in a certain concession period. The related symbols are listed in Table 1.
To attract private investors, the financial valuation of a project must fulfill their expectations. Investors will practice the following two valuations for a project:
- The NPV ≥ 0
- The IRR (internal rate of return) ≥ the discount rate (after WACC)
With the internal rate of return method, the formula of a project attracting investors can be shown as follows:
where the is the expected cash flow at time t, and IRR is the expected internal rate of return. Hence, W is the sum of present value of the royalty:
If the Equation (1) is hold, it is worth investing the project. Otherwise, the project cannot attract investors.
The research obtains the investors’ expected cash flow by multiplying their expected net profit set with the net profit on the market by the yearly net income, meanwhile considering the depreciation. Since the net incomes of the principal and ancillary business in the project must be respectively calculated, the formula of the expected cash flow can be shown as follows:
Substituting the Equation (3) to (1) can derive the formula as follows:
We define:
where the total costs of the project, including the principal and ancillary business, can be shown as follows:
Based on Equations (5) and (6), Equation (4) can be derived as:
To obtain the correlation between the royalty and the proportion of ancillary business, processing the derivative of Equation (7) with respect to x can derive the formula as follows:
Equation (8) implies . This means that the lower ancillary business scale is the less operation royalty investors are willing to pay. That is, a minimum ancillary business scale will cause the minimum royalty. Therefore, it assumes the zero royalty for the minimum ancillary business scale. Substituting W = 0 to the Equation (7) can obtain ancillary business scale attracting investors as follows:
The study assumes the total required floor area of principal business is L, then the upper and lower bound of the ancillary business proportion is:
Hence, the scale of investment on the ancillary business can be calculated based on the following formula:
When , it indicates the principal business can achieve the self-liquidating. If the government must consider other approaches to narrow the financial gap for private investors.
5. Case Study
5.1. Case Description
According to the relevant housing policy of Taichung City, the social housing in Taichung supports “3 Advantages and 1Fairness: good location, well-constructed building, convenient life function, and affordable rent” [5]. Based on this policy, the rent of social housing must be 70% of the market price. Moreover, the social housing is set to raise living quality and the life function for the disadvantaged, as well as to allow lower-income families to live and work in the city with affordable rent.
The research presents a case study based on a social housing in Taichung, Taiwan. The construction period is 3 years and the concession period is 50 years. The area is 6982 m2 in total and total legal floor area under calculation is 20,505 m2. The project is specified to provide 300 social housing units in compliance with the ratio of room types: single room (40%), double room (40%) and triple room (20%).
5.2. Parameter Setting
The research adopts the data from the Taiwan Economic Journal 2017 and the Feasibility Assessment Report on BOT of Social Housing in Taichung Huilai House Section 2016. The related symbols are also listed in Table 1.
The total required floor area of principal business (L):
The project is specified to provide 300 social housing units in compliance with the ratio of room types: single room (40%), double room (40%) and triple room (20%). In addition, it must provide the 330 m2 space for social welfare and a 500 m2 for a public community center, and meet the regulated scale of principal business in Table 2. Based on these data, the lower bound of principal business scale in the project is 13,922.3 m2.
Investment facilities, ratio, and upper bound scale of ancillary business:
The study selects business facilities with higher average net income as the targeted ancillary business investment, including a hotel and a shopping mall. Under calculation, the upper bound of ancillary business investment scale is 6618.2 m2. The investment ratio of the hotel and shopping mall is 17:3 in the research.
Cost of the building (CS, Cp):
According to the Feasibility Assessment Report on BOT of Social Housing in Taichung Huilai House Section [5], the social housing renovation costs include furniture, decoration and other costs. Therefore, the research estimates the cost of housing as 1116.3 USD/m2 (CS), this of shopping mall as 1217.8 USD/m2 and this of hotel as 1268.5 USD/m2. 1260.9 USD/m2 (Cp) is derived by the weighted averages method.
Depreciation (, ):
The study calculates the depreciation with the Straight-line method, assuming that after 50-year service the scrap value is 0, the yearly depreciation of housing is 22.3 USD/m2 (), this of shopping mall is 24.4 USD/m2, and this of hotel is 25.4 USD/m2. 25.3 USD/m2 () is derived by the weighted averages method.
Average net income per square meter of principal business () and ancillary business ():
The total net income of principal business must be the summation of the net income from the rent, property management fee and parking lot fee. Hence, the average net income at time t can be shown as follows:
where is the monthly rent per square meter, is the monthly property management net income per square meter, and is the monthly parking lot net income per square meter. According to the local government regulations, the rent must be 70% of the market price. The and are organized in Table 3.
The total net income of ancillary business must be the summation of the net income of the hotel shown in Table 4, shopping mall net income shown in Table 5, property management fee and the parking lot fee. Hence, the average net income at time t can be shown as follows:
where is the monthly hotel net income per square meter, is the monthly shopping mall net income per square meter, is the monthly property management net income of ancillary business per square meter and is the monthly parking lot net income of ancillary business per square meter. According to the Feasibility Assessment Report on BOT of Social Housing in Taichung Huilai House Section 2016 [5], the monthly parking lot net income per square meter is to divide the total net income by the total legal floor area, 11 USD.
Expected Net after-tax Profit Margin (NPR):
The study assumes the expected net after-tax profit margin on the market is a fixed value. Then, it adopts the net after-tax profit margin from the same industry as the ancillary business, shopping mall and hotel, to estimate the operation net income of private investors. The data are collected from two periods of time, 2009–2016 (7 years) and 2000–2016 (17 years). The former is to avoid considering the effects of the 2008 global financial crisis. The latter is due to lack of data for very few public traded shopping malls and hotel companies prior to 2000. The net after-tax profit margin of shopping mall is based on the average net after-tax profit margin of 8 listed companies, and the results in 2009–2016 and 2000–2016 are 12.80% and 6.7%, respectively. The net after-tax profit margin of hotel is based on the average net after-tax profit margin of 12 listed companies in the industry, and the results in 2009–2016 and 2000–2016 are 10.53% and 9.13%, respectively. In addition, the principal business of the case study, social housing, also adopts the average net after-tax profit margin of hotel. Therefore, the study assumes the net after-tax profit margin of hotel is NPRp and after-rent-discount percentage is D; the formula NPRs (before tax) can be derived as follows:
The study further takes the decreased enterprise income tax due to decreased profit into account by including the tax rate, named Taxrate in Equation (15). The net after-tax profit margin of social housing can be derived as follows:
The net after-tax profit margins of shopping mall and hotel are organized in Table 6.
Expected rate of return:
The study refers to the stock prices of 8 listed shopping malls and 12 listed hotels from 2009 to 2016 (7 years) and from 2000 to 2016 (17 years). Then it calculates the equity capital cost () based on the Capital Asset Pricing Model:
where Rf is the risk-free interest rate, βi is the beta (β) coefficient of investment assets and Rm is the expected rate of return on the market. In this case, we assume the repayment of loan is carried out in the equal principal payment throughout 50 years. Thus, the discount rate () can be calculated based on the capital cost of private investors with the weighted average cost capital (WACC) as follows:
where is the weight of equity, WD is the weight of debt, and MC is the mortgage constant. This cost can be the proxy of the internal rate of return threshold attracting private investors. The risk-free interest rate is set as 1.52%, the 30-year Taiwan Government Bond Yield, and the return on investment (ROI) is set with the rate of return of Taiwan Weighted Index in Table 7. The ROI of the study is set with the average rate of return from 2000 to 2016 (17 years), 4.41%. The beta coefficients of shopping mall and hotel are set with those from 2009 to 2016 (7 years) and those since 2000 to 2016 (17 years), and calculated monthly transaction data as the estimated samples. The study assumes the project is completely funded by private investors with 30% self-owned capital and 70% financed with 2.5% interest rate (approximately equal to the calculated MC under a 50-year amortization). Table 8 indicates that the 7-year and 17-year average rates of return of shopping mall are 4.21% and 3.58%, respectively and those of the hotel are 3.73% and 3.67%, respectively. Thus, the results in Table 9 show the internal rates of return of the project attracting investors are 2.92% and 2.85%, respectively.
6. Ancillary Business Scale
According to the parameter settings, the scale of ancillary business in the case is . After implementing the model in the case study, we obtained the results from the 7-year (2009–2016) and 17-year (2000–2016) data, indicating that the internal rates of return for investors are 2.92% and 2.85%, respectively. Based on the calculation of 7-year data, the ancillary business scale must be at least 30.81% of the total floor area to attract investors. If investors seek a higher internal rate of return, the ancillary business scale must be increased. Based on the calculation of 17-year data with the financial model, the ancillary business scale must be at least 52.79%. However, the upper bound scale of ancillary business specified in regulations is 25%, much lower than the calculated scale; therefore, the government should attract investors by means of other complementary measures, such as higher rent of social housing and reducing the principal business scale.
In the case study, for investors, the internal rate of return and rent discount are essential factors to impact the scale of ancillary business. To investigate the impact, the study practices the sensitivity analysis based on the two factors and then compares the 7-year and 17-year data. The results are shown below.
According to the sensitivity analysis of internal rate of return, under the same IRR, investors are willing to invest the project with lower ratio of ancillary business scale if the net after-tax profit margin is higher (7-year data in the current market), as shown in Figure 2.
In contrast, Figure 3 shows that investors will seek for higher ratio of ancillary business scale since the net after-tax profit margin is lower (17-year data in the current market).
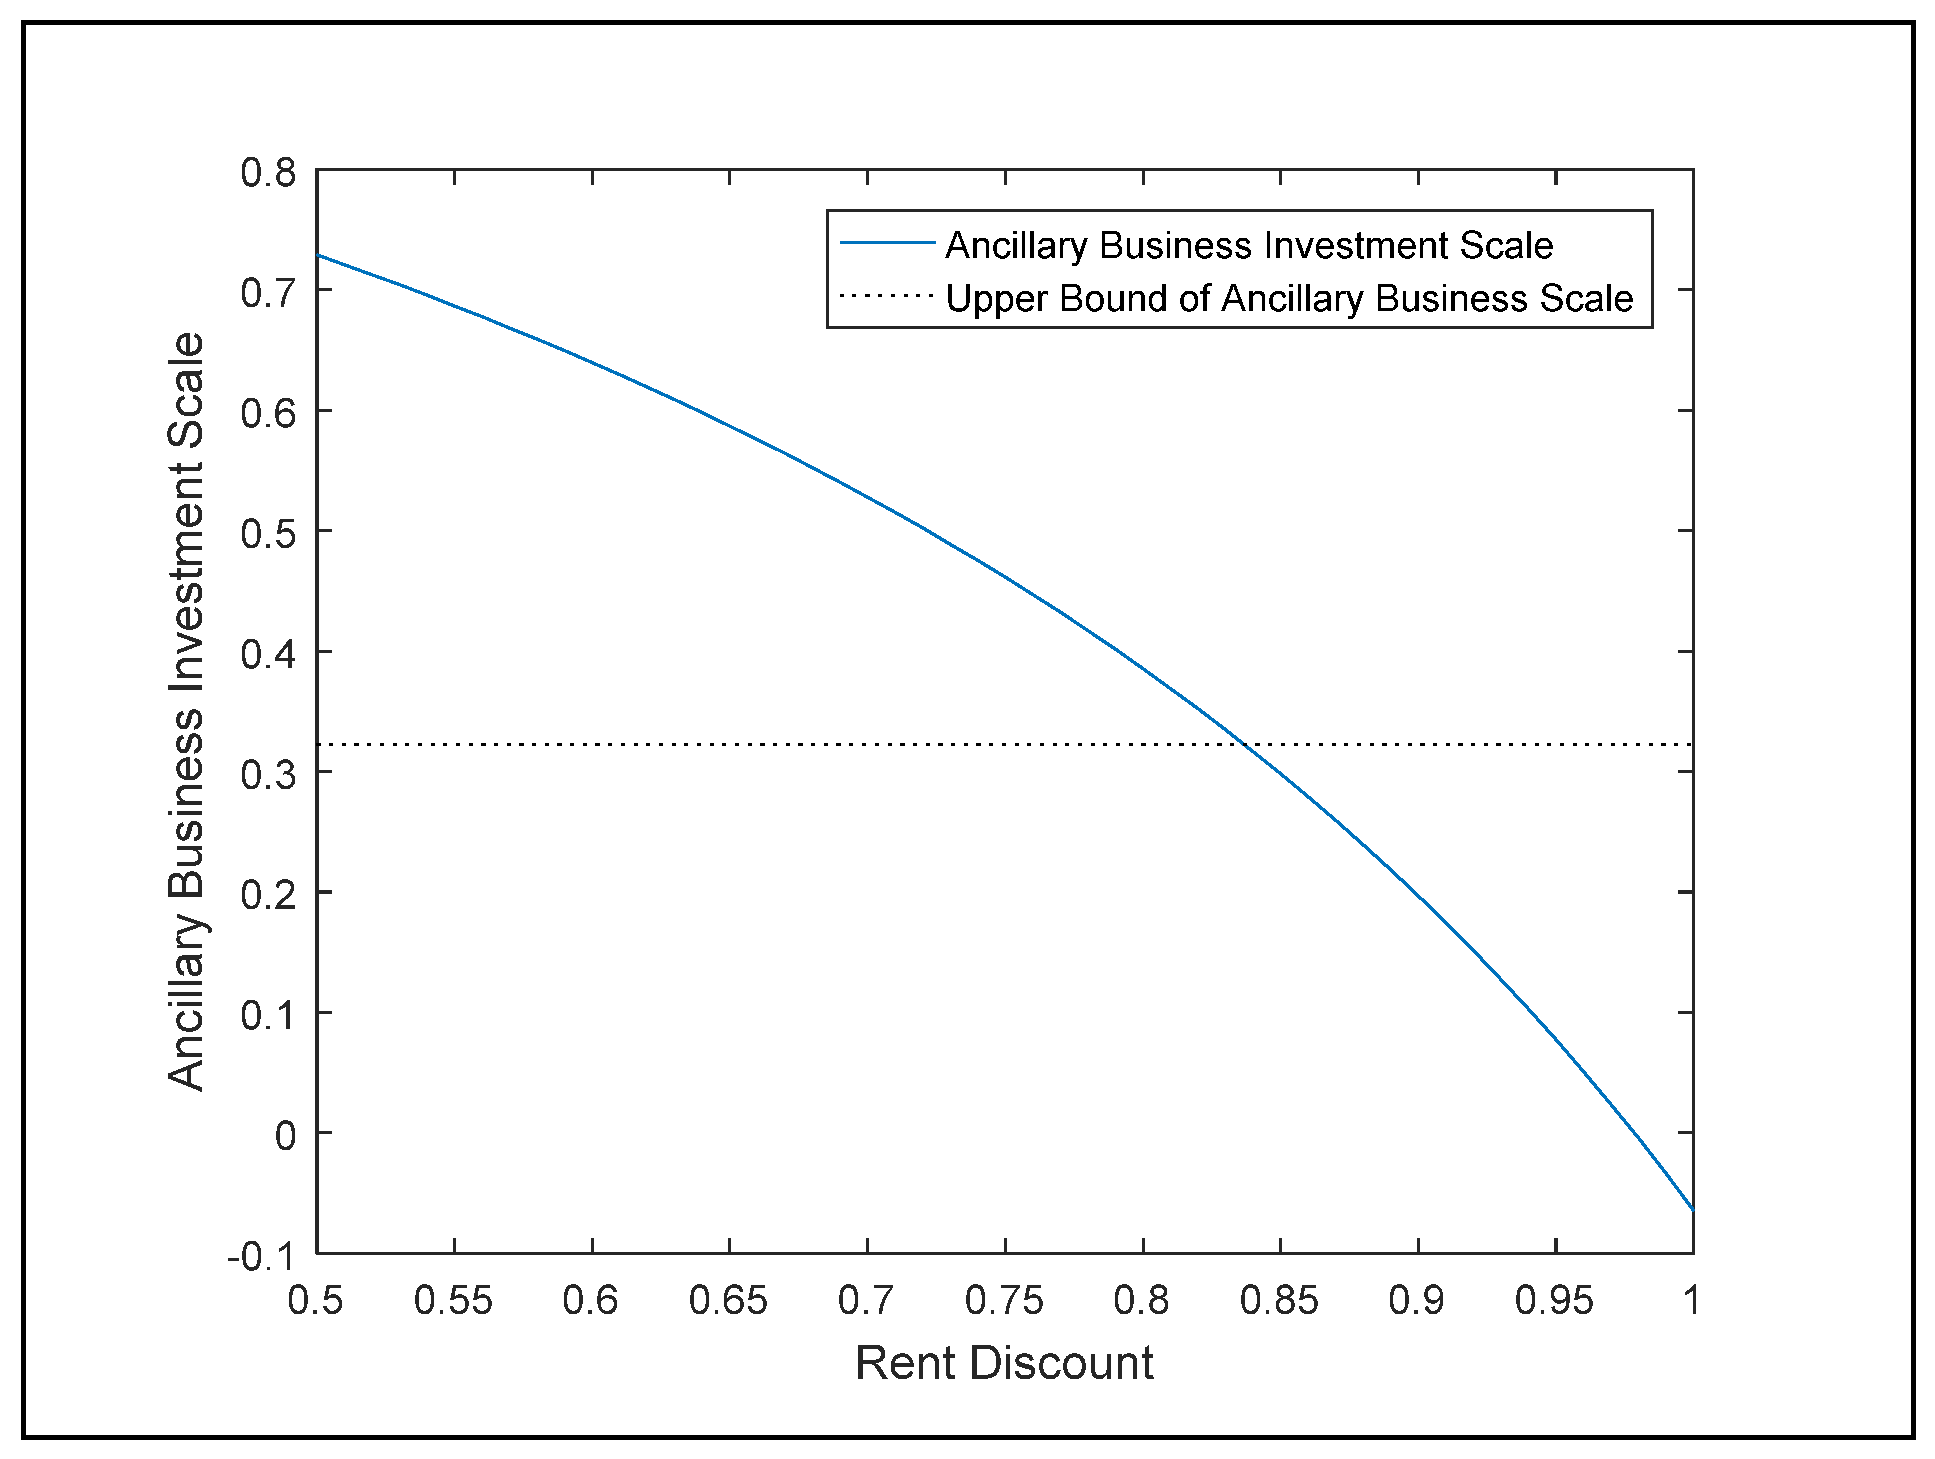
Based on the sensitivity analysis of rent discount in the research, under the same rent discount, investors are willing to invest the project with lower ratio of ancillary business scale if the net after-tax profit margin is higher (7-year data in the current market), as shown in Figure 4.
In contrast, Figure 5 shows that investors will seek for higher ratio of ancillary business scale if the net after-tax profit margin in the current market is lower (17-year data in the current market). Therefore, as maintaining a lower scale of ancillary business, the government should adjust or subsidize the rent of social housing to attract private investment.
The results described above explain that the scale of ancillary business investment will exceed the regulated limit. Therefore, the government can only raise the rate of return by the means of reducing the scale of principal business or increasing the net income of principal business. In the principal business of the case study, the total number of social housing must reach at least 300 units. The investment of principal business must be scaled down based on the scaling-up ratio of ancillary business. For example, if the ancillary business is scaled up to 10%, the principal business will be scale down 10%; that is; the total units of social housing are reduced to 270. On the other hand, to raise the net income of principal business, the rent of social housing must be increased for a higher net after-tax profit margin.
7. Research Scope and Limitations
PPP-BOT projects of public construction can be roughly divided into two types: linear repetition and vertical repetition, namely linear type and base type, respectively, in this paper. If the construction is an irregular band or linear distribution, it can be classified as the linear type and mainly covers the public traffic or pipeline constructions, such as the highway, pipeline, and bridge [53]. If the construction is located in a fixed block, it can be classified as the base type, such as social housing, a baseball stadium, a parking lot, airport etc. The study focuses on the base-type BOT projects and assumes the government practices the zero-funding policy. Instead, the government yields a certain percentage of investment on the ancillary business to raise the overall financial self-liquidating ratio, and charges the royalties and land rent to balance the excess profits of private investors. Under this assumption, the research constructs the financial model to investigate the return rate attracting investors to evaluate the reasonable (minimum) ancillary business scale.
8. Conclusions
With the financial model created in the research and the case study of social housing BOT project, the ancillary business scale attracting investors can be derived. To meet the expected rate of return, the minimum investment scales on the ancillary business of the social housing BOT project are 30.81% and 52.79% based on the 7-year and 17-year data, respectively.
Both results are higher than the upper bound of ancillary business specified by the government (25%). The case study project has been officially announced online by the government agencies, and no private investor has been willing to invest on the project since July 2016. The result is consistent with the estimation in the research.
The approaches to promote the investment are increasing net income or reducing costs. In addition to raising the proportion of ancillary business scale, the government can regulate the rent discount or subsidy of social housing to increase the net income of principal business or to reduce the cost. According to the sensitivity analysis results, to attract private investment, the government must first consider raising ancillary business scale and then adjust the rent of social housing.
Due to the lack of legal basis and not much relevant literature on the ancillary business research in PPP-BOT projects, the proposed model can be generally applied in BOT projects, and the government can refer to the research and further regulate the policy to promote BOT projects.
Moreover, the case is obliged to charge the revenue-based royalty in accordance with the tender conditions. Although the government can limit the profit of investors by charging the royalty, it must also comprehend the impacts of royalties on investment willingness. The financial model developed in the research can be extended based on the royalty configuration, in order to determine the reasonable royalty policy for the negotiation reference to the government and private investors.
Author Contributions
Conceptualization, C.-Y.H.; methodology, C.-Y.H.; software, C.-Y.H.; validation, C.-Y.H.; formal analysis, C.-Y.H.; investigation, C.-Y.H.; resources, C.-Y.H. and R.-J.D.; data curation, C.-Y.H.; writing—original draft preparation, C.-Y.H.; writing—review and editing, C.-Y.H. and R.-J.D.; visualization, C.-Y.H.; supervision, R.-J.D.; project administration, C.-Y.H.; funding acquisition, C.-Y.H.
Funding
This research received no external funding.
Acknowledgments
The author wishes to acknowledge the help of Ren-Jye Dzeng in commenting on the draft of the paper.
Conflicts of Interest
The authors declare no conflict of interest.
References
- World Bank Institute. Public-Private Partnerships—Reference Guide Version 1.0; International Bank for Reconstruction and Development/International Development Association or The World Bank: Washington, DC, USA, 2012. [Google Scholar]
- Grimsey, D.; Lewis, M.K. Public Private Partnerships: The Worldwide Revolution in Infrastructure Provision and Project Finance; Edvard Elgar: Cheltenham, UK, 2004; 288p. [Google Scholar] [CrossRef]
- Engel, E.; Fischer, R.; Galetovic, A. The Joy of Flying: Efficient Airport PPP Contracts. Transp. Res. Part B Methodol. 2018, 114, 131–146. [Google Scholar] [CrossRef]
- Chang, C.Y.; Chou, H.Y. Dilemma of Taiwan’s Private Finance Policy and its Solutions. Constr. Manag. Q. 2011, 85, 1–13. [Google Scholar]
- Urban Development Bureau Taichung City Government (UDBTCG). Feasibility Assessment Report on BOT of Social Housing in Taichung Huilai House Section 2016. Available online: http://www.ud.taichung.gov.tw/public/Attachment/127010/7391613030.pdf (accessed on 6 June 2017).
- Zhang, X. Win-Win Concession Period Determination Methodology. J. Constr. Eng. Manag. 2009, 135, 550–558. [Google Scholar] [CrossRef]
- Carbonara, N.; Pellegrino, R. Revenue guarantee in public-private partnerships: A win-win model. Constr. Manag. Econ. 2018, 36, 584–598. [Google Scholar] [CrossRef]
- Carbonara, N.; Costantino, N.; Pellegrino, R. Concession period for PPPs: A win-win model for a fair risk sharing. Int. J. Proj. Manag. 2014, 32, 1223–1232. [Google Scholar] [CrossRef]
- Carbonara, N.; Pellegrino, R. Public-private partnerships for energy efficiency projects: A win-win model to choose the energy performance contracting structure. J. Clean. Prod. 2018, 170, 1064–1075. [Google Scholar] [CrossRef]
- Osei-Kyei, R.; Chan, A.P.C.; Javed, A.A.; Ameyaw, E.E. Critical success criteria for public-private partnership projects: International experts’ opinion. Int. J. Strateg. Prop. Manag. 2017, 21, 87–100. [Google Scholar] [CrossRef]
- Al-Azemi, K.F.; Bhamra, R.; Salman, A.F.M. Risk management for build, operate and transfer (BOT) projects in Kuwait. J. Civ. Eng. Manag. 2012, 20, 415–433. [Google Scholar] [CrossRef]
- Graham, A. How important are commercial revenues to today’s airport? J. Air Transp. Manag. 2009, 15, 106–111. [Google Scholar] [CrossRef]
- Whitehead, C.; Scanlon, K. Social Housing in Europe; LSE: London, UK, 2007. [Google Scholar]
- Liu, T.; Chan, A.P.C.; Wang, S.Q. PPP Framework for Public Rental Housing Projects in China. In Proceedings of the International Conference on Construction and Real Estate Management, Kunming, China, 27–28 September 2014. [Google Scholar]
- Chen, Y.L. New Prospects for Social Rental Housing in Taiwan: The Role of Housing Affordability Crises and the Housing Movement. Int. J. Hous. Policy 2011, 11, 305–318. [Google Scholar] [CrossRef]
- Chang, C.O. The Expectations of Modern Social Housing. Architectural Institute of Taiwan. 2011, pp. 10–13. (In Chinese). Available online: http://www.architw.org.tw/ftp/magazine/mag63/p10-13.pdf (accessed on 6 June 2017).
- Qin, W.; Sanchez, A.; Alcaraz, V. Introducing public-private partnerships for affordable housing in China. Open House Int. 2017, 42, 75–81. [Google Scholar]
- Roehrich, J.K.; Lewis, M.A.; George, G. Are public-private partnerships a healthy option? A systematic literature review. Soc. Sci. Med. 2014, 113, 110–119. [Google Scholar] [CrossRef] [PubMed]
- Grimsey, D.; Lewis, M.K. Evaluating the risks of public private partnerships for infrastructure projects. Int. J. Proj. Manag. 2002, 20, 107–118. [Google Scholar] [CrossRef]
- Liou, F.M.; Chen, B. Reducing the BOT Financial Risk with Two-Stage Real Options: Using the Kaohsiung Cable Car Project in Taiwan as an Example. J. Technol. 2011, 26, 143–155. [Google Scholar]
- Tsai, W.P.; Pan, N.H.; Hsieh, B.M. Investment Risk Assessments of BOT Project- A Case Study of Yamay Resort. J. Stat. Manag. Syst. 2012, 15, 261–280. [Google Scholar] [CrossRef]
- Shahrara, N.; Çelik, T.; Gandomi, A.H. Risk analysis of BOT contracts using soft computing. J. Civ. Eng. Manag. 2017, 23, 232–240. [Google Scholar] [CrossRef]
- Doloi, H. Understanding impacts of time and cost related construction risks on operational performance of PPP projects. Int. J. Strateg. Prop. Manag. 2012, 16, 316–337. [Google Scholar] [CrossRef]
- Jun, J. Appraisal of combined agreements in BOT project finance: Focused on minimum revenue guarantee and revenue cap agreements. Int. J. Strateg. Prop. Manag. 2010, 14, 139–155. [Google Scholar] [CrossRef]
- Sanni, G.A.; Adebiyi, J.O. Performance Risks Allocation in BOT Infrastructure in Nigeria: A Case Study of Lagos Infrastructure Project. J. Built Environ. 2017, 5, 43–57. [Google Scholar] [CrossRef]
- Li, D.; Chen, Y.; Chen, H.; Hui, E.C.M.; Guo, K. Evaluation and Optimization of the Financial Sustainability of Public Rental Housing Projects: A Case Study in Nanjing, China. Sustainability 2016, 8, 330. [Google Scholar] [CrossRef]
- Xu, Y.; Peng, Y.; Qian, K.; Chan, A.P.C. An Alternative Model to Determine the Financing Structure of PPP-Based Young Graduate Apartments in China: A Case Study of Hangzhou. Sustainability 2015, 7, 5720–5734. [Google Scholar] [CrossRef] [Green Version]
- Chang, L.M.; Chen, P.H. BOT Financial Model: Taiwan High Speed Rail Case. J. Constr. Eng. Manag. 2001, 127. [Google Scholar] [CrossRef]
- Huang, Y.L.; Pi, C.C. Valuation of Multi-Stage BOT Projects Involving Dedicated Asset Investments: A Sequential Compound Option Approach. Constr. Manag. Econ. 2009, 27, 653–666. [Google Scholar] [CrossRef]
- Finnerty, J.D. Project financing: Asset-Based Financial Engineering; John Wiley & Sons, Inc.: New York, NY, USA, 1996. [Google Scholar]
- Wang, R.H. A Study on Royalty of Private Participation in Infrastructure. Master’s Thesis, University of NCCU, Taipei, Taiwan, 2003. (In Chinese). [Google Scholar]
- Wu, S.Y. Royalty Models for the BOT Projects of Transportation Infrastructures. Master’s Thesis, University of NCTU, Hsinchu, Taiwan, 2002. (In Chinese). [Google Scholar]
- Chiou, Y.C.; Shen, C.M. Royalty Models for Transportation Infrastructure BOT Projects under Uncertain Environment. J. Chin. Inst. Transp. 2004, 17, 123–146. (In Chinese) [Google Scholar]
- Hsiao, H.Y. Royalty Models for the Transportation Infrastructure BOT Projects with Consideration of Managerial Flexibility-Application of Real Options. Master’s Thesis, University of NCTU, Hsinchu, Taiwan, 2004. (In Chinese). [Google Scholar]
- Kang, C.C.; Feng, C.M.; Huang, S.C. Modeling the Concession Fee for BOT Projects from the Government’s View point. J. Manag. 2004, 22, 173–189. [Google Scholar]
- Kang, C.C.; Feng, C.M.; Huang, S.C. A New Financial Engineering Model for Analyzing the Royalty of BOT Projects: The Taiwan Case. In Proceedings of the International Conference on Industrial Engineering and Engineering Management, Singapore, 2–4 December 2007; IEEE: Piscataway, NJ, USA, 2007; pp. 277–281. [Google Scholar]
- Chiou, Y.C.; Lan, L.W. Royalty Models for Build-Operate-Transfer Transportation Projects with Uncertainties. Transportmetrica 2006, 2, 175–197. [Google Scholar] [CrossRef]
- Kang, C.C.; Feng, C.M.; Kuo, C.Y. A Royalty Negotiation Model for BOT Projects: A Bi-Level Programming approach. In Proceedings of the International Conference on Industrial Engineering and Engineering Management, Singapore, 8–11 December 2008; IEEE: Piscataway, NJ, USA, 2008; pp. 1764–1768. [Google Scholar]
- Kang, C.C.; Feng, C.M.; Kuo, C.Y. A Royalty Negotiation Model for BOT (build-operate-transfer) Projects: The operational revenue-based model. Math. Comput. Model. 2011, 54, 2338–2347. [Google Scholar] [CrossRef]
- Carbonara, N.; Costantino, N.; Pellegrino, R. A transaction costs-based model to choose PPP procurement procedures. Eng. Constr. Archit. Manag. 2016, 23, 491–510. [Google Scholar] [CrossRef]
- Soliño, A.S.; de Santos, P.G. Influence of the Tendering Mechanism in the Performance of Public-Private Partnerships: A Transaction Cost Approach. Public Perform. Manag. Rev. 2016, 40, 97–118. [Google Scholar] [CrossRef]
- Siemonsma, H.; Van Nus, W.; Uyttendaele, P. Awarding of Port PPP contracts: The added value of a competitive dialogue procedure. Marit. Policy Manag. 2012, 39, 63–78. [Google Scholar] [CrossRef]
- Vinogradov, D.; Shadrina, E. Public-Private Partnerships as Collaborative Projects: Testing the Theory on Cases from RU and Russia. Int. J. Public Adm. 2018, 41, 446–459. [Google Scholar] [CrossRef]
- Shen, L.Y.; Li, H.; Li, Q.M. Alternative Concession Model for Build Operate Transfer Contract Projects. J. Constr. Eng. Manag. 2002, 128. [Google Scholar] [CrossRef]
- Hanaoka, S.; Palapus, H.P. Reasonable concession period for build-operate-transfer road projects in the Philippines. Int. J. Proj. Manag. 2012, 30, 938–949. [Google Scholar] [CrossRef]
- Zhang, X.; Bao, H.; Wang, H.; Skitmore, M. A model for determining the optimal project life and concession period of BOT projects. Int. J. Proj. Manag. 2016, 34, 523–532. [Google Scholar] [CrossRef]
- Liou, F.M.; Huang, C.P. Automated Approach to Negotiations of BOT Contracts with the Consideration of Project Risk. J. Constr. Eng. Manag. 2008, 134, 0733–9364. [Google Scholar] [CrossRef]
- Lo, L.W.; Wang, C.F. The Operating Strategy for Subsidiary Business of Mass Rapid Transit System-Exemplified by TamshiuLine of Taipei Mass Rapid Transit System. Master’s Thesis, University of NCTU, Hsinchu, Taiwan, 1995. (In Chinese). [Google Scholar]
- Chen, Y.L.; Huang, Y.L. Land-Grant-Related Investments and Privatized Infrastructure Investments. Master’s Thesis, University of NCTU, Hsinchu, Taiwan, 2002. (In Chinese). [Google Scholar]
- Chiang, C.M. Policy Review: Government Intervention in Housing: The Case of Macao. Hous. Stud. 2005, 20, 149–155. [Google Scholar]
- Regarding the reasonable of Public Service Facilities by BOT. Research, Development and Evaluation Commission Taipei City Government, 2011. Available online: http://rdnet.taipei.gov.tw/xDCM/DOFiles/pdf/00/00/01/69/84/1000119-pdf-testproj-153711.pdf (accessed on 6 May 2017).
- Chien, L.F.; Lai, T.Y. A Review of Private Participation in Public Transportation Projects in Terms of the Interactive Effects of Authority and Agency. Soochow J. Political Sci. 2007, 25, 179–217. [Google Scholar]
- Fatma, A.E.A. Linear projects scheduling using spreadsheets features. Alex. Eng. J. 2011, 50, 179–185. [Google Scholar] [Green Version]
Figure 1.
Concept of cash flow architecture of the BOT project.

Figure 2.
7-year sensitivity analysis of internal rate of return.

Figure 3.
17-year sensitivity analysis of internal rate of return.
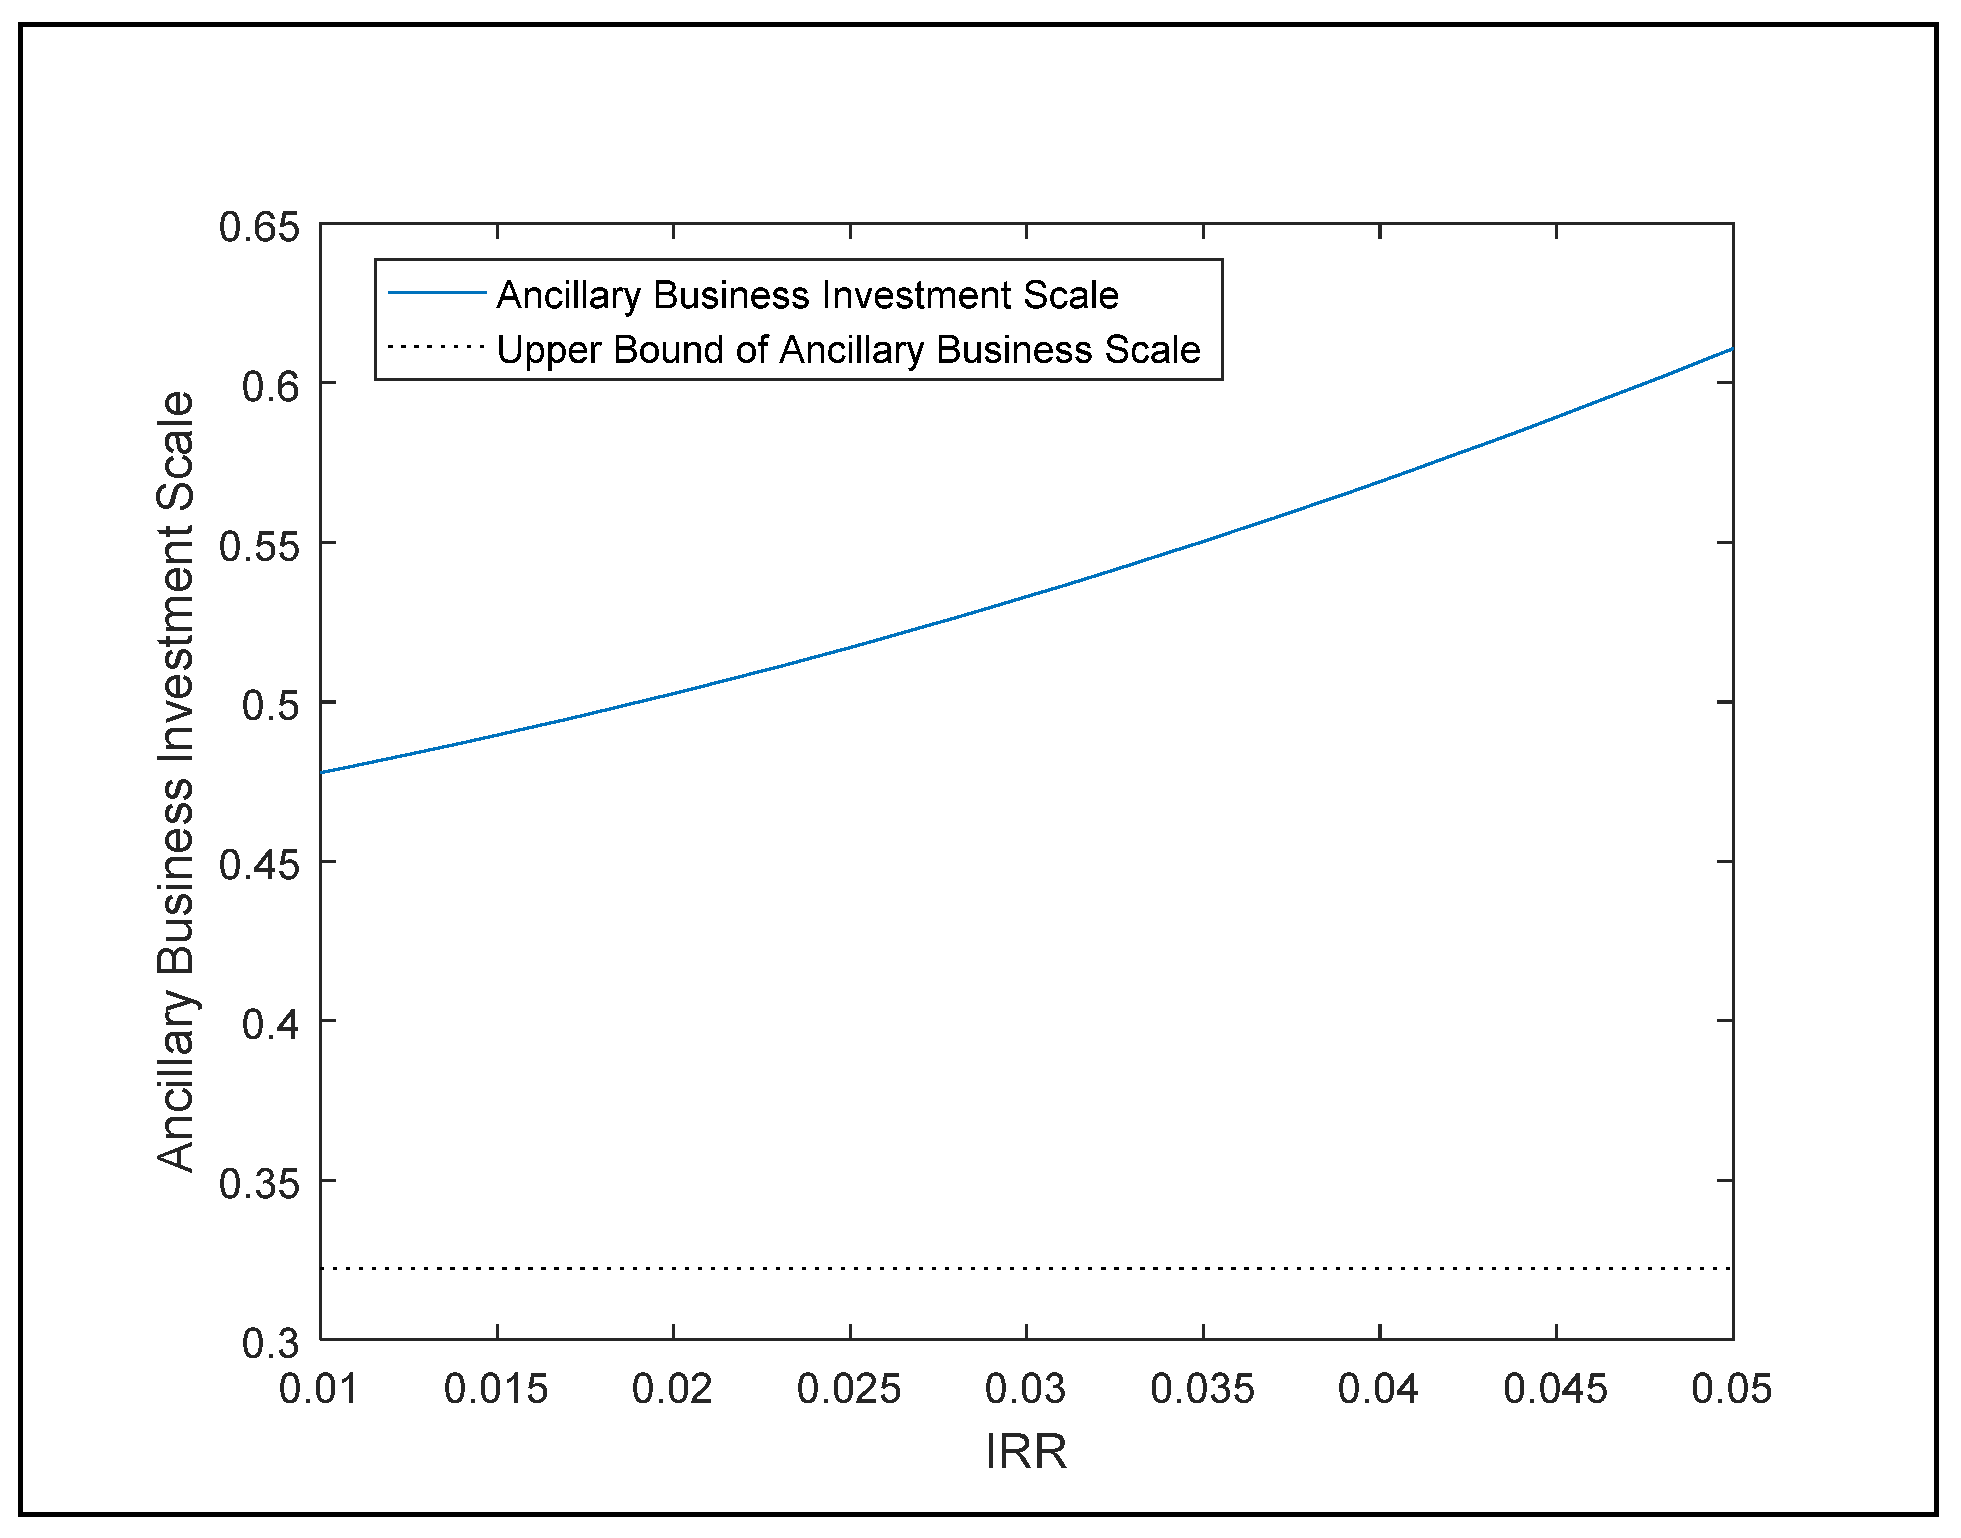
Figure 4.
7-year sensitivity analysis of rent discount.
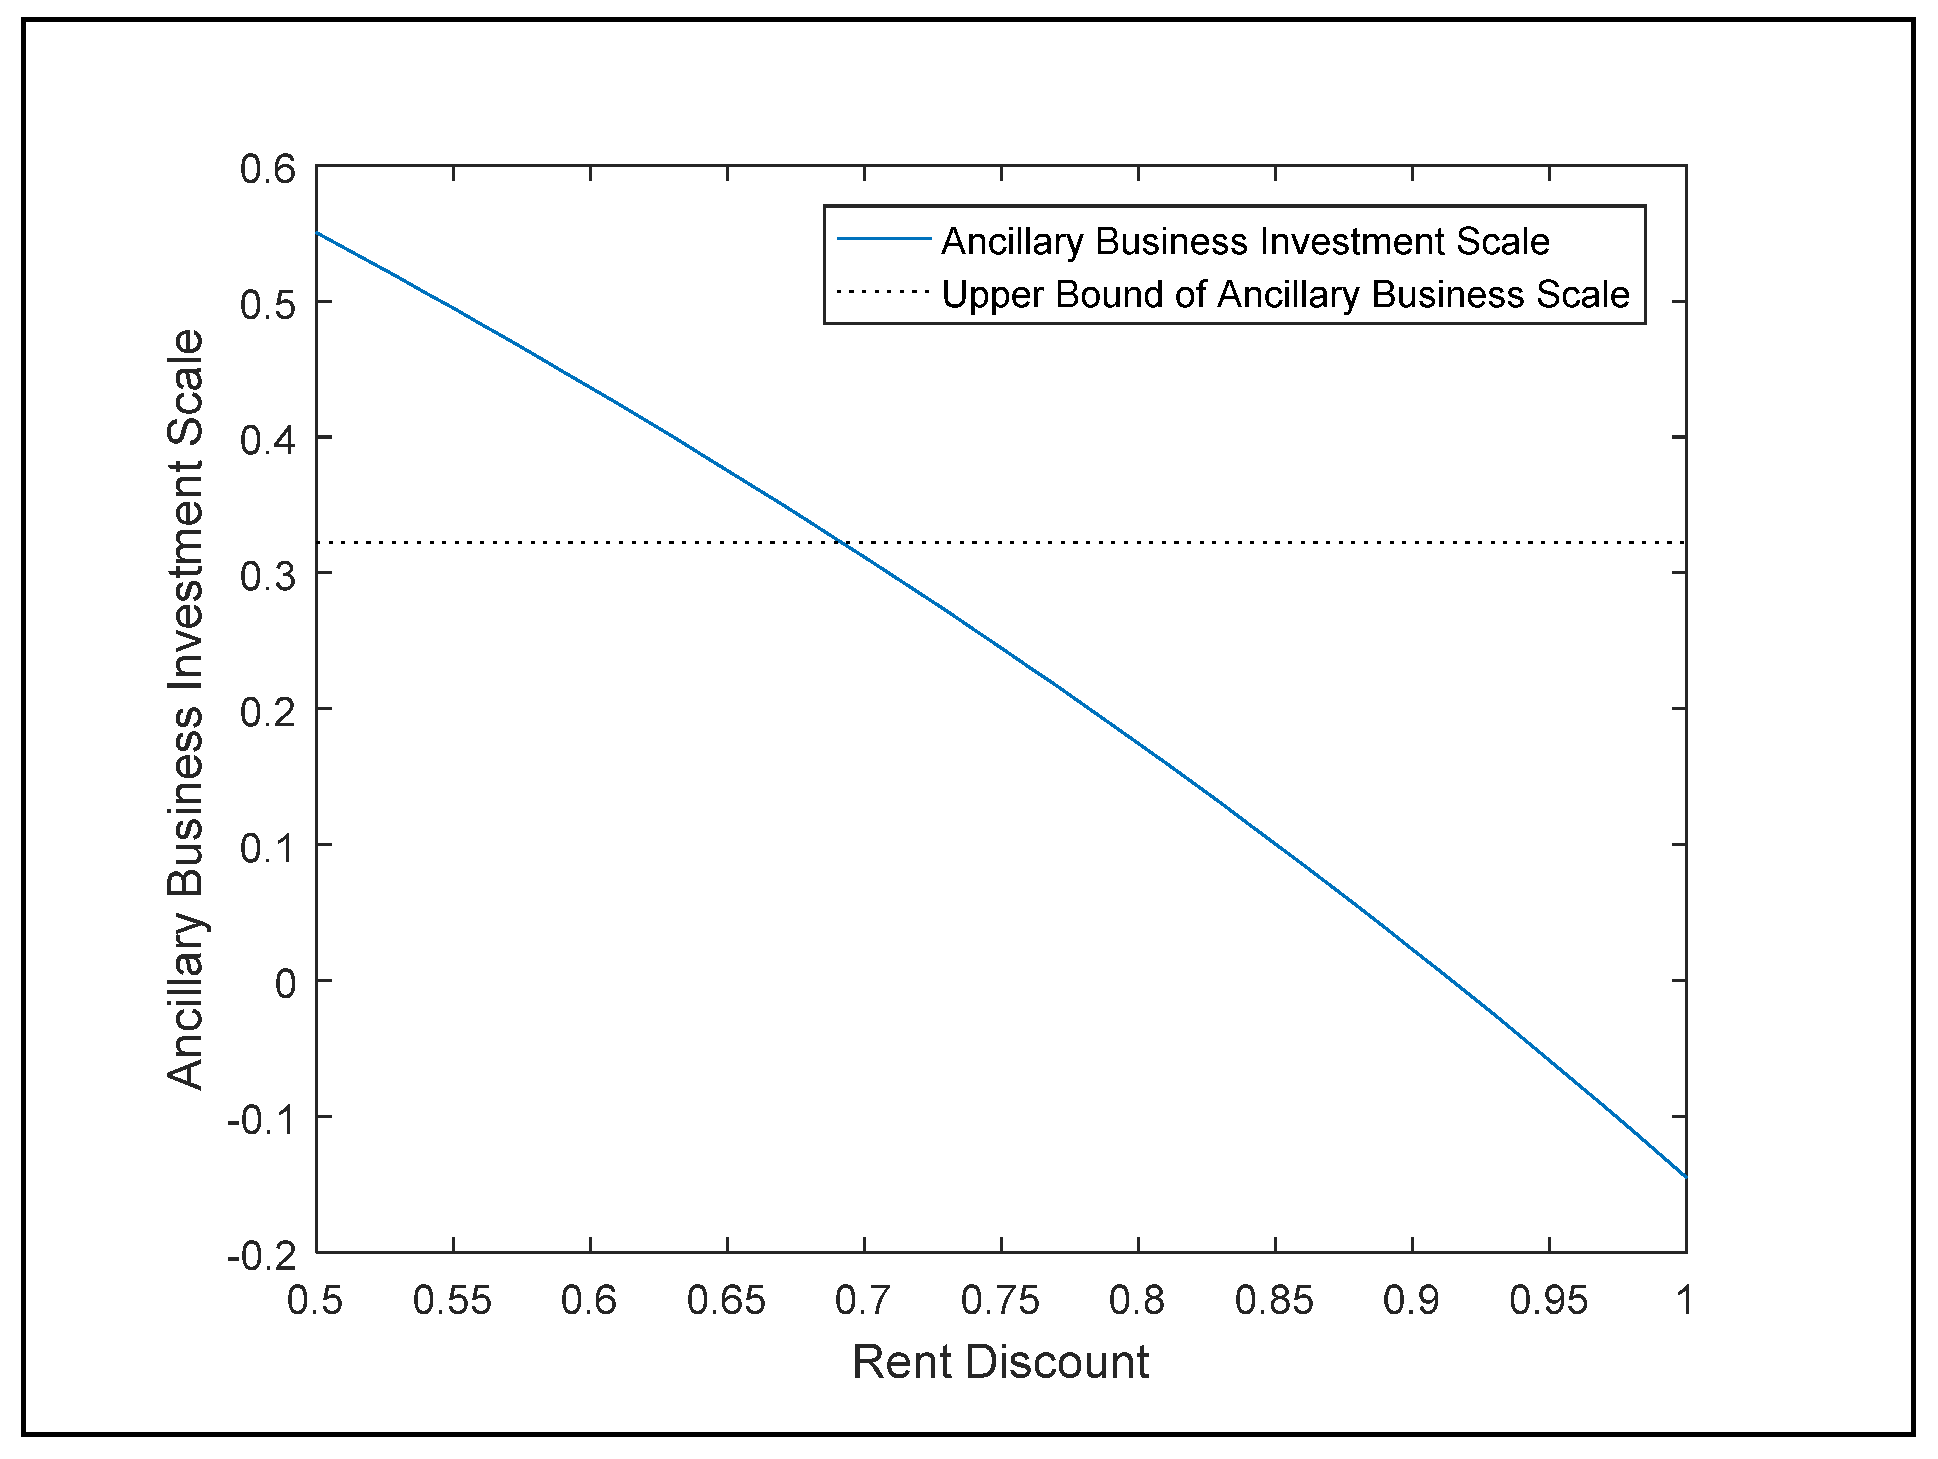
Figure 5.
17-year sensitivity analysis of rent discount.

Table 1.
List of symbols.
| Symbol | Definition |
|---|---|
| NPV | Net present value |
| IRR | Internal rate of return |
| DPB | Discounted payback |
| SLR | Self-Liquidating ratio |
| B | Total floor area |
| L | Required floor area of principal business |
| x | Ratio of ancillary business to project in total floor area |
| n | Concession period (years) |
| t | time |
| CTotal | Total construction cost and land use rent per square meter |
| CS | Construction cost of principal business and land use rent per square meter |
| Cp | Construction cost of ancillary business and land use rent per square meter |
| Depreciation of principal business per square meter | |
| Depreciation of ancillary business per square meter | |
| W | The sum of present value of the royalty |
| wt | The present value of the annual royalty at time t |
| ks | Average net income of principal business per square meter |
| Vs | Monthly net rent income of principal per square meter |
| Ms | Monthly net property management income of principal per square meter |
| Ps | Monthly net parking lot income per square meter |
| kp | Average net income of ancillary business per square meter |
| Hp | Monthly net hotel income per square meter |
| Vp | Monthly net shopping mall income per square meter |
| Mp | Monthly net property management income of ancillary per square meter |
| Yp | Monthly net parking lot income of ancillary business per square meter |
| NPR | Expected Net after-tax Profit, Margin of business |
| Expected Net after-tax Profit Margin of principal business | |
| D | After-rent-discount percentage |
| Expected Net after-tax Profit Margin of ancillary business | |
| Taxrate | Income tax rate on the BOT project’s income |
| Equity capital cost | |
| The risk-free interest rate | |
| The beta (β) coefficient of investment assets | |
| The expected rate of return on the market | |
| WACC | Weighted average cost of capital |
| The discount rate | |
| The weight of equity | |
| The weight of debt | |
| Mortgage Constant |
Table 2.
Regulated scale of principal business.
| Room Type | Percentage (%) | Indoor Net Area (m2) | Number of Room |
|---|---|---|---|
| Single | 40 | 19.8–29.8 | 300 in total |
| Double | 40 | 49.6–59.5 | |
| Triple | 20 | 79.3–89.3 |
Table 3.
Operation net income of principal business.
| Room Type | Percentage (%) | Monthly Rent (USD per m2) | Monthly Administrative Expense (USD per m2) |
|---|---|---|---|
| Single | 40 | 8.6 | 0.5 |
| Double | 40 | 7.4 | |
| Triple | 20 | 7.2 |
Table 4.
Operation net income of hotel.
| Season Type | Percentage of Days (%) | Occupancy Rate (%) | Monthly Rent (USD per m2) | Monthly Administrative Expense (USD per m2) |
|---|---|---|---|---|
| Low | 72 | 60 | 58.9 | 0.5 |
| High | 28 | 85 | 71 |
Note: Rent regulation rate is set as 3% yearly.
Table 5.
Operation net income of shopping mall.
| Net Income (USD per m2) | Monthly Administrative Expense (USD per m2) |
|---|---|
| 304.4 | 0.5 |
Note: Net income regulation rate is set as 3% yearly.
Table 6.
Net after-tax profit margin of shopping mall and hotel.
| Investment Ratio (%) | 7-yearNPR p (%) | 17year NPR p (%) | |
|---|---|---|---|
| Shopping Mall | 15 | 12.80 | 6.70 |
| Hotel | 85 | 10.53 | 9.13 |
| Portfolio | 100 | 10.87 | 8.77 |
Table 7.
Return on investment (ROI).
| Start/End Year | Period (Year) | Rate of Return on the Market |
|---|---|---|
| 2016 | 1 | 10.97% |
| 2014–2016 | 3 | 2.88% |
| 2012–2016 | 5 | 5.87% |
| 2000–2016 | 17 | 4.41% |
Table 8.
Expected rate of return of shopping mall and hotel.
| Investment Ratio (%) | 7-year β Coefficient | Expected Rate of Return (%) | 17-year β Coefficient | Expected Rate of Return (%) | |
|---|---|---|---|---|---|
| Shopping Mall | 15 | 0.7652 | 4.21 | 0.7119 | 3.58 |
| Hotel | 85 | 0.9324 | 3.73 | 0.7435 | 3.67 |
| Portfolio | 100 | 0.9073 | 4.14 | 0.7387 | 3.66 |
Table 9.
Capital cost of investors.
| Owned Capital Ratio (%) | Owned Capital Cost (%) | Financing Ratio (%) | MC (%) | WACC (%) | |
|---|---|---|---|---|---|
| Given 7-year Expected Rate of Return | 30 | 4.14 | 70% | 2.5 | 2.92 |
| Given 17-year Expected Rate of Return | 30 | 3.66 | 70% | 2.5 | 2.85 |
© 2019 by the authors. Licensee MDPI, Basel, Switzerland. This article is an open access article distributed under the terms and conditions of the Creative Commons Attribution (CC BY) license (http://creativecommons.org/licenses/by/4.0/).
Share and Cite
MDPI and ACS Style
Huang, C.-Y.; Dzeng, R.-J. Evaluating Ancillary Business Scale for PPP-BOT Projects: A Social Housing BOT Case in Taiwan. Sustainability 2019, 11, 1415. https://doi.org/10.3390/su11051415
AMA Style
Huang C-Y, Dzeng R-J. Evaluating Ancillary Business Scale for PPP-BOT Projects: A Social Housing BOT Case in Taiwan. Sustainability. 2019; 11(5):1415. https://doi.org/10.3390/su11051415
Chicago/Turabian StyleHuang, Chih-Yao, and Ren-Jye Dzeng. 2019. "Evaluating Ancillary Business Scale for PPP-BOT Projects: A Social Housing BOT Case in Taiwan" Sustainability 11, no. 5: 1415. https://doi.org/10.3390/su11051415
Note that from the first issue of 2016, this journal uses article numbers instead of page numbers. See further details here.