Spatial Distribution and Simulation of Cropland Abandonment in Wushan County, Chongqing, China


Key Laboratory of Land Surface Pattern and Simulation, Institute of Geographic Sciences and Natural Resources Research, Chinese Academy of Sciences, Beijing 100101, China
*
Author to whom correspondence should be addressed.
Sustainability 2019, 11(5), 1367; https://doi.org/10.3390/su11051367
Submission received: 17 December 2018
/
Revised: 11 February 2019
/
Accepted: 27 February 2019
/
Published: 5 March 2019
Abstract
:Cropland abandonment (CRA) is an extreme case of cropland marginalization. With the continuous development of global industrialization and urbanization, the phenomenon of CRA gradually spreads from developed countries such as eastern and western European countries and the United States to developing countries such as China, especially in regions with poor geographical conditions such as mountainous areas. However, research on CRA in developing countries is sparse, and adequate identification methods and spatial distribution information are lacking in China, impeding the comprehensive understanding of the status quo of CRA as well as the formulation of related policies and measures. Therefore, taking Wushan County in Chongqing as an example, we developed a CRA extraction method to identify cropland. Landsat 8 OLI_TIRS remote sensing images were adopted in the extraction. Subsequently, Google Earth images were used to verify the extraction results, and the extraction accuracy of abandoned cropland plaques reached 89.33%. The CRA rate in Wushan between 2011 and 2016 was 28.71%, and abandoned cropland was highly scattered across the region. In areas above 800 m and with slopes of more than 15°, large areas were abandoned. However, an increasing irrigation radius resulted in higher labor costs and, ultimately, larger abandoned areas. Using the Conversion of Land Use and its Effects-Small (CLUE-S) model, the CRA status under different scenarios was simulated, and under the scenario of economic development, the CRA rate in the next 20 years was as low as 28.84%, while under the scenario of natural growth, the rate reached 33.54%. When the model used the scenario of ecological protection, the cropland area in Wushan County decreased significantly, and the CRA rate reached 42.11%.
1. Introduction
Cropland abandonment (CRA) is an extreme phenomenon of cropland marginalization [1,2,3]. CRA has first been found in Europe mountainous areas in the early 20th century [4,5,6]. After the middle of the 20th century, with the transition of social and economic development, CRA began to spread gradually to the global scope including some developing countries such as China [7,8,9]. As a result, CRA has attracted increasing attention from scholars all over the world. In general, scholars are concerned with three aspects of researches of CRA i.e., identification of CRA, influencing factors of CRA, and the forecast of CRA.
The remote sensing technique is the most commonly used method to identify abandoned cropland. According to the spatial resolution of satellite images, moderate-resolution imaging spectroradiometer (MODIS) data (250 m) and Landsat TM images (30 m) are the two main data sources utilized to identify abandoned cropland. For example, Alcantara et al. [10] acquired CRA information for eastern Europe between 2003 and 2008, using a combination of time series and phenological information extracted from MODIS data. Using Landsat TM images, He et al. [11] investigated the CRA in some regions of Russia and Georgia during 2003–2008 by a time division method while Baumann et al. [12] identified the abandoned cropland of western Ukraine between 1986 and 2008 via the support vector machine (SVM) classification method.
CRA is a comprehensive result of multiple factors [13]. In different regions, the determined factors of CRA changed from each other. In southern Chile, both the natural factors such as soil quality and the social and economic indicators such as farming costs, traffic convenience, the number of centers of agricultural and sideline products, and agricultural subsidies, were found to be important factors influencing CRA [14]. In China, along with the adjustment of rural industrial structures, the number of agricultural products, the changes in structural characteristics of agricultural production, and the population flow led to significant changes in CRA [15]. The causes of CRA in China can be summarized as the increase of labor off-farm employment [16], the lack of rural labor forces [17], the decrease of net income of crop plantations [18], the pool land quality [13], wildlife damages [19], and policy effects [7].
CRA has both positive and negative effects on the environment. To avoid the negative effects such as the threat of food security, it is necessary to predict the scenarios of CRA after identifying the abandoned cropland and discerning the driving factors of CRA. For example, Silber and Wytrzens [20] analyzed the risks of CRA in Austria using a logistic regression model. Similarly, Price et al. [21] assessed the risks of CRA in Switzerland in 2035 and found that the mountainous areas of the Alps and Jura face high risks of CRA due to the rapid urbanization and increased grazing. In Europe, the forecasted abandoned cropland ranges from 0.7% of land area by 2020 to 6.7% by 2030 [22].
Due to the development of the economy and society, CRA is increasingly serious in China. For the limited cropland and large population base, CRA can threaten the regional food security to some degree. Identifying the abandoned cropland, understanding the driving forces of CRA, and predicting the abandoned cropland in the future could help create related policies to reduce the negative effects of CRA. However, since the phenomenon of CRA in China appeared relatively late, the researches concerning the identification and predication of abandoned cropland in China are few.
In previous researches, the time series method was usually adopted to identify abandoned cropland based on satellite images [10,11,20]. MODIS data can provide favorable support for abandoned cropland identification for high temporal resolution [10,23]. However, the spatial resolution of MODIS data is as low as 250 m which means that the fragmentized abandoned cropland cannot be identified. In China, the cropland areas per capita is as low as 0.09 hectare [24,25,26]. When using MODIS data to identify a cropland in China, the CRA will be greatly underestimated. Landsat TM image is an appropriate kind of image data for identifying abandoned cropland due to the high spatial resolution [27,28]. Nevertheless, the time series method needs a lot of data images covering different periods of crop growth. The temporal resolution of the Landsat TM image is as low as 16 days and a lot of TM images cannot be utilized due to the influence of clouds. Therefore, the previous time series method will encounter great challenges in China when identifying abandoned cropland using TM images. In this paper, we developed a new method to identify the abandoned cropland in China which did not need long-sequence TM images. On this basis, we developed several scenarios to assess the future CRA in the study area. The prediction will be beneficial for the detection and management of abandoned cropland.
The rest of the paper is organized as follows. Section 2 presents the situations of research area and the data sources. Section 3 outlines the methods we utilized to identify the abandoned cropland. Section 4 and Section 5 present the result and discussion of the research. We conclude the paper in Section 6.
2. Research Area and Data Sources
2.1. Research Area
Wushan County is located in the northeast of Chongqing, the vital part of the Three Gorges Reservoir Area, and is also known as the “Chongqing Northeast Portal”. Its territory covers 109°33′–110°11′ E and 30°45′–31°28′ N (Figure 1). Three large mountains, the Dabashan Mountain, Wushan Mountain, and Qiyueshan Mountain intersect in the territory of Wushan. The region is mainly mountainous, with few flat areas, and the terrain is high in the north and low in the south. At the end of 2015, Wushan covered an area of 2958 km2, with a forest coverage of 53.2%. The area has a humid subtropical monsoon climate with abundant rain and relatively mild temperatures. The average annual temperature is 18.4 °C, with an average annual rainfall of 1041 mm.
2.2. Data Sources
We used four types of data for the simulation of CRA. The first type of data was the land use status chart of Wushan with a scale of 1:10,000 in the SHP format for 2011, which was acquired from the Land and Resources Bureau, Wushan County, Chongqing, and was used to obtain the cropland border in the initial research year. The data were from the national second land use survey of China, which was completed in 2011. The remote sensing data sources used in this survey were artificially interpreted high-resolution data with a high accuracy; these databases contained the most accurate cropland border among China’s domestic land use data [18].
The second type of data consisted of two Landsat satellite images from 2016, downloaded from the geospatial data cloud [29]. Landsat 8 OLI_TIRS satellite data had a spatial resolution of 30 m, with a return cycle of 16 days. The two images were spliced seamlessly and subsequently tailored along the border of the study area. The graph containing the land use types of Wushan in 2016, including cropland, grassland, forest land, water areas, construction land, and unused land (natural land i.e., sandy land, gobi, salina, wetland, bare soil, and bare rock) [30], was extracted by the CART decision tree classification method.
The third type of data included population, Gross Domestic Product (GDP), river data, and other driving factor data from the Data Center for Resources and Environmental Sciences, Chinese Academy of Sciences [31], which were used to preliminarily explore the influencing factors of CRA in the study area.
The fourth type of data was the digital elevation model (DEM) data with a resolution of 30 m. These data were downloaded from the geospatial data cloud and used to extract elevation and slope information in the study area.
3. Methods
3.1. Extraction of CRA Data
Due to the characteristics of gradual change, complexity, and instability of abandoned land, it is difficult to define whether cropland is abandoned or not. As a consequence, there are large differences in the definition and understanding of the concept of CRA, and no overall acceptable definition of CRA has been established [9,15,22,27]. According to previous research, this article regards cropland that has not been cultivated for at least 5 years as abandoned cropland.
Previous research has shown that the species diversity of abandoned cropland under the natural state cannot significantly be improved within a period of 5 years, making it difficult to establish forest systems on such land [3,32,33,34]. Therefore, this study considered abandoned cropland during the 5 years from 2011 to 2016 converted into grassland and unused land, as well as abandoned cropland converted into grassland, forest land, and unused land in the next 20 years. Taking the past 5 years as an example, we extracted grassland and unused land data for 2016 and subsequently conducted spatial overlay analysis on the cropland layer in 2011 to extract the overlapping part as abandoned cropland. The specific process is shown in Figure 2.
Three steps were designed to identify the cropland (Figure 2). First, we adopted ENVI software to perform data pre-processing of Landsat 8 images including extracting all band layers, NDVI layers, and ISODATA layers. Afterwards, the band combination was finished. Second, we extracted the training plot that was utilized to perform land use classification using Cart Extension Tool. Cart model is a tree-based algorithm which utilizes statistical procedures which combine the merits of statistically-based techniques and learning algorithms [35]. Then a decision tree was established to classify the land use of Wushan. After these works, we acquired the land use map of Wushan in 2016. Last, we overlapped the land use map in 2016 with the land use map in 2011 acquired from Land and Resources Bureau of Wushan and extracted the converted land from cropland to grassland and unused land using ArcGIS software. Thus, we acquired the abandoned cropland map of Wushan from 2011 to 2016. The effects of elevation, slope, irrigation, and road distance on CRA were also analyzed in ArcGIS.
3.1.1. Extraction of Land Use Data for Wushan County in 2016
The traditional remote sensing interpretation is based on the spectral characteristics of the ground and can analyze and identify ground objects via electromagnetic radiation information characteristics received from remote sensing sensors. However, this interpretation mode tends to be limited by the phenomenon of “same object but different spectra, same spectrum but different objects” [10,11,23]. Excessive dependence on the ground object spectral characteristics in remote sensing interpretation often leads to incorrect or omissive extraction [10,11,23,32]. In contrast to the traditional interpretation mode, the decision tree classification method makes full use of the remote sensing image data and other spatial data and can effectively avoid the phenomenon of “same object but different spectra, same spectrum but different objects”, thereby obtaining more precise interpretation results when compared to traditional interpretation methods [10,11].
Among the common decision tree algorithms of ID3, C4.5, and CART, we selected the CART decision tree algorithm. This method was first proposed by Breiman et al. [36] and then widely used in several fields such as statistics and technical mining. First, the known multivariate data were used to construct the prediction criteria for classification and regression, and then a variable was predicted according to the values of other variables. Compared with other decision trees, the CART decision tree mode is more concise and can determine the classification threshold according to the sequence sample. On this basis, a decision tree can be built automatically without the effects of other factors. Besides, the more complex the data and the more variables, the better the algorithm will be. The CART model builds the prediction criterion in the form of a binary tree and uses the Gini Index in economics as the criterion of selecting the best testing variables by using the sample with the highest “purity degree” [10,23,32]. The Gini Index is defined as follows [36]:
where p (j/h) is the probability of a sample randomly selected from the training sample set belonging to the J-th category of samples when the value of a certain testing variable is h; nj (h) is the number of samples belonging to the J-th category of samples when the value of a certain testing variable is h; n (h) is the number of samples in the training sample set when the value of the testing variable is h; j is the category number.
In this study, remote sensing images were first preprocessed, and subsequently, full-color bands, NDVI layers, and ISODATA layers were selected for an unsupervised classification iteration (10 categories, 10 times) to synthesize multi-source data. At the same time, we extracted six categories of training sample areas including cropland, grassland, forest land, water areas, construction land, and unused land through the false-color layer and then built the CART decision tree in ENVI Classic. On this basis, we conducted remote sensing interpretation by the decision tree and obtained the land use graph of Wushan for 2016. The classification accuracy in our study was as high as 94.64%, with a Kappa coefficient of 0.92, enabling adequate identification of abandoned cropland.
3.1.2. Identification and Verification of Abandoned Cropland
According to our definition, land converted from cropland into grassland and unused land can be viewed as abandoned land from the perspective of land use change. Hence, we conducted spatial overlay analysis on the historical data and the grassland and unused land layers in current-status data to extract the parcels of abandoned land. In addition, we downloaded Google Earth images of Wushan for 2016 from the Satellite Map software to verify the accuracy of CRA identification. The images had a resolution of 0.52 m, with distinct textures, meeting the basic requirements to determine whether the land parcels were abandoned. Thus, using Create Random Points in the ArcGIS software, we established 50 random sampling points in Wushan and selected three plaques of abandoned land in the surroundings of each sampling point. Subsequently, we searched the images corresponding to these 150 plaques on Google Earth to determine whether each plaque was abandoned or not. After verification, we found that only 16 of these 150 plaques were farmed, and the prediction accuracy was 89.33%.
3.2. Future Evolution Simulation of the Abandoned Land
The Conversion of Land Use and its Effects (CLUE) model is a kind of dynamic multiscale model based on the system theory and is generally used for wide-range spatial distribution simulation of land use changes. The CLUE model has two merits compared to the previous land use change models which can reflect the system theory adopted in the research and development process. The first merit of CLUE is the integrity. Compared to most empirical models, CLUE could simulate multiple land use types simultaneously [37]. The second merit of CLUE is the dynamic. Compared to the previous static models, CLUE can simulate the dynamic changes of land use. The model comprehensively integrates the natural, social, and cultural factors in land use and can spatially reflect the regional land use change status, with a high credibility and interpretation ability. Thus, this model is widely used in numerous fields [37,38,39,40]. The Conversion of Land Use and its Effects at Small region extent (CLUE-S) model was established by scientists at Wageningen University, Netherlands, and is based on the empirical quantitative relationship between land use and its driving factors as well as the competitive dynamic change model for different land use types. The model assumes that land use change in certain regions is affected by the corresponding land use driving factors; at the same time, the spatial pattern of land use in these regions is in a relatively stable state under the comprehensive effects of natural, social, and cultural factors.
Under the hypothesized conditions, the CLUE-S model adopts the method of system theory to determine the mutual evolution relationships between different land use types, with the aim to synchronously simulate different land use changes [38,39]. This model can be divided into two modules, namely a non-space requirement module and a spatial distribution module. The non-space requirement module is used to predict the land use demand, while the spatial distribution module can comprehensively analyze the spatial distribution probability of land use, the land use change rules, and the land use status graph in the study base year, and allocates the land use requirement data under different scenarios to adequate spatial locations in the study area, according to the total probability calculated by the binary logistic regression method, thus realizing the spatial layout simulation of land use change [37,41].
In the binary logistic regression method, the independent variables represent the predicted values to calculate the occurrence probability of a certain event, which can be used to explain the quantitative relationship between the spatial distribution of various land use types and the driving factors. The computation formula is as follows [37,38,39,41]:
where Pi is the probability of a certain land use type i appearing in each grid unit, with a value between 0 and 1; X represents the driving factors; and β is the regression coefficient of the driving factor.
The influences and controlling effects of different driving factors on land use change vary greatly. To define these influences, this study selected the DEM, population, GDP, distance to rivers, distance to county roads, distance to provincial roads, distance to highways, and slope as the factors driving land use changes. Among these factors, DEM was utilized to extract the elevation and slope. The GDP factor refers to the spatial distribution of the gross domestic product of Wushan. Population factor refers to the spatial distribution of population density of Wushan. The distance to county roads, provincial roads, and highways refers to the Euclidean Distance of a certain grid cell to the different levels of roads (county and provincial roads) and to highways (Figure 3).
Subsequently, by using stepwise regression, we conducted regression computation on each land type and each driving factor and excluded the variables that cannot explain the spatial pattern of land use based on the regression results. In addition, we conducted the receiver operator characteristic (ROC) curve test on the fitting degree of regression equations of various land types and determined the consistency of the computed land type probability distribution pattern with the real land use pattern according to the area under the curve [37,38,39,41]. According to previous researches [37,38,39,41], when the ROC value was greater than 0.7, the selected driving factors adequately explained the spatial changes for this land use type. Based on our results, the average of ROC test values of driving factors for the eight land use types were 0.74, indicating that all selected driving factors had a good explanation ability and could be used for accurate prediction.
4. Results
4.1. CRA Situation
4.1.1. Land Use in 2016
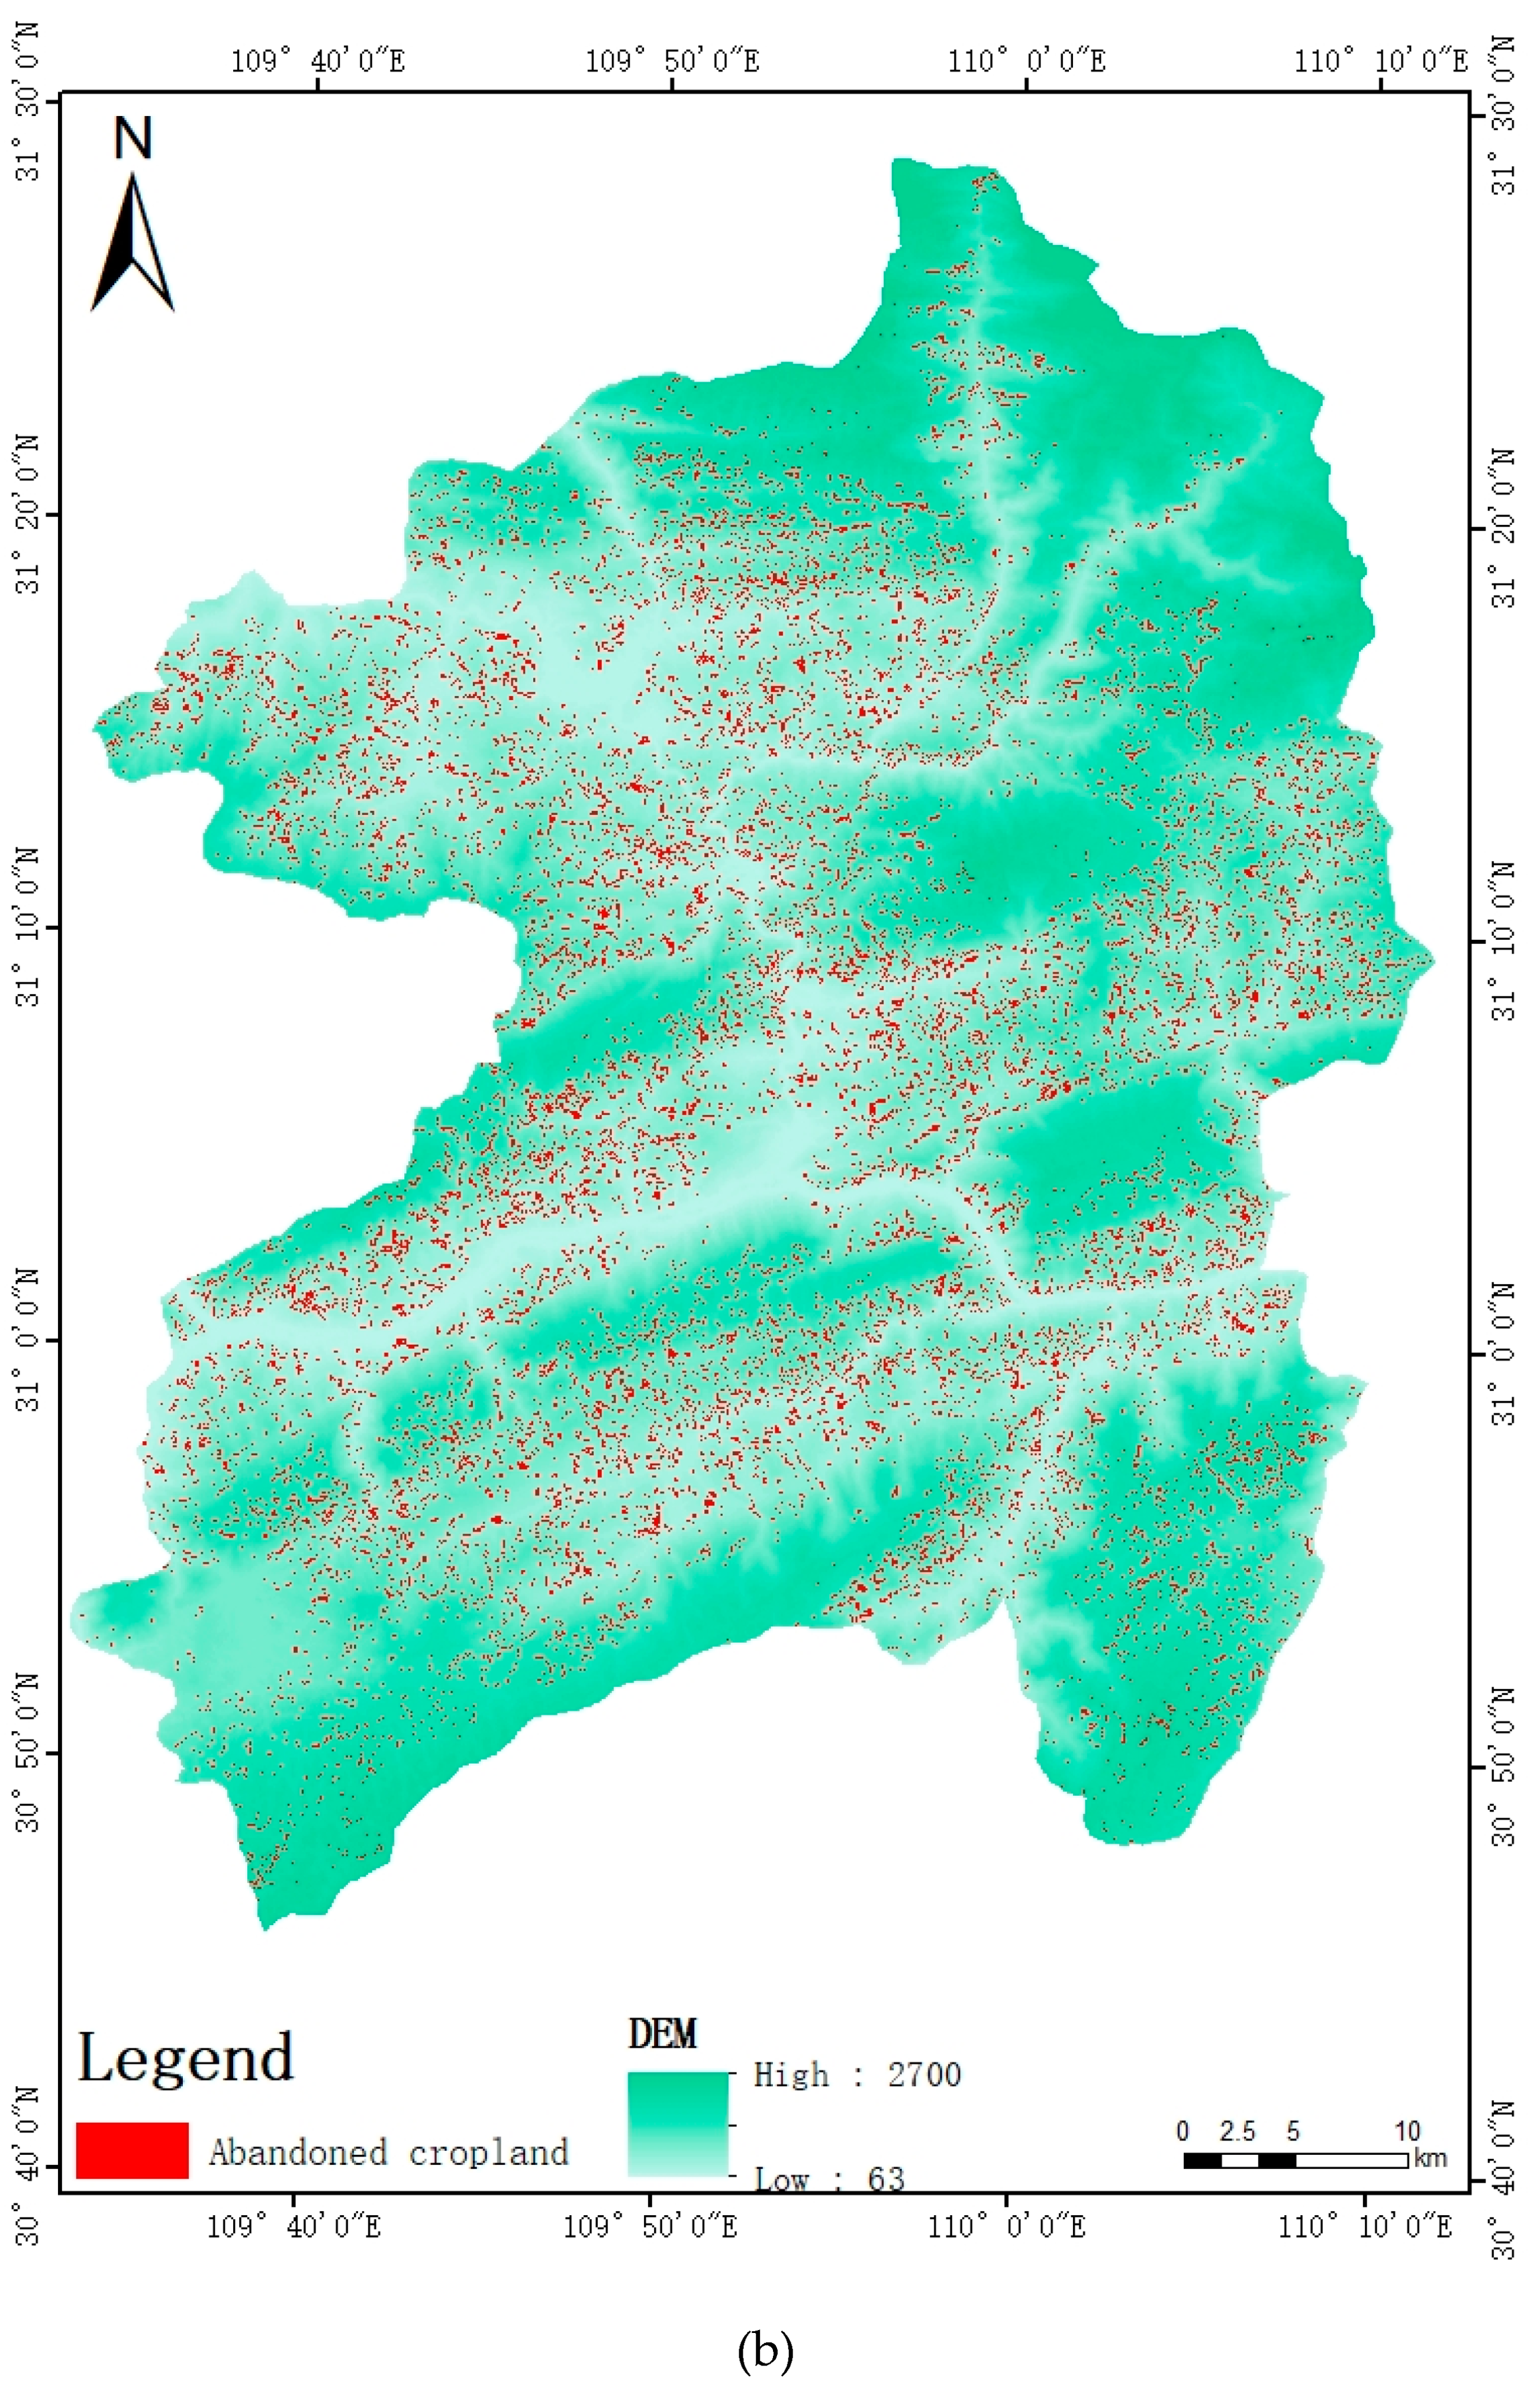
The main land use type of Wushan in 2016 was forest, accounting for 49.33% (Figure 4), with a decrease of 1.36% compared to 2011. Grassland was the second most common land use type, accounting for 21.18% and had a decrease of 1.66% compared to 2011; followed by cropland, which covered 20.84% and increased by 1.12% compared to 2011. Cropland was mainly distributed near urban land and concentrated in the central, southern, and western parts of Wushan. Forested land in Wushan County was distributed from eastern to western areas; water sources were mainly represented by rivers. Urban land was mostly distributed along rivers and cropland and grassland were staggered and also distributed within urban areas. Unused land had the lowest area proportion and was concentrated in the northeast corner of Wushan.
4.1.2. Identification of Abandoned Cropland
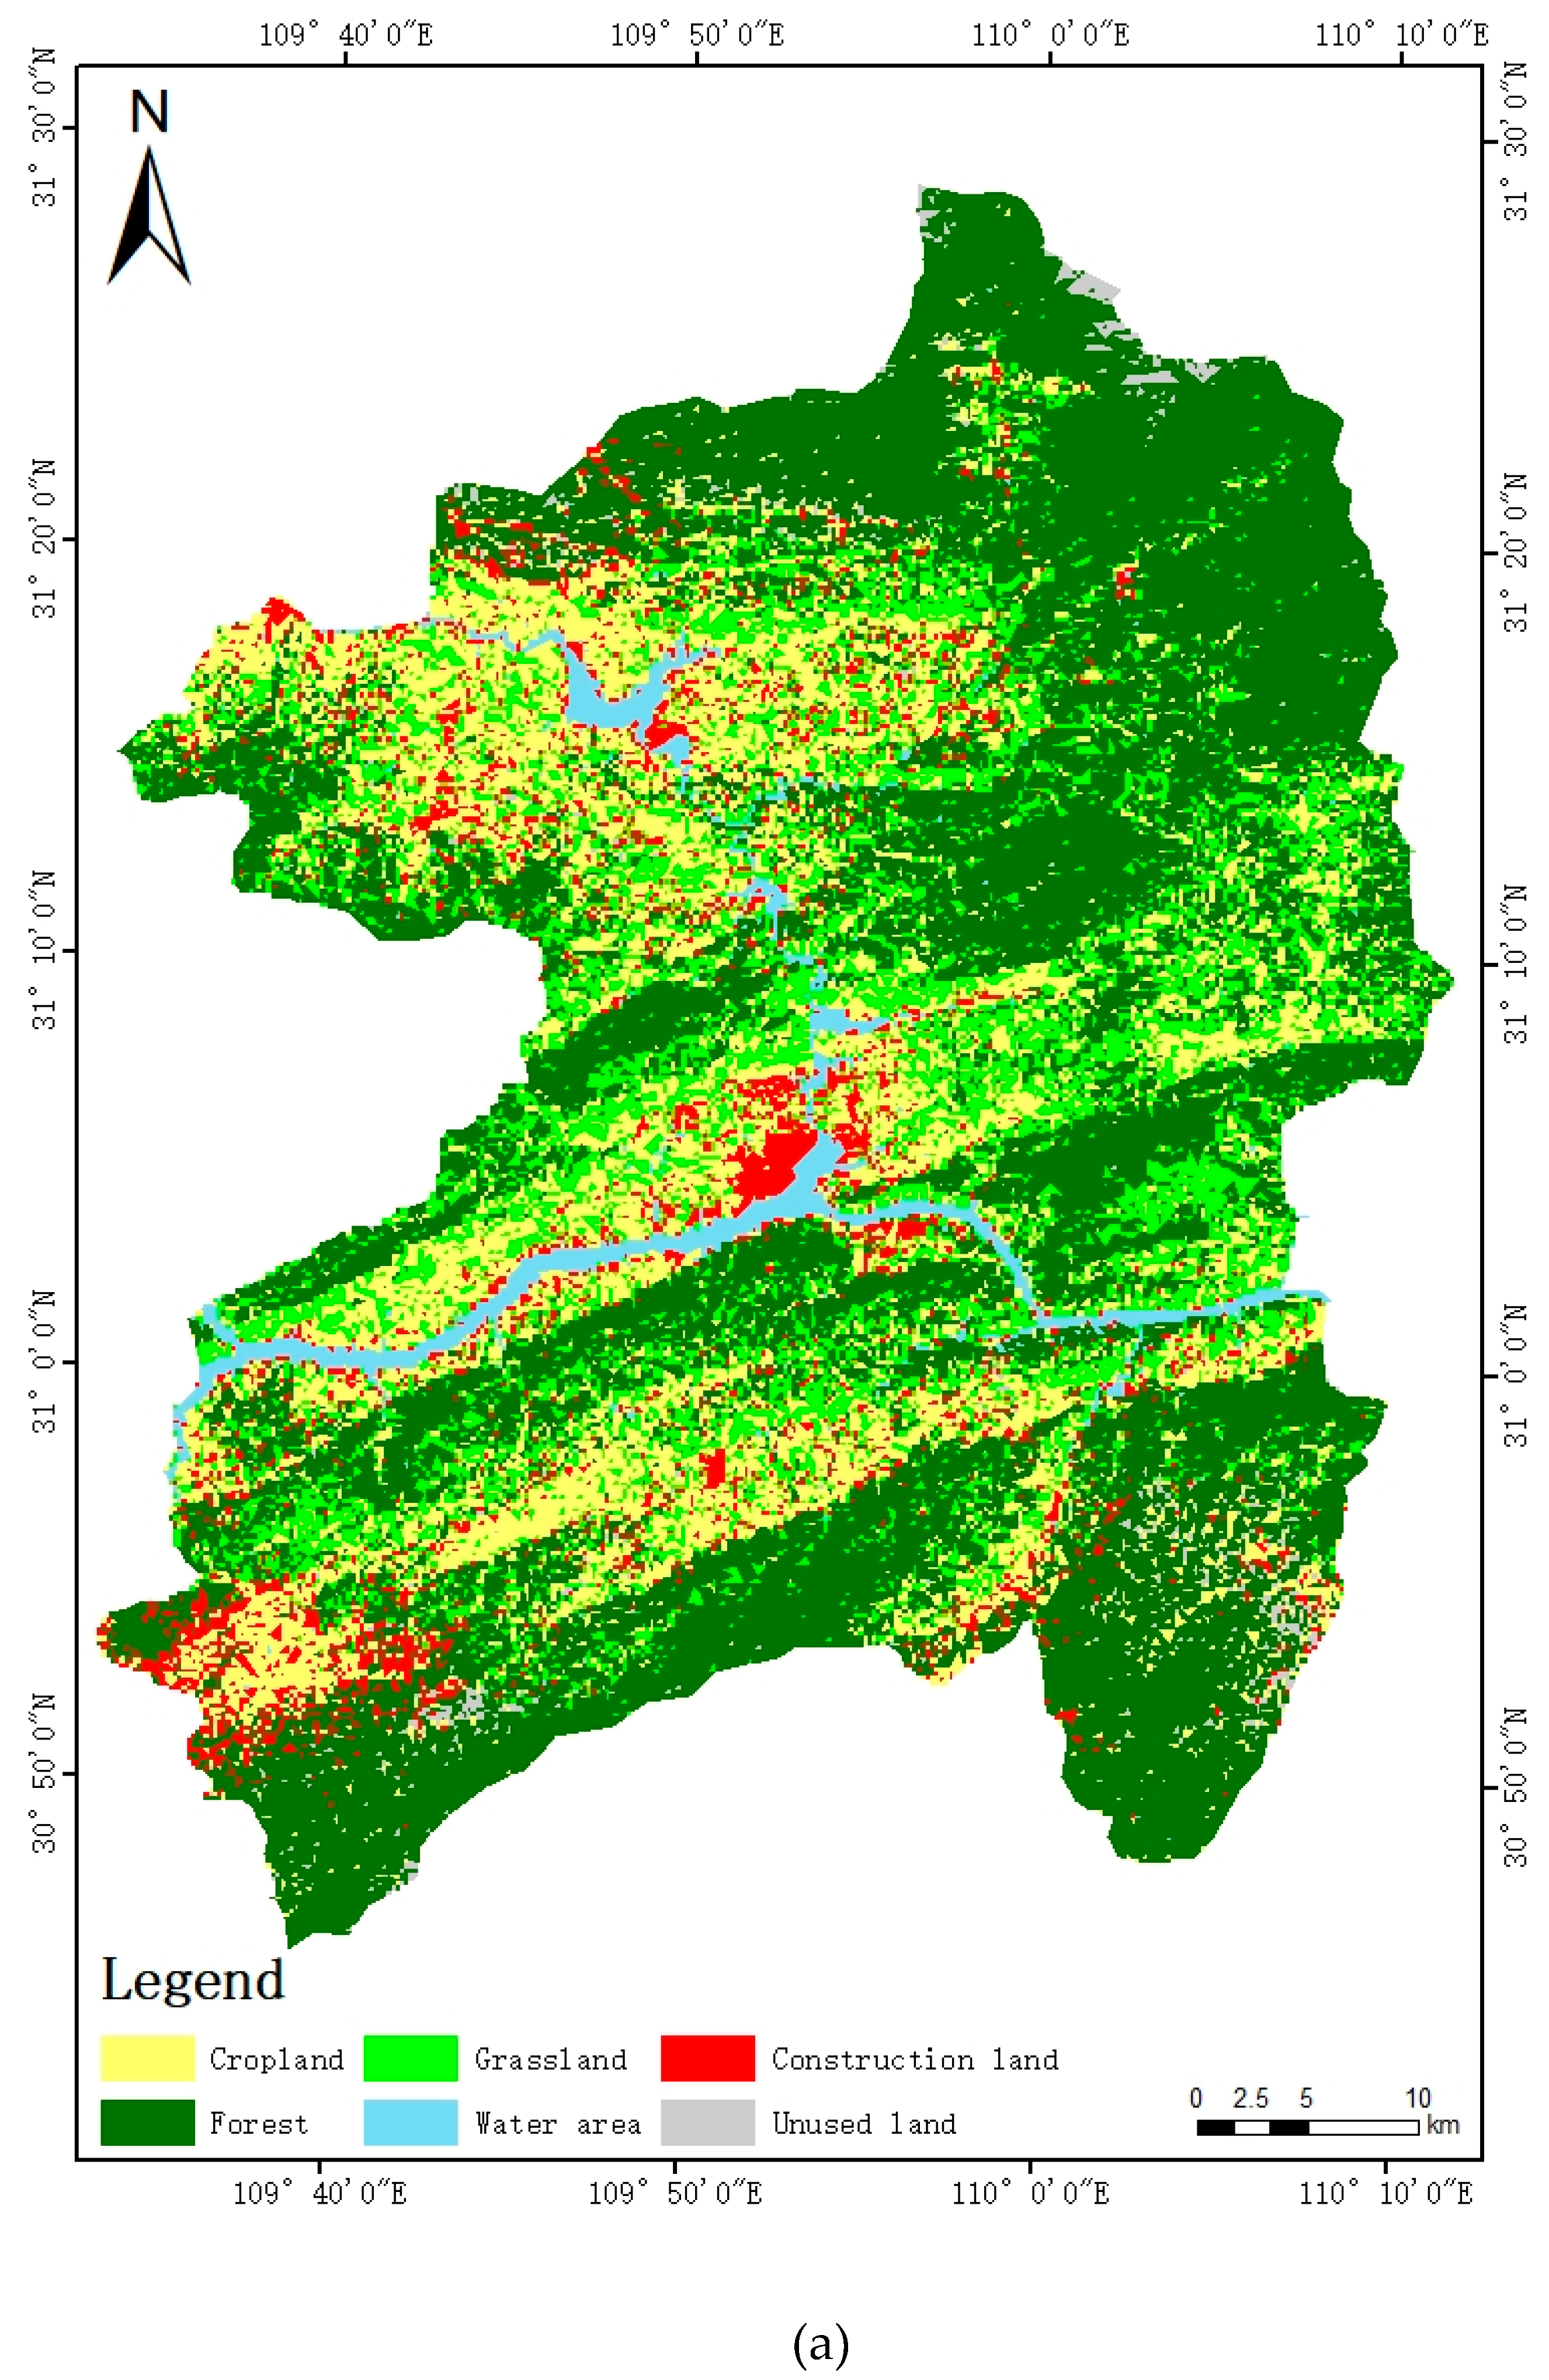
In this study, by using the spatial overlay analysis, we extracted abandoned land data, i.e., the land parcels that were converted into grassland and unused land, from the historical cropland data to obtain the spatial distribution data of abandoned cropland in the study area from 2011 to 2016 (Figure 5).
In 2011, the total cropland area of Wushan County was 608.60 km2. In 2011–2016, the area of abandoned land was 174.76 km2, with an abandonment rate of 28.71%. Figure 5 shows that abandoned cropland was concentrated in the northwestern, southwestern, and north central regions of Wushan County. The spatial distribution of abandoned cropland was scattered and fragmented. In Figure 5, the zones with a darker color represent less abandoned cropland, while the zones with an obvious color change represent abandoned cropland and a more concentrated distribution.
4.2. Analysis of the Factors Influencing CRA
Based on the cropland marginalization theory which refers to cropland’s exclusion from agricultural use in mountainous areas because of the limitations of some factors such as undulating terrain, fragmentation of cropland, and inconvenient transport conditions [42], CRA can be attributed to the combined effects of various driving factors including economic, political, and natural factors. Therefore, in this study, from the perspective of farming, we analyzed the regional CRA situation considering four driving factors, namely elevation, slope, irrigation radius, and distance to roads.
4.2.1. Elevation Factor
Geomorphology is the main factor determining cropland quality and one of the main preconditions affecting cropland revenue. The elevational gradient in Wushan County is 2600 m, with a high topographic relief. To determine the influences of elevation on CRA, the zone in the elevation range from 152 to 2008 m, where the cropland is distributed, was divided into nine elevation intervals of 200 m, and the CRA rate in each interval reflected the influencing degree of different elevations on CRA, as shown in Figure 6.
In 2011, the cropland of Wushan County was mainly distributed in the trough valley and the plain areas, at an elevation of 400–1000 m, and in the relatively low-lying areas of mountainous regions. The cropland area was 330.69 km2, which accounted for more than half of the total cropland area. In the medium mountainous areas above 1000 m, the cropland area gradually decreased and was below 20 km2 in regions above 1400 m. The abandoned cropland area showed an increasing trend in low mountainous areas from the trough valley and plain areas to the regions below 1000 m, with a subsequent decrease in the medium mountainous areas. It should be noted that the areas of abandoned cropland cannot accurately reflect the influence of elevation on CRA due to the interference of the cropland area baseline. In the areas distributing more cropland, the area of abandoned cropland could be larger.
The CRA rate refers to the ratio of abandoned cropland areas to the total areas. The CRA rate can accurately reflect the influence of elevation on CRA. The CRA rate increased at higher elevations and had a peak of 44.93% at 1400 m, followed by a slow decrease. It is worth mentioning that the CRA rates below an elevation of 800 m were all around 20%, with a subsequent increase to 29.42% at the boundary of low and medium mountainous areas at 1000 m; they further increased to 40.45% at an elevation of 1200 m, with an increasing range of 11.03%. The increasing range of the CRA rate between 1000 m and 1200 m was the largest, indicating that farmers were most inclined to abandon cropland within this elevation range. At the same time, the average CRA rate in the medium mountainous areas reached 38%, which was considerably higher than that in low mountainous areas; the lowest abandonment rate in the interval of 1800–2008 m was 30.82%, which was also slightly higher than the highest value in the low mountainous areas. Based on this, elevation increase and CRA rate were significantly positively correlated.
4.2.2. Slope Factor
Geomorphology is a key element influencing agricultural activities. In mountainous areas, the slope is an important factor and, according to the sloping field classification method of the Geomorphological Survey and Geomorphologic Mapping Commission of the International Geographical Union, the slope in our study area can be partitioned into six categories, namely 0–2, 2–6, 6–15, 15–25, 25–45, and 45°. The classification results were then compared with the changes in abandonment rate, and the cropland area and abandoned land area at each slope category were extracted respectively to compute the abandonment rate (Table 1).
Similar to the relationship between elevation and abandonment rate, the relationship between slope and abandonment rate over the past 5 years was first positive and then negative. The abandonment rate increased with increasing slopes in the 0–25° interval; especially in the 6°–15° interval, this increase was most pronounced with 4.85%. In contrast, the abandonment rate decreased with increasing slopes in the 25° interval; especially at slopes of more than 45°, the abandonment rate decreased by 4.84%. Previous research has shown that soil erosion is more severe at steeper slopes, impeding farming activities. Hence, in the zones with slopes of more than 25°, the slope conditions had negative effects on farming activities.
4.2.3. Irrigation Radius Factor
Irrigation condition is an important factor affecting cultivation and determining cropland quality. To determine the relationship between abandoned land and irrigation conditions in the study area, we established a set of buffer zones with an interval of 50 m, 500 m away from the boundaries of water areas, and overlaid the buffer zone layer with the cropland layer and the abandoned cropland layer for comparison to obtain the abandonment situation under different irrigation conditions (Figure 7).
Figure 7 shows that with the increase of the irrigation radius, the abandonment rate showed a continuously increasing trend from the initial 22.73% to 26.05%, with a variation rate of 3.32%. The increasing abandonment rate slightly varied in the same interval of 50 m, with a variation rate below 1%. In the interval of 350–400 m, the variation rate was highest, but only increased by 0.66%. The abandonment rate was therefore positively correlated with the irrigation radius; however, the decreased irrigation had a limited impact on the aggravation of CRA.
4.2.4. Road Distance Factor
Road distance determines the labor costs of land parcels to some extent. Hence, in this study, we established a set of buffer zones with an interval of 50 m within the range of 500 m from the provincial roads, highways, and county roads in the study area and overlaid the buffer zone layer with the abandoned cropland layer for comparison to obtain the abandonment situation under different buffer zone radii (Figure 8).
The CRA rate increased significantly from 13.16 to 25.75% with increasing road distance and varied most significantly within the range of 50–100 m, with an increase by 7.37%. In contrast, the abandonment rate in the range of 50–500 m cumulatively increased by 5.22%, indicating that the cultivation conditions within the range of 50 m on both sides of the roads are obviously better than those beyond the range of 50 m. Therefore, the abandonment situation within the range of 50 m was relatively moderate. With an increasing distance from roads, the cultivation conditions deteriorated, resulting in an increased abandonment rate. However, this increase was relatively small and the rates gradually stabilized. At a distance of 250–500 m, the variation range was around 0.5%. For most of the distance interval, the variation range was smaller than 0.5%, indicating that beyond a distance of 250 m, increasing distance to roads has no impact on abandonment rates.
4.3. Future Development Trend of Abandoned Cropland Based on the CLUE-S Model
4.3.1. FFuture Land Use Distribution under Scenario Simulation
Land use change is a combined result of socioeconomic development and ecological environment protection [43]. When projecting land use change in the future, the uncertainty of socioeconomic development and the policies of ecological environment protections is the largest challenge [25,44]. These uncertainties cannot be decreased in simulation only using one scenario. Therefore, when projecting land use changes, different scenarios were usually adopted to better reflect the multiple possibilities of land use change in the future. According to the previous researches [41,45,46,47,48], three kinds of scenarios were usually developed to reflect the different policy priorities of the government. In general, the first scenario was designed in reference to past land use changes. The second and third scenario usually moderately adjust the land use structures of the first scenario based on the priority for economic development or ecological protection. Therefore, in this study, we conducted simulations mainly under the following three scenarios:
- (1)
- Natural growth scenario. Under this scenario, the land use change status of Wushan in 2036 was simulated according to the variation rate of the cropland area during 2011–2016, based on the land use data obtained in the Second National Census of China. The area allocation situation for different land use types under this scenario was as follows: 21.96% cropland, 47.85% forest land, 19.52% grassland, 2.84% water areas, 6.27% construction land, and 1.55% unused land.
- (2)
- Economic development scenario. Under this scenario, economic development is given priority to, and the areas of construction land and cropland would increase greatly. At the same time, the areas of forest land and grassland would decrease accordingly. The area of allocation for different land use types under this scenario was 42% cropland, 20% forest land, 10.13% grassland, 2% water areas, 25% construction land, and 0.87% unused land.
- (3)
- Ecological protection scenario. Under this scenario, the development of tourism resources and the protection of the ecological environment are given priority to, resulting in an increase in forest and grassland areas. Cropland area would decrease accordingly, and the area of construction land would increase slowly. The area allocation for different land use types under this scenario was 11% cropland, 55% forest land, 25.13% grass land, 3% water areas, 5% construction land, and 0.87% unused land. Figure 8 shows the specific results.
Based on the simulated prediction results, the simulation results differ significantly under these three scenarios (Figure 9). Under the natural growth scenario, compared with 2016, in the central and northwestern parts, the construction land area does not change significantly, while in the southwestern parts, the construction land area slightly increases. The grassland area shows a downward trend in the southern and northern parts. Under the economic development scenario, compared with 2016, construction land and cropland areas experience significant expansion; especially in the northwestern, southeastern, and southwestern parts, construction land area shows an obvious increase. Cropland area mainly increases intensively in the three east–west direction low-lying areas in the northwestern, central, and southeastern parts; at the same time, the area of forest land decreases slightly, whereas the grassland area experiences large area degradation. Under the ecological protection scenario, compared with 2016, the construction land area decreases obviously, with a more concentrated distribution. Cropland area decreases greatly, while the forest land area significantly expands in the border region; in the central part, a large amount of cropland is converted into grassland, resulting in an increased grassland area.
4.3.2. Future Development Situation of Abandoned Cropland
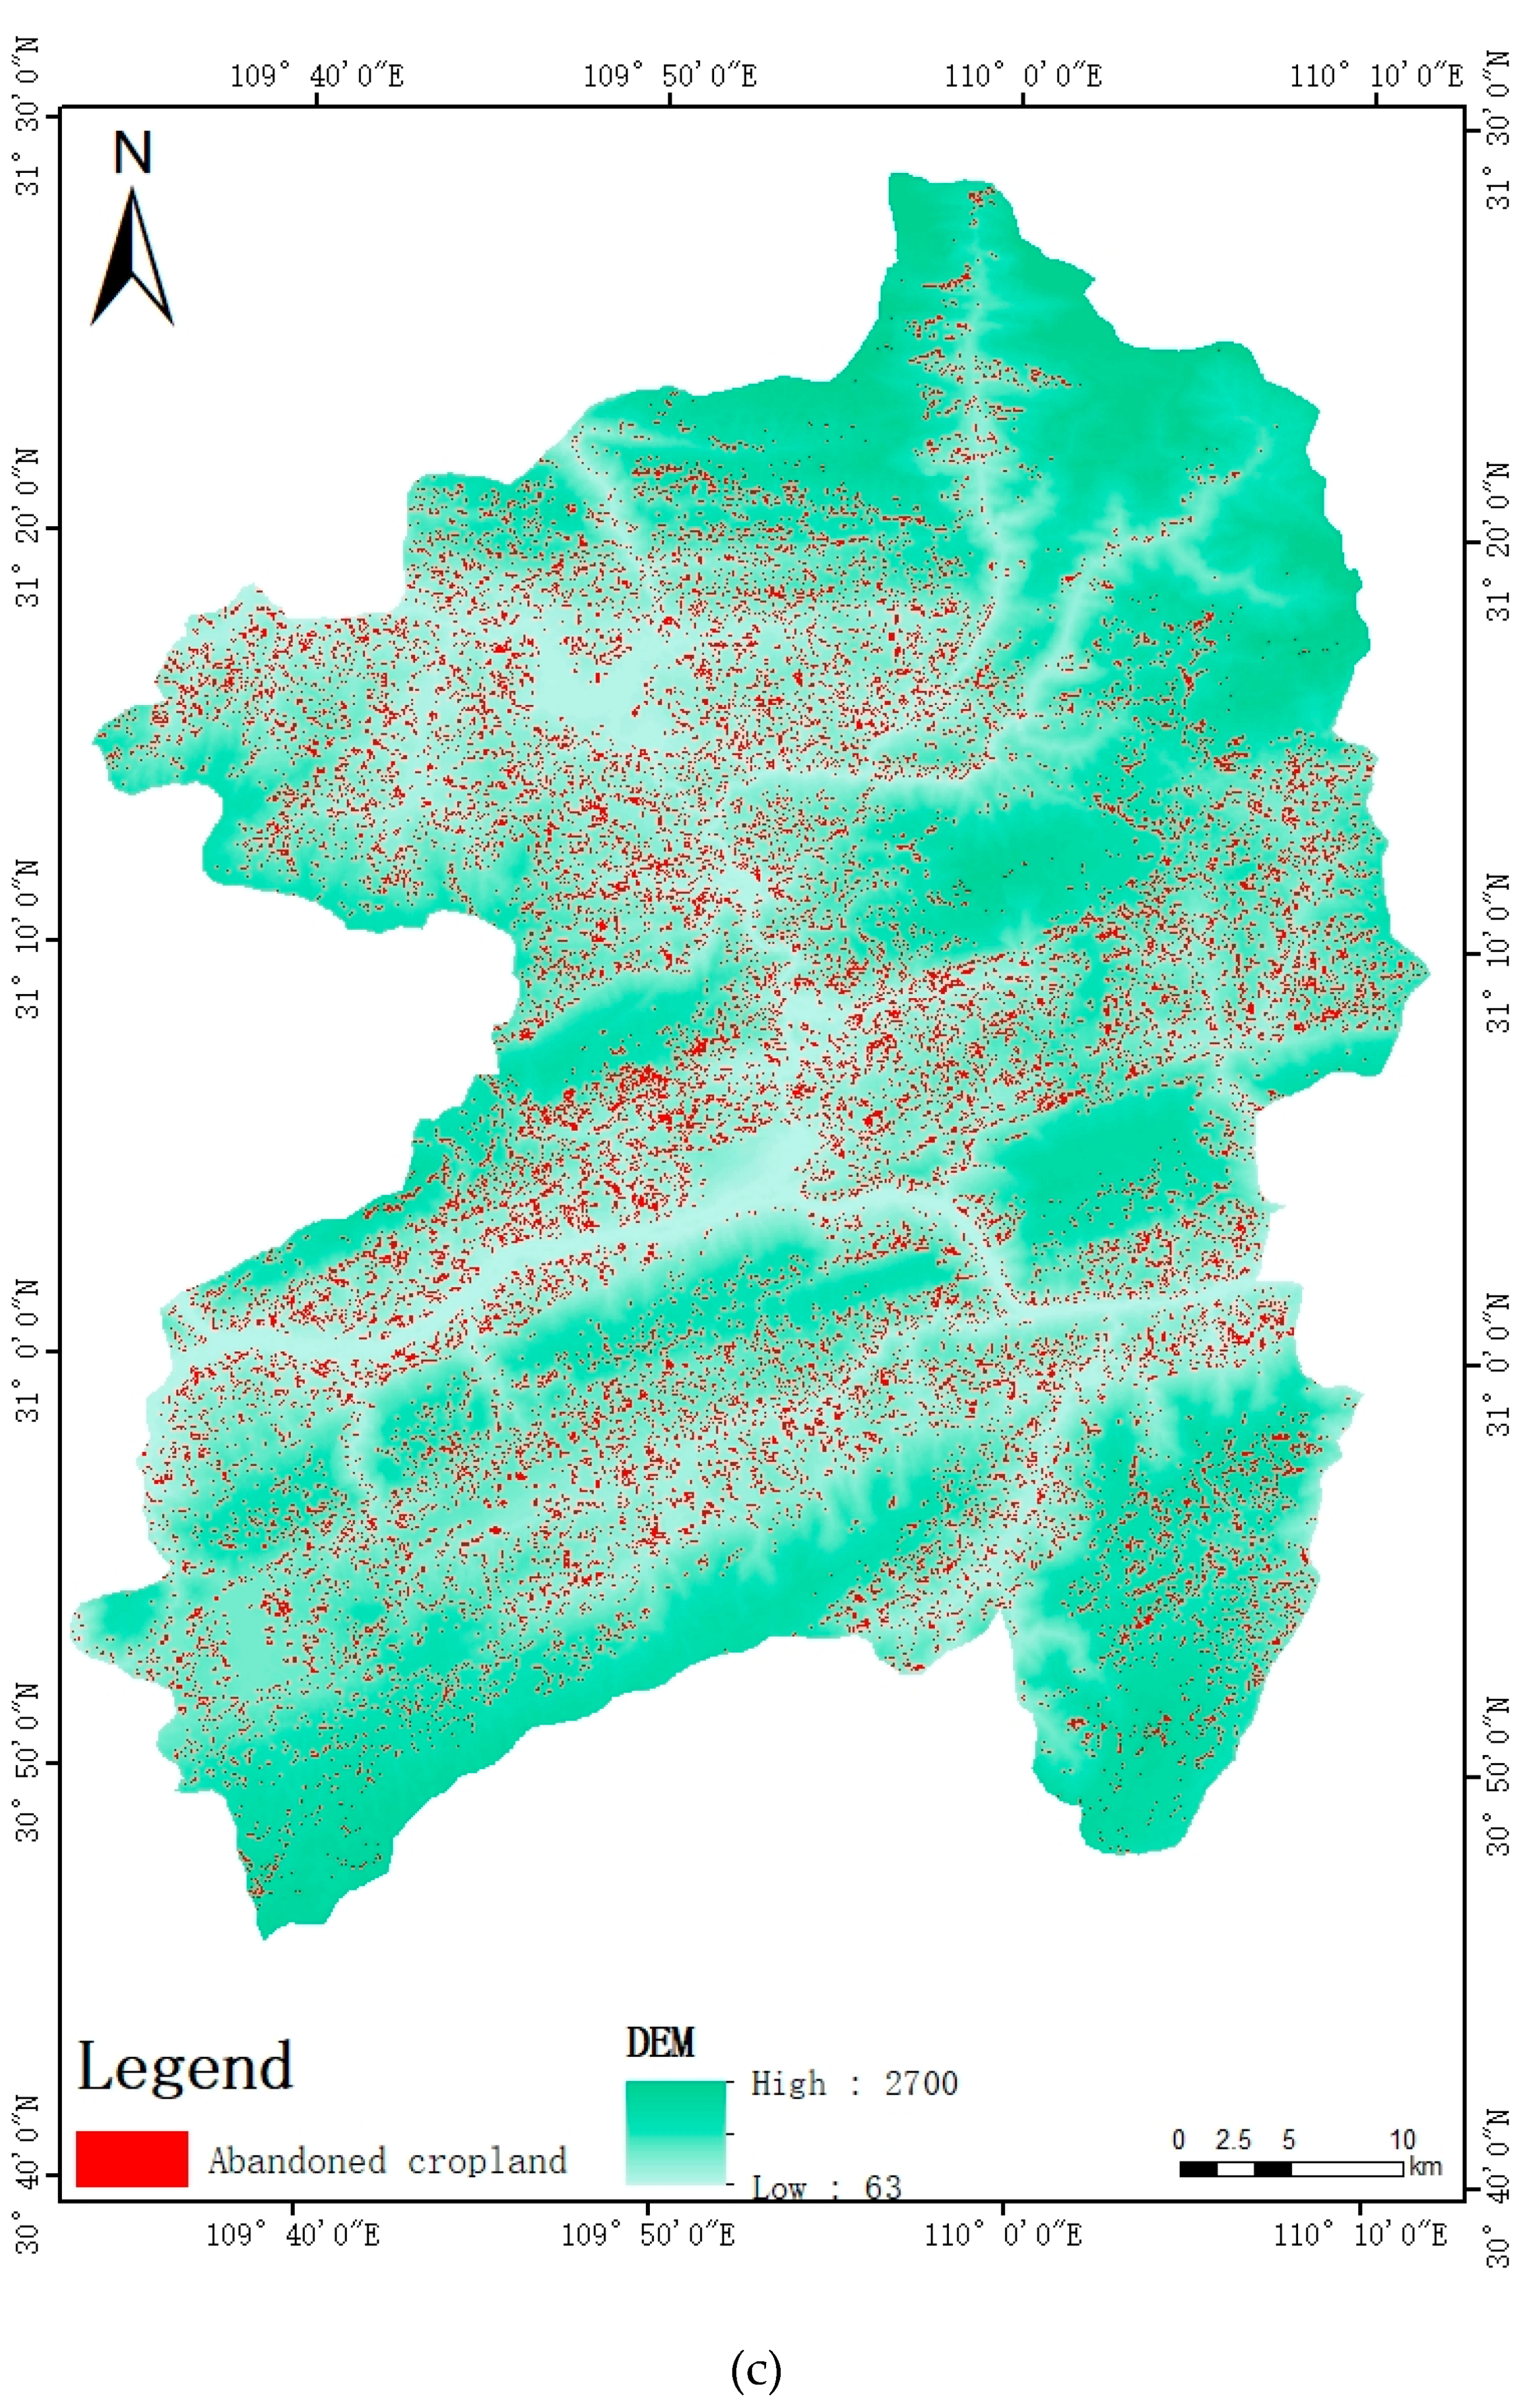
Based on the simulated land use distribution data of Wushan County in 2036 under the above three scenarios, and according to the definition of abandoned cropland, spatial analysis was conducted on the layers of grassland, forest land, and unused land in 2036, and the cropland layer in 2016 was conducted to obtain the future spatial distribution of abandoned cropland under different scenarios, as shown in Figure 10.
As shown in Figure 10, abandoned cropland was mainly distributed in regions with drastic elevation changes, namely the zones with obvious color change. However, in northern and southern areas with the highest terrain, there was no or little historical cropland, and no obvious CRA could be observed.
Between 2016 and 2036, most of the abandoned cropland in Wushan County will be grassland, accounting for about 70% of the abandoned cropland area, followed by forest land. Under the natural growth scenario, the area of abandoned land in Wushan County will amount to 208.02 km2, with an abandonment rate of 33.54%. In the future, abandoned cropland will be relatively concentrated, and abandoned areas will expand from inferior cropland with large topographic relief at a higher terrain to a superior cropland at low-lying positions with relatively flat terrain. Under the economic growth scenario, the area of abandoned land will be 178.89 km2, with an abandonment rate of 28.84%. Since the cropland area under this scenario will increase, the area of abandoned cropland will be the smallest among the three scenarios. Abandoned cropland will still mainly represent the inferior cropland with drastically varied terrain, such as the central and southern parts, but rarely regions with flat terrain. Under the ecological protection scenario, the area of abandoned cropland will reach 261.20 km2, with an abandonment rate of 42.11%. Such a high rate is mainly the result of the conversion of a large amount of cropland into grassland and forest land, and CRA is no longer restricted to inferior areas with poor cultivation conditions, but massively concerns superior cropland in the flat regions such as the low-lying regions in the central part.
5. Discussion
5.1. CRA Status and the Driving Factors
With the continuous development of the global economy, CRA presents a trend of rapid diffusion and extension. In recent years, CRA in China has become increasingly serious [7,9]. In China, the human–land relationship has always been tense, and the cropland area per capita is only 40% of the world level, confirming the severe food security problem [24]. How to obtain the accurate spatial distribution of abandoned cropland and quantitatively analyze the pattern situation is of great importance in ensuring national food security, formulating relevant policies, establishing a rural industrial structure layout, and developing the region in a sustainable manner.
In this study, the area of abandoned land in Wushan between 2011 and 2016 was 174.76 km2, and the CRA rate reached 28.71%. An estimation of the national abandoned rate in mountainous counties of China reached 28% in 2010 [7]. The rate of CRA of this research is very similar to our research (28.71%). A household survey from the mountainous areas of Southwest China showed that more than 30% of the sample plots have been abandoned [9]. The survey result is also very close to our research. Comparing to the rate of CRA in middle and eastern Europe (about 20%) [4,6], the CRA rate of our research is a little higher. There might be two reasons for this difference. First, the assessment of Europe adopted MODIS data to detect CRA [4,6], which could significantly underestimate the abandoned cropland. Second, our study area is a mountainous area which would have a higher CRA rate than the other areas. In Asia, Japan’s national CRA rate ranges from 9.66% to 12.14% with a highest county value of 27.13% [49]. It can be seen that the CRA phenomenon of China is more serious than that of Japan. In the U.S., the CRA rate showed changes from 31.6% in 1850 to 25.8% in 2000, which is similar to the CRA rate of our research.
It was found that the CRA in Wushan was significantly affected by elevation, slope, and irrigation radius. The CRA rate in the high elevation areas (above 1000 m) was much higher than that in low elevation areas, indicating that elevation is an important factor influencing CRA. The CRA rate showed a significant increased trend with the increase of gradient. These two findings are similar with the previous researches [5,27,50]. However, the influence of road distance on CRA was not significant in Wushan which was similar to the research of Hatna et al. [4]. In this paper, for the lack of available data, the influences of a lot of socio-economic variables on CRA were not analyzed. According to the previous researches, population, income, off-farm employment, and social and economic reform have been proved to be key factors influencing CRA. Rural depopulation can reduce the supply of the rural labor force and increase the risks of CRA [51]. The increase of agricultural income means the improvement of the competitiveness of agriculture production, which would have a negative effect on CRA [9]. Off-farm wage income could increase the loss of labor engaging in the agricultural production and thus, increase the risks of CRA [9,52]. In some regions, socioeconomic reform and political restructuring have crucial effects on CRA. For example, in Western and Southern Russia, the collapse of the Soviet Union resulted in agricultural subsidies being stopped, which led to substantial CRA [53]. The policy of Less Favoured Areas (LFAs) implemented in Europe aimed to improve the agricultural viability using subsidies. In mountainous areas of Europe, LFAs can help reduce the risks of CRA [54], while in other regions, the effects of LFAs on CRA varied among different Europe countries due to the unequal support of LFAs for farmers [55].
Mountainous areas have always been areas with a high rate of abandoned cultivated land. Affected by the terrain and other factors, the distribution of cultivated land resources in the region is uneven and the quantity of high-quality cultivated land is limited. Therefore, the land with steep slope that was not suitable for cultivation was usually reclaimed. However, the poor farming conditions and low income of farmers make these areas prone to abandonment. In China, the government usually reclaimed new cropland in mountainous areas to guarantee a certain number of cropland areas due to the pressure of food security. However, the newly developed cropland in mountainous areas will face great risks of abandonment according to our search. If a newly reclaimed cropland in mountainous areas was abandoned, it is a kind of resource waste. Therefore, we suggest to stop the cropland development program in mountainous areas in China.
5.2. Spatial Distribution Simulation of Future CRA Based on the CLUE-S Model
When cropland is spontaneously abandoned by farmers, the natural vegetation in cropland will gradually be converted from crops to grasses, woods, or bare land (unused land). However, according to the previous researches, the forest restoration in abandoned agricultural land will take at least 10 years at natural conditions [33]. In this paper, we identified the CRA of Wushan within 5 years. Without the man-made interferences, the abandoned agricultural land cannot be changed into forestry areas. Therefore, we defined the CRA as the conversions from cropland into grassland or unused land to reduce the identification errors. When forecasting the future CRA of Wushan, we also adopted the same definition to ensure the consistency of the research.
To predict the future CRA in Wushan County, this study selected eight driving factors for CRA and then conducted scenario simulations based on the CLUE -S model. The results show that by 2036, in the study area, under the economic development scenario, due to the rapid expansion of cropland, the abandonment rate will be relatively stable, and abandoned cropland will mainly consist of inferior areas with a relatively steep terrain. Especially in the central and southern parts, abandoned cropland is distributed in the up-and-down belts of the mountains; at the same time, population growth and urbanization promote the significant expansion of cropland and construction land, resulting in the reduction of grassland areas. Hence, the CRA rate under this scenario is the smallest with only 28.84%. Under the natural growth scenario, without human intervention, the area of cropland increases slightly, while that of grassland decreases slightly. Hence, the abandonment rate under this scenario is higher than that under the economic development scenario, reaching up to 33.54%. Under the ecological protection scenario, the abandonment rate is highest; along with the decrease in cropland area, forest land and grassland expand greatly, resulting in a further deterioration of the CRA situation, with an abandonment rate increasing to 42.11%. Nowadays, the Chinese government attaches great importance to the protection of the ecological environment. In this new socio-economic context, many marginal croplands could be returned to grassland or forestry to reduce the negative ecological effects such as soil erosion. Therefore, under the ecological protection scenario, the CRA rate is the highest among the three scenarios.
A lot of researches have demonstrated that converting grassland to agricultural lands can potentially reduce the soil organic carbon and impair soil health in the long term [56,57]. However, the conversions from abandoned cropland to grassland in CRA usually can help increase the biodiversity [58]. Some researchers found that CRA has a positive impact on reducing soil erosion due to the vegetation recovery in CRA. Pointereau et al. [2] also suggests that the CRA of intensive agriculture often results in ecological benefits. In this paper, we designed three scenarios to simulate the CRA of Wushan in the future. However, there are still some potential policy factors we did not consider. The production of biofuel crops is an important approach to guarantee energy security. The biofuel crops could be planted into cropland or the marginal land. Due to the large pressure of food security, the Chinese government intends to utilize the marginal land that was not suitable for cultivation to produce biofuel crops [59,60]. If the production of biofuel crops substantially grows in the future, many abandoned croplands would be reutilized again, thus decreasing the predicted CRA rate. The production of warm season perennial grasses is beneficial for increasing forage supply [61]. If warm season perennial grasses were popularized and planted in croplands in China, the CRA rate forecasted in this paper will be underestimated.
5.3. Merits and Limitations of This Study
In this study, based on the image data with a resolution of 30 m, we developed an interpretation method of the CART decision tree and extracted the spatial distribution information of abandoned cropland through combining the land use data with interpretations of the remote sensing data of larger-scale resolution. In 2016, the remote sensing interpretation accuracy of the study area was 94.64%. According to the verification by Google Earth images, for the 150 randomly selected abandoned land parcels, 134 land parcels were identified as abandoned land parcels, with a precision of 89.33%. These results show that the method is reliable and feasible and that the extraction of abandoned cropland data in mountainous areas, based on the proposed method, has some advantages. At the same time, the scenario prediction of CRA, based on the CLUE-S model, can provide information about the future CRA risk situation in the study area, thereby offering valuable references for regional sustainable development.
Due to the lack of relevant statistical data on CRA, comparisons are complex, limiting the applicability of this method. Moreover, this study involves field research, which may lead to incorrect classifications of some fallow land as abandoned cropland. In addition, it is difficult to obtain social and economic data, impeding the determination of the driving factors. In this sense, more detailed studies are necessary.
6. Conclusions
From 2011 to 2016, the CRA rate in Wushan County of Chongqing reached 28.71%, and abandoned cropland was highly scattered throughout the region. According to the preliminary analysis on those driving factors; elevation, slope, and irrigation radius were significantly correlated with the CRA rate, while the distance to the road only played a minor role. In terms of elevation and slope, the abandonment rate first increased and then decreased with increasing elevation or slope, whereas the irrigation radius was positively correlated with the abandonment rate. Abandoned cropland in Wushan County was mainly distributed in the elevation range of 1200–1400 m in the initial section of the mid-mountainous areas, as well as in regions with obvious relief ups and downs and steep slopes. The increase of the irrigation distance greatly reduced the enthusiasm of farmers for farming, and the deterioration of geographical conditions became an important factor affecting the abandonment rate.
Under the economic development scenario, the cropland area only slightly increased, while under the natural growth scenario, the areas of cropland, forest land, and grassland significantly fluctuated, with a moderate CRA rate. In contrast, under the ecological protection scenario, human intervention in natural environments was greatly reduced; the decrease in cropland and the increase in forest land and grassland resulted in the significant increase in an abandoned cropland area. In the new context that the Chinese government could put increased emphasis on ecological protection, the CRA rate in mountainous areas of China in the future will be very high. Therefore, it is necessary to stop new cropland reclamations in mountainous areas which used to be adopted to increase the cropland inventory to guarantee the food security of China.
Author Contributions
Conceptualization, W.S.; Methodology, Y.G. and W.S.; Software, Y.G.; Validation, W.S. and Y.G.; Formal analysis, W.S.; Investigation, W.S. and Y.G.; Resources, W.S.; Data curation, Y.G.; Writing—original draft preparation, Y.G. and W.S.; Writing—review and editing, W.S.; Visualization, Y.G.; Supervision, W.S.; Project administration, W.S.; Funding acquisition, W.S.
Acknowledgments
The research was supported by National Natural Science Foundation of China (Grant Nos. 41671177 and 41501192), the National Key Research and Development Program (Grant No. 2016YFA0602402), National Key Research Program of China (973 Program) (Grant No. 2015CB452702) and Key Laboratory of Earth Observation and Geospatial Information Science of NASG (Grant No. 201807).
Conflicts of Interest
The authors declare no conflict of interest.
References
- Queiroz, C.; Beilin, R.; Folke, C.; Lindborg, R. Farmland abandonment: Threat or opportunity for biodiversity conservation? A global review. Front. Ecol. Environ. 2014, 12, 288–296. [Google Scholar] [CrossRef]
- Pointereau, P.; Coulon, F.; Girard, P.; Lambotte, M.; Stuczynski, T.; Sanchez Ortega, V.; Del Rio, A. Analysis of Farmland Abandonment and the Extent and Location of Agricultural Areas That Are Actually Abandoned or Are in Risk to be Abandoned; Anguiano, E., Bamps, C., Terres, J.M., Eds.; JRC Scientific and Technical Reports; Joint Research Centre of European Commission: Roma, Italy, 2008. [Google Scholar]
- Smaliychuk, A.; Müller, D.; Prishchepov, A.V.; Levers, C.; Kruhlov, I.; Kuemmerle, T. Recultivation of abandoned agricultural lands in Ukraine: Patterns and drivers. Glob. Environ. Chang. 2016, 38, 70–81. [Google Scholar] [CrossRef]
- Hatna, E.; Bakker, M.M. Abandonment and expansion of arable land in Europe. Ecosystems 2011, 14, 720–731. [Google Scholar] [CrossRef]
- Bellin, N.; van Wesemael, B.; Meerkerk, A.; Vanacker, V.; Barbera, G.G. Abandonment of soil and water conservation structures in Mediterranean ecosystems: A case study from south east Spain. Catena 2009, 76, 114–121. [Google Scholar] [CrossRef]
- Terres, J.-M.; Scacchiafichi, L.N.; Wania, A.; Ambar, M.; Anguiano, E.; Buckwell, A.; Coppola, A.; Gocht, A.; Källström, H.N.; Pointereau, P. Farmland abandonment in Europe: Identification of drivers and indicators, and development of a composite indicator of risk. Land Use Policy 2015, 49, 20–34. [Google Scholar] [CrossRef]
- Li, S.; Li, X.; Sun, L.; Cao, G.; Fischer, G.; Tramberend, S. An estimation of the extent of cropland abandonment in mountainous regions of China. Land Degrad. Dev. 2018, 29, 1327–1342. [Google Scholar] [CrossRef]
- Chen, Y.-F.; Wang, Y.-K.; Fu, B.; Wang, H.-W.; Wang, W. Spatial patterns of farmland abandonment and its impact factors in the central Three Gorges Reservoir Area. J. Mt. Sci. 2018, 15, 631–644. [Google Scholar] [CrossRef]
- Yan, J.; Yang, Z.; Li, Z.; Li, X.; Xin, L.; Sun, L. Drivers of cropland abandonment in mountainous areas: A household decision model on farming scale in Southwest China. Land Use Policy 2016, 57, 459–469. [Google Scholar] [CrossRef] [Green Version]
- Alcantara, C.; Kuemmerle, T.; Prishchepov, A.V.; Radeloff, V.C. Mapping abandoned agriculture with multi-temporal MODIS satellite data. Remote Sens. Environ. 2012, 124, 334–347. [Google Scholar] [CrossRef]
- Yin, H.; Prishchepov, A.V.; Kuemmerle, T.; Bleyhl, B.; Buchner, J.; Radeloff, V.C. Mapping agricultural land abandonment from spatial and temporal segmentation of Landsat time series. Remote Sens. Environ. 2018, 210, 12–24. [Google Scholar] [CrossRef]
- Baumann, M.; Kuemmerle, T.; Elbakidze, M.; Ozdogan, M.; Radeloff, V.C.; Keuler, N.S.; Prishchepov, A.V.; Kruhlov, I.; Hostert, P. Patterns and drivers of post-socialist farmland abandonment in Western Ukraine. Land Use Policy 2011, 28, 552–562. [Google Scholar] [CrossRef]
- Zhang, Y.; Li, X.; Song, W. Determinants of cropland abandonment at the parcel, household and village levels in mountain areas of China: A multi-level analysis. Land Use Policy 2014, 41, 186–192. [Google Scholar] [CrossRef]
- Díaz, G.I.; Nahuelhual, L.; Echeverría, C.; Marín, S. Drivers of land abandonment in Southern Chile and implications for landscape planning. Landsc. Urban Plan. 2011, 99, 207–217. [Google Scholar] [CrossRef]
- Shi, T.; Li, X.; Xin, L.; Xu, X. Analysis of farmland abandonment at parcel level: A case study in the mountainous area of China. Sustainability 2016, 8, 988. [Google Scholar] [CrossRef]
- Deng, X.; Xu, D.; Qi, Y.; Zeng, M. Labor off-farm employment and cropland abandonment in rural china: Spatial distribution and empirical analysis. Int. J. Environ. Res. Public Health 2018, 15, 1808. [Google Scholar] [CrossRef] [PubMed]
- Xu, D.; Deng, X.; Guo, S.; Liu, S. Labor migration and farmland abandonment in rural China: Empirical results and policy implications. J. Environ. Manag. 2019, 232, 738–750. [Google Scholar] [CrossRef] [PubMed]
- Zhang, Y.; Li, X.; Song, W.; Zhai, L. Land abandonment under rural restructuring in China explained from a cost-benefit perspective. J. Rural Stud. 2016, 47, 524–532. [Google Scholar] [CrossRef] [Green Version]
- Hua, X.; Yan, J.; Li, H.; He, W.; Li, X. Wildlife damage and cultivated land abandonment: Findings from the mountainous areas of Chongqing, China. Crop Prot. 2016, 84, 141–149. [Google Scholar] [CrossRef] [Green Version]
- Silber, R.; Wytrzens, H.K. Modelling the Probability of Land Abandonment at Parcel Level; Citeseer: University Park, PA, USA, 2006. [Google Scholar]
- Price, B.; Kienast, F.; Seidl, I.; Ginzler, C.; Verburg, P.H.; Bolliger, J. Future landscapes of Switzerland: Risk areas for urbanisation and land abandonment. Appl. Geogr. 2015, 57, 32–41. [Google Scholar] [CrossRef]
- Keenleyside, C.; Tucker, G.; McConville, A. Farmland Abandonment in the EU: An Assessment of Trends and Prospects; Institute for European Environmental Policy: Bruxelles, Belgium, 2010. [Google Scholar]
- Löw, F.; Prishchepov, A.V.; Waldner, F.; Dubovyk, O.; Akramkhanov, A.; Biradar, C.; Lamers, J. Mapping Cropland Abandonment in the Aral Sea Basin with MODIS Time Series. Remote Sens. 2018, 10, 159. [Google Scholar] [CrossRef]
- Yang, H.; Li, X. Cultivated land and food supply in China. Land Use Policy 2000, 17, 73–88. [Google Scholar] [CrossRef]
- Liu, X.; Zhao, C.; Song, W. Review of the evolution of cultivated land protection policies in the period following China’s reform and liberalization. Land Use Policy 2017, 67, 660–669. [Google Scholar] [CrossRef]
- Song, W.; Pijanowski, B.C. The effects of China’s cultivated land balance program on potential land productivity at a national scale. Appl. Geogr. 2014, 46, 158–170. [Google Scholar] [CrossRef]
- Blair, D.; Shackleton, C.; Mograbi, P. Cropland abandonment in South African smallholder communal lands: Land cover change (1950–2010) and farmer perceptions of contributing factors. Land 2018, 7, 121. [Google Scholar] [CrossRef]
- Dong, J.; Liu, J.; Yan, H.; Tao, F.; Kuang, W. Spatio-temporal pattern and rationality of land reclamation and cropland abandonment in mid-eastern Inner Mongolia of China in 1990–2005. Environ. Monit. Assess. 2011, 179, 137–153. [Google Scholar] [CrossRef] [PubMed]
- Geospatial Data Cloud. Available online: http://www.gscloud.cn/ (accessed on 4 March 2019).
- Yan, H.; Liu, F.; Liu, J.; Xiao, X.; Qin, Y. Status of land use intensity in China and its impacts on land carrying capacity. J. Geogr. Sci. 2017, 27, 387–402. [Google Scholar] [CrossRef]
- Resource and Environment Data Cloud Platform. Available online: http://www.resdc.cn/ (accessed on 4 March 2019).
- Nguyen, H.; Hölzel, N.; Völker, A.; Kamp, J. Patterns and Determinants of Post-Soviet Cropland Abandonment in the Western Siberian Grain Belt. Remote Sens. 2018, 10, 1973. [Google Scholar] [CrossRef]
- Romero-Díaz, A.; Ruiz-Sinoga, J.D.; Robledano-Aymerich, F.; Brevik, E.C.; Cerdà, A. Ecosystem responses to land abandonment in Western Mediterranean Mountains. Catena 2017, 149, 824–835. [Google Scholar] [CrossRef] [Green Version]
- Liu, X.; Zhang, W.; Liu, Z.; Qu, F.; Tang, X. Changes in species diversity and above-ground biomass of shrubland over long-term natural restoration process in the Taihang Mountain in North China. Plant Soil Environ. 2011, 57, 505–512. [Google Scholar] [CrossRef] [Green Version]
- Matinfar, H.R.; Roodposhti, M.S. Decision Tree Land Use/Land Cover Change Detection of Khoram Abad City Using Landsat Imagery and Ancillary SRTM Data. Ann. Biol. Res. 2012, 3, 4045–4053. [Google Scholar]
- Breiman, L. Classification and Regression Trees; Routledge: Abingdon, UK, 2017. [Google Scholar]
- Verburg, P.H.; Soepboer, W.; Veldkamp, A.; Limpiada, R.; Espaldon, V.; Mastura, S.S.A. Modeling the spatial dynamics of regional land use: The CLUE-S model. Environ. Manag. 2002, 30, 391–405. [Google Scholar] [CrossRef] [PubMed]
- Veldkamp, A.; Fresco, L.O. CLUE: A conceptual model to study the conversion of land use and its effects. Ecol. Model. 1996, 85, 253–270. [Google Scholar] [CrossRef]
- Britz, W.; Verburg, P.H.; Leip, A. Modelling of land cover and agricultural change in Europe: Combining the CLUE and CAPRI-Spat approaches. Agric. Ecosyst. Environ. 2011, 142, 40–50. [Google Scholar] [CrossRef]
- Wassenaar, T.; Gerber, P.; Verburg, P.H.; Rosales, M.; Ibrahim, M.; Steinfeld, H. Projecting land use changes in the Neotropics: The geography of pasture expansion into forest. Glob. Environ. Chang. 2007, 17, 86–104. [Google Scholar] [CrossRef]
- Verburg, P.H.; Overmars, K.P. Combining top-down and bottom-up dynamics in land use modeling: Exploring the future of abandoned farmlands in Europe with the Dyna-CLUE model. Landsc. Ecol. 2009, 24, 1167. [Google Scholar] [CrossRef]
- Shao, J.A.; Zhang, S.; Li, X. Farmland marginalization in the mountainous areas: Characteristics, influencing factors and policy implications. J. Geogr. Sci. 2015, 25, 701–722. [Google Scholar] [CrossRef]
- Lang, Y.; Song, W.; Deng, X. Projected land use changes impacts on water yields in the karst mountain areas of China. Phys. Chem. Earth Parts A/B/C 2018, 104, 66–75. [Google Scholar] [CrossRef]
- Lawler, J.J.; Lewis, D.J.; Nelson, E.; Plantinga, A.J.; Polasky, S.; Withey, J.C.; Helmers, D.P.; Martinuzzi, S.; Pennington, D.; Radeloff, V.C. Projected land-use change impacts on ecosystem services in the United States. Proc. Natl. Acad. Sci. USA 2014, 11, 7492–7497. [Google Scholar] [CrossRef] [PubMed]
- Yirsaw, E.; Wu, W.; Shi, X.; Temesgen, H.; Bekele, B. Land use/land cover change modeling and the prediction of subsequent changes in ecosystem service values in a coastal area of China, the Su-Xi-Chang Region. Sustainability 2017, 9, 1204. [Google Scholar] [CrossRef]
- Pijanowski, B.C.; Brown, D.G.; Shellito, B.A.; Manik, G.A. Using neural networks and GIS to forecast land use changes: A land transformation model. Comput. Environ. Urban Syst. 2002, 26, 553–575. [Google Scholar] [CrossRef]
- Xiangzheng, D.; Jiyuan, L.; Dafang, Z.; Jinyan, Z.; Tao, Z. Modeling the relationship of land use change and some geophysical indicators for the interlock area of farming and pasturing in China. J. Geogr. Sci. 2002, 12, 397–404. [Google Scholar] [CrossRef]
- Claessens, L.; Schoorl, J.M.; Verburg, P.H.; Geraedts, L.; Veldkamp, A. Modelling interactions and feedback mechanisms between land use change and landscape processes. Agric. Ecosyst. Environ. 2009, 129, 157–170. [Google Scholar] [CrossRef]
- Su, G.; Okahashi, H.; Chen, L. Spatial Pattern of Farmland Abandonment in Japan: Identification and Determinants. Sustainability 2018, 10, 3676. [Google Scholar] [CrossRef]
- Dubovyk, O.; Menz, G.; Conrad, C.; Kan, E.; Machwitz, M.; Khamzina, A. Spatio-temporal analyses of cropland degradation in the irrigated lowlands of Uzbekistan using remote-sensing and logistic regression modeling. Environ. Monit. Assess. 2013, 185, 4775–4790. [Google Scholar] [CrossRef] [PubMed]
- Melendez-Pastor, I.; Hernández, E.I.; Navarro-Pedreño, J.; Gomez, I. Socioeconomic factors influencing land cover changes in rural areas: The case of the Sierra de Albarracín (Spain). Appl. Geogr. 2014, 52, 34–45. [Google Scholar] [CrossRef]
- Kozak, J. Forest cover change in the western Carpathians in the past 180 years: A case study in the Orawa region in Poland. Mt. Res. Dev. 2003, 23, 369–375. [Google Scholar] [CrossRef]
- Hölzel, N.; Haub, C.; Ingelfinger, M.P.; Otte, A.; Pilipenko, V.N. The return of the steppe large-scale restoration of degraded land in southern Russia during the post-Soviet era. J. Nat. Conserv. 2002, 10, 75–85. [Google Scholar] [CrossRef]
- MacDonald, D.; Crabtree, J.R.; Wiesinger, G.; Dax, T.; Stamou, N.; Fleury, P.; Lazpita, J.G.; Gibon, A. Agricultural abandonment in mountain areas of Europe: Environmental consequences and policy response. J. Environ. Manag. 2000, 59, 47–69. [Google Scholar] [CrossRef]
- Li, S.; Li, X. Global understanding of farmland abandonment: A review and prospects. J. Geogr. Sci. 2017, 27, 1123–1150. [Google Scholar] [CrossRef]
- McLauchlan, K.K.; Hobbie, S.E.; Post, W.M. Conversion from agriculture to grassland builds soil organic matter on decadal timescales. Ecol. Appl. 2006, 16, 143–153. [Google Scholar] [CrossRef] [PubMed] [Green Version]
- Wang, Z.-P.; Han, X.-G.; Li, L.-H. Effects of grassland conversion to croplands on soil organic carbon in the temperate Inner Mongolia. J. Environ. Manag. 2008, 86, 529–534. [Google Scholar] [CrossRef] [PubMed]
- Beilin, R.; Lindborg, R.; Stenseke, M.; Pereira, H.M.; Llausàs, A.; Slätmo, E.; Cerqueira, Y.; Navarro, L.; Rodrigues, P.; Reichelt, N. Analysing how drivers of agricultural land abandonment affect biodiversity and cultural landscapes using case studies from Scandinavia, Iberia and Oceania. Land Use Policy 2014, 36, 60–72. [Google Scholar] [CrossRef]
- Zhuang, D.; Jiang, D.; Liu, L.; Huang, Y. Assessment of bioenergy potential on marginal land in China. Renew. Sustain. Energy Rev. 2011, 15, 1050–1056. [Google Scholar] [CrossRef]
- Xue, S.; Lewandowski, I.; Wang, X.; Yi, Z. Assessment of the production potentials of Miscanthus on marginal land in China. Renew. Sustain. Energy Rev. 2016, 54, 932–943. [Google Scholar] [CrossRef]
- Paredes, S.S.; Stritzler, N.P.; Bono, A.; Distel, R.A. Perennial warm-season grass monocultures and mixtures: Biomass production and soil improvement in semiarid and shallow soil conditions. J. Arid Environ. 2018, 154, 82–88. [Google Scholar] [CrossRef]
Figure 1.
Geographical location of Wushan County, China.
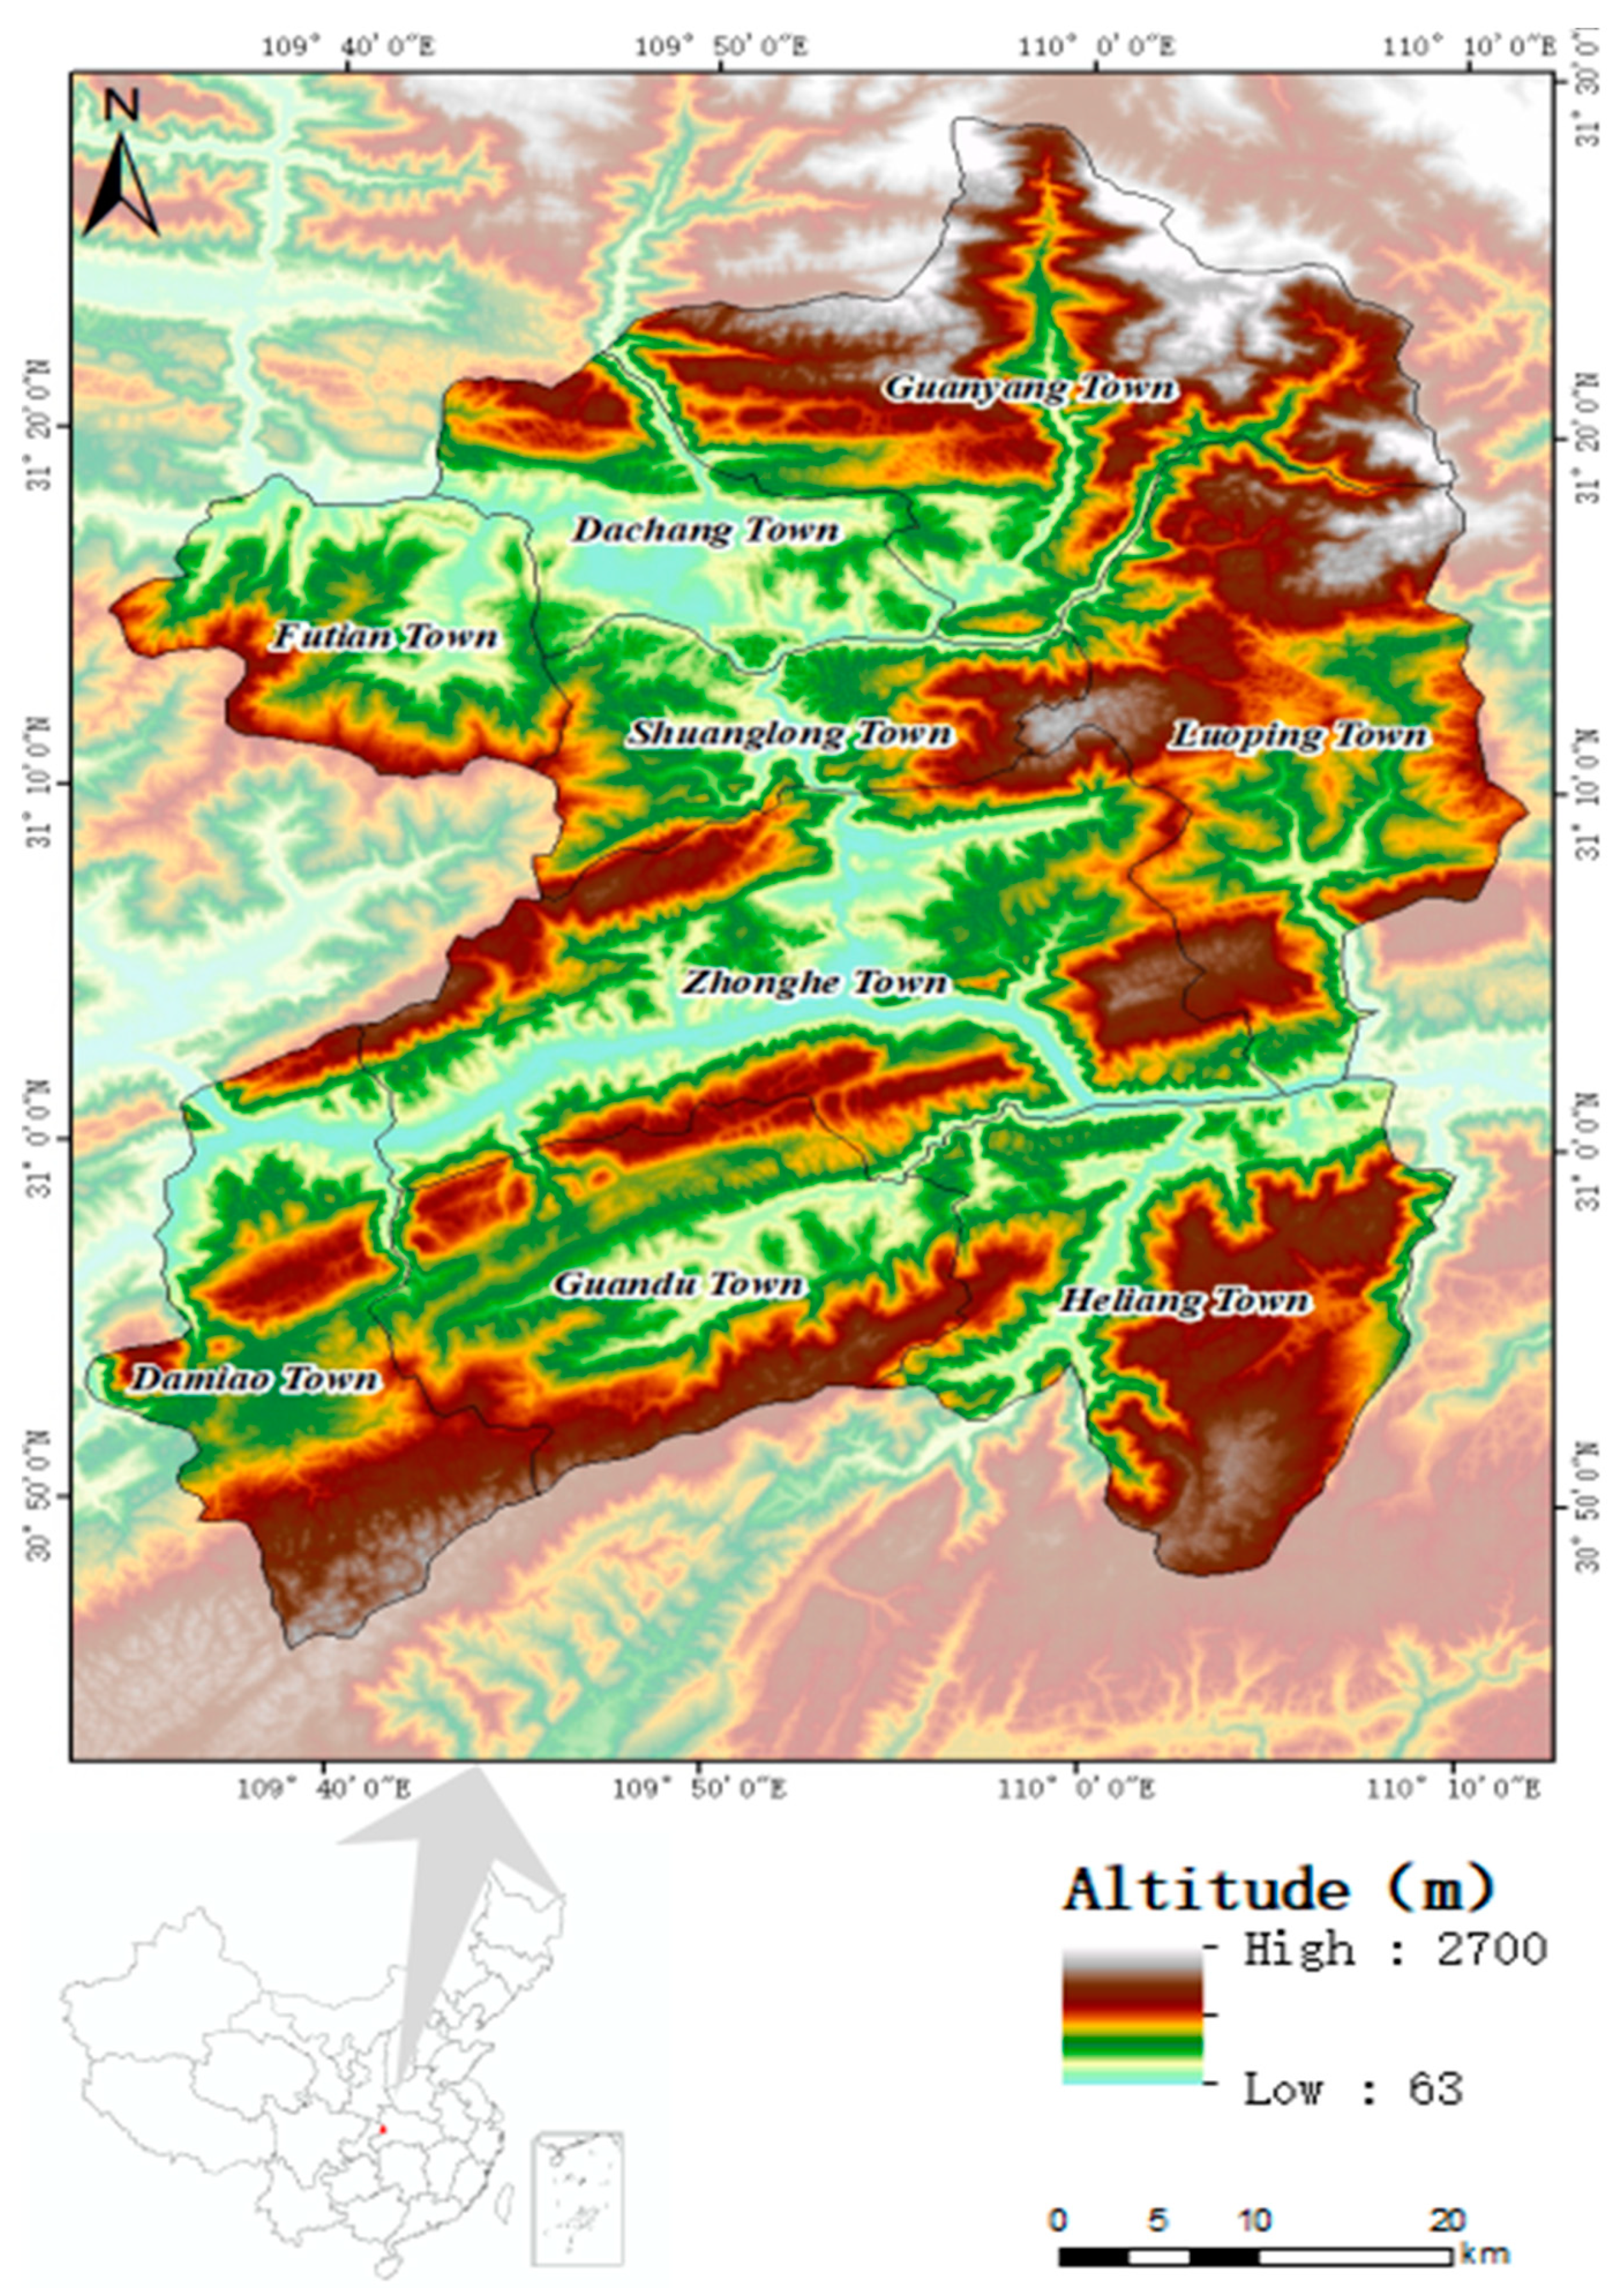
Figure 2.
Description of abandoned cropland data extraction.
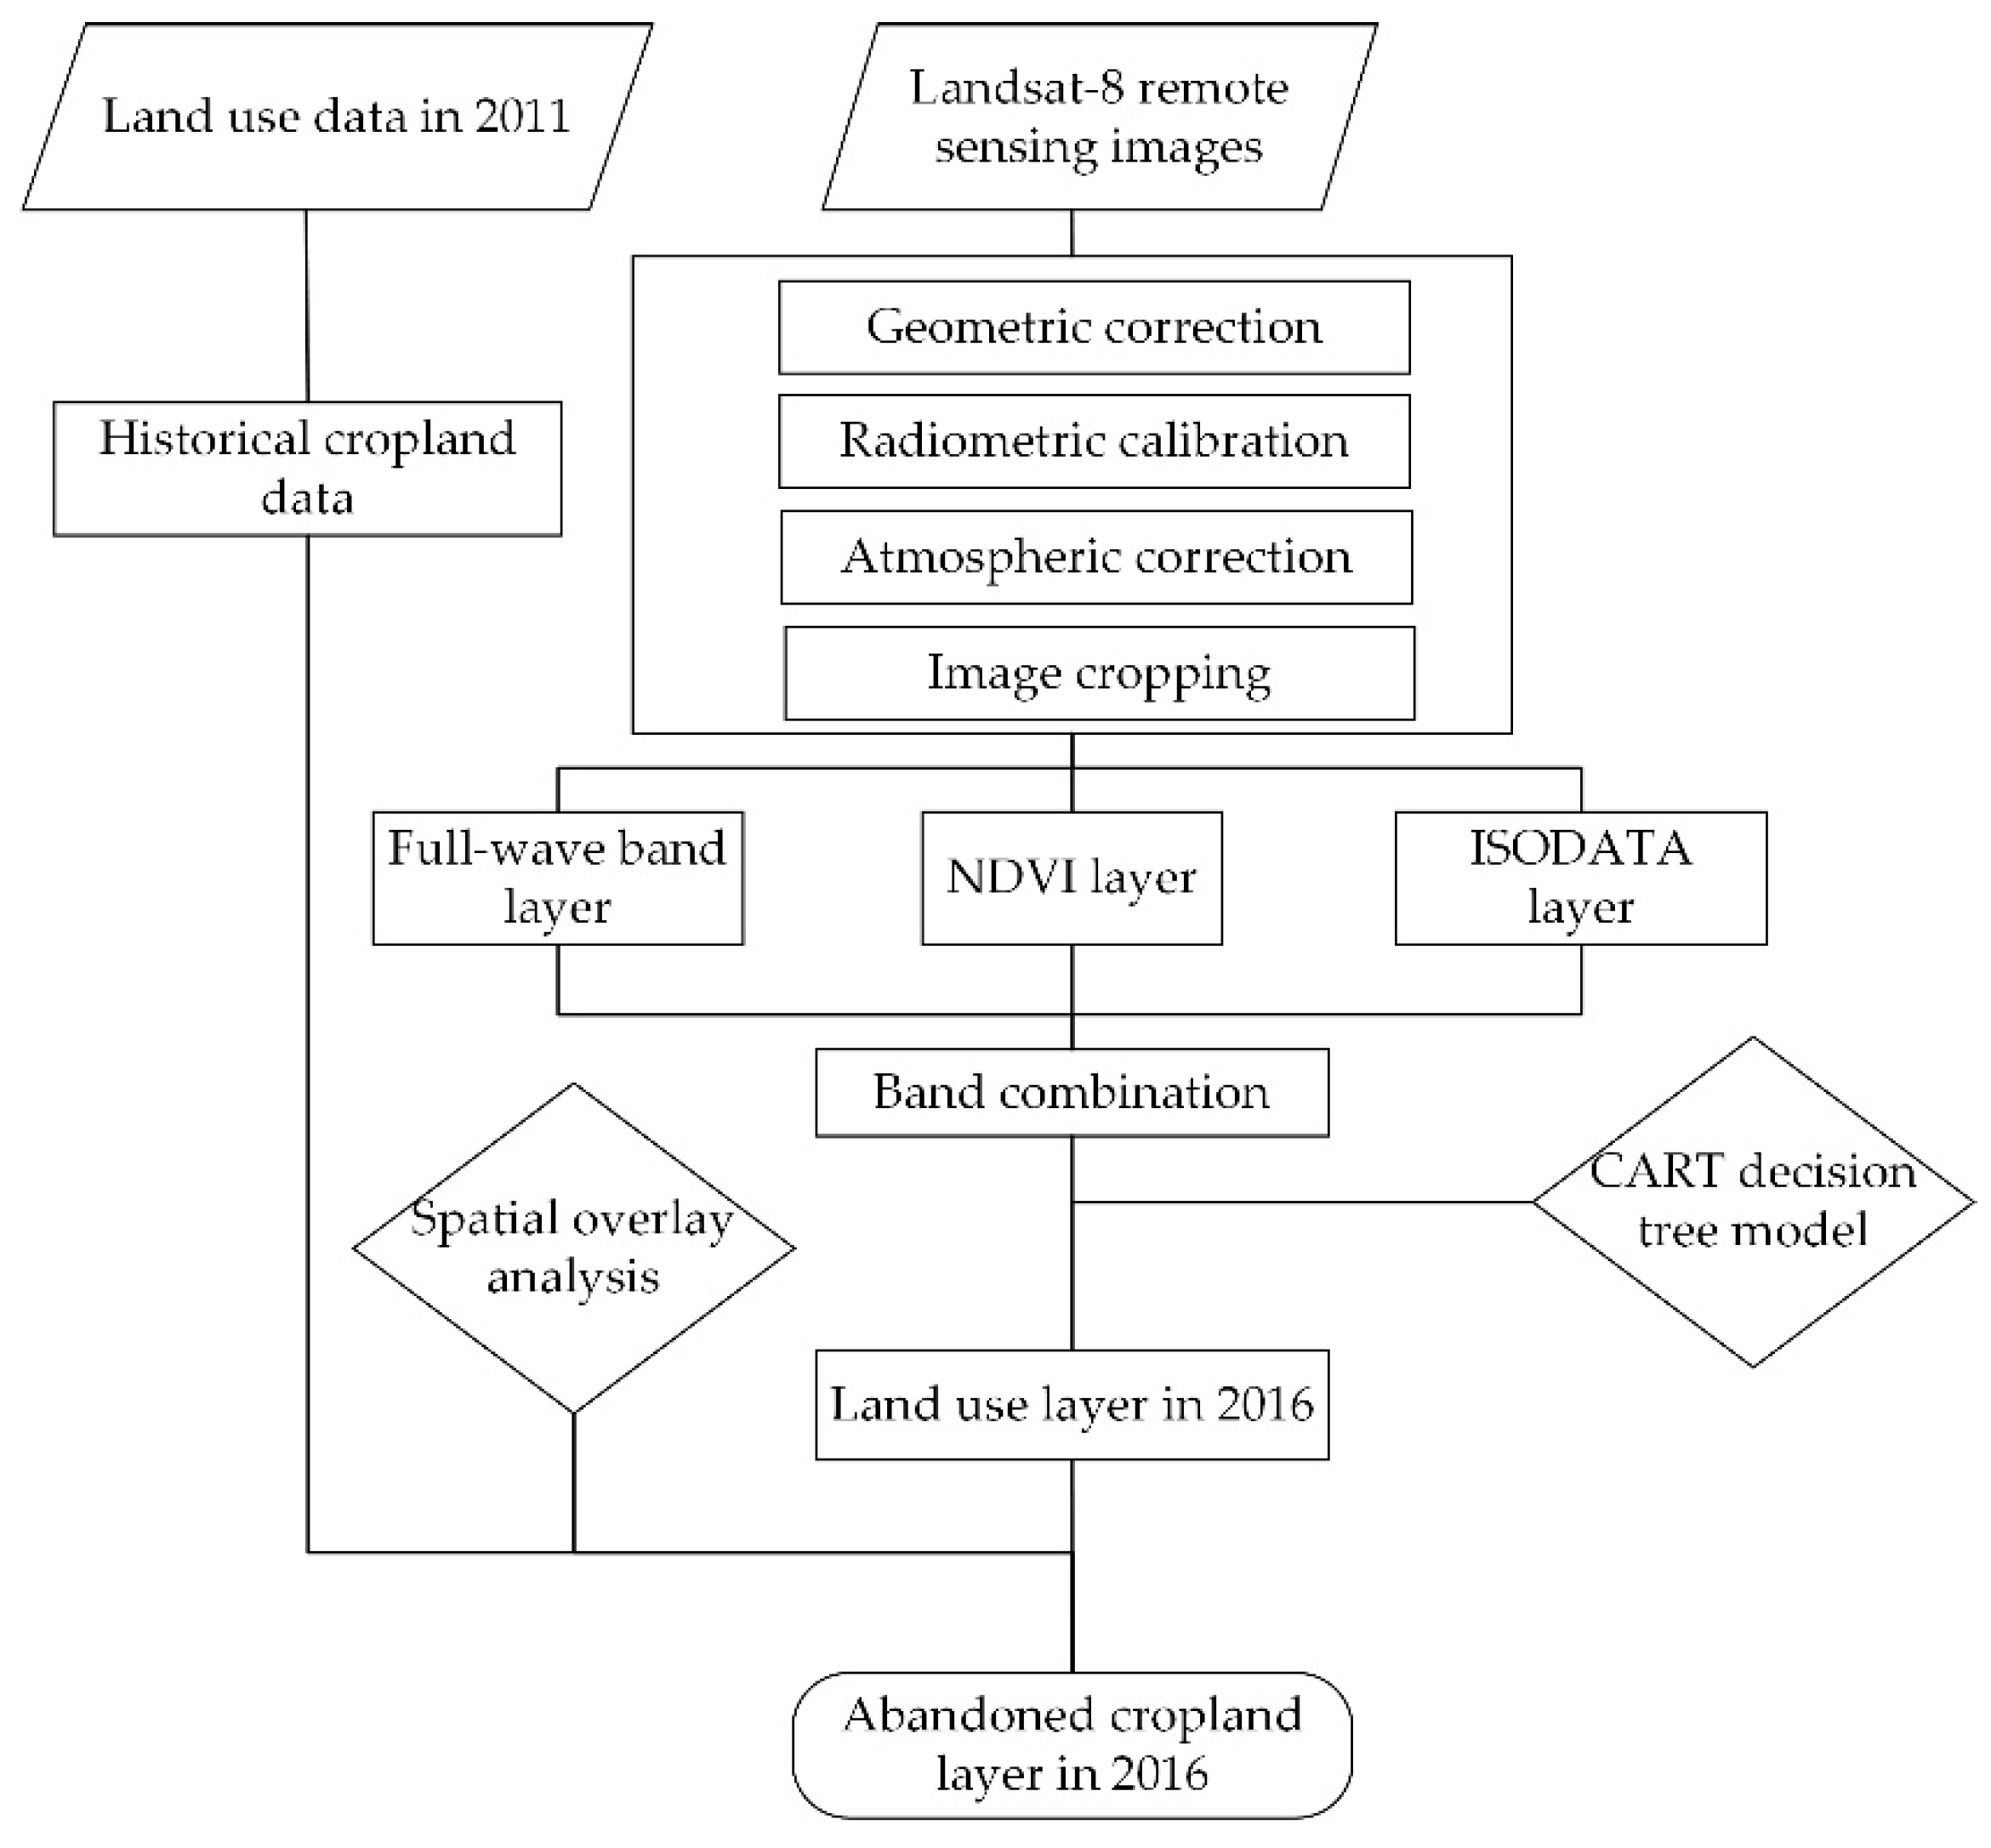
Figure 3.
Driving factors utilized to predict cropland abandonment in Wushan.
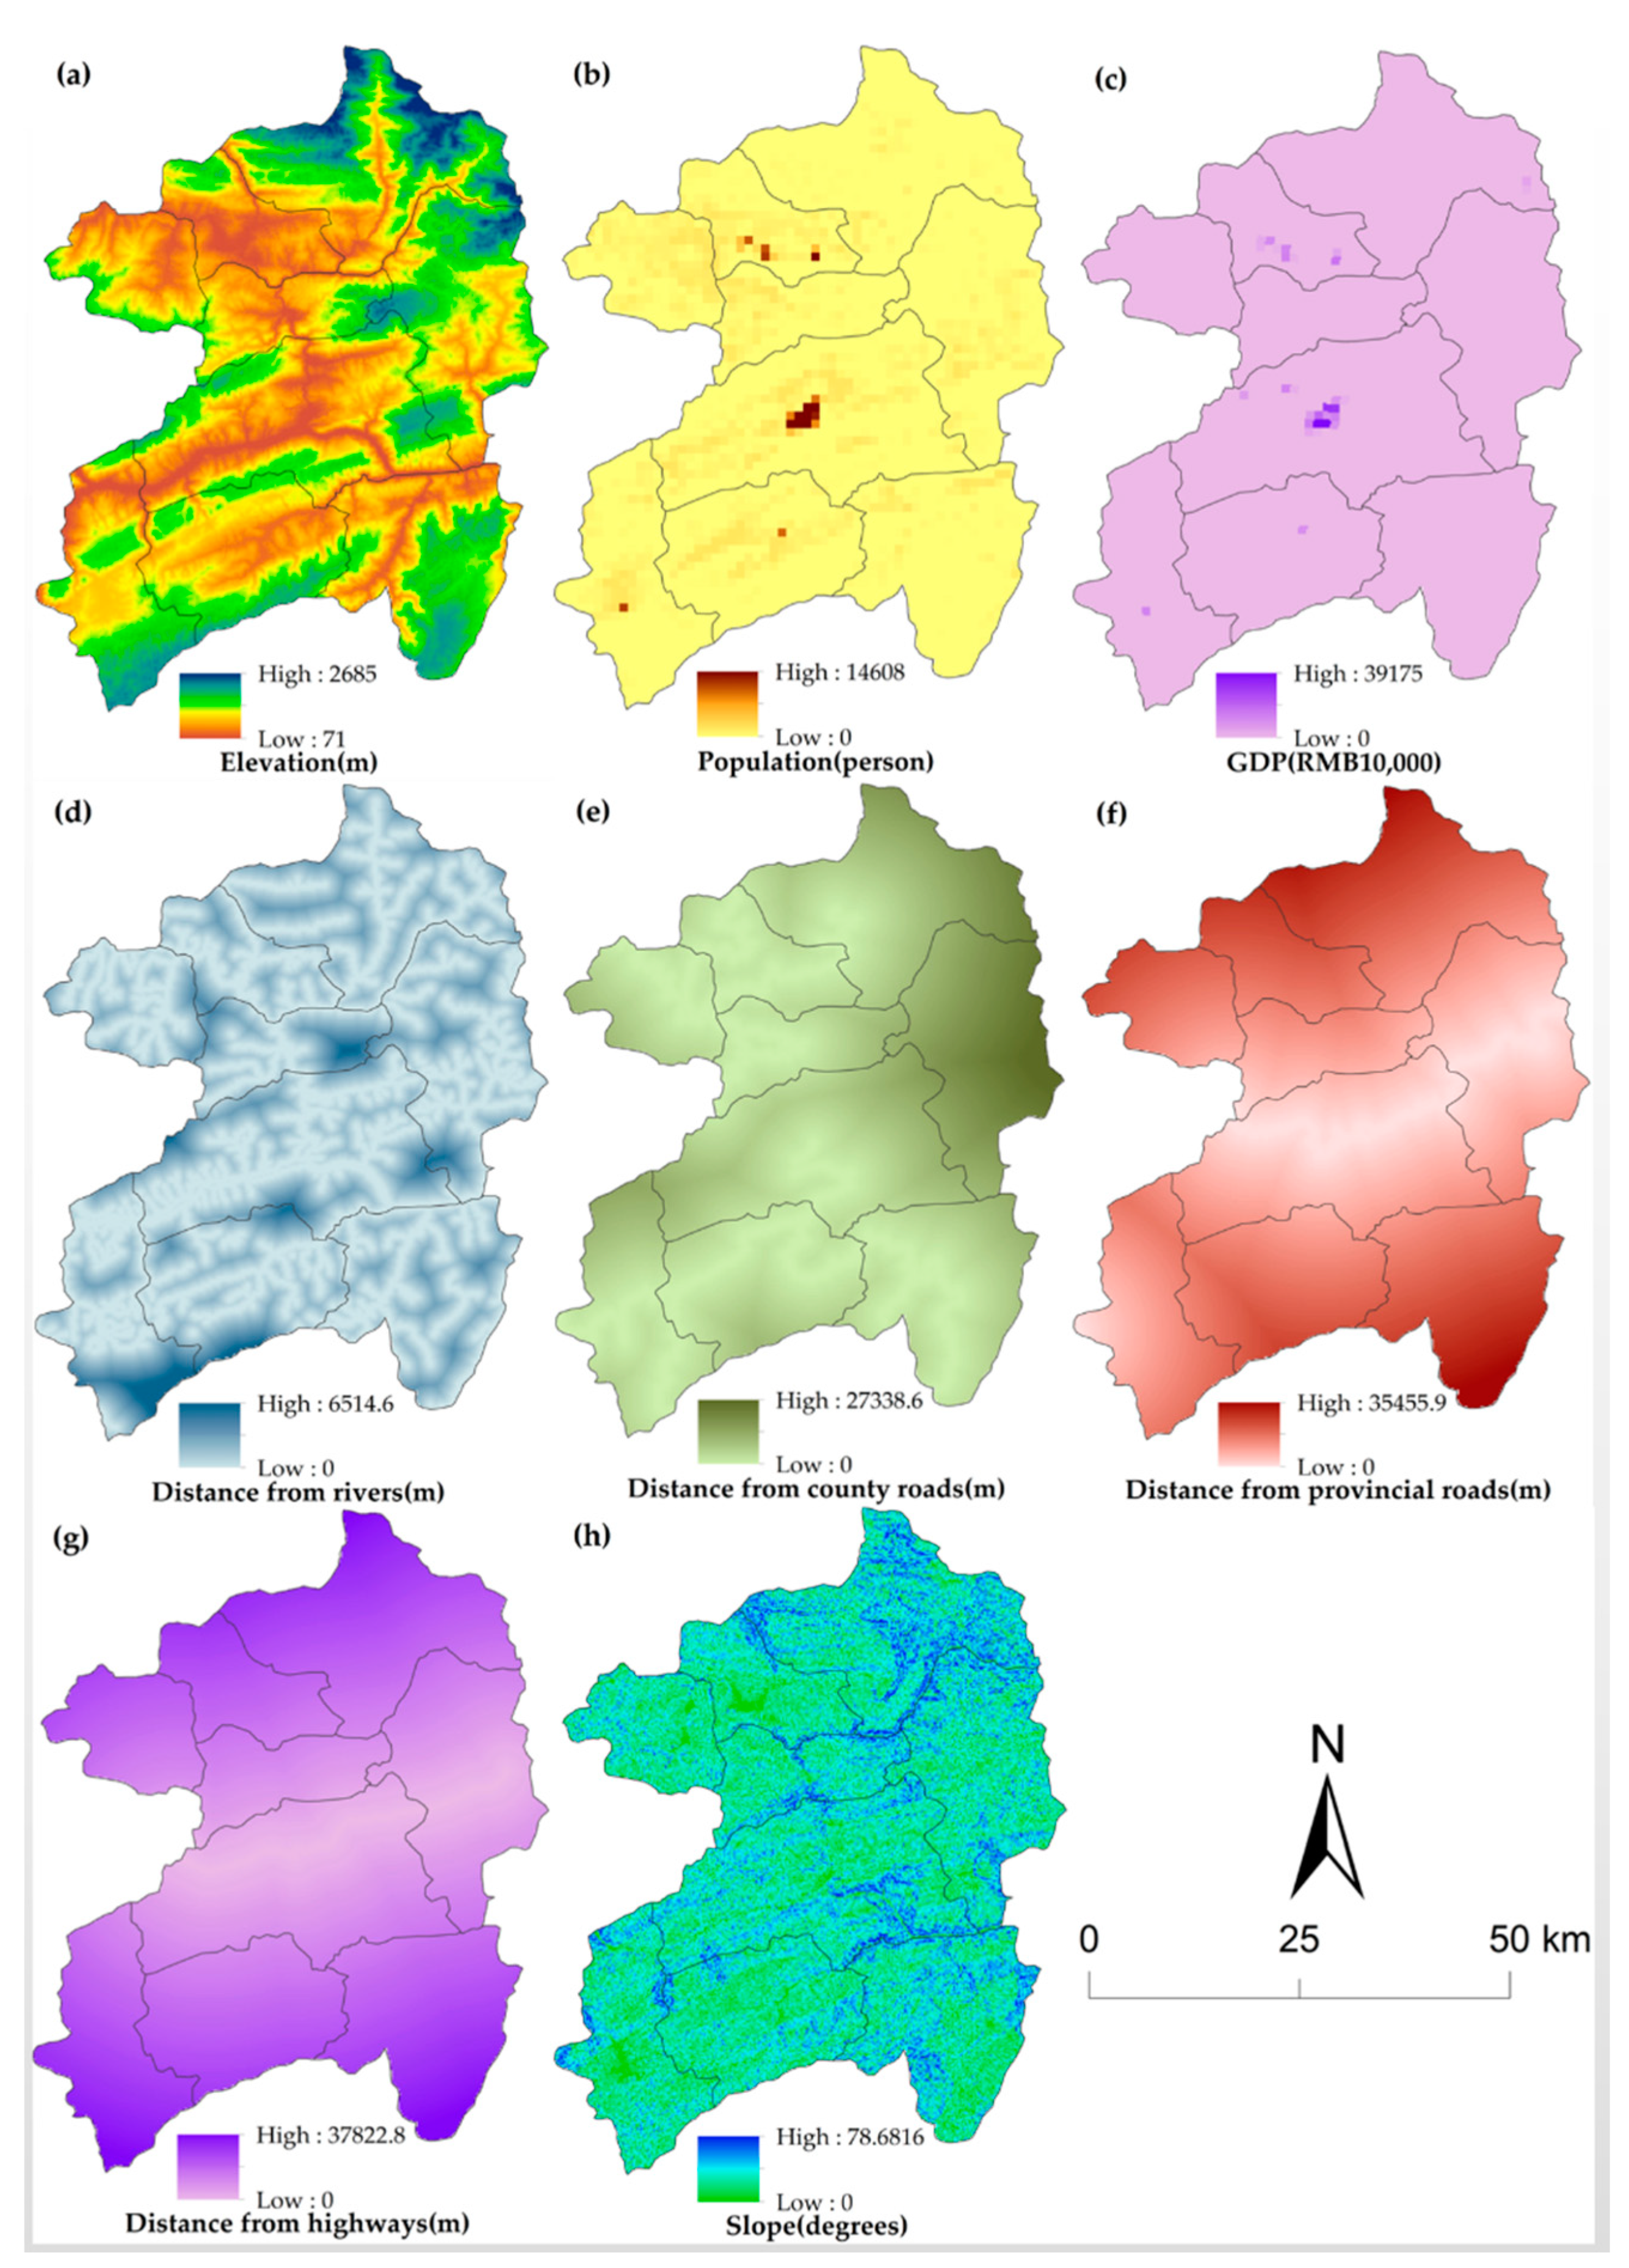
Figure 4.
Land use map of Wushan County for 2016.
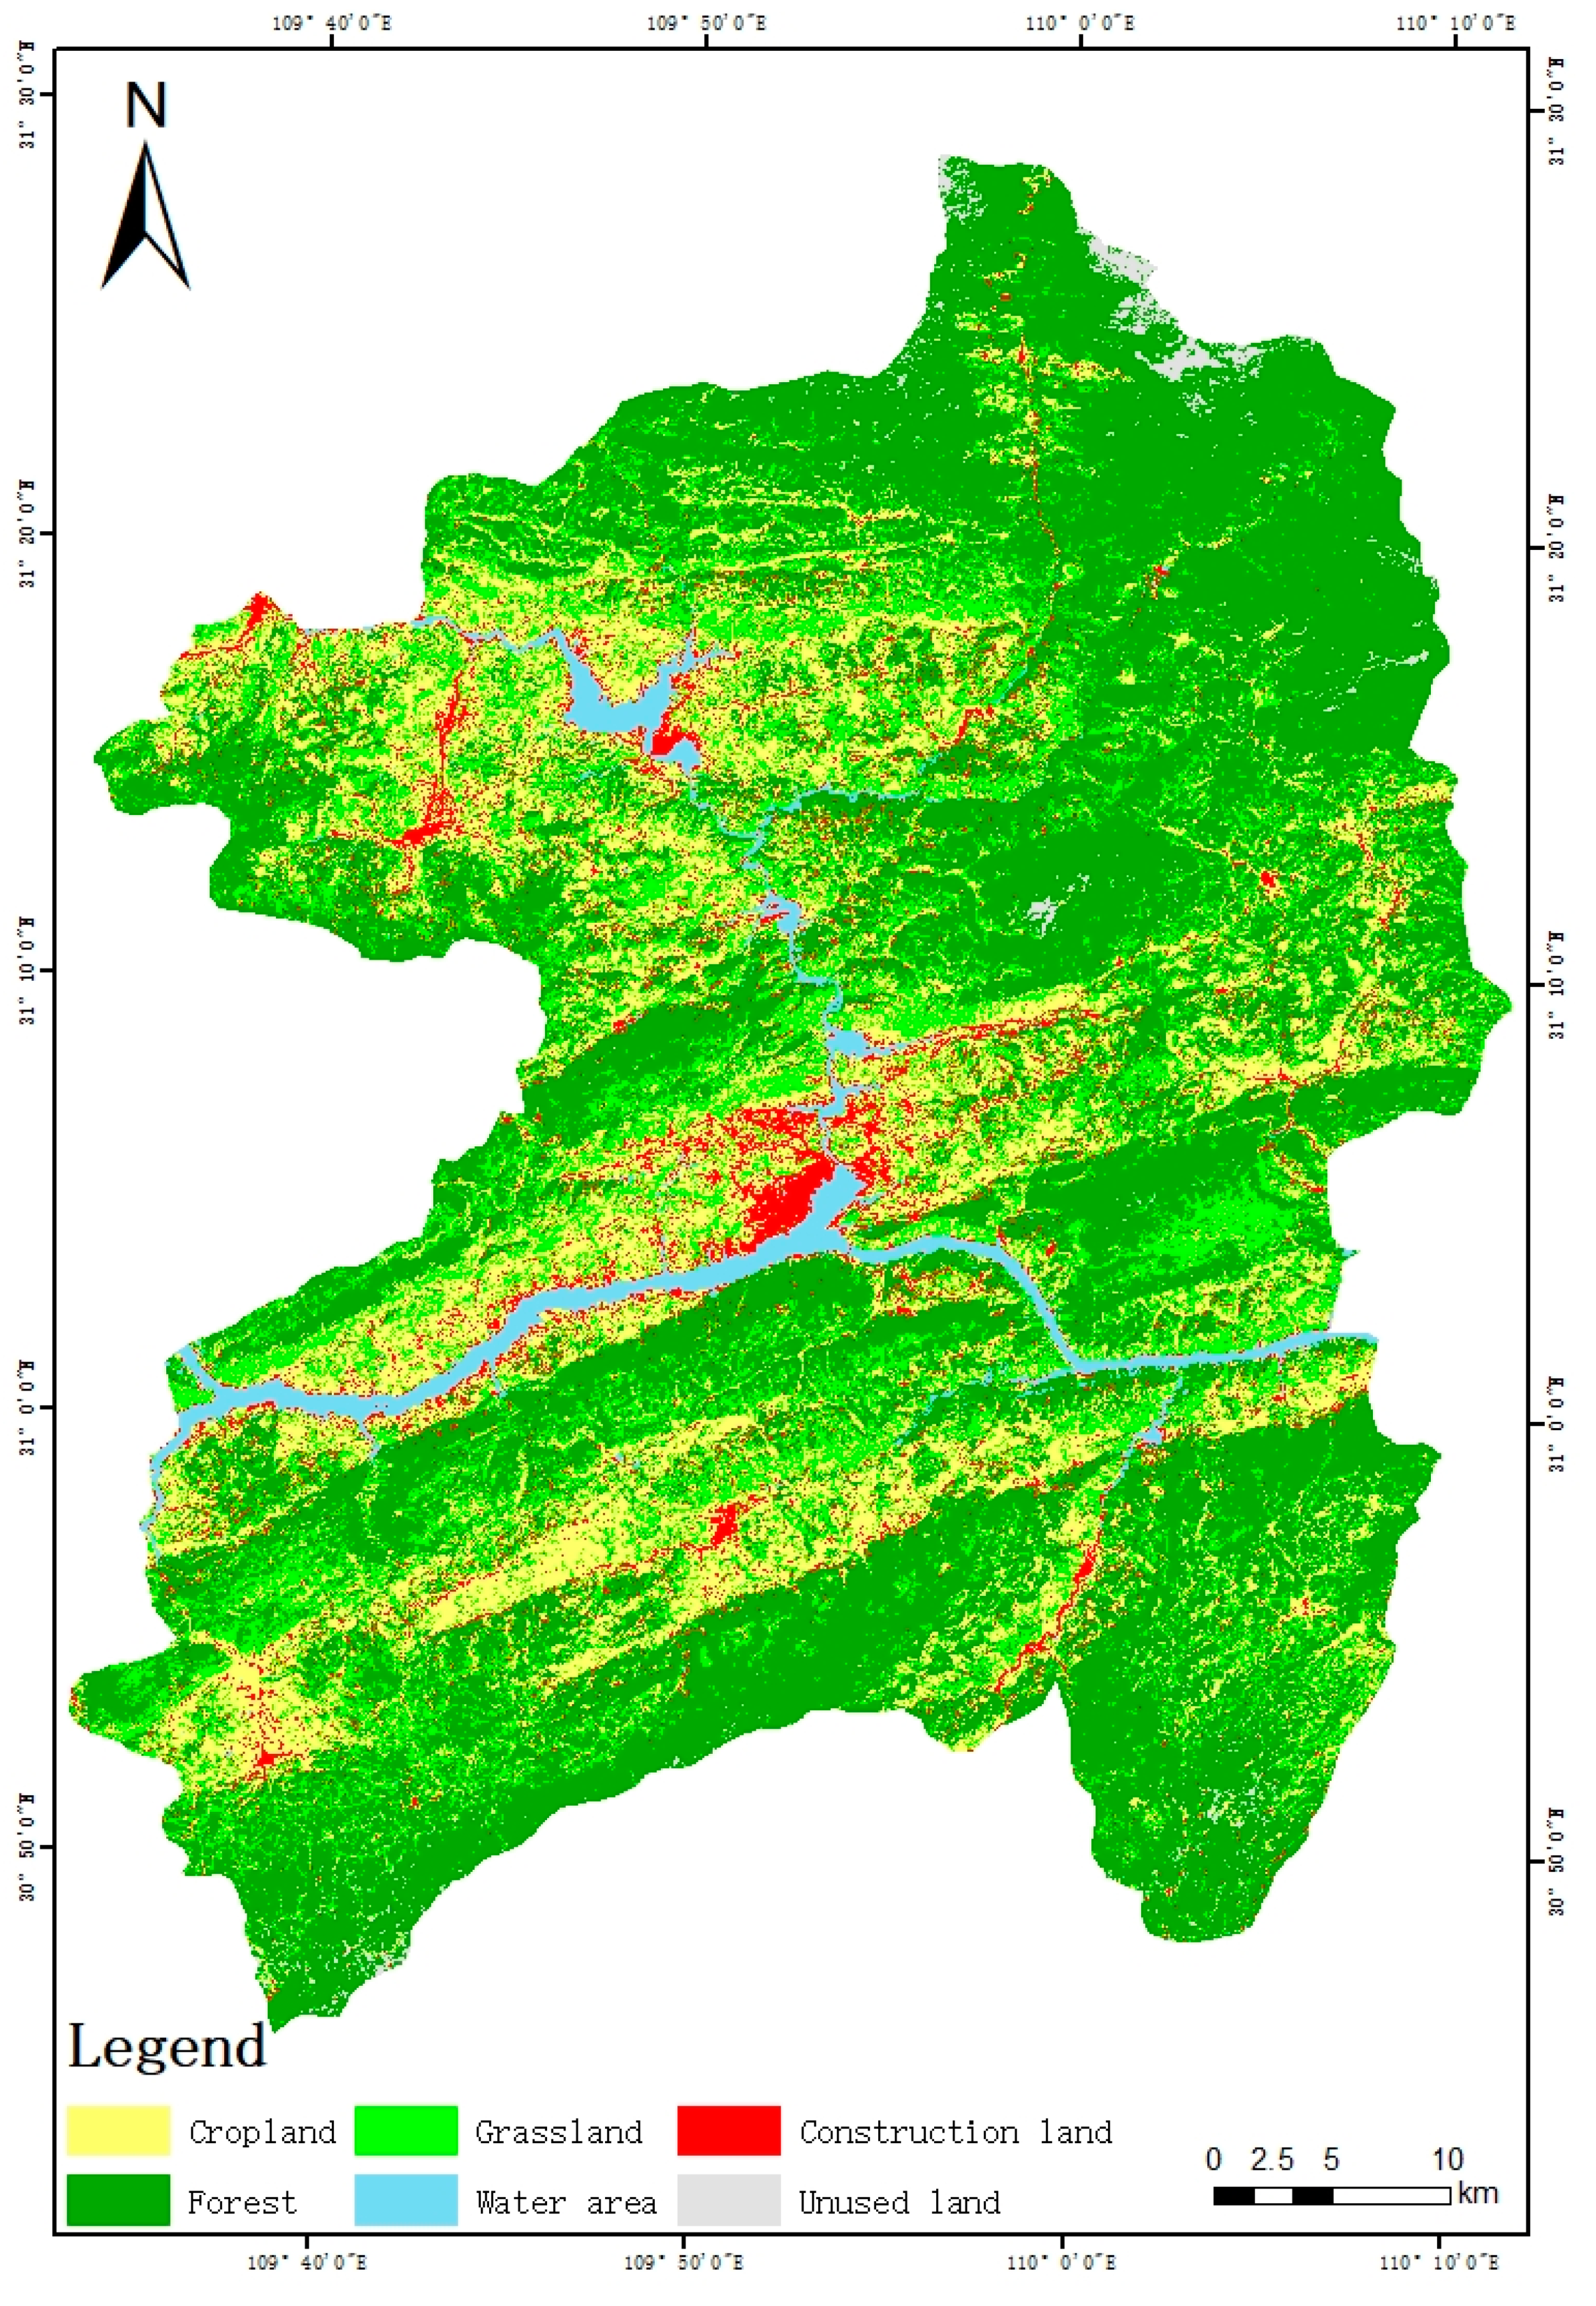
Figure 5.
Spatial distribution of abandoned cropland in Wushan County.

Figure 6.
Relationship between elevation and abandoned cropland in Wushan County.

Figure 7.
Relationship between irrigation distance and abandoned cropland in Wushan County.
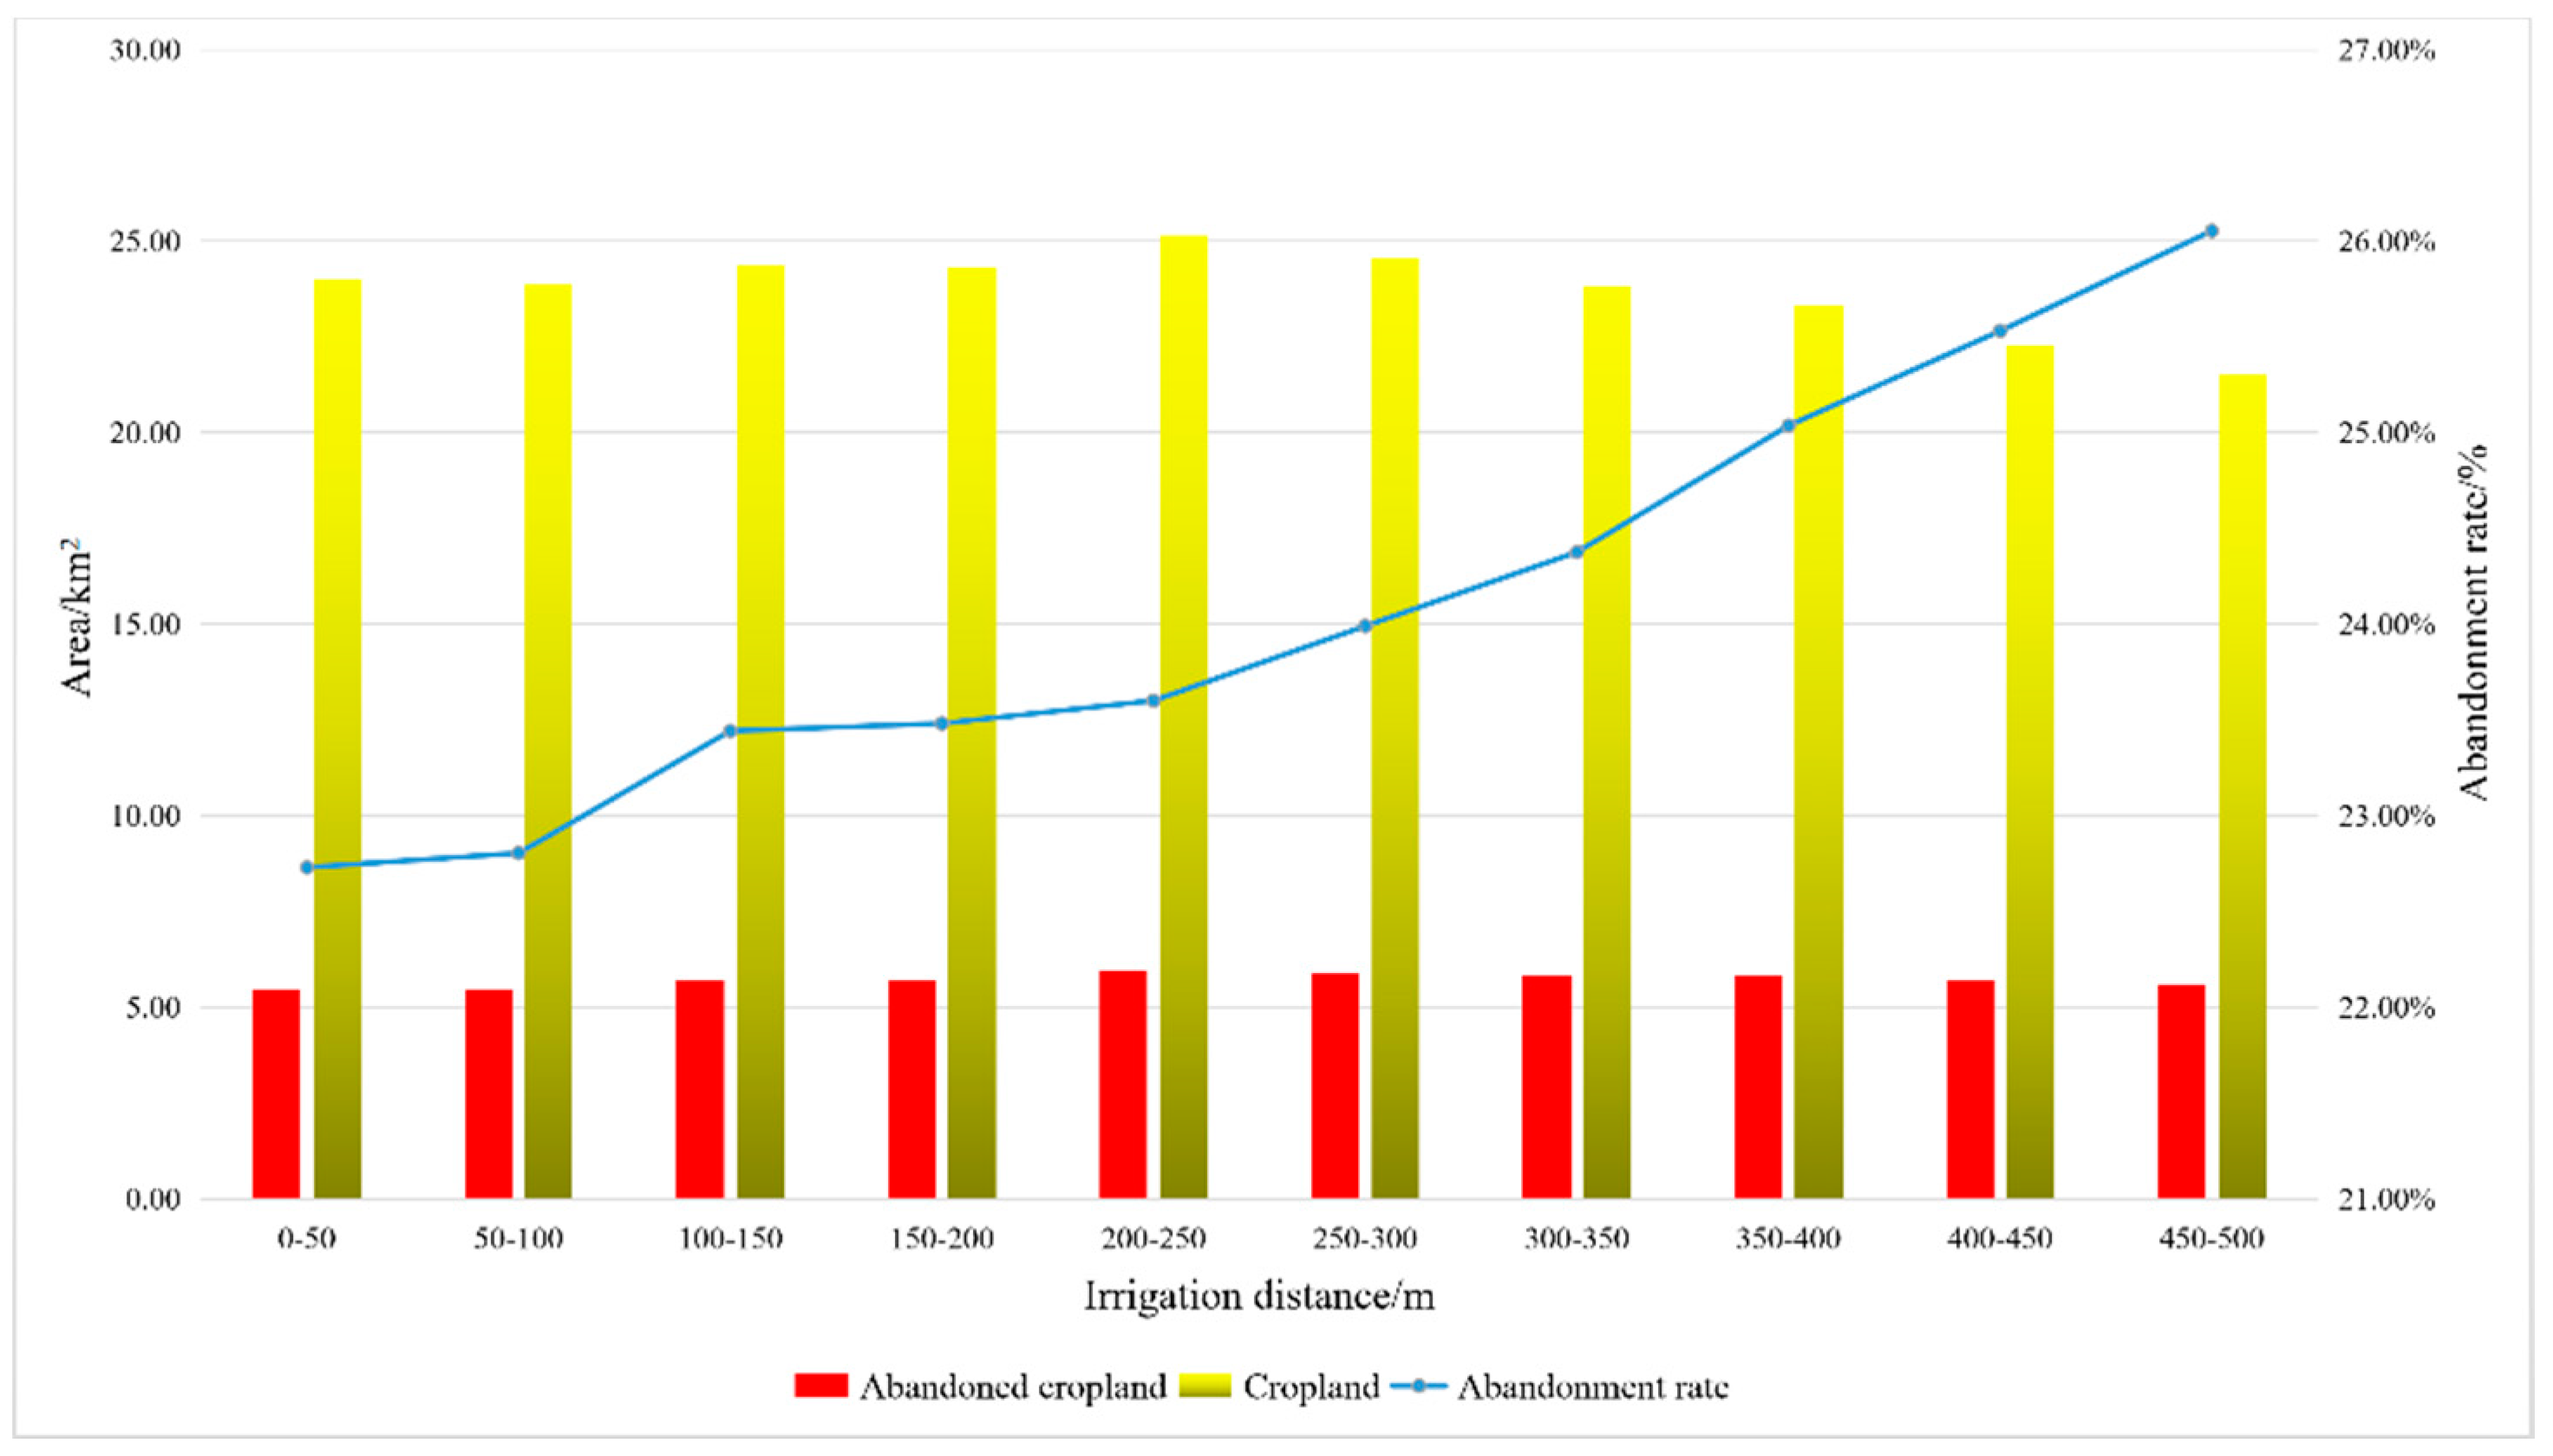
Figure 8.
Relationship between road distance and abandoned cropland in Wushan County.

Figure 9.
Land use change simulation for Wushan County in 2036 under different scenarios. (a) Natural growth scenario, (b) Economic development scenario, and (c) Ecological protection scenario.
Figure 9.
Land use change simulation for Wushan County in 2036 under different scenarios. (a) Natural growth scenario, (b) Economic development scenario, and (c) Ecological protection scenario.


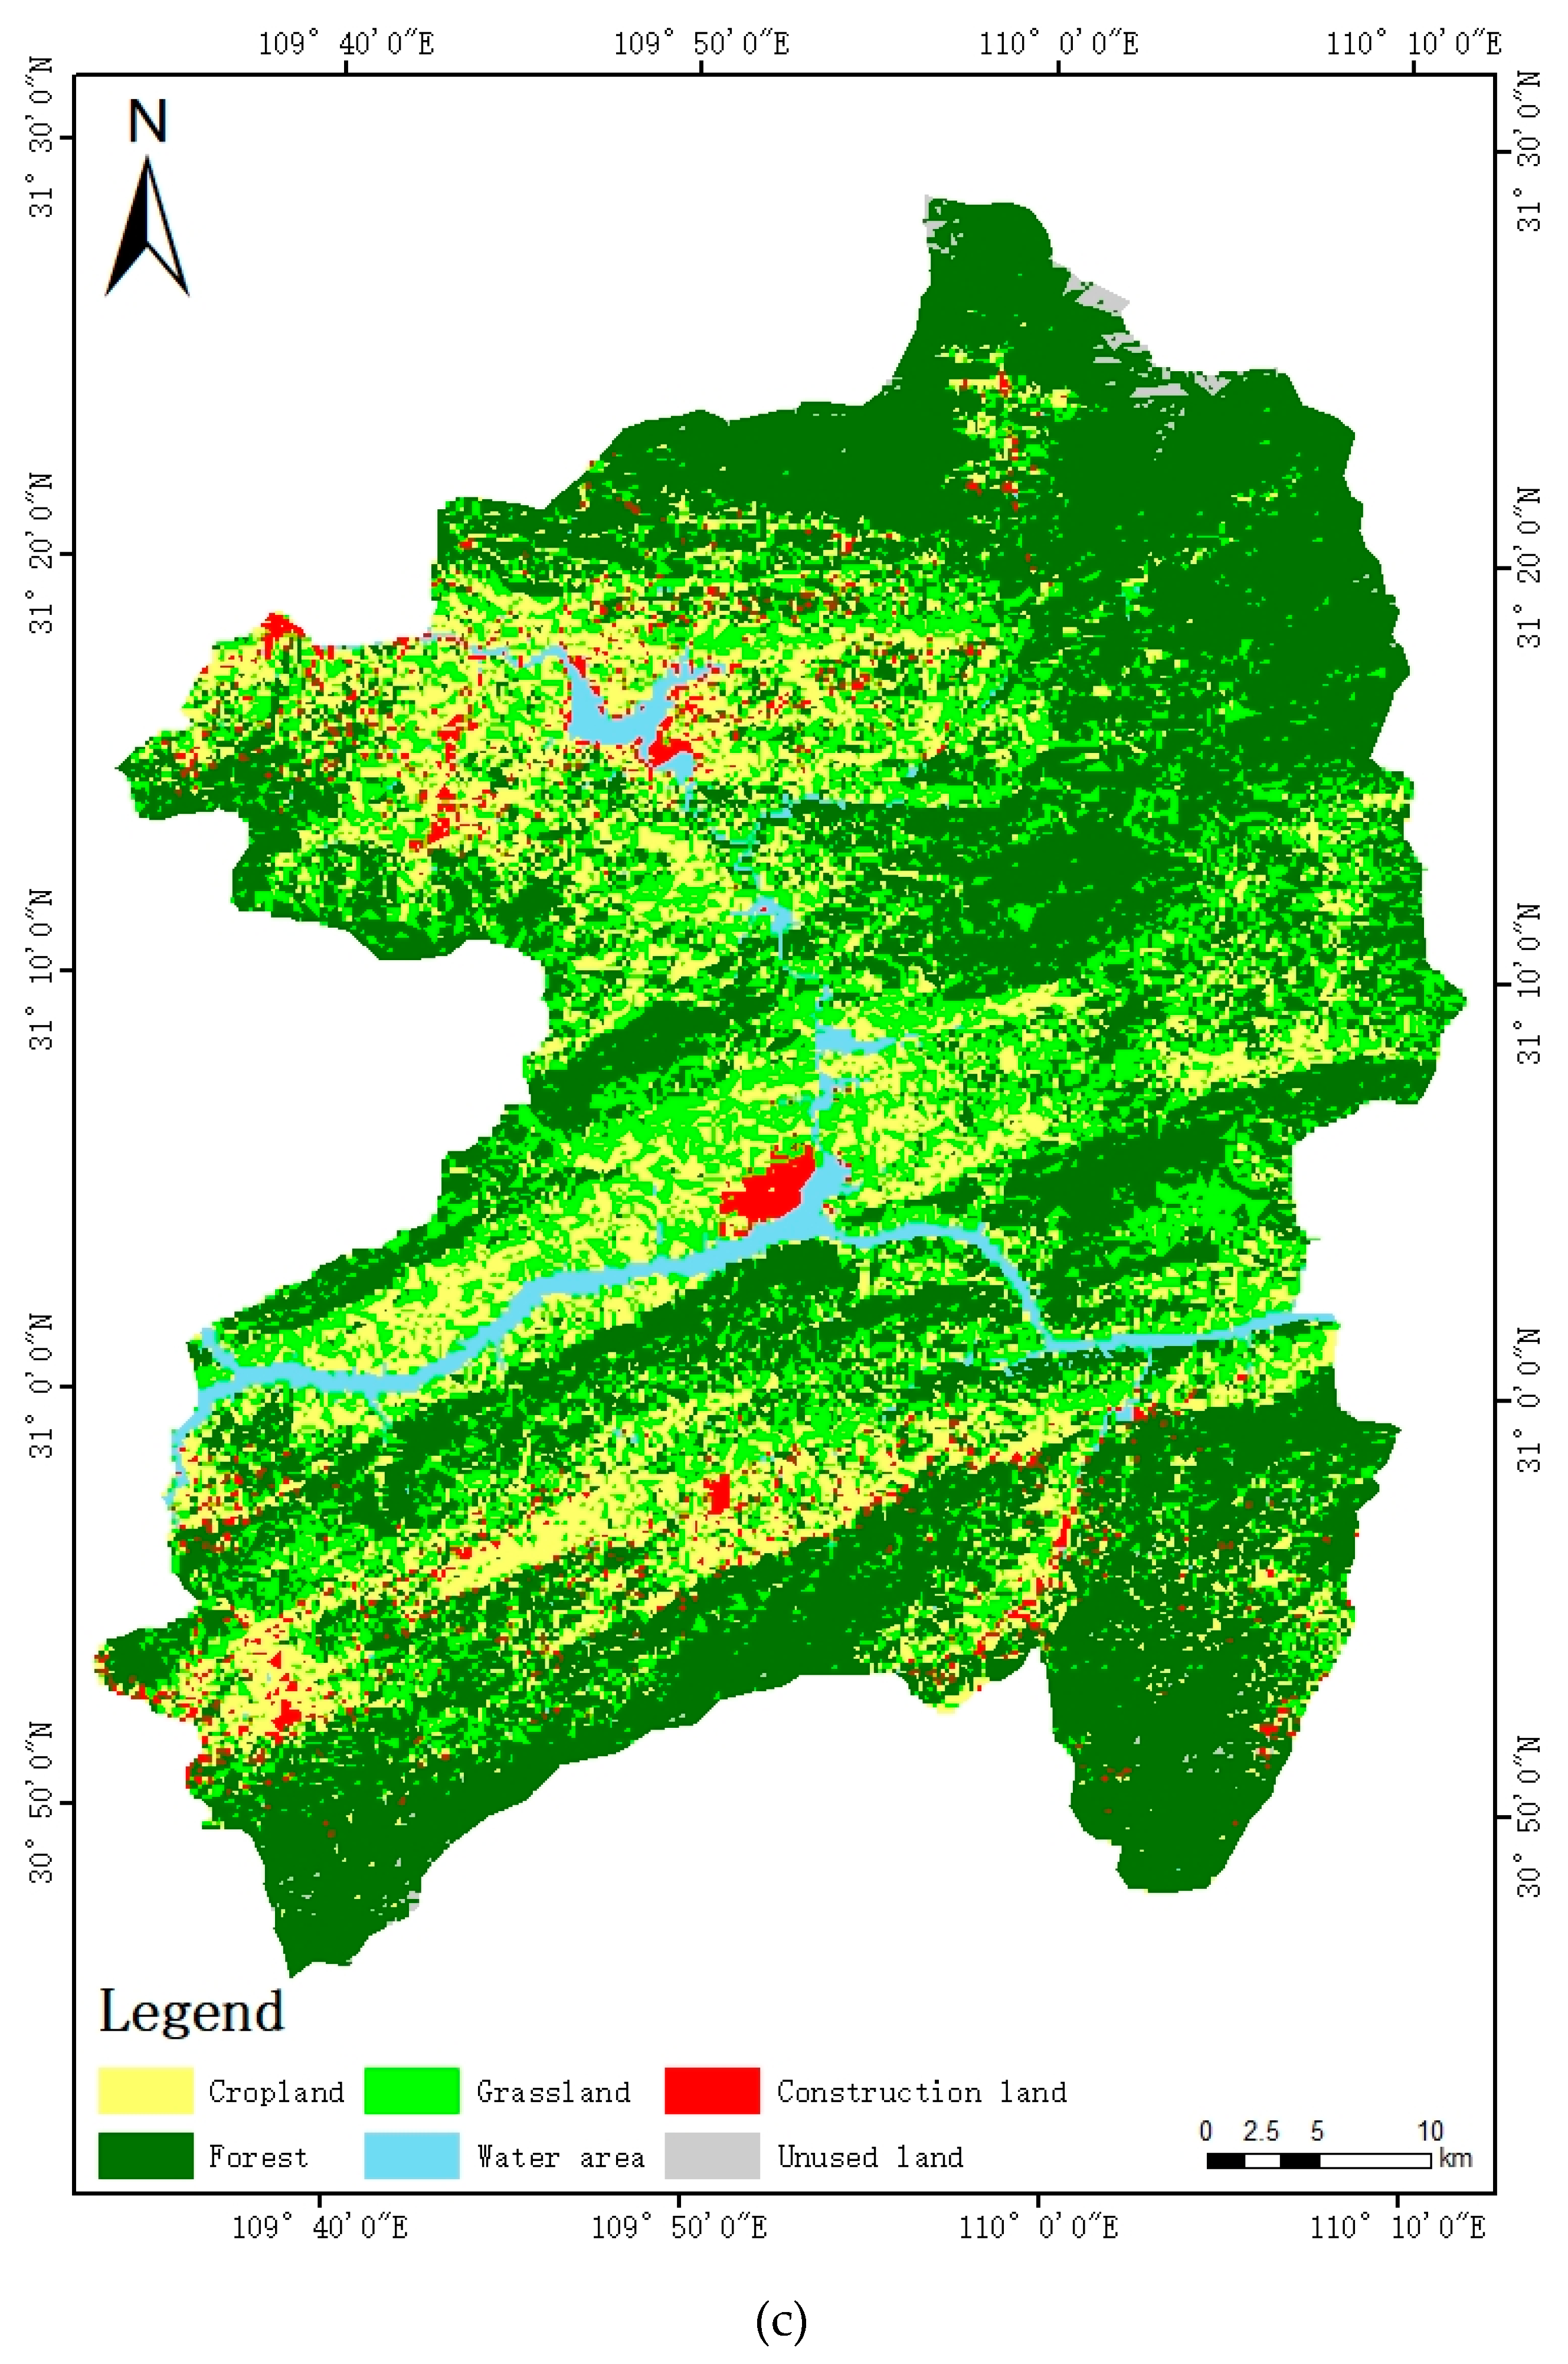
Figure 10.
Simulation of future distribution of abandoned cropland in Wushan County under different scenarios. (a) Natural growth scenario, (b) Economic development scenario, and (c) Ecological protection scenario.
Figure 10.
Simulation of future distribution of abandoned cropland in Wushan County under different scenarios. (a) Natural growth scenario, (b) Economic development scenario, and (c) Ecological protection scenario.


Table 1.
Abandoned cropland at different slope ranges in Wushan County.
| Slope (°) | 0–2 | 2–6 | 6–15 | 15–25 | 25–45 | 45–78 |
|---|---|---|---|---|---|---|
| Abandoned cropland | 0.91 | 6.94 | 47.27 | 72.11 | 46.27 | 1.18 |
| Cropland | 4.02 | 28.08 | 159.90 | 243.22 | 166.47 | 5.13 |
| abandonment rate (%) | 22.74 | 24.71 | 29.56 | 29.65 | 27.79 | 22.96 |
© 2019 by the authors. Licensee MDPI, Basel, Switzerland. This article is an open access article distributed under the terms and conditions of the Creative Commons Attribution (CC BY) license (http://creativecommons.org/licenses/by/4.0/).
Share and Cite
MDPI and ACS Style
Guo, Y.; Song, W. Spatial Distribution and Simulation of Cropland Abandonment in Wushan County, Chongqing, China. Sustainability 2019, 11, 1367. https://doi.org/10.3390/su11051367
AMA Style
Guo Y, Song W. Spatial Distribution and Simulation of Cropland Abandonment in Wushan County, Chongqing, China. Sustainability. 2019; 11(5):1367. https://doi.org/10.3390/su11051367
Chicago/Turabian StyleGuo, Yuchen, and Wei Song. 2019. "Spatial Distribution and Simulation of Cropland Abandonment in Wushan County, Chongqing, China" Sustainability 11, no. 5: 1367. https://doi.org/10.3390/su11051367
Note that from the first issue of 2016, this journal uses article numbers instead of page numbers. See further details here.