Article

Critical Issues at the Upstream Level in Sustainable Supply Chain Management of Agri-Food Industries: Evidence from Pakistan’s Citrus Industry

1
Institute of Agricultural and Resource Economics, University of Agriculture Faisalabad, Punjab 38040, Pakistan
2
College of Economics and Management, Huazhong Agricultural University, No. 1, Shizishan Street, Hongshan District, Wuhan 430070, China
3
Institute of Business Management Sciences, University of Agriculture Faisalabad, Punjab 38040, Pakistan
4
School of Agriculture and Food Sciences, The University of Queensland, Gatton 4343, Australia
5
Department of Economics, University of the Punjab, Lahore 54590, Pakistan
*
Authors to whom correspondence should be addressed.
This research is the outcome of one of the objectives of the first author’s doctoral dissertation.
Sustainability 2019, 11(5), 1326; https://doi.org/10.3390/su11051326
Submission received: 2 February 2019 / Revised: 23 February 2019 / Accepted: 26 February 2019 / Published: 3 March 2019

Abstract

:
Sustainable supply chain management (SSCM) has recently received increasing attention from researchers and the business community. Due to globalization and changing consumption patterns, agri-food industries have undergone a transformation, and the sustainability of agri-food supply chains has also received greater attention. However, the issues of SSCM at the upstream level of the supply chain in agri-food industries have not been adequately empirically studied. This paper aims to list key issues or constraints in the production and marketing through farmers’ group discussions, supplemented by the literature, and empirically identifies key constraints to SSCM of the citrus industry in Pakistan. The paper used cross-sectional data from 300 farmers involved in the production and marketing of citrus in Punjab, Pakistan. Farmers were asked to answer on a Likert scale data about potential constraints identified from the literature and farmers’ group discussions. Kendell’s coefficient of concordance and the mean ranking technique was used to rank and to identify the critical constraints in the production and marketing of citrus. In addition, factor analysis (principal component analysis) was used for the grouping of these constraints. In production constraints, factors, such as fertilizer, pesticide, and seed quality, climate change, high production cost, and agricultural labor performance, are important. These constraints are aligned with some key marketing factors, such as packaging, grading, and storage facilities. The findings convey messages for policymakers to solve these issues and challenges at the upstream level of the SSCM chain in the citrus and related agri-food industries.

1. Introduction

Agri-food supply chains play a pivotal role in providing farmers with access to markets, which affect the social, economic, and environmental sustainability of rural peasants [1]. Farmers, agribusinesses, governments, and civil society must cooperate to promote inclusive and efficient food systems, better integrate small farmers into supply chains and agribusiness, and improve their access to markets. These models can increase the value added by raw materials, thereby boosting local rural economies, food security, and nutrition, and off-farm employment. Small-scale producers provide over 70% of the world’s food needs, and agribusiness is an important source of global employment and income. Improving the sustainability of the agri-food supply chain can benefit hundreds of millions of poor households in developing countries.
In the past few decades, much literature on supply chain management in the manufacturing and service sectors has been produced, but little attention has been paid to the agriculture sector [2]. The agriculture sector contributes a major part of human livelihoods and raw materials to other industries in developing countries, such as Pakistan. Among agricultural products, food items have been least explored in supply chain management [3]. Pakistan relies heavily on agriculture, which accounts for about 19% of the GDP, 43% of the labor force, and about 67% of rural farmers’ livelihoods [4]. Although agriculture is the mainstay of rural farmers in Pakistan, rural poverty is widespread [5].
The main cause of this widespread poverty is the dependence of the country’s agriculture on traditional agricultural production systems. However, due to the recognition of the importance of high-value agriculture (HVA), such as animal husbandry and horticultural products, farmers are now shifting from traditional agriculture to agribusiness [6,7]. Therefore, to improve profitability, SSCM of agri-food is now very important. However, Pakistan’s agricultural performance remains sluggish. The main factors contributing to this slow performance include the slow rate of technological innovation, limited adoption of progressive farming techniques, problems with the quality, quantity, and timeliness of inputs, limited investment in construction and infrastructure maintenance, marketing and trade restrictions, pest and livestock diseases, and limited amounts of credit for agricultural production and processing [4].
The growth of HVA, the development of institutions for vertical integration, and other structural changes in agricultural supply chains present opportunities and challenges for farmers in developing countries. The opportunity for small farmers is to increase their income by participating in the modern supply chains for HVA commodities. The challenge for smallholders is that HVA commodities usually have a high cost of production and there are more risks in production and marketing. To overcome these types of challenges, there should be strong vertical linkages between farmers and other supply chain actors, but in some cases, farmers cannot meet modern food demands [7]. The background and nature of these challenges must be fully understood throughout the production and marketing process of the agri-food industry to develop and implement appropriate solutions for the improvement of SSCM. Therefore, this study aims to identify and analyze key production and marketing constraints in the SSCM of the citrus industry at the upstream level of the chain.
In recent years, production and marketing constraints at the upstream level of agri-food industries have received enormous importance as a way of implementing SSCM practices. However, in the developing country of Pakistan, farmers still face several challenges in sustainable supply chain management practices. There is a need to address these constraints to facilitate widespread and successful SSCM practices. Therefore, the basic aim of this study is to investigate the critical production and marketing constraints of the citrus industry.
Supply chains operating in the Pakistan citrus industry are a typical example. They provides low value to the farmers as well as to the consumers, and the challenges in the SSCM negatively affect the overall performance of the industry, preventing it from reaching its full potential, particularly the meager share of exports to the total mandarin production [8]. At the same time, the development of the horticultural industry is in the government’s priority policy area, and public and private stakeholders are deeply concerned with identifying solutions to resolve emerging challenges for the development of the horticultural industry. To overcome these problems, this study provides guidance on how these challenges and issues should be addressed in a developing country, much less in a single industry, such as Pakistan’s citrus industry.
Citrus is the leading fruit in terms of production in Pakistan, i.e., 2.36 million tons is produced from an area of 206.6 thousand hectares [9]. Pakistan is also the 13th largest producer and 5th largest exporter of citrus in the world [10]. The citrus market in Pakistan is segmented broadly in traditional or informal and modern or formal sectors. The traditional sector includes direct sales as village retailers, sales to intermediaries, and sales at traditional fruit and vegetable markets that exist in almost every city in the country. The modern sector includes the sales to the local processors or juice manufacturing factories, from where it is processed in different juices or exported after waxing and processing by increasing its shelf life. Most of the small village farmers sell their produce through the traditional channel [8,11].
In Pakistan, the fruit-bearing life of citrus orchard trees is 20 to 30 years, which is low compared with other citrus producing countries, where its span goes up to 50 years [12]. The basic factor affecting the citrus supply chain is a lesser use of high-quality citrus production techniques. Farmers do not realize the orchard as an endeavor; rather, they grow citrus as additional crops in the field. So, they are not able to fulfill the demand of the citrus crop at the time of need; they create a huge gap in citrus production as they do intercrop different crops in the citrus orchard, which cause unfavorable losses to the citrus plants and production [12]. Intercropping of valuable crops may increase crop diversification and increase the sustainability of family farms, as crop diversification improves food security and household diets, and reduces market and weather risks, not to mention environmental sustainability [13]. However, this is not the case for Pakistan, as most citrus growers only cultivate forage crops in citrus orchards. Due to the growth of several weeds in the orchard, the cultivation of different forage crops leads to a reduction in citrus production [14]. In addition, the cultivation and harvesting of forage crops can damage citrus fruits. This effect is more pronounced in the fruiting stage of citrus [15].
The citrus supply chain along with other agri-food commodities has become ineffective, resulting in a decrease in net returns with the passage of time [16]. Multiple factors are responsible for this ineffective supply chain, including variant climatic conditions [17,18]. Inadequate technical support, poor availability of improved varieties, outdated irrigation approaches, an infestation of diseases, and abrupt climatic changes are stressors for the supply chain [19]. Poor planning and quality ignorance are additional factors affecting supply [20]. Poor quality assurance followed by the adoption of traditional packaging practices appears inconvenient for higher returns in the international market [6]. This miserable condition is costing a loss of millions to the national economy and the livelihoods of the growers.
In the true sense, effective SSCM of citrus can harness the best outcomes and attract the international market. Quality produce can boost livelihoods and present a significant share in the national economy [21]. Apart from citrus, all HVA commodities are highly competitive in the international market and get high returns. Citrus, in this regard, is special because of the strong comparative advantage in mandarins [6]. Despite being one of the world’s largest exporters of mandarins, entry into high-value markets has been tough thus far, possibly due to quality issues.
Despite the considerable amount of literature on the downstream levels of agri-food industries for SSCM in Pakistan [7,22,23,24], no studies have attempted to empirically identify the constraints of the upstream level for SSCM of agri-food industries, especially citrus. The upstream level of the citrus supply chain is of prime importance for two reasons. First, it includes farmers who are the main actors in the SSCM of the citrus industry. Second, the upstream level also severely affects participants at the downstream level, ultimately affecting citrus exports. Considering the importance of citrus fruit in the national economy and livelihoods, this study was planned to empirically identify the key constraints on the upstream level in SSCM of the citrus industry in Punjab, Pakistan.

Theoretical Background

There are several studies that have emphasized the constraints in the citrus supply chain in Pakistan. These constraints cause enormous post-harvest losses in citrus fruits. For example, Johnson [25] estimated that these losses were about 40% in Pakistani citrus fruit. Some studies have shown that 35% of Pakistan’s total citrus production is lost in the process of supplying fruit from one place to another [12]. The percentage of total post-harvest losses is even higher at the farmer level [26]. These statistics show that agri-food supply chains, such as citrus, are affected by various factors at the upstream level of the chain.
The main actor at the upstream of the supply chain is the farmer, and the associated factors can be aggregated into production and marketing constraints. In the past, SSCM only dealt with the efficient production marketing of the raw material to its final destination [27]. However, today, several other factors are also involved in SSCM, such as climatic factors and quality standards [27,28,29]. In the future, it will become one of the biggest opportunities in the history of economics and commerce [30]. As incomes rise, there will be an increase in the demand for environmental standards and people will become more concerned regarding environmental standards [31].
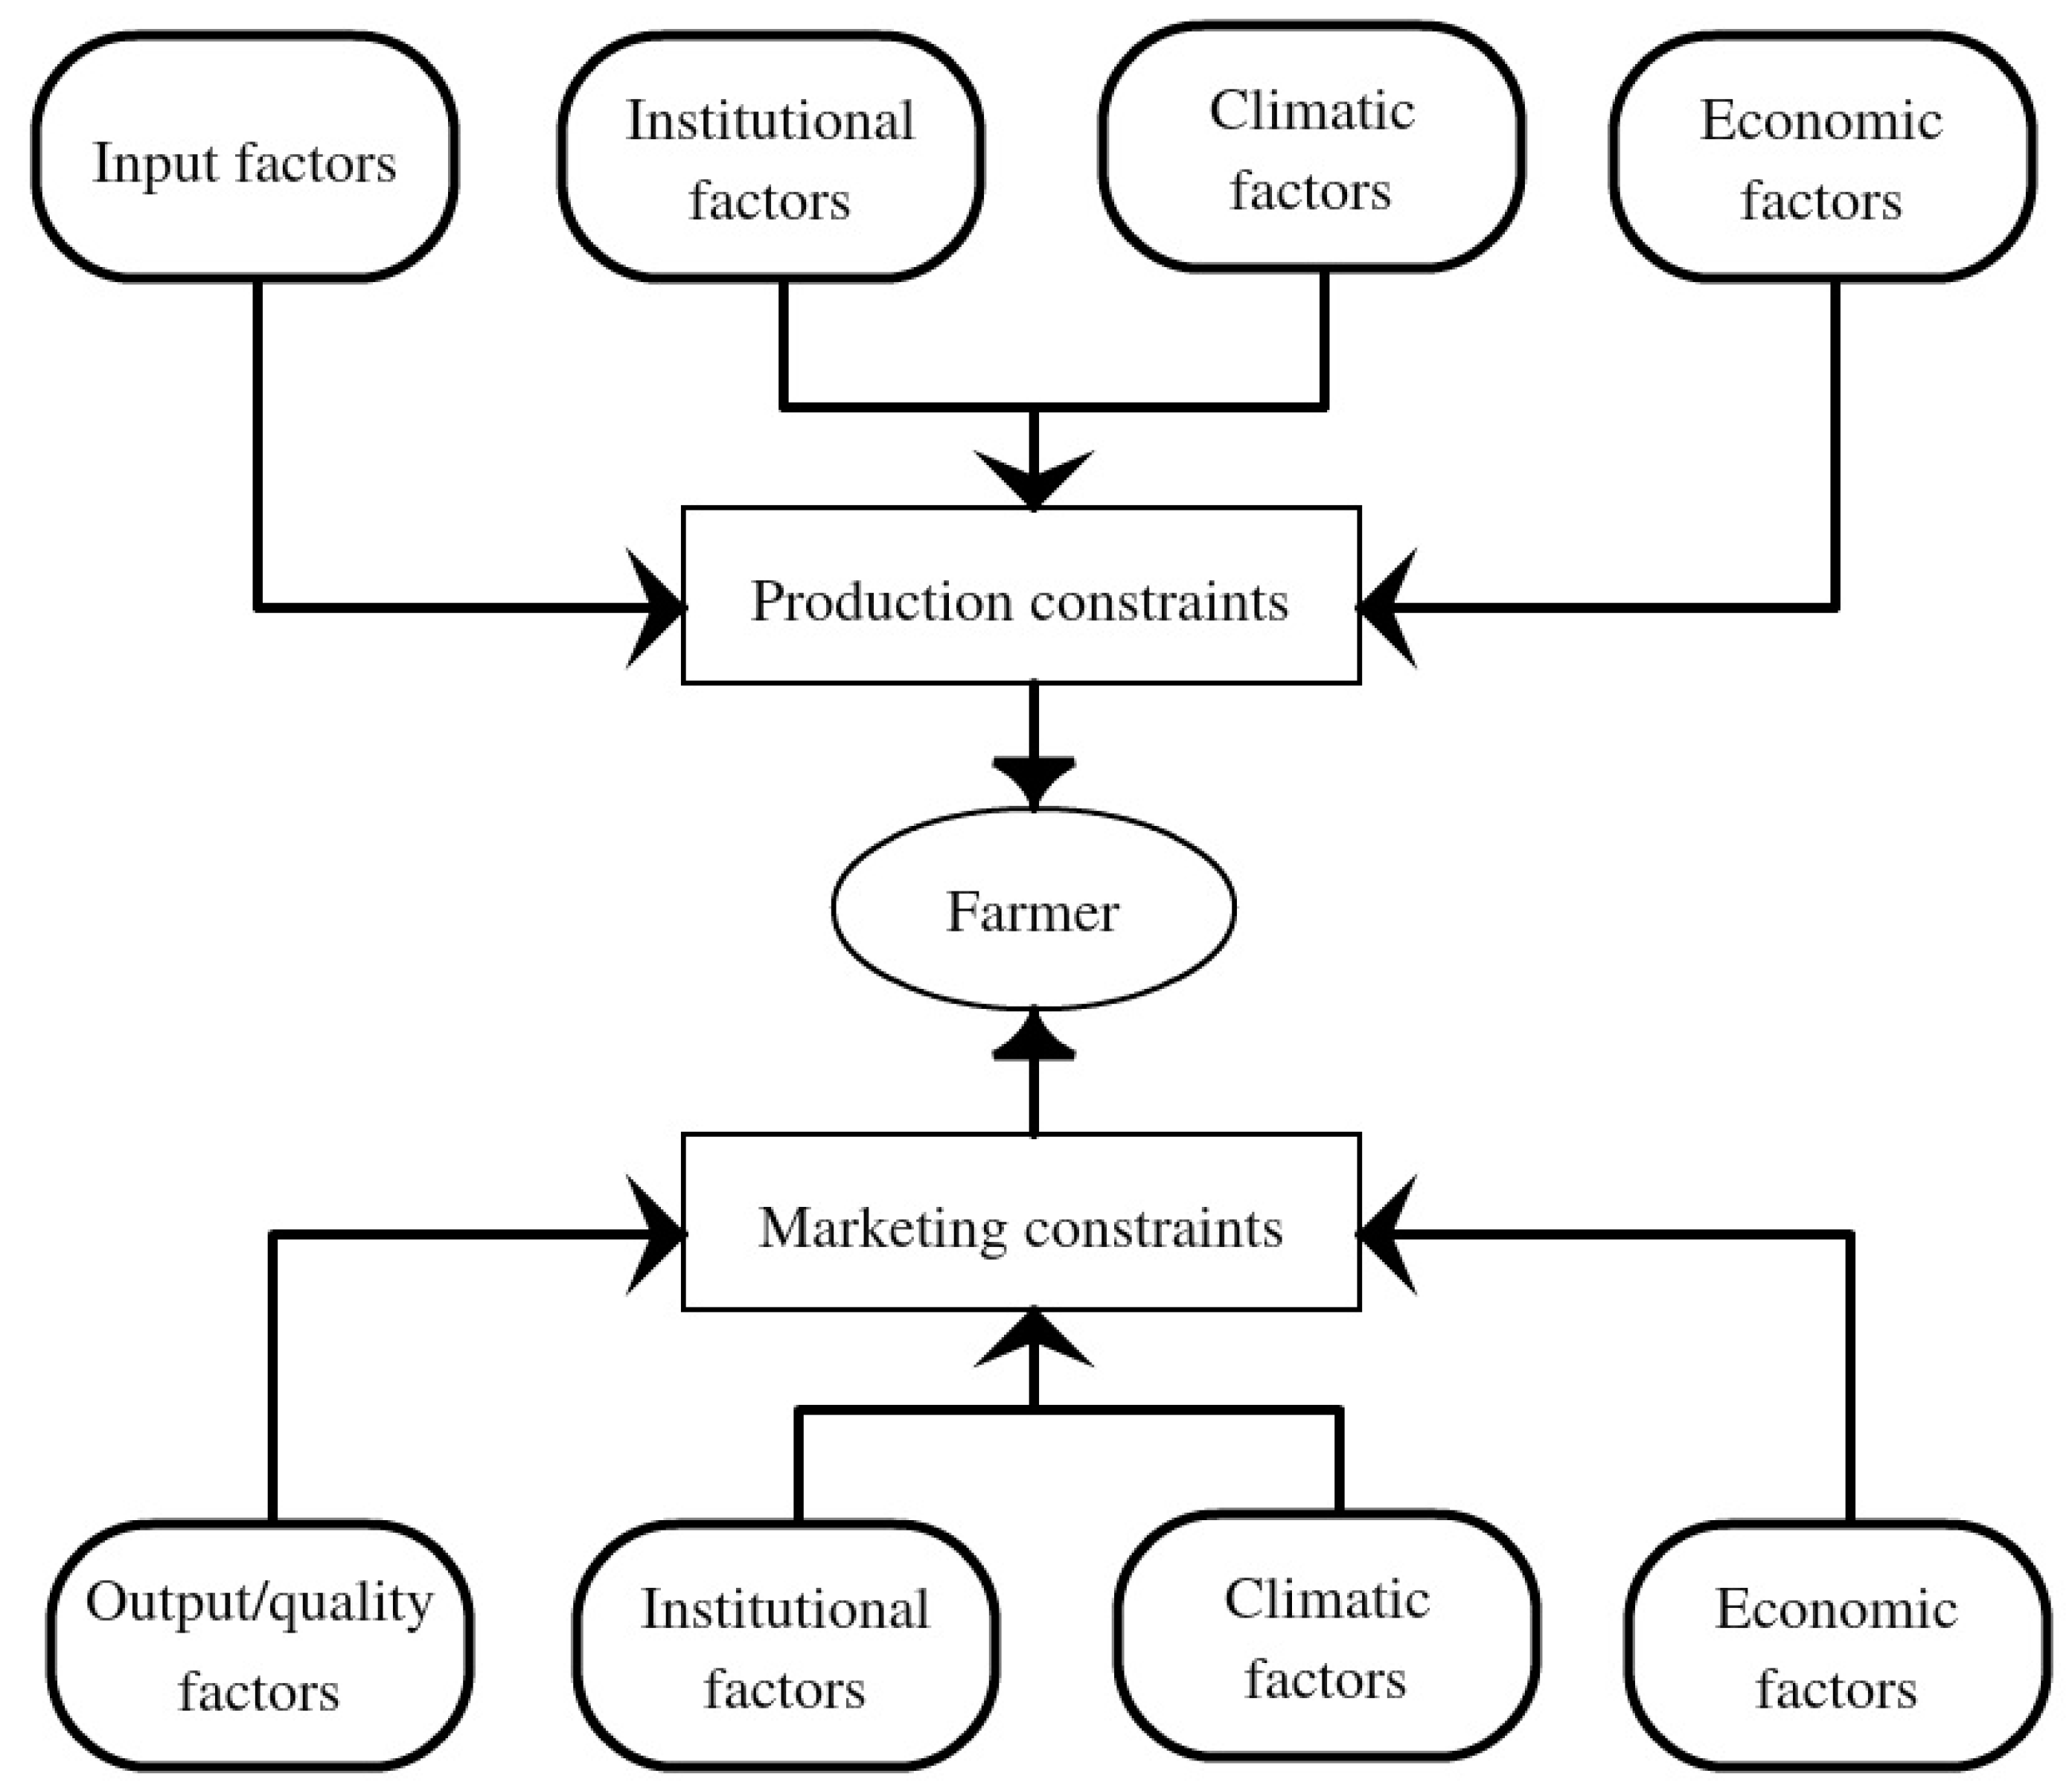
The literature suggests that at the upstream level of the supply chain, farmers are associated with production and marketing related constraints [26,32,33] as shown in Figure 1. On the production side, input related factors include the use of pesticides, fertilizers, irrigation, and seed, and all inputs used in the production of such crops; institutional factors, such as the extension department and the access of credit related institutions; climatic factors, including rainfall patterns, severe temperatures, smog, and humidity, etc.; and economic factors, including farmers’ income related issues. On the marketing side, input factors are replaced by output related factors and all others remain the same. Output related factors include any quality issues of the produce, output packaging, and output grading, etc.

2. Materials and Methods

2.1. Identification of Constraints

For the listing and identification of potential constraints, five farmers’ group discussions (FGDs) were conducted in the study area. A total of 41 farmers participated in these FGDs, of which 6 to 11 farmers participated in the five sessions. To select farmers for the FGDs, a convenience sampling technique was used. It is a non-probability sampling technique and is considered as being suitable for the selection of FGD participants [34,35]. After the productive sessions of these FGDs, 30 potential constraints were listed/identified for this study, as presented in Table 1 and Table 2. After a thorough review of these studies, the 30 constraints that we identified in the FGDs were sub-divided into two distinct categories, i.e., production and marketing constraints. These listed production and marketing constraints were also supported by the literature as they are well documented in previous research (e.g., [11,12,24,33,36]), and therefore are more applicable. For example, inadequate extension and technical information, poor quality of improved nursery plants, irrigation water shortages, infestations of disease, pest attack, and climate change are frequently acknowledged in previous studies affecting supply chain participation by farmers [12]. Thus, the identification of these potential constraints focused on the factors that were reported by the farmers and also have received considerable attention in the literature conducted in Pakistan and other countries in similar contexts. These constraints were presented to the farmers in the actual survey for ranking on a Likert scale ranging from 1 to 5 (strongly disagree to strongly agree). This is the more appropriate methodology, using well-known constraints or factors, for this type of study. It also allows the respondents to respond easily [37].

2.2. Data Collection and Study Area

Following Razzaq et al. [43], a multistage sampling technique for a better representation of the study area was used to select the suitable sample size. In the first stage, the district of Sargodha was purposely selected due to it being the most significant district in terms of production. In the second stage, three Tehsils, i.e., Bhalwal, Kotmomin, and Sargodha, were randomly selected. In the third stage, 10 villages from each tehsil were randomly chosen, and in the final stage, at least 10 respondents from each village were interviewed through a well-structured questionnaire. Thus, the study used a sample size of 300 respondents, including a mix of traditional and modern supply chain participants representing all farm size categories of small, medium, and large farmers. The sample size used for the study is in accordance with the past literature carried out using this type of analysis [7,8,12].
Prior to the data collection, the purpose of the research was described to the respondents, and verbal consent was obtained from all the respondents. Participation in the survey was entirely voluntary. We assured participants of the anonymity and confidentiality of their responses. Data were collected by trained interviewers who were graduate students in agricultural economics.
The study was carried out in the Punjab province of Pakistan, as shown in the study area map in Figure 2. Punjab is the largest province in terms of population and the second largest in terms of area [44,45]. Punjab’s share of the agricultural GDP is also the highest among all other provinces [4]. Mixed farming is often practiced in Punjab as almost every farmer grows crops and raises dairy animals [46,47]. In terms of horticultural crops, Punjab is the largest producer of mandarins, i.e., more than 98% of mandarins are produced in the province [9]. During 2017–2018, the total production of citrus in Punjab was 2.12 million tons, out of which 1.12 million tons, i.e., about 53%, came from the Sargodha district out of the 37 districts of Punjab [48]. Therefore, the district of Sargodha was purposely chosen for this study.

2.3. Data Analysis Technique

The following statistical analysis techniques were used for the constraint analysis.

2.3.1. Reliability of the Data Scale

The reliability of scale is most popularly assessed by the Cronbach alpha method [37]. It determines the mean correlation or the internal consistency among factors in the questionnaire to assess the question’s reliability. The Cronbach alpha coefficient (α) has a value ranging from 0 to 1. It is used to describe the reliability of factors extracted from a dichotomous or Likert scale. The higher the value of α, the more reliable the measurement scale used is [49]. However, according to a general rule, the value of α must not be less than 0.70 to conclude that the scale being used is reliable [50].

2.3.2. Ranking of the Constraints

A nonparametric test commonly used to determine the overall agreement among the set of rankings is Kendall’s coefficient of concordance (Kendall’s W) [51]. This method does not need any specific distribution of the data [52]. We used Kendall’s W test to check whether different respondents within a certain group agreed on the ranking of the constraints. The null hypothesis of Kendall’s W test is that “there is no agreement among the ranking given by the respondents.” Kendall’s W value ranges from 0 to 1, and a value of 0 indicated “no agreement” and 1 indicated “complete agreement.” If the value of Kendall’s W generated from the test has low significance at the given level, then the null hypothesis was rejected and it was concluded that some degree of agreement exists among the respondents [51].

2.3.3. Identification of the Key Constraints

A typical quantitative method, i.e., mean score ranking technique (MSRT), was used in this study to identify and rank the key constraints of the 30 constraints identified in the FDGs. Chan et al. [37] also used the same technique to rank the critical barriers to adopting green building study using a five-point Likert scale. In the MSRT, the highest ranked factor is the most important constraint, and if the two constraints have the same mean score, the constraint with the lowest standard deviation is assigned the highest rank. The normalized value of the mean scores was also calculated to identify the key constraints out of the 30 listed marketing and production constraints faced by the farmers. All the constraints having a normalized value greater than 0.5 are identified as the key constraints [53] using the formula:
N o r m a l i z e d   v a l u e   =   ( m e a n m i n i m u m   v a l u e ) / ( m a x i m u m   v a l u e m e a n )

2.3.4. Grouping of the Constraints

The factor analysis (principal component analysis) was employed to identify the underlying grouped constraints for the development of supply chain management. The purpose of using factor analysis was to identify a relatively small number of constraint (factors) groupings, which were used to denote the relationships among sets of many interrelated constraints [54]. Factor analysis is a data reduction technique and is considered one of the most powerful methods for reducing and regrouping a large number of factors to a smaller and more critical set by factor scores of the farmers’ responses [55]. However, before applying factor analysis, the appropriateness of factor analysis for the factor extraction needs to be examined. Therefore, in this study, the Kaiser-Meyer-Olkin (KMO) measure of sampling adequacy and Bartlett’s test of sphericity were used to determine the appropriateness of the factor analysis. A degree of sampling adequacy that characterizes the ratio of the squared correlation between the variables to the squared partial correlation between the variables is known as Kaiser-Meyer-Olkin (KMO) test [56]. Its value ranges from zero to one. A lower value of KMO indicates that the sum of partial correlations is larger than the sum of correlations. This is an indication of diffusion in the correlations’ pattern, which means the use of factor analysis is inappropriate [54]. Conversely, higher values of KMO indicate that the correlations’ pattern is relatively compact and the use of factor analysis would give reliable results [56]. Several studies reported that the KMO value should be above the acceptable threshold of 0.50 [54,56,57]. However, the level of acceptance of the KMO value varies depending on the KMO value, as shown in Table 3.
The presence of correlations between the variables is highlighted with another statistical test, i.e., Bartlett’s test of sphericity [58]. It is employed to judge whether the original correlation matrix is an identity matrix or not. This is an indication of no relationship between the variables, which means that the use of factor analysis is inappropriate. Conversely, if the value of this test is large, the associated significance level is small. It means that the population correlation matrix is not an identity matrix and the use of factor analysis is appropriate [59].

3. Results

Two main approaches were used for the analysis of farmers’ production and marketing of citrus constraints, i.e., ranking analysis and the factor analysis (principal component analysis). This section presents the constraint analysis results. The section first presents the descriptive results of the respondents’ demographic, socioeconomic, and farmer characteristics. It then presents literature to supplement the selected constraints reported by other researchers, and the results of the ranking analysis are presented and discussed. Afterwards, this section presents the results of the factor analysis, i.e., principal component analysis.

3.1. Results of the Descriptive Analysis

Different socioeconomic and demographic variables are important in social and economic studies, where the role of the family and respondent is critical to the research problem under study. The descriptions of important respondent and household variables are presented in Table 4, with the average age of the respondents being 46.15 years with an average of about 8 years of education. The average family size of the respondents was about 9.76 members with a greater proportion of children than adult males or females. The mean highest educational level in the household was about 9.38 years, slightly higher than the respondents’ education.
It is also evident from the table that on average every family has 0.55 family members employed in activities other than farming and on average 1.44 farm workers were employed for agricultural activities. Survey results also revealed that 53.3% of the households were of a nuclear family structure and 46.7% were of an extended or joint family structure.
Among citrus varieties, the share of mandarins (Kinnow) is more than 90%. The same results were seen in our survey, as is evident from Figure 3, that, on average, farmers grow 5.87 hectares of citrus orchard, out of which 4.97 hectares were under mandarins, i.e., 85% of the total. This pattern was seen among all farm sizes, for example, large farmers grow mandarins on 80% of the total citrus orchards, medium farmers grow on 86% of the total citrus orchards, and small farmers grow on 92% of the total citrus orchards among all other citrus fruits.

3.2. Results of the Ranking Analysis and Critical Constraints

The summary of the ranking analysis results on farmers’ production and marketing constraints in the citrus supply chain are presented in Table 5 and Table 6, respectively. The mean score of the criticality of the production constraints range from 3.62 to 4.20 (Table 4), and of marketing, constraints range from 4.05 to 4.38 (Table 5). Constraints with a normalized value greater than 0.50 are identified as critical farmers’ side constraints in the production and marketing of the citrus supply chain. Table 5 indicates that 5 out of the initial 15 production constraints have a normalized value greater than 0.50 and therefore are deemed critical production constraints. Expectedly, the quality of fertilizer, high input cost, quality of pesticide, harsh climatic conditions, and the performance of labor have the highest mean scores, indicating the most critical constraints in the production of citrus fruit faced by the farmers in the study area. These findings agree with the findings of various previous studies conducted within the context of citrus and other fruit supply chain studies in Pakistan [12,24,33]. The Kendall’s W value for the ranking of production constraints was 0.07, and the significance level is 0.00, which indicates that a significant degree of agreement exists among all the respondents in a particular group regarding the ranking of citrus production constraints faced by the farmers.
The ranking results of marketing constraints are presented in Table 6, indicating 6 out of the 15 listed constraints have a normalized value greater than 0.50, and are therefore considered critical marketing constraints. Obviously, a lack of packaging facilities in the village and union councils, a lack of quality incentives (premium price) for the proper grading of fruit sizes, the perishable nature of the product, a lack of storage infrastructure, and a lack of quality incentive for proper packaging are the most critical citrus marketing constraints. Previous studies on the citrus supply chain also reported similar constraints, which are important in the marketing of citrus and other related fruits [7,11,36]. The Kendall’s W value for the ranking of marketing constraints was 0.047, and the significance level is 0.00, which also indicates that a significant degree of agreement exists among all respondents in a particular group regarding the ranking of citrus marketing constraints faced by farmers.

3.3. Results of the Factor Analysis

The results of the ranking showed that all 30 listed constraints have a mean raking score greater the 2.50 out of 5, therefore, for a better understanding, the constraints identified in this study were subjected to factor analysis. The value of KMO in this study was 0.517, which is acceptable as it satisfies the threshold of 0.50 (Table 3). If the KMO value is under 0.50, it leads the researcher “to need more data or think about the variables to be included for the analysis” [56]. The value of KMO can easily be improved by removing some of the variables used in the analysis by using certain criteria of exclusion.
However, a number of factors, such as the contribution of the variable to the interpretation of the factor group, should be taken into consideration in the decision to delete a variable. It is recommended that variables with factor loadings exceeding or being close to 0.50 should be retained because they are significant in contributing to the interpretation of the factor group [60]. Table 6 shows that all factor loadings exceeded or were close to 0.50, with 23 (77%) of them exceeding 0.50; therefore, all the variables were included in the factor analysis. In this study, the chi-square value in Bartlett’s sphericity test was large, i.e., 393.53), and the associated significance level is small (0.000), suggesting that the population correlation matrix is not an identity matrix. This further reinforces the appropriateness of using factor analysis.
For factor extraction, the principal component analysis technique was employed to identify underlying grouped constraints. Table 7 summarizes the results of the factor analysis after direct Oblimin rotation. Six underlying groupings (components) with eigenvalues greater than 1 were extracted, explaining 65.53% of the variance. This indicates that with these six components, the highest percentage (greater than 50%) of the variance is explained by these production and marketing constraints.
  • Group 1: Quality related constraints.
  • Group 2: Risk and climatic constraints.
  • Group 3: Economic constraints.
  • Group 4: Knowledge and information related constraints.
  • Group 5: Transport-related constraints.
  • Group 6: Infrastructure related constraints.

4. Discussion of the Results

4.1. Group 1: Quality Related Constraints

This underlies the quality related to farmers’ side constraints in the citrus supply chains related to production and marketing in Pakistan, and it is comprised of seven identified constraints: (1) Lack of quality incentives for proper grading by size, (2) quality of fertilizer, (3) lack of quality incentives for proper packaging, (4) quality of pesticide, (5) performance of labor, (6) lack of quality incentives for proper grading by variety, and (7) low quality of nursery/plants. This group of seven constraints fall within the purview of quality related constraints, and is the most dominant among all six groups, explaining the greatest variance, i.e., 26.07% from a statistical point of view (Table 6).
In this group, a subgroup of some constraints related to the quality of input use in the production of citrus, e.g., fertilizer, pesticide, and plant saplings. Several other studies related to citrus’ and other horticultural crops’ quality of the inputs is considered to be a crucial factor [7,12]. The other subgroup is about the incentives for adopting different production and marketing practices. At the current stage in the citrus supply chain of Pakistan, a lack of incentives is the major constraint in the development of sustainable supply chain management. Ozdemir [61] defined incentives as “something that influences people to act in certain ways.” In essence, in the context of sustainable supply chain management, incentives act as motivators compelling farmers to adopt certain practices, such as proper packaging and proper grading by variety and size, in the marketing of citrus. Therefore, without incentives from the industry, farmers might not adopt such practices [62]. In order to improve farmers’ decision making regarding supply chain participation, proper packaging is the critical factor underlying the assumption of sustainability of agri-food industries [63]. In the case of the citrus industry of Pakistan, Siddique [24] also highlighted this problem of incentives and proper packaging facilities.

4.2. Group 2: Risk and Climatic Constraints

This underlying group explained 10.56% of the total variance and consisted of six identified constraints: (1) The perishable nature of the products, (2) severe weather/climatic conditions, (3) disease and pest attack, (4) shortage of irrigation water, (5) deterioration of the land, and (6) high risks in citrus production. These six constraints are grouped and named as risk and climate-related constraints.
Risks, particularly related to the supply chain networks of agri-food industries, can be classified in a number of ways [64,65]. However, Hardaker [66] more appropriately classified them into production and marketing related risks, as used in this study. Leat and Revoredo-Giha [64] also discussed a similar type of production risk that occur because agricultural commodities are affected by uncontrollable events, such as extreme climatic conditions and outbreaks of pests and diseases. Tummala and Schoenherr [67] conceptualized supply chain risks with an appealing simplicity, namely “an event that adversely affects supply chain operations resulting in performance measures.”

4.3. Group 3: Economic Constraints

This group consisted of six identified constraints and explained 9.42% of the total variance related to the production and marketing of citrus: (1) High cost of inputs; (2) rigging of the setting of the market price at fruit and vegetable markets, which is called boli in the local language; (3) exploitation by the middlemen; (4) no marketing investment; (5) access to credit; and (6) less profitability in citrus production as compared with competitive crops.
Ghafoor et al. [33] reported that high input prices and inadequate agricultural credit were the major challenges for citrus farmers in Pakistan. Shortages of agricultural credit and expensive input essential for sustained citrus production lower the potential of citrus production in the district of Sargodha, the same area reported for this study [68]. In addition, Elahi et al. [69] reported that better access to farm advisory services improves agricultural productivity in Punjab. It was also reported by Ashraf et al. [70] that the latest technologies are expensive and farmers are relying on manual practices, such as the application of spray, and other mechanization tools in the cultivation of citrus in Sargodha, Punjab. Usman et al. [12] identified poor marketing facilities and the high cost of transportation faced by the citrus farmers. There is generally a big difference in the prices received by the farmers and that paid by the consumers due to the high market exploitation of the farmers.

4.4. Group 4: Knowledge and Information Related Constraints

This underlying group consisted of four farmers’ side identified constraints in the citrus supply chain: (1) Lack of market price information, (2) lack of middlemen competition, (3) difficulty in managing production, and (4) lack of information related to citrus production. From a statistical point of view, this group of constraints described 7.21% of the total variance. Several studies in the past literature found information, knowledge, and agricultural extension services as the important farmers’ side constraints in citrus supply chain studies mostly concerned with production and marketing [12,19,24].

4.5. Group 5: Geographic and Transport Related Constraints

This underlying group described 6.32% of the total variance and consisted of four farmers’ side constraints in the citrus supply chain: (1) Distance from fruit and vegetable markets, (2) poor road infrastructure, (3) lack of a transportation facility, and (4) availability of labor. Usman, Ashraf, Chaudhary, and Talib [12] pointed out that the improvement of road infrastructure, construction of bridges, and spot maintenance make it easy for growers to reach local markets and other destination markets. There is a need to create better policies to create integrity within remote rural areas (farms) with urban markets through the provision and improvement of road networks [71,72]. In a similar study of citrus marketing constraints, Usman, Ashraf, Chaudhary, and Talib [12] found that shortages and inappropriate transportation facilities have been a major source of quality reduction and citrus fruit losses. Better transportation systems should be provided to growers to reduce transportation costs and travel times, resulting in better marketing and increased production [73]. The literature [12] also pointed out the labor shortage problem in citrus production, and urged for the development of the latest affordable machinery to overcome labor shortage issues.

4.6. Group 6: Infrastructure Related Constraints

This underlying group consisted of three constraints: (1) Lack of a packaging facility at the village, (2) lack of a packaging facility at the union council, and (3) lack of storage facilities. Statistically, this group described 5.95% of the total variance. It was observed that poor quality assurance followed by the adoption of traditional packaging practices appears inconvenient for higher profits [19]. In crops, vegetables, and fruits, during packaging, there is an unavoidable amount of losses that occur related to low productivity, inefficiency, contamination, and damage of the fresh products [63]. In a previous study on citrus constraints [12], it was found that inadequate storage facilities enhanced the shelf life of fruits and was the 2nd highest ranked constraint. They also found that along with the lack of storage facilities, the high cost of storage is also an important issue to be addressed.

5. Concluding Remarks

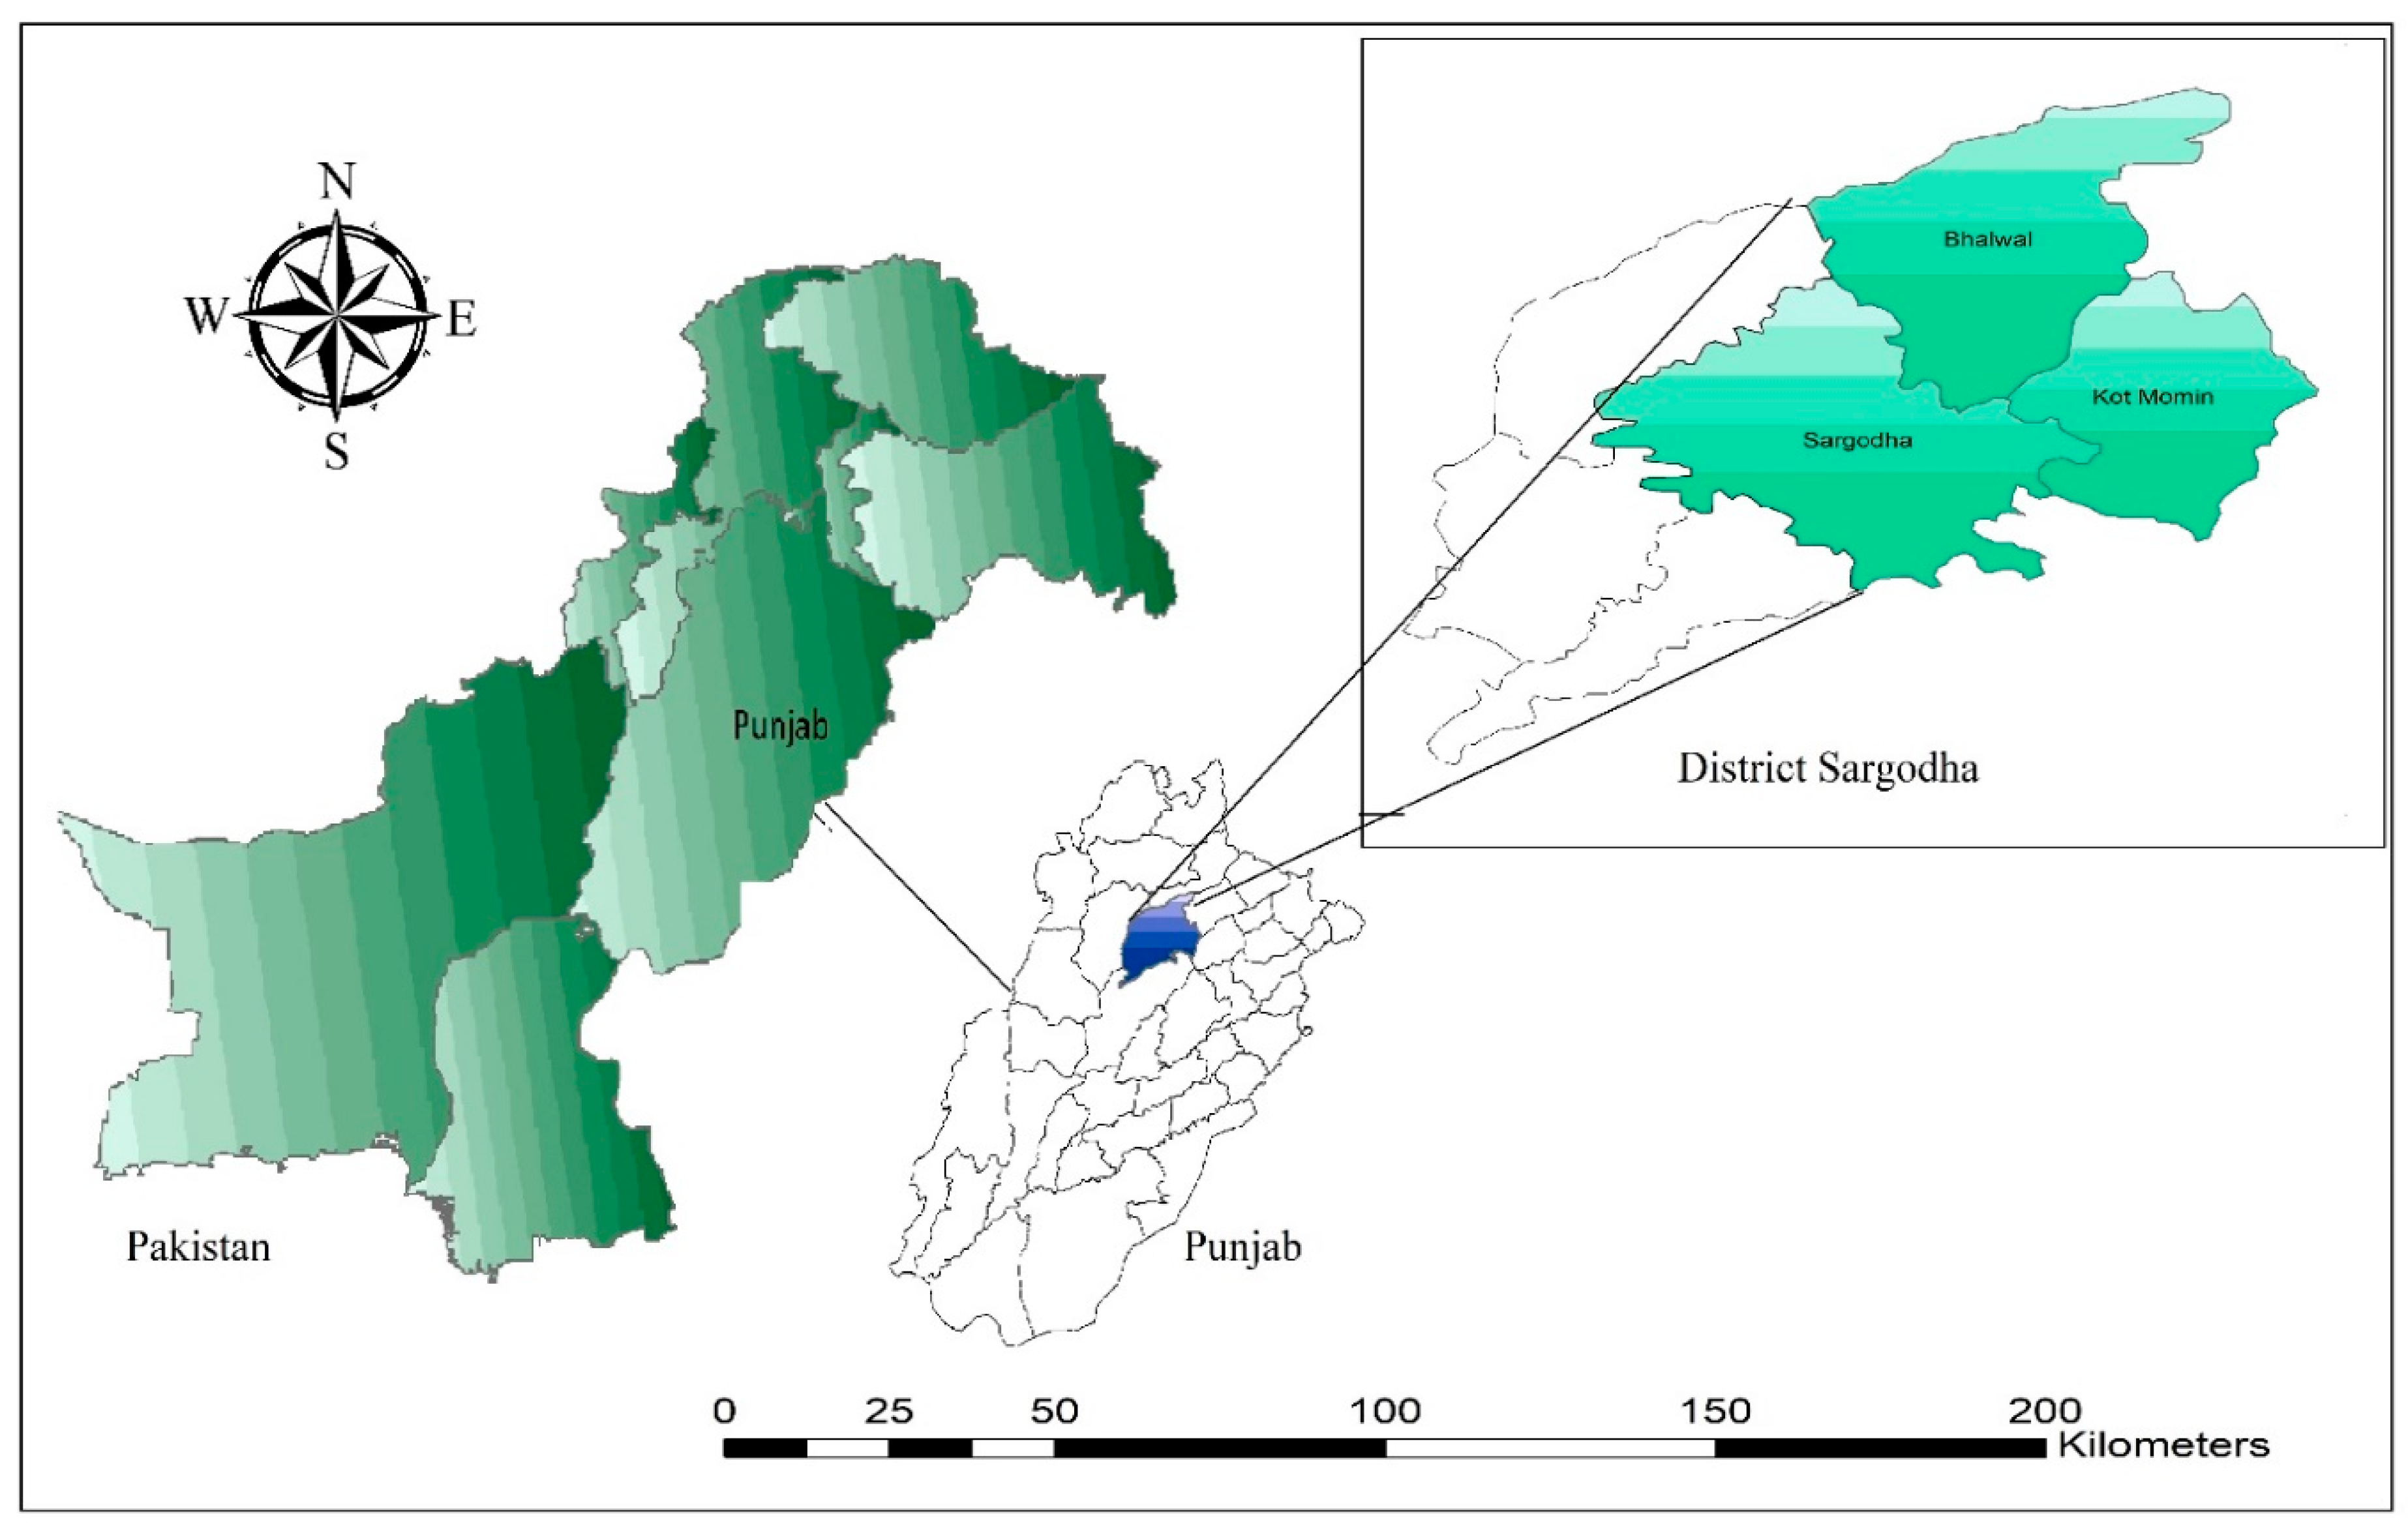
The implementation of SSCM practices at the upstream level of the chain in agri-food industries has received a high level of global attention. However, like many other developing countries, SSCM practices are still in their infancy and face many constraints in agri-food industries of Pakistan. The citrus industry in Pakistan is a typical example of poor management of SSCM. However, improving SSCM of the citrus industry can significantly increase export earnings for the country. This can be achieved by effectively addressing the issues and constraints in the entire citrus supply chain. Although there is a large body of literature on the downstream levels for SSCM in agri-food industries, no studies have attempted to empirically determine the limiting factors for the upstream level. The upstream level of the SSCM includes farmers who are the main participants. Addressing upstream issues can improve the performance of the entire citrus supply chain. To this end, this study aimed to identify and analyze the key constraints and issues in the upstream level that affect the production and marketing of the citrus industry in Pakistan. The study was conducted in three locations in the Sargodha district of Punjab, Pakistan. We conducted five farmer group discussions (FGDs) to identify or list important constraints for SSCM of the citrus industry. Farmers reported 30 constraints in the production and marketing of citrus. These constraints were also validated by an extensive literature survey. Further, we used Kendal’s coefficient of concordance (Kendall’s W- technique) and the mean score normalization technique to identify 11 critical constraints that severely influence production and marketing at the upstream level in the citrus supply chain. On the production side, the quality of fertilizer, high input costs, quality of pesticide, harsh climatic conditions, and performance of labor are found to be the most critical constraints faced by the farmers in the study area. Whereas, on the marketing side, a lack of packaging facilities in the village and union councils, lack of quality incentives (premium price) for proper grading of the fruit size, the perishable nature of the product, lack of storage infrastructure, and lack of quality incentives for proper packaging are the most critical citrus marketing constraints.
Furthermore, we used principal component analysis to classify the 30 constraints identified in the FGDs into six different groups, namely quality-related constraints, risk and climate-related constraints, economic constraints, knowledge and information-related constraints, geographic and transport-related constraints, and infrastructure-related constraints. The results of this study not only fill the literature gap of SSCM at the upstream level of the chain, but also help to develop policies and take appropriate measures to address the problems and constraints faced by farmers in the SSCM of Pakistan’s citrus industry. While developing an SSCM policy to improve the citrus industry in Pakistan, the government should consider the constraints identified in this study.

Author Contributions

Conceptualization, M.A.u.R.N. & M.M.; Formal analysis, M.A.u.R.N. & A.R.; Investigation, M.A.u.R.N.; Methodology, M.A.u.R.N., S.H., M.A. (Muhammad Ashfaq), & A.A. (Anoma Ariyawardana); Project administration, M.A.u.R.N. & M.A. (Muhammad Ashfaq); Resources, M.A. (Muhammad Ashfaq) & A.A. (Azhar Abbas); Software, A.R.; Supervision, M.A. (Muhammad Ashfaq), S.H., A.A. (Azhar Abbas) & A.A. (Anoma Ariyawardana); Validation, S.H.; Visualization, M.M.; Writing—original draft, M.A.u.R.N. & A.R.; Writing—review & editing, M.A.u.R.N., A.R., M.A. (Muhammad Ashfaq), S.H., M.M., A.A. (Azhar Abbas), M.A. (Muhammad Ashfaq), M.A. (Mumtaz Anwar) & A.A. (Anoma Ariyawardana).

Funding

This research did not receive any specific grant from funding agencies in the public, commercial, or not-for-profit sectors.

Acknowledgments

The author highly acknowledges the Higher Education Commission (HEC), Pakistan to sponsor his Ph.D. under Indigenous Scholarship Program. Authors also acknowledge the data collection team and the farmers for their time and effort.

Conflicts of Interest

The author(s) declared no potential conflicts of interest with respect to the research, authorship, and/or publication of this article.

References

  1. Naik, G.; Suresh, D.N. Challenges of creating sustainable agri-retail supply chains. IIMB Manag. Rev. 2018. [Google Scholar] [CrossRef]
  2. Ganesh Kumar, C.; Murugaiyan, P.; Madanmohan, G. Agri-Food Supply Chain Management: Literature Review. Intell. Inf. Manag. 2017, 9, 68–96. [Google Scholar] [CrossRef]
  3. Samuel, M.V.; Shah, M.; Sahay, B. An Insight into Agri-Food Supply Chains: A Review. Int. J. Value Chain Manag. 2012, 6, 115–143. [Google Scholar] [CrossRef]
  4. GOP. Economic Survey of Pakistan 2017-18; Ministry of Finance, Government of Pakistan: Islamabad, Pakistan, 2018.
  5. Mukhtar, U.; Zhong, Z.; Tian, B.; Razzaq, A.; Naseer, M.A.u.R.; Hina, T. Does Rural–Urban Migration Improve Employment Quality and Household Welfare? Evid. Pak. 2018, 10, 4281. [Google Scholar] [CrossRef]
  6. Naseer, M.A.U.R.; Ashfaq, M.; Hassan, S.; Adil, S.A.; Ariyawardana, A. Outlook on the global trade competitiveness of Pakistan’s mandarin industry: An application of revealed symmetric comparative advantage framework. Outlook Agric. 2018, 48, 1–9. [Google Scholar] [CrossRef]
  7. Badar, H. Value Chain Performance Improvement for Sustainable Mango Industry Development in Pakistan; The University of Queensland: Queensland, Australia, 2015. [Google Scholar]
  8. Siddique, M.I.; Garnevska, E.; Marr, N.E. Factors affecting marketing channel choice decisions of smallholder Citrus growers. J. Agribus. Dev. Emerg. Econ. 2018, 8, 426–453. [Google Scholar] [CrossRef]
  9. Memon, N.A. Citrus Fruit (Kino): Punjab produced 98% of production, Exclusive on Kino. Pak. Food J. 2017. Available online: http://foodjournal.pk/2017/Jan-Feb-2017/PDF-Jan-Feb-2017/Dr-Noor-Kino.pdf (accessed on 28 February 2019).
  10. FAO. Statistical Bulletin of Crops Food and Agriculture Orgnizations (FAO); FAO: Rome, Italy, 2018. [Google Scholar]
  11. Sharif, M.; Farooq, U.; Malik, W.; Bashir, M. Citrus Marketing in Punjab: Constraints and Potential for Improvement [with Comments]. Pak. Dev. Rev. 2005, 44, 673–694. [Google Scholar] [CrossRef]
  12. Usman, M.; Ashraf, I.; Chaudhary, K.M.; Talib, U. Factors impeding citrus supply chain in Central Punjab, Pakistan. Int. J. Agric. Ext. 2018, 6, 1–5. [Google Scholar]
  13. Ouma, G.; Jeruto, P. Sustainable horticultural crop production through intercropping: The case of fruits and vegetable crops: A review. Agric. Biol. J. N. Am. 2010, 1, 1098–1105. [Google Scholar] [CrossRef]
  14. Ahmed, S.; Khan, M.A.; Qasam, M. Effect of intercropping of maize in citrus orchards on citrus leaf miner infestation and population of its natural enemies. Pak. J. Agric. Sci. 2013, 50, 91–93. [Google Scholar]
  15. Bhatnagar, P.; Kaul, M.; Singh, J. Effect of intercropping in kinnow based production system. Indian J. Arid Horticult. 2007, 2, 15–17. [Google Scholar]
  16. Zekri, M. Factors Affecting Citrus Production and Quality. Citrus, D.O., Ed.; Available online: https://crec.ifas.ufl.edu/extension/trade_journals/2011/2011_dec_factors_citrus.pdf (accessed on 28 February 2019).
  17. De Fazio, M. Agriculture and Sustainability of the Welfare: The Role of the Short Supply Chain. Agric. Agric. Sci. Procedia 2016, 8, 461–466. [Google Scholar] [CrossRef] [Green Version]
  18. Kazancoglu, Y.; Ozkan-Ozen, Y.D.; Ozbiltekin, M. Minimizing losses in milk supply chain with sustainability: An example from an emerging economy. Resour. Conserv. Recycl. 2018, 139, 270–279. [Google Scholar] [CrossRef]
  19. Iqbal, S.; Kamal, T. Factors Affecting Citrus Productivity in District Dir Lower. J. Econ. Sustain. Dev. 2014, 5, 197–200. [Google Scholar]
  20. FAO. FAO Yearbook 2010; Food and Agriculture Organisation of the United Nations: Rome, Italy, 2012. [Google Scholar]
  21. Sitek, P.; Wikarek, J.; Nielsen, P. A constraint-driven approach to food supply chain management. Ind. Manag. Data Syst. 2017, 117, 2115–2138. [Google Scholar] [CrossRef]
  22. Moazzam, M. Benchmarking Agri-food Supply Chains: A Case of Pakistan and New Zealand Milk System; Massey University: Palmerston North, New Zealand, 2015. [Google Scholar]
  23. Hussain, S.; Ahmed, W.; Rabnawaz, A.; Sohail Jafar, R.; Akhtar, H.; Guang-Ju, W.; Ullah, S.; JianZhou, Y. Integration and effective supply chain management: A review of agriculture in Pakistan and China. J. Econ. Sustain. Dev. 2015, 6. [Google Scholar] [CrossRef]
  24. Siddique, M.I. Factors Affecting Marketing Channel Choice Decisions in Citrus Supply Chain Massey University; Massey University: Palmerston North, New Zealand, 2015. [Google Scholar]
  25. Johnson, G. Pakistan Citrus Industry Challenges: Opportunities for Australia-Pakistan Collaboration in Research, Development & Extension; ACIAR: Canberra, Australia, 2006. [Google Scholar]
  26. Ahmed, U.I.; Ying, L.; Mushtaq, K.; Bashir, M.K. An econometric estimation of post-harvest losses of kinnow in Pakistan. Int. J. Econ. Commer. Manag. Sci. Lett. 2015, 3, 373–383. [Google Scholar]
  27. Seitz, M.A.; Wells, P.E. Challenging the implementation of corporate sustainability: The case of automotive engine remanufacturing. Bus. Process Manag. J. 2006, 12, 822–836. [Google Scholar] [CrossRef]
  28. Diabat, A.; Govindan, K. An analysis of the drivers affecting the implementation of green supply chain management. Resour. Conserv. Recycl. 2011, 55, 659–667. [Google Scholar] [CrossRef]
  29. Rao, P.; Holt, D. Do green supply chains lead to competitiveness and economic performance? Int. J. Oper. Prod. Manag. 2005, 25, 898–916. [Google Scholar] [CrossRef]
  30. Hart, S.L. Beyond greening: Strategies for a sustainable world. Harv. Bus. Rev. 1997, 75, 66–77. [Google Scholar]
  31. Dowell, G.; Hart, S.; Yeung, B. Do Corporate Global Environmental Standards Create or Destroy Market Value? Manag. Sci. Lett. 2000, 46, 1059–1074. [Google Scholar] [CrossRef]
  32. Badar, H.; Ariyawardana, A.; Collins, R. Capturing Consumer Preferences for Value Chain Improvements in the Mango Industry of Pakistan. Int. Food Agribus. Manag. Rev. 2015, 18, 131–148. [Google Scholar]
  33. Ghafoor, U.; Muhammad, S.; Chaudhary, K. Constraints in availability of inputs and information to citrus (kinnow) growers of tehsil Toba Tek Singh. Pak. J. Agric. Sci. 2008, 45, 520–522. [Google Scholar]
  34. Chamhuri, N.; Batt, P. Exploring the factors influencing consumers‘ choice of retail store when purchasing fresh meat in Malaysia. Int. Food Agribus. Manag. Rev. 2013, 16, 99–122. [Google Scholar]
  35. Malhotra, N.K. Essentials of Marketing Research: A Hands-on Orientation; Pearson Essex: Pearson, UK, 2015. [Google Scholar]
  36. Siddique, M.I.; Garnevska, E. Citrus Value Chain (s): A Survey of Pakistan Citrus Industry. In Agriculture Value Chain; IntechOpen: London, UK, 2018. [Google Scholar]
  37. Chan, A.P.C.; Darko, A.; Olanipekun, A.O.; Ameyaw, E.E. Critical barriers to green building technologies adoption in developing countries: The case of Ghana. J. Clean. Prod. 2018, 172, 1067–1079. [Google Scholar] [CrossRef]
  38. Nyaoga, R.; Magutu, P. Constraints management and value chain performance for sustainable development. Manag. Sci. Lett. 2016, 6, 427–442. [Google Scholar] [CrossRef]
  39. Ezin, V.; Quenum, F.; Bodjrenou, R.H.; Kpanougo, C.M.; Kochoni, E.M.; Chabi, B.I.; Ahanchede, A. Assessment of production and marketing constraints and value chain of sweet potato in the municipalities of Dangbo and Bonou. Agric. Food Secur. 2018, 7, 15. [Google Scholar] [CrossRef]
  40. Tsolakis, N.K.; Keramydas, C.A.; Toka, A.K.; Aidonis, D.A.; Iakovou, E.T. Agrifood supply chain management: A comprehensive hierarchical decision-making framework and a critical taxonomy. Biosyst. Eng. 2014, 120, 47–64. [Google Scholar] [CrossRef]
  41. Choudhary, D.; Kunwar, M.S.; Rasul, G. From Farmers to Entrepreneurs—Strengthening Malta orange value chains through institutional development in Uttarakhand, India. Mt. Res. Dev. 2015, 35, 4–15. [Google Scholar] [CrossRef]
  42. Shrestha, B. A Supply Chain Approach to Study Efficiency and Sustainability in the Nepalese tea Industry; Turku University of Applied Sciences: Turku, Finland, 2014; Available online: https://www.theseus.fi/handle/10024/85270 (accessed on 1 March 2019).
  43. Razzaq, A.; Ping, Q.; Naseer, M.A.u.R.; Abid, M.; Anwar, M.; Javed, I. Can the informal groundwater markets improve water use efficiency and equity? Evidence from a semi-arid region of Pakistan. Sci. Total Environ. 2019. [Google Scholar] [CrossRef]
  44. Naseer, M.A.u.R.; Ashfaq, M.; Abid, M.; Razzaq, A.; Hassan, S. Current Status and Key Trends in Agricultural Land Holding and Distribution in Punjab, Pakistan: Implications for Food Security. J. Agric. Stud. 2016, 4, 14. [Google Scholar] [CrossRef]
  45. GOP. Population Census 2017; Pakistan Bureau of Statistics, Government of Pakistan Islamabad; GOP: Washington, DC, USA, 2018.
  46. Ashfaq, M.; Razzaq, A.; Hassan, S.; Haq, S.U. Factors affecting the economic losses due to livestock diseases: A case study of district Faisalabad. Pak. J. Agric. Sci. 2015, 52, 515–520. [Google Scholar]
  47. Ashfaq, M.; Razzaq, A.; Haq, S.U.; Muhammad, G. Economic analysis of dairy animal diseases in Punjab: A case study of Faisalabad district. J. Anim. Plant Sci. 2015, 25, 1482–1495. [Google Scholar]
  48. GOP. Agriculture Marketing and Information System (AMIS); Government of Punjab, Pakistan: Lahore, Pakistan, 2018.
  49. Santos, J.R.A. Cronbach’s alpha: A tool for assessing the reliability of scales. J. Exten. 1999, 37, 1–5. [Google Scholar]
  50. Tavakol, M.; Dennick, R. Making sense of Cronbach‘s alpha. Int. J. Med. Edu. 2011, 2, 53. [Google Scholar] [CrossRef] [PubMed]
  51. Zhao, X.; Hwang, B.-G.; Low, S.P.; Wu, P. Reducing Hindrances to Enterprise Risk Management Implementation in Construction Firms. J. Construct. Eng. Manag. 2015, 141, 04014083. [Google Scholar] [CrossRef]
  52. Siegel, S. Nonparametric statistics. Am. Stat. 1957, 11, 13–19. [Google Scholar]
  53. Lam, P.T.I.; Chan, E.H.W.; Yu, A.T.W.; Cam, W.C.N.; Yu, J.S. Applicability of clean development mechanism to the Hong Kong building sector. J. Clean. Prod. 2015, 109, 271–283. [Google Scholar] [CrossRef]
  54. Norusis, M. SPSS 16.0 Advanced Statistical Procedures Companion; Prentice Hall Press: Upper Saddle River, NJ, USA, 2008. [Google Scholar]
  55. Li, Y.Y.; Chen, P.-H.; Chew, D.A.S.; Teo, C.C.; Ding, R.G. Critical Project Management Factors of AEC Firms for Delivering Green Building Projects in Singapore. J. Construct.Eng. Manag. 2011, 137, 1153–1163. [Google Scholar] [CrossRef]
  56. Field, A. Discovering Statistics Using IBM SPSS Statistics; Sage: Newcastle upon Tyne, UK, 2013. [Google Scholar]
  57. Kaiser, H.F. An index of factorial simplicity. Psychometrika 1974, 39, 31–36. [Google Scholar] [CrossRef]
  58. Chan, A.P.C.; Lam, P.T.I.; Chan, D.W.M.; Cheung, E.; Ke, Y. Critical Success Factors for PPPs in Infrastructure Developments: Chinese Perspective. J. Construct. Eng. Manag. 2010, 136, 484–494. [Google Scholar] [CrossRef]
  59. Pallant, J. SPSS Survival Manual; McGraw-Hill Education: New York, NY, USA, 2013. [Google Scholar]
  60. Matsunaga, M. How to factor-analyze your data right: do’s, don’ts, and how-to’s. Int. J. Psychol. Res. 2010, 3, 97–110. [Google Scholar] [CrossRef]
  61. Ozdemir, M.H. An Alternative Incentive System to Improve Productivity at the Turkish Naval Shipyards; Naval Postgraduate School Monterey: Monterey, CA, USA, 2000; Available online: https://core.ac.uk/download/pdf/36725649.pdf (accessed on 1 March 2019).
  62. Darko, A.; Chan, A.P.; Owusu-Manu, D.-G.; Ameyaw, E.E. Drivers for implementing green building technologies: An international survey of experts. J. Clean. Prod. 2017, 145, 386–394. [Google Scholar] [CrossRef] [Green Version]
  63. Djekic, I.; Sanjuán, N.; Clemente, G.; Jambrak, A.R.; Djukić-Vuković, A.; Brodnjak, U.V.; Pop, E.; Thomopoulos, R.; Tonda, A. Review on environmental models in the food chain-Current status and future perspectives. J. Clean. Prod. 2018, 176, 1012–1025. [Google Scholar] [CrossRef]
  64. Leat, P.; Revoredo-Giha, C. Risk and resilience in agri-food supply chains: The case of the ASDA PorkLink supply chain in Scotland. Supply Chain Manag. Int. J. 2013, 18, 219–231. [Google Scholar] [CrossRef]
  65. Harland, C.; Brenchley, R.; Walker, H. Risk in supply networks. J. Purch. Supply Manag. 2003, 9, 51–62. [Google Scholar] [CrossRef]
  66. Hardaker, J.B. Coping with Risk in Agriculture; CABI: Wallingford, UK, 2004. [Google Scholar]
  67. Tummala, R.; Schoenherr, T. Assessing and managing risks using the supply chain risk management process (SCRMP). Supply Chain Manag. Int. J. 2011, 16, 474–483. [Google Scholar] [CrossRef]
  68. Ashraf, S.; Khan, G.A.; Ali, S.; Iftikhar, M.; Mehmood, N. Managing insect pests & diseases of citrus: On farm analysis from Pakistan. Pak. J. Phytopathol. 2014, 26, 301–307. [Google Scholar]
  69. Elahi, E.; Abid, M.; Zhang, L.; ul Haq, S.; Sahito, J.G.M. Agricultural advisory and financial services; farm level access, outreach and impact in a mixed cropping district of Punjab, Pakistan. Land Use Policy 2018, 71, 249–260. [Google Scholar] [CrossRef]
  70. Ashraf, S.; Khan, G.A.; Ali, S.; Iftikhar, M.; Luqman, M.; Hassan, M. Patterns and limitations of micronutrients application for citrus production in sargodha: A challenge for extension education in the Punjab. J. Agric. Res. 2015, 53. Available online: https://s3.amazonaws.com/academia.edu.documents/40876030/PATTERNS_AND_LIMITATIONS_OF_MICRONUTRIENTS.pdf?AWSAccessKeyId=AKIAIWOWYYGZ2Y53UL3A&Expires=1551591550&Signature=1tgKUuUcwxsyxMz1UsIOhgcjjcg%3D&response-content-disposition=inline%3B%20filename%3DPATTERNS_AND_LIMITATIONS_OF_MICRONUTRIEN.pdf (accessed on 3 February 2019).
  71. Arethun, T.; Bhatta, B.P. Contribution of rural roads to access to-and participation in markets: Theory and results from northern Ethiopia. J. Transp. Technol. 2012, 2, 165–175. [Google Scholar] [CrossRef]
  72. Markelova, H.; Meinzen-Dick, R.; Hellin, J.; Dohrn, S. Collective action for smallholder market access. Food Policy 2009, 34, 1–7. [Google Scholar] [CrossRef] [Green Version]
  73. IFAD. Rural Poverty Report 2001: The Challenge of Ending Rural Poverty, International Fund for Agricultural Development; Oxford University Press: Oxford, UK, 2001. [Google Scholar]
Figure 1. Factors contributing to the sustainable supply chain management (SSCM) of agri-food commodities at the upstream of the chain.
Sustainability 11 01326 g001
Figure 2. Study area map.
Sustainability 11 01326 g002
Figure 3. Average citrus orchard area according to farm size categories (ha).
Sustainability 11 01326 g003
Table 1. List of the potential production constraints supplemented from the literature.
CodeProduction ConstraintReference
H1Availability of laborUsman, Ashraf, Chaudhary, and Talib [12], Siddique [24], Nyaoga and Magutu [38]; Siddique and Garnevska (2018); Ezin et al. [39]
H2Performance of labor Nyaoga and Magutu [38], Tsolakis et al. [40]
H3Quality of pesticides Siddique, Garnevska, and Marr [8], Usman, Ashraf, Chaudhary, and Talib [12], Siddique [24], Ghafoor, Muhammad, and Chaudhary [33]
H4Quality of fertilizersSiddique [24], Ghafoor, Muhammad, and Chaudhary [33]; Usman et al. (2018); Siddique et al. (2018)
H5Disease and pest attackSiddique [24], Tsolakis, Keramydas, Toka, Aidonis, and Iakovou [40]; Usman et al. (2018); Siddique et al. (2018)
H6Severe weather condition Siddique [24], Tsolakis, Keramydas, Toka, Aidonis, and Iakovou [40]; Usman et al. (2018); Siddique et al. (2018); Ezin, Quenum, Bodjrenou, Kpanougo, Kochoni, Chabi, and Ahanchede [39]
H7Access to the latest production information Siddique [24], Ghafoor, Muhammad, and Chaudhary [33], Tsolakis, Keramydas, Toka, Aidonis, and Iakovou [40], Choudhary et al. [41], Shrestha [42]; Usman et al. (2018); Ezin, Quenum, Bodjrenou, Kpanougo, Kochoni, Chabi, and Ahanchede [39]
H8Access to credit Siddique [24], Ghafoor, Muhammad, and Chaudhary [33], Tsolakis, Keramydas, Toka, Aidonis, and Iakovou [40]; Usman et al. (2018)
H9Low quality of seed/varieties Siddique [24], Ghafoor, Muhammad, and Chaudhary [33]; Usman et al. (2018); Siddique et al. (2018)
H10Hard to manage fruit production Siddique [24], Choudhary, Kunwar, and Rasul [41]; Usman et al. (2018); Siddique et al. (2018); Ezin, Quenum, Bodjrenou, Kpanougo, Kochoni, Chabi, and Ahanchede [39]
H11Soil fertility is deteriorating Siddique [24]; Siddique and Garnevska (2018)
H12Canal water is not available Siddique [24], Ghafoor, Muhammad, and Chaudhary [33]
H13High input costs Siddique [24], Ghafoor, Muhammad, and Chaudhary [33]; Usman et al. (2018); Siddique and Garnevska (2018)
H14Less profitability in citrus with competitive crops Sharif, Farooq, Malik, and Bashir [11], Tsolakis, Keramydas, Toka, Aidonis, and Iakovou [40]; Siddique and Garnevska (2018); Siddique et al. (2018)
H15Higher risk in citrus production Sharif, Farooq, Malik, and Bashir [11], Tsolakis, Keramydas, Toka, Aidonis, and Iakovou [40], Choudhary, Kunwar, and Rasul [41]; Siddique and Garnevska (2018)
Table 2. List of potential marketing constraints supplemented from the literature.
CodeMarketing ConstraintReference
G1Perishable nature of the product Sharif, Farooq, Malik, and Bashir [11], Choudhary, Kunwar, and Rasul [41]
G2Lack of road infrastructure Siddique [24], Tsolakis, Keramydas, Toka, Aidonis, and Iakovou [40], Shrestha [42]; Ezin, Quenum, Bodjrenou, Kpanougo, Kochoni, Chabi, and Ahanchede [39]
G3Lack of a transportation facility, like a tractor trolley Sharif, Farooq, Malik, and Bashir [11], Siddique [24], Ghafoor, Muhammad, and Chaudhary [33], Tsolakis, Keramydas, Toka, Aidonis, and Iakovou [40], Shrestha [42]; Usman et al. (2018)
G4Lack of a packaging facility in the villageSiddique and Garnevska [36], Nyaoga and Magutu [38]; Usman et al. (2018)
G5Lack of a packaging facility in the union councilNyaoga and Magutu [38]; Siddique and Garnevska (2018); Usman et al. (2018)
G6Exploitation of the middlemen Sharif, Farooq, Malik, and Bashir [11], Siddique [24], Nyaoga and Magutu [38], Tsolakis, Keramydas, Toka, Aidonis and Iakovou [40]; Usman et al. (2018)
G7Lack of quality incentives for proper packaging Tsolakis, Keramydas, Toka, Aidonis, and Iakovou [40], Shrestha [42]; Siddique and Garnevska (2018)
G8Lack of quality incentives for proper grading by sizeTsolakis, Keramydas, Toka, Aidonis, and Iakovou [40], Shrestha [42]; Siddique and Garnevska (2018)
G9Lack of quality incentives for proper grading by varietyTsolakis, Keramydas, Toka, Aidonis, and Iakovou [40], Shrestha [42]; Siddique and Garnevska (2018)
G10Lack of middlemen competition Siddique [24], Choudhary, Kunwar, and Rasul [41]; Siddique and Garnevska (2018)
G11Lack of market price information Sharif, Farooq, Malik, and Bashir [11], Ghafoor, Muhammad, and Chaudhary [33], Choudhary, Kunwar, and Rasul [41]; Usman et al. (2018)
G12Rigging in F&V market price settlement (boli) Sharif, Farooq, Malik, and Bashir [11], Shrestha [42]; Usman et al. (2018)
G13Lack of storage facilities Sharif, Farooq, Malik, and Bashir [11], Siddique [24], Nyaoga and Magutu [38]; Usman et al. (2018); Ezin, Quenum, Bodjrenou, Kpanougo, Kochoni, Chabi, and Ahanchede [39]
G14Distance from F&V market Sharif, Farooq, Malik, and Bashir [11], Ghafoor, Muhammad, and Chaudhary [33], Nyaoga and Magutu [38]; Usman et al. (2018)
G15No marketing investment Sharif, Farooq, Malik, and Bashir [11], Nyaoga and Magutu [38], Choudhary, Kunwar, and Rasul [41]
Table 3. Level of acceptance of the Kaiser-Meyer-Olkin (KMO) value.
KMO ValueLevel of Acceptance
Above 0.90Superb
0.80 to 0.90Great
0.70 to 0.80Good
0.50 to 0.70Mediocre
Below 0.50Unacceptable
Source: Field [56].
Table 4. Farmers’ and households’ descriptive statistics.
CharacteristicUnitMin.Max.MeanStd. Dev.
Age of the respondentYears217046.1511.266
Education of the respondentYears0188.033.742
Adult male in the familyNo.173.191.361
Adult female in the familyNo.182.771.315
Children under 15No.1113.801.870
Total family membersNo.4259.763.505
School going family membersNo.082.831.579
Highest education in the familyYears0189.383.507
Family members employedNo.020.550.714
Family labor on the farmNo.141.440.622
Family structureNo. (percent)NuclearJoint or extended
160 (53.3)140 (46.7)
Table 5. Ranking results of the production constraints.
RankCodeKendall’s W RankMeanStd. dev.Normalization
1H410.284.200.6690.83 *
2H139.193.821.1490.61 *
3H38.883.711.2020.55 *
4H68.863.711.3060.55 *
5H28.453.621.1400.50 *
6H58.363.601.3900.49
7H128.243.481.3400.42
8H117.993.471.4480.42
9H157.953.301.4600.32
10H87.733.281.3960.31
11H97.723.271.4450.30
12H17.143.191.3940.26
13H107.082.971.4230.14
14H76.232.831.3380.06
15H145.892.731.3180.00
Kendall’s W (Coefficient of Concordance) = 0.070 | Chi-square = 293.595. N = 300 | df = 14 | Asymp. Sig. | 0.000 | * normalized value > 0.50 = ( m e a n m i n i m u m   v a l u e ) / ( m a x i m u m   v a l u e m e a n ) .
Table 6. Ranking results of the marketing constraints.
RankCodeKendall’s W RankMeanSTDNormalization
1G410.404.380.6761.00 *
2G59.904.350.6810.98 *
3G89.644.270.7640.91 *
4G19.634.220.7290.88 *
5G139.504.190.9280.85 *
6G79.044.051.0190.75 *
7G117.913.711.1710.49
8G107.553.581.2840.40
9G147.443.571.2370.39
10G27.403.570.9770.39
11G127.153.561.3340.38
12G66.833.471.0390.31
13G156.253.341.3700.21
14G95.963.061.4350.01
15G35.403.051.3230.00
Kendall’s Wa (Coefficient of Concordance) = 0.047 | Chi-square = 415.596; N = 300 | df = 14 | Asymp. Sig. | 0.000 | * normalized value > 0.50 = ( m e a n m i n i m u m   v a l u e ) / ( m a x i m u m   v a l u e m e a n ) .
Table 7. Results of the factor analysis.
CodeFarmer’s ConstraintsConstraint Grouping
123456
Group 1: Quality Related Constraints
G8 Lack of quality incentives for proper grading by size0.83
H4 Quality of fertilizers0.81
G7 Lack of quality incentives for proper packaging 0.75
H3 Quality of pesticides 0.55
H2 Performance of labor 0.51
G9 Lack of quality incentives for proper grading by variety0.49
H9 Low quality of seed/varieties 0.46
Group 2: Risk and climatic constraints
G1 Perishable nature of the product 0.86
H6 Severe weather conditions 0.61
H5 Disease and pest attack 0.57
H12 Canal water is not available 0.52
H11 Soil fertility is deteriorating 0.47
H15 Higher risk in citrus production 0.45
Group 3: Economic constraints
H13 High input costs 0.61
G12 Rigging in F&V market price settlement (boli) 0.58
G6 Exploitation of the middlemen 0.56
G15 No marketing investment 0.55
H8 Access to credit 0.51
H14 Less profitability in citrus with competitive crops 0.46
Group 4: Information related constraints
G11 Lack of market price information 0.69
G10 Lack of middlemen competition 0.65
H10 Hard to manage fruit production 0.58
H7 Access to the latest production information 0.53
Group 5: Transport-related constraints
G14 Distance from F&V market 0.63
G2 Lack of road infrastructure 0.56
G3 Lack of a transportation facility, like a tractor trolley 0.51
H1 Availability of labor 0.49
Group 6: Infrastructure related constraints
G4 Lack of a packaging facility in the village 0.57
G5 Lack of a packaging facility in the union council 0.52
G13 Lack of storage facilities 0.44
Eigen Value4.403.483.272.452.191.53
Percentage variance26.0710.569.427.216.325.95
Percentage cumulative variance26.0736.6346.0553.2659.5865.53

