Abstract
With the reduction of traditional tariff and non-tariff trade barriers, trade facilitation measures, such as improved port efficiency and the customs environment, have become increasingly important for improving the structure of export growth and exploring the trade potential of forest products. Our research divided China’s export growth of forest products into extensive margins (variety), quantity margins (quantity), and price margins (quality), and discussed how trade facilitation impacted China’s forest product export growth structure from the perspective of ternary margins. An evaluation system of trade facilitation was constructed, and principal component analysis was used to measure the levels of trade facilitation of 13 countries which had large trade flows of forest products with China along the “Belt and Road”. In addition, we used transnational panel data and the extended gravity model to analyze the impact of their trade facilitation on the ternary margins of China’s export growth. In order to overcome the endogeneity of the model, the 2 stage least squares (2SLS) method was used and the first-order lags of trade facilitation indicators were selected as instrument variables. The decomposition results of ternary margins showed that the “low price and high quantity” export growth pattern had remained in China’s forest products trade, and the 2SLS regression results indicated that the improvement of trade facilitation had a significantly positive impact on the quantity margins and price margins, but no significant impact on the extensive margins. It is suggested that China should make differentiated investments to countries along the “Belt and Road” based on their different levels of trade facilitation, in order to promote constant improvement of product quality and optimization of export growth structure in the forest products industry.
1. Introduction
With the weakening of traditional trade barriers in both tariff and non-tariff forms (such as green and technological barriers), the inefficiency of trade, often considered as an invisible barrier to market access, has become an important obstacle to China’s forest products exports [1]. At present, China’s forest products exports have been increasing rapidly, and the share of China’s forest products exports in total exports were increasing steadily from 2.93% in 2000 to 3.46% in 2016 (see Appendix Figure A1). Although exporting a massive and growing volume of goods, China’s forest product industry mainly manufactures raw materials and middle products, lacking in technological innovation or brand power [2], leaving it at risk of being “locked down into the lower end of the value chain” as developed countries maintain their control over the upper end. However, the “Belt and Road” initiative has brought about a greater diversity of trade partners and trade patterns, giving the industry new opportunities to transform and upgrade itself. The countries along the “Belt and Road” vary in the amounts of forest resources and related capital and technologies they possess, but the forest product trade between them and China tends to be more complementary than competitive [3]. The “Belt and Road” initiative has also accelerated the flow and reconfiguration of basic factors such as labors and capital, which is also helpful for the industry’s transformation. As a general rule, trade facilitation may reduce transaction costs, simplify trade procedure and improve customs efficiency [4,5]. Therefore, it may be viable to explore the potential of the forest product trade with the “Belt and Road” countries and adjust the industry’s export structure by improving trade facilitation.
Although numerous studies have attempted to construct evaluation systems for trade facilitation, they differ significantly in the indicators they chose. For example, John Raven believed that the indicators should include customs environment, business credibility and efficiency of payment system [6]. Wilson et al. chose four indicators, including port efficiency, customs environment, institutional environment and e-commerce to establish their evaluation system [7]. Portugal-Perez et al. further divided the indicators into hardware and software infrastructures, and their studies showed that the impacts of transportation efficiency and business environment on export tend to be marginally diminishing, whereas the impacts of infrastructure and communication technologies increased along with a country’ income growth [8]. Porto used virtual variables such as single window schemes and consensus trade agreements as the indicators of trade facilitation [9]. Li et al. selected six indicators, including port efficiency, customs environment, institutional environment, business environment, e-commerce, and market access into the evaluation system, and made use of the entropy method to calculate the trade facilitation scores of 109 countries in the world [10]. Kong et al. decomposed the indicators into a number of second-level indexes, such as logistics competitiveness, shipping affordability, convenience, and cost of financial service, and then used principal component analysis to calculate the weights of first-level indicators [11]. Zhu et al. selected indicators from five areas, including port efficiency, customs environment, infrastructures and services, information and communication technologies, and business environment, and then applied Delphi method and Analytic Hierarchy Process to determine the weight of each indicator [12].
A consensus among the previous series of studies is that trade facilitation does have a significantly positive effect on reducing trade costs and improving welfare benefits [13,14,15,16,17]. In terms of research methods, a series of gravity models or Computable General Equilibrium (CGE) models had been widely applied in assessing the impact of trade facilitation on trade flows [18,19,20,21,22,23]. For example, Francois et al. used CGE modeling to measure trade facilitation for agriculture, manufacturing and the service industry. They alleged that if the customs costs of all countries went down, global gross domestic product would increase [24]. Shepherd et al. demonstrated that infrastructure was the decisive factor of international trade by the gravity model, and also proved that the upgrade of highway quality could increase trade flows by 50%, more than the benefits brought by tariff reduction [25]. Scholars who focused on trade facilitation of countries along the “Belt and Road” generally agreed that the impacts of trade facilitation on trade flows could vary due to regional disparity. Zhang et al. believed business environment played a vital role in enhancing China’s export, and trade facilitation of different regions along the “Belt and Road” had different effects on it [26]. Zhang et al. applied the extended trade gravity model to study trade facilitation along “the Silk Road Economic Belt” and found that it had a U-shaped distribution, as “Europe had the highest levels of trade facilitation, East Asia had the middle levels, while countries in the middle of the belt had the lowest levels”, and the influences of trade facilitation on different regions showed remarkable heterogeneity [27].
In recent years, several agronomists have begun to pay attention to the impact of trade facilitation on export diversification and technological complexity. Persson suggested that if export transaction costs declined by 1%, the number of differentiated and homogeneous exported products would rise by 0.7% and 0.4% respectively [28]. Feenstra et al. investigated the correlation between trade facilitation and export commodities, and believed that trade facilitation had a significant impact on extensive margins of exports [29]. Dennis et al. demonstrated that if export or transportation cost was reduced by 1%, export diversification would increase by 0.3% or 0.4% respectively [30]. Yin et al. estimated the impact of trade facilitation on the technological sophistication of imports, and concluded that trade facilitation had a more significant effect in promoting high-tech industries [31].
The following should then be observed. Firstly, most existing researches focused on the impact of trade facilitation on bilateral trade flows, but little concentrated on its influence on the structure of export growth based on the perspective of ternary margins. Secondly, most empirical studies were based on the assumption that trade facilitation indicators were unaffected by disturbance terms, which might introduce biased estimation caused by the endogeneity problem. Thirdly, most previous studies focused on the impact of trade facilitation on the overall trade flow or subdivided sectors such as agriculture, manufacturing and services, rarely involving any empirical information on forest products, which was not helpful for solving the inefficiency problem of the sector in China. So, is there any room for improving trade facilitation in countries along the “Belt and Road”? Could better trade facilitation significantly improve the export structure of Chinese forest products? In this paper we build a complete evaluation system of trade facilitation for measuring the trade facilitation of countries which had large trade flows of forest products with China along the “Belt and Road”. The growth of such exports was decomposed into three margins: extensive, quantity, and price margins, the first-order lags of trade facilitation indicators were selected as instrument variables to overcome the endogeneity of the model, and then the impact of trade facilitation on the structure of China’s forest products export growth to countries along the “Belt and Road” was analyzed on the basis of model results. During this process, we tried to find efficient ways to make better use of foreign trade to enhance the competitiveness of forest products in China.
The article is organized as follows. The first section discusses the problems faced by China’s forest products trade and the potential significance of trade facilitation in improving their export structure to countries along the “Belt and Road”. The second section introduces the data sources, the methods, and develops the indicator system. The third section introduces the establishment of the econometric model and the selection of variables. The fourth section empirically analyzes the impact of trade facilitation on China’s forest product export growth structure, and the fifth section includes conclusions and implications.
2. Data Sources and Methodology
2.1. Sample Selection and Data Sources
This paper chose 13 representative countries which had large trade flows of forest products with China along the “Belt and Road”, including Kazakhstan (Central Asia), Vietnam, the Philippines, Malaysia, Indonesia, Singapore (Southeast Asia), India, Pakistan (South Asia), Poland, Romania (Central and Eastern Europe), Saudi Arabia, United Arab Emirates (West Asia), and Russia (CIS). The time span was 2007 to 2016. The forest products included logs (4403), lumbers (4406, 4407, 4409), other raw materials (4401, 4402, 4404, 4405), veneers (4408), chipboards (4410), fiberboards (4411), plywood (4412, 4413), wood pulps (4701–4706), papers and paper products (4707, 4801–4911), woodwares (4414–4421) and wood furniture (940330, 940340, 940350, 940360).
The data used to calculate trade facilitation were taken from the Global Competitiveness Report (GCR) released by World Economic Forum (https://www.weforum.org/), and the Global Corruption Perceptions Index Report (CPI) released by Transparency International (https://www.transparency.org/). The data used to calculate ternary margins of export growth came from the HS96 code in the CEPII-BACI database of France International Research Center (http://www.cepii.fr/cepii/en/bdd_modele/bdd.asp), which provided standardized data on prices and volumes of international trade.
2.2. Indicator Construction and Calculation Methods
2.2.1. Construction of the Trade Facilitation Indicator System
There is presently no commonly accepted indicator system for evaluating trade facilitation. Meanwhile, what trade facilitation may entail has continued to expand with the development of e-commerce and financial services. According to TFA (Trade Facilitation Agreement), the evaluation indicators of trade facilitation should include transparency of trade regulations, charges and procedures of import and export, release and clearance of goods, formalities of import and export, and transit freedom and customs cooperation [5]. Considering relevant regulations of TFA and combining the ideas of Wilson et al. and Kong et al., we selected four first-level indicators including port efficiency, customs environment, regulation environment, and finance and e-commerce, and decomposed these four indicators into seventeen second-level indicators to measure trade facilitation of countries along the “Belt and Road” [11,32]. This system is shown in Table 1.

Table 1.
The trade facilitation indicator system.
- (1)
- Port efficiency: This indicator reflects the construction of traffic infrastructure and transport efficiency, and consists of four second-level indicators (respective qualities of roads, railways, ports and airports). A higher score represents better infrastructure and higher port transportation efficiency, which are conducive to the development of international trade.
- (2)
- Customs environment: This indicator measures the cost of customs clearance, customs procedures, and transit management transparency, and consists of two second-level indicators (prevalence of trade barriers, and burden of customs procedures). A higher score means lower costs of customs clearance and more convenient customs procedures, which are helpful to promote trade and foreign direct investment.
- (3)
- Institutional environment: This indicator reflects institutional environment related to trade, such as policy transparency and judicial efficiency, and consists of six second-level indicators (corruption perceptions index, public trust in the government behavior, judicial independence and so on). A higher score signifies more transparent policy environment and higher governance efficiency, which are beneficial to provide good policy incentives for international trade.
- (4)
- Finance and e-commerce: This indicator measures the convenience of financial services and the development of e-commerce, and consists of five second-level indicators (convenience and affordability of financial services, availability of new technology and so on). A higher score denotes more mature financial markets, and wider application of new technologies and e-commerce, which may provide a good platform of financial services and technical support for international trade.
Firstly, the linear transformation method, in which each second-level indicator is divided by its possible maximum value, was adopted to standardize the indicators, that is, , where is the standardized indicator ranged 0 to 1, is the original value of indicator j, and is the maximum value that j could reach [11,19]. Secondly, the weight of each indicator was assigned through principal component analysis, and the three principal components Comp1, Comp2 and Comp3, covering more than 85% information of the 17 s-level indicators, were extracted by Stata (see Table 2). Afterwards, the coefficient of each principal component to an indicator was multiplied by the contribution rate of each principal component and divided by the cumulative contribution rate of three principal components. Finally, the results were added and normalized. Thus, a comprehensive system of annual trade facilitation indicators was obtained.
Table 2.
Coefficient composition of principal component indicators.
2.2.2. Decomposition of Ternary Margins of Export Growth
The extensive margin of export growth reflects the variety of export products and the quantity of export enterprises, while the price and quantity margins respectively reflect changes in the quality and quantity of export products. This study followed the calculation method of Shi Bingzhan, and decomposed China’s respective export growths of forest products to 13 countries along the “Belt and Road” into extensive margins and intensive margins (the latter encompassing price and quantity margins) [33]. The specific calculation process is as follows:
Firstly, we define the extensive margin () and the intensive margin ():
where j represents the exporting country (China), m represents the importing countries (13 countries along the “Belt and Road”), and r represents the reference country (the world). The condition for selecting the reference country is that the quantity and variety of forest products exported by China to countries along the “Belt and Road” are less than their counterparts to the reference country, which as typical for such studies, is chosen to be the whole world. i stands for categories of forest products, represents the unit price of a forest product category, denotes the export quantity of a forest product category, represents the collection of forest products exported by the world to countries along the “Belt and Road”, and represents the collection of forest products exported by China to these countries. The extensive margin is the ratio of a country’s forest products imports from the world in the categories it imported from China, compared to total forest products it imported from the world. It reflects the variety of products China has covered. The intensive margin is the ratio of a country’s forest products import from China compared to that from the world, inside the categories it imported from China. It reflects China’s share in the markets of these categories.
Secondly, the intensive margin is further decomposed into the quantity and price margins. That is , where the price margin () stands for the weighted product of the ratio of China’s forest products export price to that of the world, and the quantity margin () stands for the weighted product of the ratio of China’s forest products export quantity to that of the world. The calculation formulas of the price margin and the quantity margin are as follows:
where is the weight, and stand for the share of China’s and the world’s forest product exports in the target market respectively. A greater quantity margin means a higher number of exported forest products, and a greater price margin indicates the products involve more technologies and better added values. As is typical, the world’s average price is set to 1. When the price margin is greater than 1, it means the products contain a higher level of technology than the global average, and the country is a technological leader. Conversely, a price margin lower than 1 indicates the technological content is below the world, and there is potential for further upgrades.
2.3. Calculation Results and Descriptive Analysis
2.3.1. Calculation Results of Trade Facilitation
We obtained the scores of trade facilitation by 13 countries along the “Belt and Road” from 2007 to 2016 (see Table 3). Their overall trade facilitation had been improved during the period of 2007 to 2016. Singapore had the highest level of trade facilitation, which was above 0.8 since 2014; United Arab Emirates was in the second place, whose score was between 0.7 and 0.8 during 2007 to 2013, and above 0.8 since 2014; Malaysia came in third, with a score from 0.6 to 0.8. However, many countries had scores below 0.6, such as Kazakhstan, Vietnam, the Philippines, India and Pakistan, which were comparatively low. In general, trade facilitation of most countries was still at a low level and had great potential to be improved.
Table 3.
The assessment results of trade facilitation.
2.3.2. Decomposition Results of Ternary Margins of Export Growth
Based on the decomposition results of ternary margins, the growth rates of intensive margins were greater than those of extensive margins, which demonstrated that the export growth of China’s forest products mainly depended on the growth of depth. The extensive margins of China’s forest products export to other countries were stable, except for Indonesia, and the intensive margins showed an overall fluctuating upward trend. Affected by the financial crisis from 2008 to 2009, the intensive margins of China’s forest products export to most countries showed some extents of decline, and had notable increases in 2011 (as is shown in Figure 1 and Figure 2 (due to space limitations, this paper only lists the decomposition results of ternary margins of 9 countries)). We then decomposed the intensive margins into price and quantity margins, which showed that the growth rates of quantity margins were faster than those of price margins. Besides, the fluctuation trends of quantity margins and intensive margins were consistent, while the price margins were relatively stable, showing small fluctuations and rising trends. This indicated that the competitive advantage of China’s exported forest products had been increasing, but the “low price and high quantity” export growth pattern was still maintained. Moreover, except for a few cases such as Poland and Singapore, the price margins of China’s forest products export to most countries were less than 1 (see Figure 3 and Figure 4), which demonstrated that China’s current forest products export relied on raw materials and middle products with low added values, and the room for industrial upgrade was considerable.
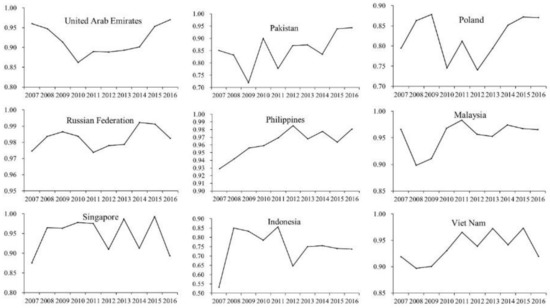
Figure 1.
Extensive margins of China’s forest products export to countries along the “Belt and Road”.
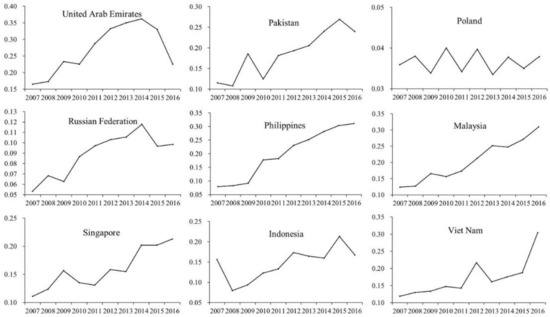
Figure 2.
Intensive margins of China’s forest products export to countries along the “Belt and Road”.
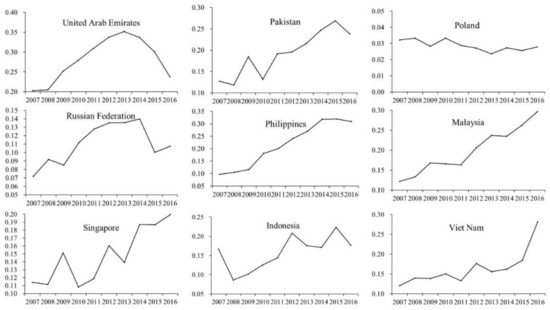
Figure 3.
Quantity margins of China’s forest products export to countries along the “Belt and Road”.
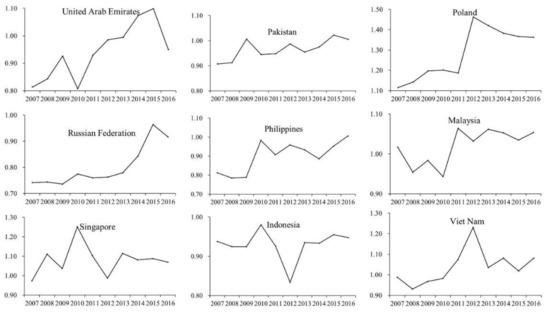
Figure 4.
Price margins of China’s forest products export to countries along the “Belt and Road”.
3. Model Setting and Variable Definition
Assuming that the implementation of trade facilitation measures would have an impact on the ternary margins of forest products export growth, we introduced the trade facilitation indicators into the extended gravity model. We also took the economic development characteristics of 13 countries along the “Belt and Road” into account and incorporated Shanghai Cooperation Organization (SCO), China-ASEAN (Association of Southeast Asian Nations) Free Trade Area (CAFTA) and Asia-Pacific Economic Cooperation Organization (APEC) as policy dummy variables. The models are set up as follows:
where i represents China and j represents 13 countries along the “Belt and Road”. denote the extensive, intensive, quantity and price margins of China’s export growth to country j respectively. represents the trade facilitation of country j. The improvement of trade facilitation in target countries can reduce the cost of trade and promote the export growth of ternary margins. is the gross domestic product of country j. Higher GDP suggests a country has more appetite for imports, which is beneficial to the growth of ternary margins. is the total population of country j. A larger population means a bigger market. However, it may also imply deeper domestic division of labors, which reduces the quantities and types of trade demands, and in turn lowers the extensive and quantity margins. is the geographical distance between China and country j, and is the dummy variable of whether two countries are adjacent to each other. The further the distance, the higher the transportation costs between the two countries, which lowers the extensive and quantity margins, and raises the price margin. represents the economic openness of country j. The more open a target country is, the more favorable it is to develop bilateral trade and promote the growth of ternary margins. However, openness may also have an adverse impact on China’s export growth due to the increase of alternative countries from which the target country imports. stands for the exchange rate between country j and China. Devaluation is conducive to increase the quantity margin, but may reduce the price margin. indicates whether China and country j have signed a free trade agreement. , and denote whether country j participates in the Shanghai Cooperation Organization, China-ASEAN Free Trade Area or Asia-Pacific Economic Cooperation organization. Bilateral free trade agreements and regional economic integration organizations could reduce trade costs by lowering trade barriers and eliminating restrictions on the flows of goods and factors. As a result, export diversity would be expanded, so the extensive margin and quantity margin would increase, while price margin would decrease. is the constant term, , … are elastic coefficients, is the unobservable random variable, and is the random error. The specific explanatory variables are shown in Table 4.
Table 4.
The meaning and expected symbols of explanatory variables.
4. Empirical Results
Panel data regression was conducted on the influence of trade facilitation on the extensive, intensive, quantity, and price margins of China’s forest products exports to 13 countries along the “Belt and Road” from 2007 to 2016. Firstly, the unit root tests and residual diagnostics had been constructed to make sure the stationarity of the variables and model. The results showed that the variables didn’t include unit roots (p < 0.05) and there was no cross sectional independence but autocorrelation in the model (see Appendix Table A1 and Appendix Table A2). As a result, to avoid the problem caused by autocorrelation and heteroskedasticity, the model was regressed with robust standard errors (see Appendix Table A3). Secondly, global Moran’s I had been calculated to test whether any spatial autocorrelation existed in the model. The results showed that except for a few parts of the year, the Moran’s I value of the dependent variables could all accept the original hypothesis of “no spatial autocorrelation” (see Appendix Table A4). Thirdly, with consideration for Hausman test results (p > 0.05) and specific research problems (small n and large T could be one reason for using random effect model in our study; in addition, the trade facilitation variable has very small variation for some countries, which could be another reason), the random effect model was selected. Additionally, previous studies had shown that the increase of trade flows might improve infrastructure and customs clearance efficiency which would result in further trade facilitation. To avoid the endogeneity problem that may arise from the interaction of trade facilitation and export growth structure, we used the first-order lag of each trade facilitation indicator as instrument variables after consulting existing research on the selection of instrument variables [15,34]. It is worth mentioning that the number of instrument variables in the model was equal to the number of endogenous explanatory variables, which was exactly recognized and unable to verify the externality of instrument variables. Theoretically, there was no reciprocal causation relationship between the lag of trade facilitation and the current ternary margins, and the effects of trade facilitation measures such as improving infrastructures and institutional environment couldn’t be accomplished rapidly. Therefore, the improvement of trade facilitation in the previous period could promote the current trade facilitation, influencing the structure of export growth in current period sequentially. The results of 2SLS panel data regression with robust standard errors are shown in Table 5.
Table 5.
The results of 2SLS panel data regression with robust standard errors.
The regression results from Table 5 showed that, for every 1% increase in trade facilitation, the intensive margin would increase by 2.192%, which indicated that the facilitation measures could effectively improve the trade volume of enterprises within the fixed categories of export products. Decomposing the intensive margin into price and quantity margins, we could see that the increase of trade facilitation had a significant impact on both at 1% and 5% significance levels respectively. Moreover, for every 1% increase in trade facilitation, the quantity margin would increase by 3.056%, and the price margin by 1.065%. This implied that the improvement of trade facilitation could not only significantly increase the number of export products, but also continuously promote the transformation of the economic growth mode as well as the upgrade of trade in forest products driven by quality improvement of export products. By contrast, trade facilitation had no significant impact on the extensive margin. This is because China has a relatively rich export category list of forest products to countries along the “Belt and Road” which basically covers all types of forest products, so there is little space for further growth of the variety of China’s forest products export at the present developmental stage of forestry processing industry.
To be specific, trade facilitation measures mainly include the improvement of port efficiency, the optimization of the customs and institutional environments, and the development of finance and e-commerce. Firstly, the improvement of port efficiency is mainly reflected in the improvement of infrastructure such as roads, railways, airports and ports. For China, the improvement of infrastructure in other countries will enhance customs clearance efficiency, reduce the transportation costs, and expand the coverage of transported products. It can also greatly arouse the enthusiasm of China’s forest products export enterprises, thus increasing the quantity margin of export growth. Besides, it may accelerate the technology spillover effect of trade and FDI, which will lead to technological innovation of export products and a higher price margin. For countries along the “Belt and Road”, the improvement of domestic transportation can save the storage costs of importing enterprises, which is beneficial to the growth of quantity of imported forest products. Secondly, the improvement in the customs environment is mainly reflected in the reduction of trade barriers and the simplification of customs procedures. For China, the optimization of the customs environment of countries along the “Belt and Road” can reduce the cost of customs clearance, ease the burden of customs procedures and save the time cost, thus promoting the increase of export volume. From the perspective of countries along the “Belt and Road”, the improvement of customs efficiency can also reduce the cost of warehousing, lower trade barriers and increase the number of their imports. Thirdly, the institutional environment mainly involves items such as policy transparency and judicial efficiency. It can lower the intangible transaction costs due to the uncertainty of contract execution by creating a good business environment and reducing information asymmetry. If the institutional environment of countries along the “Belt and Road” is improved, export enterprises can obtain trade policies and regulations of importing countries more quickly, thus reducing indirect transaction costs caused by differences in market and technology access of forest products. Fourthly, the development of finance and e-commerce can greatly reduce geographical restrictions. For China, the application of information technology can save customs clearance time and manpower cost, and increase the number of forest products exports, while the development of internet-based finance can provide platforms for more streamlined financial services that help export enterprises to improve their business model and product quality. For countries along the “Belt and Road”, the development of domestic finance and e-commerce will increase the diversified demands of forest products and promote the quantity and types of imports.
At the same time, the results also showed that in addition to trade facilitation, GDP had a positive impact on extensive and quantity margins, but a negative impact on the price margin, in contrast to the expected symbol. This is mainly because countries with higher GDP have greater demands for high-value-added products, while China’s exported forest products have low added values, and sell for relatively low prices on their markets. Countries with larger populations have greater demand for goods, but may also need fewer types and quantities of imports due to having sophisticated domestic divisions of labor. Geographical distance had a significantly negative effect on extensive and quantity margins, but a positive effect on the price margin. It indicated the lower transportation costs over shorter distances could increase the number and types of exported forest products. Economic openness had a significantly negative impact on the extensive and quantity margins, but a positive one on the price margin. This is because countries with higher economic openness have more diversified importing partners, and the increase of their alternative importing countries will reduce the proportion of forest products imported from China, which encourages China’s export enterprises to improve the quality of their products and raise the price margin. The devaluation of the RMB is helpful to increase the number and variety of forest products exported, but may also lower the export prices, resulting in a negative price margin. FTA had a negative effect on the three margins. That is to say, although bilateral free trade agreements can reduce trade barriers and transaction costs, they may reduce the quantity and types of imports if they are different enough from the target countries’ demands. Regional economic integration organizations had uncertain impacts on extensive margin, quantity margin and price margin. On the one hand, these organizations could promote the transformation and upgrade of regional businesses via unified and coordinated economic policies. These policies can potentially help increase the quality, quantity and variety of China’s forest product exports. On the other hand, a unified and open market will greatly increase the regional demands for forest products between member countries, which could reduce the demands for Chinese imports, thus lowering their prices.
5. Conclusions and Implications
This paper divided China’s export growth of forest products into extensive margins (variety), quantity margins (quantity) and price margins (quality), and discussed how trade facilitation impacted its growth structure from the perspective of ternary margins. Our research constructed an evaluation system of trade facilitation and applied principal component analysis to measure the levels of trade facilitation of 13 countries with large trade flows of forest products with China along the “Belt and Road”. In addition, we used transnational panel data and the extended gravity model to analyze the impacts of trade facilitation of these countries on the ternary margins of China’s export growth from 2007 to 2016 and selected the first-order lags of trade facilitation indicators as instrument variables to overcome the endogeneity of the model. The decomposition results of ternary margins showed that although the competitive advantage of China’s forest products trade had been increasing, the traditional “low price and high quantity” export growth pattern had remained. In addition, there were great variations in the levels of trade facilitation between some of these countries, and the 2SLS regression results demonstrated that the improvement of trade facilitation had a significantly positive impact on the quantity margins and price margins, but no significant impact on the extensive margins. This indicated that the improvement of trade facilitation could not only significantly increase the number of exported forest products, but also continuously promote the transformation and upgrade of the trade growth pattern, driven by the increasing quality of exported forest products. Based on the results of this study and the current state of China’s forest products trade, we propose the following policy recommendations.
Firstly, policymakers may need to pay more attention to the structure of the forest products trade rather than to trade flows alone. To stimulate China’s export growth of forest products to countries along the “Belt and Road” at its roots, the industry needs to innovate, and leverage its price advantage into greater competitive advantage. Our results have shown that China’s forest products exports had a lower price margin than the global average, and it still occupies a middle-to-low-end position along the global value chain. Therefore, China has a need to move upward, transforming itself from a major exporter of forest products by quantity to one by quality. To achieve the goal, enterprises in the industry may need a supply-side structural reform, becoming more flexible exporters capable of swiftly adjusting the production structure of forest products with changing market demands. The turn from low prices to real competitive advantage also calls for more efficiency in allocating forest resources, and higher added values on forest products.
Secondly, China needs to make differentiated investments to countries along the “Belt and Road” based on their different levels of trade facilitation. We found huge differences in trade facilitation by countries along the “Belt and Road”, as well as room for improvement for each country. It can be more optimal to invest more in infrastructure in countries such as the Philippines, Vietnam and Pakistan which have low levels of trade facilitation, in order to accelerate their infrastructure connectivity, via the Silk Road Fund, the Asian Infrastructure Investment Bank and other financing platforms. In addition, it may be beneficial for countries along the “Belt and Road” to streamline their customs clearance procedures by reducing the number of trade documents and promoting paperless customs clearance. Other useful measures for these countries may include building forest product trade databases, improving the efficiency and quality of customs trade data collection, and optimizing their customs environments. Furthermore, China should work with countries along the “Belt and Road” to build a good regulatory environment, improve the transparency of trade policies and the capability of law enforcement, and try to set up a sharing platform of digital information for the policies, regulations and measures of the forest products trade. More importantly, export enterprises of forest products should be promoted to adopt new trade patterns, such as cross-border e-commerce, to achieve continuous improvement and innovation for exported products. An internet-based network system of logistics, information and technology exchange may be built for the forest products industry. These measures may help promote constant product quality improvement and export growth structure optimization.
Thirdly, there should be better economic and trade communication with countries along the “Belt and Road” to achieve in-depth cooperation. The “Belt and Road” initiative has played a vital role in the development of China’s forest products trade, because many countries along the “Belt and Road” have rich forest resources and huge market potential, and the exploration of new forest products trade channels has provided the industry with opportunities for transformation and upgrade. However, these countries vary greatly in economic development, natural, cultural and business environments, and trade facilitation. More cooperation, investments and technical exchange with them are needed to help China’s forest product exporters move upward along the global value chain. Economic organizations may also play a role in providing financial and technical assistance to a number of underdeveloped countries, helping them build public service facilities and develop electronic commerce that can accelerate flows of factors, goods and services, allocate resources with greater efficiency, and reach deeper into markets. Countries along the “Belt and Road” should also be encouraged to participate in trade facilitation activities organized by international and regional organizations, and acquire more knowledge about trade facilitation.
Author Contributions
J.Z. performed calculation, analyzed the data and wrote the paper. F.L. verified and solidified the argument, edited the paper and drafted the conclusions. Y.L. and B.C. revised the manuscript during the whole writing process. All authors contributed to the drafting of the article and read the final manuscript.
Funding
This research is funded by the National Natural Science Foundation of China (Grant No. 71873016); the National Key Research and Development Program of China (Grant No. 2016YFA0602500); Beijing Social Science Foundation (Grant No. 17YJB016); Beijing Forestry University New Teachers Research Foundation Project (Grant No. BLX201728); Strategic Priority Research Program of Chinese Academy of Sciences (Grant No. XDA20100104).
Conflicts of Interest
The authors declare no conflict of interest.
Appendix A
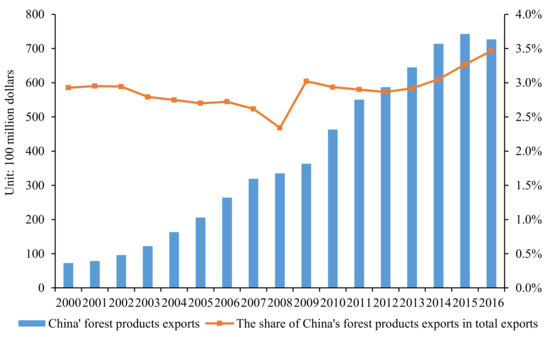
Figure A1.
China’s forest products exports and the share of China’s forest products exports in total exports.
Table A1.
The results of panel unit root tests.
Table A1.
The results of panel unit root tests.
| Harris-Tzavalis Unit-Root Test | ||||
|---|---|---|---|---|
| Statistic | −0.1027 | −0.2512 | −0.0984 | 0.0163 |
| z | −4.8224 | −6.3214 | −4.7786 | −3.6206 |
| p-value | 0.0000 | 0.0000 | 0.0000 | 0.0001 |
| Im-Pesaran-Shin Unit-Root Test | ||||
| t-bar | −3.3311 | −3.6568 | −3.2898 | −2.7871 |
| t-tilde-bar | −2.0107 | −1.9517 | −1.6614 | −1.9924 |
| Z-t-tilde-bar | −3.6802 | −3.3852 | −1.9350 | −3.5884 |
| p-value | 0.0001 | 0.0004 | 0.0265 | 0.0002 |
Table A2.
The results of panel data residual diagnostics.
Table A2.
The results of panel data residual diagnostics.
| Wooldridge Test for Autocorrelation in Panel Data | ||||
|---|---|---|---|---|
| F-Statistic | 5.398 | 0.159 | 1.802 | 5.334 |
| p-value | 0.0385 | 0.6968 | 0.2043 | 0.0395 |
| Pesaran’s Test for Cross Sectional Independence | ||||
| Statistic | −0.43 | 0.369 | −1.107 | 1.176 |
| p-value | 0.6671 | 0.7122 | 0.2682 | 0.2395 |
Table A3.
The results of OLS (ordinary least squares) panel data regression with robust standard errors.
Table A3.
The results of OLS (ordinary least squares) panel data regression with robust standard errors.
| 0.137 | 1.116 ** | 2.623 ** | 0.742 *** | |
| (0.078) | (0.478) | (1.264) | (0.199) | |
| −0.001 | 0.487 *** | 0.323 | −0.068 | |
| (0.047) | (0.140) | (0.261) | (0.046) | |
| −0.046 | −0.366 ** | −0.766 *** | 0.103 | |
| (0.036) | (0.165) | (0.184) | (0.068) | |
| −0.222 *** | −1.070 *** | −1.603 *** | 0.131 | |
| (0.077) | (0.399) | (0.330) | (0.165) | |
| −0.094** | −0.469 | −1.735 *** | 0.066 | |
| (0.041) | (0.334) | (0.572) | (0.101) | |
| 0.020 *** | −0.029 | 0.035 | −0.028 | |
| (0.003) | (0.033) | (0.026) | (0.020) | |
| 0.108 *** | 0.235 | 0.851 *** | −0.103 | |
| (0.028) | (0.291) | (0.305) | (0.138) | |
| −0.161 *** | 0.281 | −0.902 | −0.004 | |
| (0.028) | (0.307) | (0.603) | (0.160) | |
| −0.089 | −0.776 ** | −2.146 *** | 0.105 | |
| (0.076) | (0.312) | (0.514) | (0.222) | |
| 0.024 | 0.187 | −0.051 | 0.051 | |
| (0.020) | (0.129) | (0.118) | (0.031) | |
| 0.180 *** | −0.049 | 1.407 ** | −0.167 | |
| (0.025) | (0.371) | (0.631) | (0.143) | |
| _cons | 2.646 *** | 0.848 | 17.430 * | −0.683 |
| (0.364) | (4.434) | (9.067) | (2.097) | |
| R-squared | 0.592 | 0.620 | 0.634 | 0.173 |
Note: Robust standard errors are in parentheses. Significance levels are: *** = 1%, ** = 5%, * = 10%.
Table A4.
The results of global spatial autocorrelation test (Moran’s I).
Table A4.
The results of global spatial autocorrelation test (Moran’s I).
| Variable | Year | Moran’I | E(I) | sd(I) | z | p-Value |
|---|---|---|---|---|---|---|
| 2007 | −0.392 | −0.083 | 0.244 | −1.262 | 0.207 | |
| 2008 | −0.294 | −0.083 | 0.373 | −0.564 | 0.573 | |
| 2009 | 0.135 | −0.083 | 0.336 | 0.652 | 0.514 | |
| 2010 | −0.667 | −0.083 | 0.386 | −1.513 | 0.130 | |
| 2011 | −0.694 | −0.083 | 0.398 | −1.536 | 0.124 | |
| 2012 | −0.503 | −0.083 | 0.356 | −1.180 | 0.238 | |
| 2013 | −0.232 | −0.083 | 0.405 | −0.368 | 0.713 | |
| 2014 | 0.086 | −0.083 | 0.387 | 0.439 | 0.661 | |
| 2015 | −0.248 | −0.083 | 0.380 | −0.434 | 0.664 | |
| 2016 | −0.310 | −0.083 | 0.379 | −0.599 | 0.549 | |
| 2007 | 0.711 | −0.083 | 0.396 | 2.005 | 0.045 | |
| 2008 | 0.496 | −0.083 | 0.380 | 1.526 | 0.127 | |
| 2009 | 0.503 | −0.083 | 0.396 | 1.480 | 0.139 | |
| 2010 | 0.396 | −0.083 | 0.375 | 1.277 | 0.202 | |
| 2011 | 0.332 | −0.083 | 0.388 | 1.070 | 0.285 | |
| 2012 | 0.380 | −0.083 | 0.388 | 1.195 | 0.232 | |
| 2013 | 0.320 | −0.083 | 0.378 | 1.067 | 0.286 | |
| 2014 | 0.314 | −0.083 | 0.384 | 1.036 | 0.300 | |
| 2015 | 0.460 | −0.083 | 0.390 | 1.391 | 0.164 | |
| 2016 | 0.414 | −0.083 | 0.391 | 1.271 | 0.204 | |
| 2007 | 0.530 | −0.083 | 0.383 | 1.603 | 0.109 | |
| 2008 | 0.287 | −0.083 | 0.345 | 1.073 | 0.283 | |
| 2009 | 0.325 | −0.083 | 0.364 | 1.121 | 0.262 | |
| 2010 | 0.197 | −0.083 | 0.357 | 0.786 | 0.432 | |
| 2011 | 0.133 | −0.083 | 0.362 | 0.598 | 0.550 | |
| 2012 | 0.167 | −0.083 | 0.360 | 0.695 | 0.487 | |
| 2013 | 0.126 | −0.083 | 0.356 | 0.587 | 0.557 | |
| 2014 | 0.156 | −0.083 | 0.361 | 0.663 | 0.508 | |
| 2015 | 0.400 | −0.083 | 0.382 | 1.264 | 0.206 | |
| 2016 | 0.316 | −0.083 | 0.382 | 1.046 | 0.296 | |
| 2007 | −0.526 | −0.083 | 0.399 | −1.108 | 0.268 | |
| 2008 | −0.017 | −0.083 | 0.393 | 0.170 | 0.865 | |
| 2009 | 0.065 | −0.083 | 0.394 | 0.377 | 0.706 | |
| 2010 | 0.175 | −0.083 | 0.395 | 0.654 | 0.513 | |
| 2011 | 0.169 | −0.083 | 0.381 | 0.664 | 0.507 | |
| 2012 | −0.691 | −0.083 | 0.358 | −1.697 | 0.090 | |
| 2013 | −1.243 | −0.083 | 0.350 | −3.315 | 0.001 | |
| 2014 | −0.490 | −0.083 | 0.370 | −1.098 | 0.272 | |
| 2015 | −0.702 | −0.083 | 0.341 | −1.814 | 0.070 | |
| 2016 | −0.843 | −0.083 | 0.345 | −2.202 | 0.028 |
References
- Engman, M. The Economic Impact of Trade Facilitation; OECD Trade Policy Papers; OECD: Paris, France, 2009; pp. 92–128. [Google Scholar]
- Cheng, B.D.; Qin, G.Y.; Song, W.M. The development and transformation of China’s forest products trade under the strategic background of the “Belt and Road”. Int. Trade 2015, 3, 22–25. (In Chinese) [Google Scholar]
- Tian, G.; Wu, T.B.; Zhang, B. The potential analysis of wood forest products trade of China with countries along the “Silk Road Economic Belt”: An empirical study based on the gravity model. For. Econ. 2018, 7, 49–55. (In Chinese) [Google Scholar]
- Moïsé, E.; Sorescu, S. Trade Facilitation Indicators: The Potential Impact of Trade Facilitation on Developing Countries’ Trade; OECD Trade Policy Papers; OECD: Paris, France, 2013. [Google Scholar]
- Speeding Up Trade: Benefits and Challenges of Implementing the WTO Trade Facilitation Agreement; World Trade Report; WTO: Geneva, Switzerland, 2015.
- Raven, J. Trade and Transport Facilitation: A Toolkit for Audit, Analysis and Remedial Action; World Bank: Washington, DC, USA, 2001. [Google Scholar]
- Wilson, J.S.; Mann, C.L.; Otsuki, T. Trade facilitation and economic development: A new approach to quantifying the impact. World Bank Econ. Rev. 2003, 17, 367–389. [Google Scholar] [CrossRef]
- Portugal-Perez, A.; Wilson, J.S. Export Performance and Trade Facilitation Reform: Hard and Soft Infrastructure. World Dev. 2012, 40, 1295–1307. [Google Scholar] [CrossRef]
- De Sá Porto, P.C.; Morini, C. Trade Facilitation, the Authorized Economic Operator and the Single Window: A Gravity Model Approach. In Proceedings of the Inaugural INCU (International Customs Universities) Global Conference, Baku, Azxerbaijan, 21–23 May 2014. [Google Scholar]
- Li, B.; Duan, Y. Trade facilitation assessment and its impact on China’s service trade exports: Based on transnational panel data empirical research. Int. Bus. 2014, 1, 5–13. (In Chinese) [Google Scholar]
- Kong, Q.F.; Dong, H.W. Measurement of trade facilitation and trade potential of countries along the “Belt and Road”. J. Int. Trade 2015, 12, 158–168. (In Chinese) [Google Scholar]
- Zhu, J.B.; Lu, J. Research and application of trade facilitation evaluation indicator system. J. Hunan University (Social Science Edition) 2015, 6, 70–75. (In Chinese) [Google Scholar]
- Sun, L.; Ni, K. The impact of ASEAN trade facilitation on China’s agricultural exports and international comparison: An empirical analysis based on panel data model. J. Int. Trade 2013, 4, 139–147. (In Chinese) [Google Scholar]
- Sun, L.; Xu, X.F. An empirical analysis on the impact of ASEAN trade facilitation on China’s manufacturing exports. J. Int. Trade 2011, 8, 101–109. (In Chinese) [Google Scholar]
- Dong, Y.G.; Wu, X.Y. The impact of trade facilitation on China’s exports: A case study of the “Silk Road Economic Belt”. Int. Bus. 2017, 2, 26–37. (In Chinese) [Google Scholar]
- Guo, X.H.; Dai, P.P. Research on China’s financial services trade facilitation based on gravity model: From the perspective of China’s pilot free trade zone. Int. Bus. 2017, 6, 55–64. (In Chinese) [Google Scholar]
- Liu, Y.; Lü, Y.K.; Quan, S.P. The economic impact of trade facilitation under the “Belt and Road” strategy: A study of the trade between China and Kazakhstan based on GTAP model. Econ. Rev. 2016, 6, 70–83. (In Chinese) [Google Scholar]
- Iwanow, T.; Kirkpatrick, C. Trade Facilitation and Manufactured Exports: Is Africa Different? World Dev. 2009, 37, 1039–1050. [Google Scholar] [CrossRef]
- Iwanow, T.; Kirkpatrick, C. Trade facilitation, regulatory quality and export performance. J. Int. Dev. 2010, 19, 735–753. [Google Scholar] [CrossRef]
- Shepherd, B.; Wilson, J.S. Trade facilitation in ASEAN member countries: Measuring progress and assessing priorities. J. Asian Econ. 2009, 20, 367–383. [Google Scholar] [CrossRef]
- Dennis, A. The Impact of Regional Trade Agreements and Trade Facilitation in the Middle East North Africa Region; Policy Research Working Paper; World Bank Publications: Washington, DC, USA, 2006; pp. 1–24. [Google Scholar]
- ZAKI, C. An empirical assessment of the trade facilitation initiative: The econometric evidence and global economic effects. World Trade Rev. 2014, 13, 103–130. [Google Scholar] [CrossRef]
- Dee, P.S.; Ferrantino, M.J. Quantitative Methods for Assessing the Effects of Non-Tariff Measures and Trade Facilitation; CO-PUBLISHED WITH APEC SECRETARIAT; World Scientific: Singapore, 2005. [Google Scholar]
- Francois, J.; Van Meijl, H.; Van Tongeren, F. Trade liberalization in the Doha Development Round. Econ. Policy. 2005, 20, 349–391. [Google Scholar] [CrossRef]
- Shepherd, B.; Wilson, J.S. Trade, Infrastructure, and Roadways in Europe and Central Asia: New Empirical Evidence. J. Econ. Integr. 2007, 22, 723–747. [Google Scholar] [CrossRef]
- Zhang, X.J.; Li, L. The “Belt and Road” export trade with China: Based on trade facilitation perspective. Asia Pac. Econ. 2015, 3, 21–27. (In Chinese) [Google Scholar]
- Zhang, Y.B.; Liu, J. Trade facilitation measurement of the “Silk Road Economic Belt” and China’s trade potential. Financ. Sci. 2016, 5, 112–122. (In Chinese) [Google Scholar]
- Maria, P. Trade Facilitation and the Extensive Margin; IFN Working Paper. No. 828; Research Institute of Industrial Economics (IFN): Stockholm, Sweden, 2010. [Google Scholar]
- Feenstra, R.C.; Ma, H. Trade Facilitation and the extensive margin of Exports. Jpn. Econ. Rev. 2014, 65, 158–177. [Google Scholar] [CrossRef]
- Dennis, A.; Shepherd, B. Trade Costs, Barriers to Entry, and Export Diversification in Developing Countries; Policy Research Working Paper; World Bank Publications: Washington, DC, USA, 2016; pp. 1–42. [Google Scholar]
- Yin, B.Q.; Xiao, W. Trade facilitation affects the complexity of export technology: Based on the 2002–2014 inspection of Provincial panel samples. Sci. Technol. Manag. 2016, 37, 73–81. (In Chinese) [Google Scholar]
- Wilson, J.S.; Mann, C.L.; Otsuki, T. Assessing the benefits of trade facilitation: A global perspective. World Econ. 2005, 28, 841–871. [Google Scholar] [CrossRef]
- Shi, B.Z. The ternary margin of China’s export growth. Economics 2010, 7, 1311–1329. (In Chinese) [Google Scholar]
- Sun, L.; Lan, M.; Zhong, Y. The impact of trade facilitation on the availability of cereals in China and the ASEAN region: An examination of the perspective of import trade flows. Agric. Technol. Econ. 2015, 1, 111–119. (In Chinese) [Google Scholar]
© 2019 by the authors. Licensee MDPI, Basel, Switzerland. This article is an open access article distributed under the terms and conditions of the Creative Commons Attribution (CC BY) license (http://creativecommons.org/licenses/by/4.0/).