Temporal Downscaling of IDF Curves Applied to Future Performance of Local Stormwater Measures


Department of Civil and Environmental Engineering (IBM), Norwegian University of Science and Technology (NTNU), N-7491 Trondheim, Norway
*
Author to whom correspondence should be addressed.
Sustainability 2019, 11(5), 1231; https://doi.org/10.3390/su11051231
Submission received: 7 January 2019
/
Revised: 19 February 2019
/
Accepted: 21 February 2019
/
Published: 26 February 2019
(This article belongs to the Section Sustainable Urban and Rural Development)
Abstract
:Low-impact development (LID) structures are combined with traditional measures to manage stormwater and cope with increased runoff rates originating from heavy urbanization and climate change. As the use of LIDs for climate adaptation increases, practitioners need more knowledge on LID performance in future climates for successful planning and implementation. In this study, temporal downscaling of regional climate projections for three cities in Norway is performed, using the concept of scale invariance to downscale the distribution of extreme precipitation from daily to sub-daily timescales. From this, local-scale intensity-duration-frequency (IDF) curves for future precipitation were obtained. Using climate projections of daily temporal resolution as input to water balance models and the obtained IDF relationships as input to event-based models allowed for assessing the retention capacity, peak flow reduction potential and pollution control of three different types of LIDs: green roofs, bioretention cells, and detention basins. The downscaling resulted in large local variations in presumed increase of both precipitation amount and intensity, contradicting current design recommendations in Norway. Countrywide, a decrease in the overall LID performance was found, although some positive effects of temperature rises were detected. The study illustrated the importance of evapotranspiration- and infiltration-based processes in future stormwater management and how coupling of LID structures in series can significantly reduce required detention volumes.
1. Introduction
Modern stormwater management is aimed at reducing the disadvantages caused by urbanization by maintaining or restoring the predevelopment site hydrology [1]. Urbanization, with an increase of impervious areas, and the introduction of piped systems for stormwater have reduced the evapotranspiration rates, reduced the rate of infiltration to native soil and increased the surface runoffs both with respect to volumes and peak flows. It is expected that the impacts of increased runoff rates will be further induced as a consequence of more frequent and intense precipitation events caused by climate change [2,3]. A stormwater management that counteracts the effects of both urbanization and climate change is needed.
To cope with urbanization, stormwater at-site control was introduced in the 1980s resulting in a large development of distributed stormwater measures [4]. The management was first solely aimed at reducing flooding by peak flow control but has shifted over the past few decades to an approach with multiple objectives related to mitigating the changes in urban hydrology, improving the water quality of receiving waters and delivery of multiple benefits [5]. This approach has been given several different terms like low-impact development (LID), best management practices (BMP), and sustainable urban drainage systems (SUDS) and will in this paper be referred to as LIDs.
Peak flow control has commonly been solved by the use of distributed (site scale) or centralized (catchment scale) detention volumes. Peak flow control can contribute to reduced surface flooding, reduced erosion in natural waterways and reduced capacity problems in downstream piped systems associated with cellar flooding and combined sewer overflows. Challenges to the fixed-flow regulations alone are that they do not counteract the reduced infiltration and evapotranspiration rates, remove pollutants or restore the downstream low-flow regimes, and in some cases, unfortunate superposition of hydrographs might increase peak flows on a large scale and increase combined sewer overflows [1,4,6,7,8].
Volume control of stormwater runoff is important to restore predevelopment site hydrology and can also contribute to flood control, pollutant control and reduced sewer overflows [4,6,7,9]. The main processes involved in volume control are reduction of stormwater runoff volumes by evapotranspiration and infiltration, often achieved by introducing LID structures. Studies investigating implementation of LID structures on a catchment scale have found these to be efficient in restoring pre-development hydrological conditions and protecting the ecology in receiving waters for small and medium-size precipitation events, while for large design storms additional measures are needed to prevent flooding [8,10,11,12]. Performance of LID measures are found to vary with several factors, such as type and design of measure, initial saturation [13], precipitation characteristics [14,15] and location in the watershed [16].
Despite the increased knowledge on the disadvantages of applying solely peak flow control regulation on stormwater management, many cities, among those, large Norwegian cities, are focusing the design on large design events, while volume control and pollution control are requested but not quantified in the regulations [17,18,19]. This has resulted in comprehensive establishment of detention basins, while the introduction of other stormwater measures focusing on volume and pollution control has been limited [4,7]. This trend is currently changing and there is a growing interest in a wider variety of stormwater measures and their suitability for local climates and conditions [20,21,22].
However, city growth and climate change will increase the future challenges associated with stormwater management [23,24] and the extended focus to volume and pollution control alone is not enough to obtain a sustainable stormwater management. Regardless of the type of stormwater measure, it must be fit to meet future climates and there is a need for more knowledge on how the different stormwater measures perform both alone and together, in present and future climate, to assure resilient stormwater systems for a future climate. Changes in precipitation patterns and temperature might both affect future design values, as well as altering the hydrological processes that comprise stormwater management. This implies that optimal solutions in present climate are not necessarily optimal in a future climate. To investigate this, knowledge on future climate conditions is necessary. This knowledge is, however, very limited at the local and temporal scale needed for such assessments and there is a gap between available climate information provided by climate research and the information demanded by end-users [25].
To date, the primary source to projections of the future climate, is output of global climate models (GCMs), which are models that simulate the climatic response to scenarios of greenhouse gas emissions (referred to as Representative Concentration Pathways (RCPs)). On a political scale, much information can be drawn from the output of these models, but due to the models’ complexity and substantial computational need, the spatial and temporal resolutions of the output are too coarse for the model output to be directly applied to stormwater purposes [25].
To resolve this, techniques for downscaling GCM output to an applicable temporal and spatial resolution have emerged. They are usually grouped into two main categories: (1) dynamical downscaling and (2) statistical downscaling [25,26], where (1) involves nesting of a fine-gridded regional climate models within selected boundaries of the GCM output and (2) refers to establishing a statistical relation between large-scale and local-scale climate [27]. The main advantage of dynamical downscaling is that it is based on physical relations, while the main advantage of statistical approaches is that it is more easily applied and does not require expert knowledge of the climate systems nor extensive computer capacity. Recent advances in climate research and downscaling techniques have made fine-gridded output from regional climate models (RCMs) accessible through projects such as the Coordinated Downscaling Experiment—European Domain (EURO-CORDEX) [28]. The improved resolution provided by such regional climate projections is valuable in order to assess slow hydrological processes, such as evapotranspiration and infiltration, over a long period of time, but the temporal resolution of the projections is, however, still an obstacle when dealing with the rapid runoff experienced in urban areas. Hence, further temporal downscaling of regional climate projections is needed in order to conduct a holistic investigation of stormwater measures’ performance in a future climate.
Existing approaches for temporal downscaling can be categorized into stochastic rainfall generation by point process theory, multifractal and cascade processes, and rainfall disaggregation [3]. Common design practice in Norway is usually based on design events, where the design precipitation intensity is chosen from IDF curves following local guidelines. IDF curves are constructed based on frequency analyses of observed precipitation and shows the relationship between the intensity and duration of extreme precipitation events for a range of return periods. Thus, methods for projecting future IDF statistics are of high end-user demand in Norway in order to be able to merge current design practice with considerations for the future. Some studies on temporal downscaling have focused explicitly on such, by using fractal theory and the concept of scale invariance to find a scaling relation between the distribution of extreme precipitation of various durations to project extreme rainfall for the future [29,30,31].
In Norway, one of these approaches [30] has been tested for weather stations in the cities of Bergen and Trondheim. In these studies, daily and sub-daily extremes were extracted from observational series as annual maxima (AMs), fitted to the generalized extreme value (GEV) distribution, and a scaling relationship was found between the GEV statistics of the daily and the sub-daily scales. In Bergen, the results of the scaling were found satisfying for durations as low as 15 min, but the bias increased significantly for lower durations [32]. In Trondheim, the Gumbel distribution (GEV 1) had to be assumed for the AMs due to unsatisfying fittings of the shape parameter [33]. The results suggest that further research on defining rainfall extremes on fine temporal scales and proper parameter estimation is needed in Norway to provide reliable climate projections that can be accounted for in planning of stormwater management [32,33].
The motivation of this study was to address the need for knowledge on long-term LID performance and bridging the gap between available and required climate information. To accomplish this, the methodology for temporal downscaling from regional climate projections to future IDF curves is further developed and performed for three Norwegian cities. The regional projections and IDF curves obtained are further used to investigate the efficiency of different stormwater measures and their suitability in the present and a future climate. Relevant regulations like peak flow control, volume runoff control and pollution control are applied to evaluate the performance of three stormwater measures according to the state-of-the-art holistic approach for stormwater management. The stormwater measures assessed are: (1) green roof, (2) bioretention cell, (3) detention basin. Both water balance models and event-based models are used such that all hydrological processes, rapid and slow, under climate change are explored. Specifically, this study seeks answer the following research questions:
- (1)
- What is the best suited method for constructing future IDF curves based on scaling laws;
- (2)
- Investigating how geographical variations will influence the performance of local stormwater measures in a future climate.
The structure of the succeeding sections of this paper reflects the two-folded research questions. Section 2, Materials and Methods, includes a description of the study sites (Section 2.1) and the input data to the assessments (Section 2.2), namely meteorological observations and regional climate projections. Subsequently, the temporal downscaling approach for projecting future IDF curves and construction of future design-events (Section 2.3) and the LID models used for assessing future performance (Section 2.4, Section 2.5 and Section 2.6) are described. Furthermore, the climate projections and results of the downscaling are presented and discussed in Section 3.1 and Section 3.2, and their implications for future LID performance in Section 3.3, Section 3.4 and Section 3.5. The work is concluded in Section 4, along with venues and recommendations for future work.
2. Materials and Methods
The defined research questions were addressed by coupling frameworks for temporal downscaling of climate projections with LID performance assessments (Figure 1). Observational data from three study sites in Norway was used for calculating extreme value statistics and establishing a scaling relationship between daily and sub-daily extreme precipitation (Step 1). The scaling relationship obtained was further applied to regional climate projections of daily precipitation for the same three sites (Step 2) to construct IDF curves of projected precipitation. Finally, the projected IDF curves and the projected daily precipitation series were used as input to design-event (DE) models and water balance (WB) models to assess the local stormwater measures’ event-based and long-term performance in a future climate, respectively (Step 3).
2.1. Study Sites
Norway is located in Scandinavia, Northern Europe, and characterized by its long and narrow shape, ranging from latitudes 57 to 71. This span of latitudes, along with an extensive coastline covering the western part of the country, contributes to large variations in local climate conditions, such as mild and wet coastal climates in the southwest and cold winters combined with hot summers, inland. Three cities have been selected for this study, in order to capture parts of the climate variability found in Norway. The selected cities, Bergen, Oslo, and Trondheim (Figure 2), are the three largest cities in the country. The climate in Bergen is characterized by mild temperatures and high amounts of annual rainfall, originating from a combination of frontal and orographic precipitation. In Trondheim and Oslo, the climates are more continental, with less precipitation and colder winters. For a more comprehensive description of the climates for the three selected cities, the reader is referred to Johannessen et al. (2017) [34].
2.2. Metrorological Input Data
Observations of precipitation were collected for the three study sites Bergen, Oslo, and Trondheim. The data was obtained from the Norwegian Meteorological Institute through the web portal www.eklima.no [36]. The currently operating stations with the longest records of minute data was selected (Table 1).
The climate projections used for temporal downscaling, were regional climate projections for Norway covering the time span 1971–2100 made available by the Norwegian Centre for Climate Services (NCCS). The data is from heron referred to as the NCCS data, and they originate from downscaling of 10 EURO-CORDEX GCM/RCM simulations by an empirical quantile mapping method [37]. The spatial resolution of the available data is 1 × 1 km and the temporal scale is daily, hence the need for temporal downscaling. All 10 simulations are available for RCP4.5 and RCP8.5, which refers to an intermediate level of emissions and high level of emissions, respectively. Since the future of human greenhouse gas emissions is unknown, the most conservative, worst case scenario was studied in this paper (RCP8.5). To capture some of the uncertainty associated with climate modelling, the full ensemble of the 10 simulations for RCP8.5 was used. The data used in this study included daily precipitation depth and daily average temperature.
2.3. Temporal Downscaling
The observations of fine time-scale rainfall were used to establish a scaling relation between the statistical properties of extreme daily and sub-daily precipitation. Assuming that the scaling relation found between observations also holds for the future, the obtained scaling relation was then applied to the projected daily precipitation (NCCS data) for the three study sites such that projections of the statistical properties of extreme sub-daily precipitation for the future period 1971–2100 was obtained.
The temporal downscaling of regional climate projections was based on fractal theory and the principle of scale invariance, which can be used to link the statistical properties of rainfall of different scales [38,39]. Fractal theory suggests that the statistical properties of the rainfall process are scale-invariant, and this scale-invariant property can be expressed by:
where α is the precipitation distribution parameter, D is the time scale, λ the scale factor, and β the scale exponent [3]. In a simple scaling case, the scaling exponent is constant and equal to the slope of the linear relation between β and D in a double logarithmic plot [39] and the scaling relation also holds for the distribution quantiles [38].
Equation (1) was used to scale the distribution of extreme rainfall. Rainfall extremes are commonly extracted from observed time series in one of two ways: (1) by extracting the most extreme event within a hydrological year (AM, or (2) by extracting all events above a predefined threshold (peak-over-threshold (POT)). In general, the AM approach helps selecting events that are independent and identically distributed and the simplicity of the method is an advantage. However, some extremes could be lost if other events than the maximum of a year exceeds the annual maxima of other years. Thus, the POT approach may give a more consistent definition of extremes [3] and might be preferred when the observed rainfall series are short. Extreme events extracted from observational time series by the POT approach follow a generalized Pareto distribution (GPD) [40]. The cumulative distribution function, F(z), for the POT extremes (z) are given by:
where is the defined threshold, the scale parameter, and the shape parameter.
When applying models of threshold excesses, proper threshold selection is important in order to balance bias and variance. The threshold must be high enough to ensure that the observations do not belong to the central part of the distribution (without risking too few excesses above the threshold), but low enough to reduce variance [40]. Common approaches for threshold selection are to set the threshold based on a percentile (e.g., 99th or 99.5th percentile), by visual inspection of mean residual life (MRL) plots or dispersion index plots prior to model fitting, or by looking for stability of parameters after fitting the model over a range of thresholds. Manually inspecting many plots and series will be impractical, and some methods for optimizing this process have emerged, such as, the combined-peak-over-threshold (CPOT) approach by Anagnostopoulou and Tolika [41].
In addition to threshold selection, the GPD parameters will be affected by choice of method for parameter estimation. For practical reasons, all GPDs was fitted by maximum likelihood estimation (MLE) in this study [32]. Furthermore, the behavior of the GPD is greatly dependent on the shape parameter. A global study of the GEV shape parameter, including 71 data series from Norwegian stations found that the shape parameter in Norway lies in the interval 0.028–0.156, with an average of 0.044 [42].
In this study, precipitation extremes for time scales 5 min, 10 min, 15 min, 30 min, 1 h, 3 h, 6 h, 12 h and 24 h were extracted from aggregated time series of observations using various threshold selection techniques: (1) the combined POT (CPOT) approach [41], and (2) 95th, 99th and 99.5th percentiles. To secure independent events, an independence criterion of 48 h between daily and 12 h events and 24 h between the remaining sub-daily durations was set, following the recommendation that the independence criteria should exceed the durations of the events [3]. Since it has been argued that [42,43], the fitting of the GPD to daily rainfall extremes was tested with a fixed shape parameter of 0.044, corresponding to the Norwegian average [42] for all of the three locations. When fitting the sub-daily GPDs, the daily shape parameter for the respective locations was used, as previous studies has indicated that this gives a more stable downscaling model [44]. The goodness of the fit between the empirical and theoretical distribution was assessed by a traditional Chi-squared test, where the p-value was computed for a Monte Carlo test [45]. The analyses were performed in the open-source software R, using built-in functions and the R package ‘POT’ [46].
From the resulting extreme precipitation distribution parameters, return levels used for constructing the IDFs were estimated based on the formula:
where N is the return period, ZN is the N-year return level, ny the number of observations per year, and ζu = Pr{X > u} [40]. In this study, the sample proportion of points exceeding u was used as an estimation for ζu [40]. From this, the scaling exponent, β, was found by studying the relationship between the observed Zn and D in a double logarithmic plot. The scaling exponent obtained was then used to scale ZN of the projected daily precipitation (NCCS data) to lower durations in order to construct IDF curves for the future period 1971–2100.
The projected IDF curves were used to create design events to be used as input to the event-based models of LID performance. Local stormwater measures for small catchments are, in Norway, commonly designed for peak flow control with storm durations corresponding to time of concentration, typically ranging from 5–10 min up to one hour [47]. Synthetic designed precipitation hyetographs based on local IDF-curves, incorporating intensities for several different durations, are recommended methods when designing based on IDF-data. This method requires knowledge on precipitation patterns [48]. Little work has been done on creating specific synthetic hyetographs for Norwegian short duration precipitation. For the purpose of this study, two synthetic design events were constructed representing the extremes, where the peak arrives on initial dry or wet conditions. Both were constructed based on local IDF-curves and a 20-year return period event with durations 10 and 60 min. The peak was constructed as a 10 min block rain starting after 5 min for the initial dry conditions and after 50 min for the initial wet conditions. Both alternatives were designed to include the 60 min precipitation depth. The design events were constructed from the present, future maximum and future minimum IDF-curves.
2.4. Low-Impact Development (LID) Performance Assessment
The effect of future climate scenarios on different stormwater measures have been investigated with respect to both long time series and short-term event performance under climate change. Three different measures, bioretention cells, extensive green roofs and detention basins, have been included in the study to represent important processes for stormwater management as infiltration, evapotranspiration and peak runoff reduction and delay (Table 2). The long-term performance depends mainly on the processes of evapotranspiration and infiltration to native soil reducing volume loads on the downstream system, while filtration processes reduce the runoff off pollutants and contribute to improved quality of receiving water bodies. The short-term design event performance, on the other hand, depend mainly on the processes of detention resulting in peak reductions and delay. The long-term performance was based on the 30-year time-series of daily precipitation and temperature projections (NCCS data). Short-term event-based performance was investigated by applying a 20-year return period design event based on locally derived IDF-curves for the future obtained by downscaling the NCCS data.
The focus was on a site scale rather than on a catchment scale, based on an assumption, as suggested by Burns et al. [49], that urban stormwater management should emphasize the restoration or protection of natural hydrologic processes at small scales, with the aim of restoring natural flow regimes at larger scales downstream. For comparative reasons, all stormwater measures were tested on a site scale based on a catchment area of 1000 m2 of roof or another impervious catchment area (e.g., parking lot). A detailed description of the methods follows.
The green roofs modelled in this study were based on a build-up used in field studies in four Norwegian sites; Trondheim, Bergen, Sandnes and Oslo [50]. The field studies had a build-up consisting of a 30 mm pre-grown, sedum-based vegetation mat over additional 50 mm of green roof substrate, a 25–75 mm plastic or polystyrene drainage layer and a 5 mm thick textile retention fabric as the bottommost layer. This build-up corresponded to a theoretical water storage capacity of 19–24 mm. The green roof water balance model was run with a maximum water storage capacity (Smax) of 25 mm. The denotation in parenthesis refer to the parameter abbreviations used in Equations (4)–(9). The roof made for the model exemplification was a typical commercial building with a 1000 m2 flat roof. Slope was set according to minimum requirements in Norwegian building regulations of 1:40 (2.5%) [51] and the maximum distance to drainpipe was set to 10 m. The bioretention cell area (AB) (50 m2) was set to 5% of the catchment area (AC) (1000 m2) corresponding to common sizing recommendations [52]. The catchment was assumed to be 100% impervious illustrating a conventional roof or a parking lot. The maximum ponding depth was set to 15 cm, giving an above ground storage volume of 7.5 m3 (V1MAX) [53].
The bioretention media depth was set to 75 cm [53,54] with an infiltration rate of 10 cm/h (Inf1) which is a minimum recommended value for cold climates based on investigations carried out by Paus et al. [55]. A drainage pipe was placed in the upper part of a drainage layer. The drainage layer depth was set to 25 cm and with a high porosity of 50% this constituted a sub-surface storage layer of 6.25 m3 (V2MAX). Many costal Norwegian cities suffer from low infiltration capacities due to their costal location with a large extent of marine sediments. For this reason, a relatively low native soil infiltration rate of 0.5 cm/h (Inf2) was applied, corresponding to minimum values found from infiltration tests at 60 cm depth in loam, silt loam and silt clay loam soil in Oslo [56].
2.5. Daily Time-Step Models
Long-term behavior of green roofs was modelled to study future climates effects on volume flows of evapotranspiration and runoff, by the use of a continuous green roof water balance model as described in [34]. The model was based on daily time steps (t) and calculated green roof runoff (R) as a function of precipitation (P), actual storage (S), maximum storage capacity (Smax), crop coefficient (Ccrop) and evapotranspiration (Equations (4) and (5)). Potential evapotranspiration (PET) estimates were based on the Oudin model (Equation (6)), which was found to be the simplified temperature (T) based model performing best for the Nordic climates [57]. PET estimates were coupled with a soil moisture extraction function and a crop coefficient to calculate actual evapotranspiration (AET) (Equation (7)).
The model applied in [34] was improved by calibrating the crop coefficient based on three years of continuous observations from field studies [50]. The model was calibrated was based on minimizing the objective function relative percentage difference (RPD) for three year of continuous data (2015–2017) and validated with the objective function Nash–Sutcliffe efficiency (NSE) for non-winter data [58].
| Rt = 0 Rt = Pt − (Smax – St−1) − AETt | St−1 + Pt − AETt ≤ Smax St−1 + Pt − AETt > Smax | (4) |
| St = St−1 + Pt − AETt St = Smax | St−1 + Pt − AETt ≤ Smax St−1 + Pt − AETt > Smax | (5) |
| PETt = 0.408 ∗ Re ∗ [0.01 ∗ (Tt + 5)] | (6) | |
| AETt = PETt ∗ Ccrop ∗ St−1/Smax | (7) | |
| t = Timestep (d) R = Runoff (mm/d) P = Precipitation (mm/d) Smax = Maximum storage capacity (mm) S = Used storage (mm) PET = Potential evapotranspiration (mm/d) | AET Actual evapotranspiration (mm/d) Re = Extra-terrestrial radiation (MJ/m2∗d) derived from Julian day and latitude T = Temperature (°C) Ccrop = Crop coefficient |
Model results were calculated both annually and for the temperate season (defined as the period May through October) when most of the retention was expected to take place. The data was further divided into events divided by dry periods, defined as days with less than 1 mm precipitation. Maximum duration of dry periods was expressed by the 99.5% percentile of all observed dry periods and a drought incident was defined by less than 1 mm water stored in the end of a dry period. Available retention capacity at the beginning of a precipitation event was defined as the median observed retention from events with more than 5 mm precipitation, duration less than 3 days and where runoff occurred.
Long-term behavior of bioretention cells was modelled to study future climates effects on volume flows of infiltration, runoff and potential evapotranspiration. A bioretention cell water balance model (Equations (8)–(9)) with daily time-steps equivalent to the one used for green roofs were set up, with the same input time series of precipitation (P) and evapotranspiration (PET), as used in the green roof water balance model.
Calculations of overflow of the unit were based on an assumption that all precipitation arrived during a period of 1.7 h. The time period was found as the average time with precipitation on the days when the total precipitation amounts exceeded the above surface storage volume. Storage in the bioretention media was not included, and evapotranspiration estimates were set equal to the potential evapotranspiration only for time-steps with water available. This would probably lead to an underestimation of evapotranspiration, but due to the low catchment to bioretention surface area ratio, evapotranspiration would represent a small volume flow and the simplification was, therefore, considered to be sufficient for the purpose which was to evaluate changes in volume flow for future climates.
| Initial values: Qinnt = Pt ∗ (AB + AC)/1000 AETt = PETt ∗ AB/1000 Q1t = Inf1 ∗ AB ∗ 1.7 h/100 Q2t = Inf2 ∗ AB ∗ 24 h/100 | ||
| S1t = S1t−1 + Qinnt − AETt – Q1t If S1t > V1max S1t = V1max and Qov = S1t−1 + Qinnt − AETt – Q1t − V1max If S1t < 0 S1t = 0 and Q1t = S1t−1 + Qinnt – AETt If Q1t < 0 AETt = S1t−1 + Qinnt | (8) | |
| S2t = S2t−1 + Q1t – Q2t If S2t > V2max S2t = V2max and Qdt = S2t−1 + Q1t – Q2t –V2max If S2t < 0 S2t = 0 and Q2t = S2t−1 + Q1t | (9) | |
| t = Timestep (d) Qinn = Inflow (m3/d) AB = Area bioretention (m2) AC = Area catchment (m2) AET = Actual evapotranspiration (m3/d) Q1 = Infiltration flow bioretention media (m3/d) Inf1 = Infiltration rate bioretention media (cm/h) Q2 = Infiltration flow native soil (m3/d) | Inf2 = Infiltration rate native soil (cm/h) Qov = Overflow (m3/d) Qd = Flow through drain (m3/d) S1 = Used above surface storage S1 (m3) V1max = Maximum above surface storage (m3) S2 = Used sub surface storage (m3) V2max = Maximum sub surface storage (m3) | |
2.6. Design Event Models
Green roof detention performance in present and future climate was investigated using the green roof specific LID module in the Storm Water Management Model (SWMM version 5.1.012) [59]. The green roof was modelled as a subcatchment totally covered by a green roof and compared to a reference roof modelled as a 100% impervious subcatchment covered with a black bitumen liner. The model was run on an event basis. The initial saturation in the green roof model is important as it defines the available retention capacity when precipitation starts, and was set to 5 mm. This is an approximate conservative value based on observations in Bergen, Sandnes, Trondheim and Oslo [50], as can also be seen when compared to the results from the green roof water balance model. The SWMM green roof module and a comparative black bitumen reference roof were based on parameters derived from a multi-site calibration of the model with field data [60]. The highest intensity events included in the calibration data was a 10 min intensity of 0.83 mm/min and 60 min intensity of 0.36 mm/min.
The RECARGA model developed by Wisconsin Department of Natural Resources was used to evaluate the performance of a bioretention facility [61]. The RECARGA is a 1D model including up to three soil layers and optional underdrains, simulating the water movement applying the Green-Ampt infiltration model, and the van Genuchten relationship for drainage between soil layers. Model output includes inflow, overflow, flow through underdrain and infiltration to native soil. Evapotranspiration is set to zero during this short-term event modelling.
Stormwater detention basins, commonly built as underground constructions in Norway, was investigated by the use of a simplified spreadsheet model using the rain envelope method commonly applied by stormwater engineers [17,19,62,63]. Required detention basin volumes were calculated based on a maximum rate of outflow for different durations of a box type design rain from local IDF curves, and the duration giving the largest volume was used for design. Outflow was set to a constant value of 20 l/s·ha corresponding to a maximum discharge limit to public piped systems applied by the City of Oslo [63]. Most orifice restrictors would give some variations in outflow rate depending on the water depth in the basin, but for the purpose of comparing required volumes for different future climate scenarios this simplified approach was considered to be sufficient.
The effect of installing green roof and/or bioretention cells prior to stormwater detention basins was investigated. The measures were put in series, e.g., the runoff profile from the green roof SWMM model was used as input to the RECARGA model of the bioretention-cell, and the runoff from REGARGA was used as input to the detention basin. Stormwater measures in series could have been modelled inside SWMM, which introduced the possibility to model LIDs in series between 2015 and 2016 [59,64]. Still, RECARGA was chosen for the bioretention cell modelling due to the authors’ prior experiences, where this model showed acceptable performance compared to observed bioretention cell runoff in a similar climate [65].
3. Results and Discussion
3.1. Temporal Downscaling
In total, the GPD was fitted to 27 datasets of extreme events (3 locations × 9 durations), with four different threshold levels. The obtained parameters and results of the chi-squared test were stored for each fit. According to the statistics obtained for daily extremes (Table 3), the variation (σ) obtained could be characterized as stable, compared to the threshold level (μ) which varies greatly between percentiles 0.95 and 0.995. Using the CPOT approach for threshold selection results in threshold levels belonging to the lower range of the percentile-based thresholds.
The results of the fitting of the sub-daily extremes by the same approach is summarized by the % sub-daily GPD fits that resulted in the p-value exceeding a significance level of α = 0.05. Based on the chi-squared test p-value, a threshold selection corresponding to the 99.5th percentile is superior to other threshold levels for all locations and sub-daily durations. However, the chi-squared test also shows that some unsatisfactory results were obtained, especially for sub-daily extremes in Oslo and Trondheim. This is likely to be explained by the presumed shape parameter, which was fixed at 0.044. Letting ξ vary in the range 0.028–0.156, as suggested by Ragulina and Reitan [42], and testing other methods for parameter estimation, could result in better parameter fits and should be further investigated. However, fixing the shape parameter (ξ = 0.044) and limiting the parameter estimation techniques to one (MLE), allowed us to study the sensitivity of the GPD fit to threshold selection. In further steps, the fixed shape parameter and the 99.5th percentile threshold level was kept.
Return levels for return periods T = (2, 5,10, 20, 30, 50, 100) years were estimated (Equation (3)) and plotted against duration in a double logarithmic plot (Figure 3). The scaling exponent, β, is calculated for each return period, and the average of these is used for further calculations. By inspecting the plots, a clear linear relation in the double logarithmic plot is found for Bergen and Trondheim (Figure 3a,c), indicating a simple scaling case with a constant scaling exponent for all durations. The return levels for Oslo, however, show a concave behavior (Figure 3b). The shift occurs at ~60 min, suggesting a difference in scaling behavior for sub-hourly extreme precipitation. This is similar to results reported by e.g., Nguyen et al. [30] who also found a simple scaling behavior within the same two different time intervals when performing a similar study for Quebec, Canada.
The results of scaling the observed daily return levels are compared to the return levels estimated based on the GPD parameters (Figure 4). Common for all locations is that the scaling models underestimate the return levels for the highest and the lowest durations. For Oslo and Trondheim, the scaling models are found to behave very well from a duration of 3 h and down to ~30 min and ~15 min, respectively (Figure 4b,c). The scaling model for Bergen is seen to always overestimate or underestimate the return levels and the offset is worst for higher durations and higher return periods. However, there is a higher agreement between scaled return levels and return levels estimated by GPD parameters than what has been found in earlier studies for Bergen [32] and Trondheim [33] based on AM and GEV distribution selection.
3.2. Projected Future Climate
Both average daily temperatures and precipitation increased for all (10) tested future scenarios. Temperature increase from present to the median off all future models were found to be quite similar, with an increase of 4.6 °C in Bergen (BER), 5.1 °C in Trondheim (TRD) and 5.6 °C in Oslo (OSL), while daily precipitation increased more in Bergen (2 mm) compared to Trondheim (0.6 mm) and Oslo (0.3 mm) (Figure 5). The 10 projected models also produce a range of scenarios. For daily precipitation in Bergen, this range is especially high. Furthermore, it is found that the models that produce the max and min scenarios are not the same across locations. This highlights the need for and usefulness of an ensemble approach.
Scaling the projected daily return levels, using the obtained scaling relations was performed to construct IDF curves also for future precipitation. The scaling was performed for all 10 future scenarios, such that an ensemble of return levels was obtained for each return period. Similar to the daily projections, the projected T = 20 year sub-daily precipitation intensities for Bergen result in the largest increase compared to observations (Figure 6). For Bergen, an increase of return levels is projected to all scenarios, while some scenarios result in a decrease of return levels for Oslo and Trondheim. For the observed return levels, it was estimated that Oslo experiences the highest intensity of short duration rainfall and a shift between Oslo and Bergen occurs approximately around duration 3 h. In the projections, the intensity of short duration rainfall in Bergen is expected to exceed the corresponding intensities for Oslo for all durations, and no such shift occurs. Comparing Oslo to Trondheim, the relative difference between intensities stay roughly the same from observations to projections.
The relative difference between projected and observed return levels, addressed climate factor (CF), is of practical interest for stakeholders planning sustainable systems in Norway as it is often included in design guidelines. In Norwegian municipalities, it is common to operate with a climate factor in the range 1.2–1.5 that is added to the design precipitation intensity (collected from IDF curve). Usually, vulnerable infrastructure is designed for higher return periods, but the climate factor is kept constant. The results of this study contradict this practice (Figure 7). For estimated hourly climate factors, there is a large variation in estimated climate factors both across locations and return periods. For return periods, T, in the range 2–100 years, the climate factor is increasing, indicating that vulnerable infrastructure also should be design with a higher climate factor. According to the investigated projections, Bergen is expected to experience the largest increase in extreme hourly precipitation, while the climate factors for Oslo and Trondheim are significantly lower but showing the same increase with return periods as Bergen.
3.3. LID Performance: Volume and Pollution Control
Evapotranspiration is in this study represented by green roofs and bioretention cells, while other stormwater measures like rooftop disconnections, the use of vegetation and pervious surfaces also benefit from this process. The green roof water balance model was run with a crop coefficient of 0.9, based on the calibration results from all sites with |RPD| < 10% and NSE > 0.6. Green roofs contribute to a considerable reduction in annual runoff volumes by retention and subsequent evapotranspiration in present climate with 15% in Bergen, 26% in Trondheim and 35% in Oslo (Figure 8a). The fractions increase slightly for most future scenarios in spite of the increased precipitation volumes, due to the increased temperatures’ effect on evapotranspiration. The performance improved most for Oslo, due to the combined effect of temperatures and precipitation, which is most favorable for Oslo with the highest temperature increase and the lowest precipitation increase. This makes green roofs and other stormwater measures relying on evapotranspiration for stormwater removal, favorable solutions for present and future stormwater management with respect to volume reduction. These results are based on relatively cold and wet Norwegian climates and the findings are expected to be even more advantageous for warmer and drier climates. Median available retention capacity in the temperate season increases for all future scenarios at all locations (Figure 8b). This measure is especially of interest during the temperate season where small precipitation events can be retained totally or where larger precipitation events experiences an enhanced detention effect in the first part of larger precipitation events due to the initial retention taking place before runoff is initiated. Analysis of short-term extreme precipitation events (5–15 min duration) show that these events occur in the temperate season, where advantage can be taken of the available retention capacity of the green roofs.
Dry periods involve risk of vegetation drought. There is no clear trend in changes in duration of the extreme dry periods from present situation to future scenarios, but the increased evapotranspiration rates give an increased number of drought incidents for most future scenarios (Figure 9). This can be coped with by increasing the water storage capacities of the applied systems. The risk of increased future green roof drought was found to be largest for Oslo, increasing from 4 to as much as 19 incidents in 30 years for the highest future scenario, indicating that higher storage capacities than the chosen 25 mm should be considered when building extensive green roofs for a future climate in Oslo.
Infiltration to native soil is in this study represented by a bioretention cell in a soil with relatively low infiltration capacity, to illustrate the potential for this process even at less favorable conditions. Infiltration is also important for other stormwater measures like rooftop disconnections, infiltration trenches and all types of pervious surfaces. Bioretention cells contribute to a considerable reduction in annual runoff volumes by infiltration to native soil in present climate with 54% in Bergen, 83% in Trondheim and 85% in Oslo (Figure 10b). The fractions decrease slightly for all future scenarios due to increased precipitation amounts but can also in a future climate give a large contribution to runoff volume reductions. Bioretention cells are the only stormwater measure in this study that can remove pollutants from stormwater by filtration treatment, while this effect will not be present for volumes that overflow the unit’s capacity. Volumes treated for pollution control was found to be 63% in Bergen and 88% in Trondheim and Oslo for the present climate, decreasing slightly for all future scenarios tested (Figure 10a). The Bergen site experiences more than twice the precipitation amounts compared to the two other sites and a higher bioretention cell-to-catchment-area ratio, than the 5% used in this study, should be applied to improve the general performance. Bioretention cell above ground storage area could also be increased to improve performance with respect to fraction of runoff treated and/or infiltrated [8]. Evapotranspiration was only found to represent a small fraction of the volume reduction in bioretention cells (0.6–1.4%) due to the small surface to catchment area ratio.
3.4. LID Performance: Peak Flow Control
Peak flow control in terms of peak reduction and peak delay was limited for the modelled green infrastructure alone (green roofs and bioretention cells) for the tested 20-year 1 h design events. The performance improved with reduced peak precipitation intensities/precipitation depth and when the highest peak intensity arrived early in the precipitation event (when the unit was not saturated yet) (Figure 11 and Figure 12). The SWMM green roof modelling parameters were calibrated with field data with smaller peak intensities than the highest intensities tested here, limiting the accuracy of the model. Still, field observations on peak reductions for the largest observed events (Figure 11a) resemble the model results where the peak arrived on initial dry conditions giving peak reduction above 55%. This indicates that green roofs can contribute to some extent to peak flow control events for high intensity events. However, with only three year of observations the worst case situations are probably not captured. For the costal climates studies these could typically be high-intensity precipitation events inside a longer low intensity event giving initial conditions comparable to the modelled initial wet situation. For the highest modelled peak intensities, and when the peak arrived late in the precipitation event (initial wet) very low peak reductions and peak delays were found. The most likely explanation for this was that the green roofs were almost totally saturated, and when the flow inn increased, the same amount of water would have to be pushed out almost immediately by the hydraulic pressure. Bioretention cells were overflowed at most tested scenarios resulting in low peak reduction and peak delays (Figure 12c). A substantial part of the precipitation (11–35%) could be infiltrated even at these large design events. Fractions overflowing the unit resulting in no pollution control were high for the largest design events (up to 69%). The highest future scenarios represent an increase in precipitation for all locations, accompanied by a reduced detention performance for green roofs and bioretention cells. Green infrastructure is typically designed to target the most frequent precipitation events and cannot stand alone as a peak flow control measure for large design events. However, these measures can give valuable contributions, and with alternative sizing, or in combination with other stormwater measures, they can give a substantial contribution to peak flow control of large design events, as also suggested by Dietz et al. [8] and Rosa et al. [66].
Detention basins can be designed to meet any given peak runoff threshold resulting in variable volume requirements. Required detention basin volumes for a runoff area of 1000 m2 and a runoff threshold of 20 l/s·ha were almost three times as high in Oslo (29 m3) and twice as high in Bergen (22 m3) compared to Trondheim (11 m3) for the present climate (Figure 13a). All future scenarios increased the required detention basin volumes substantially compared to the present for Bergen, while smaller increases were found for most future scenarios in Oslo and Trondheim. The size increased by 50% for the maximum future scenario in Oslo, 100% in Trondheim and as much as 250% for the maximum future scenario in Bergen. The duration of the design event was longer for Bergen in present climate and increased even further for all future scenarios, indicating that the type of events being critical for stormwater design might change in the future from short duration events, commonly being used for design today, to longer duration events. Stricter runoff thresholds than applied here will result in longer durations of the design event and larger basin volumes.
3.5. LID Performance: Combined Measures
Detention basins are efficient in reducing peak runoffs at high-intensity events from single plots, while providing no stormwater treatment and little or no peak reduction at smaller more frequent events. Stormwater management based on detention basins alone require large volumes to handle a 20-year design event and combination of measures are preferable for volume and pollution control in addition to peak flow control.
The combined effect of different stormwater measures has been investigated for present and future design events, based on a 20-year return period 60-min duration design event, with a 10 min peak with the most unfavorable timing placed late in the precipitation event (Figure 14). The same areas, stormwater measures and methods as applied earlier were used in this comparison. Largest required volumes were found when only using a detention basin alone. The introduction of an extensive green roof before the detention basin reduced the required volumes. A slightly higher volume reduction was found by using a bioretention cell before the detention basin. A combination of both an extensive green roof and a bioretention cell reduced the required detention basin volume substantially and, in some cases, totally removed the need for the detention basin. The same pattern in volume reduction was found when applying a design event based on the future maximum and minimum scenarios. Most tested future scenarios gave an increase in required detention basin volumes and the largest increases were found for Bergen. The individual investigation of detention basins for Bergen showed that this was the only site where rain durations larger than 60 min were dimensional, giving even larger volume needs than shown in this combined investigation. Runoff thresholds are commonly based on a predevelopment runoff pattern, and, due to the climatic conditions, this would probably be set higher in Bergen compared to the other sites, and not similar as in this exemplification. The method still illustrates the consequences of the future precipitation scenarios and the efficiency of combining stormwater measures. The investigated measures also show the potential for upgrading existing detention basins designed for the present climate, by adding green roofs on conventional rooftops and directing runoff through bioretention cells prior to the detention basins, to perform sufficiently also in a future climate.
4. Conclusions
This study has assessed the performance of LID structures in present and a future climate for three different locations in Norway: the cities of Bergen, Oslo and Trondheim. The assessment was performed using existing regional climate projections of daily temperature and precipitation and scaling laws to construct future IDF curves, and an extensive modelling framework to investigate the full range of slow and rapid hydrological processes.
The climate projections indicated a substantial increase in average annual temperatures for all investigated future scenarios with median value increase ranging from 4.6–5.6 °C, while average daily precipitation increased most for Bergen with a median increase of 2.0 mm compared to 0.6 mm for Trondheim and 0.3 mm for Oslo.
The scaling of IDF relationships was performed on rainfall extremes extracted by the POT approach and fitted to the generalized Pareto distribution. A clear scaling relationship between daily and sub-daily extreme rainfall statistics was found, and the scaling model itself was assessed as improved from previous attempts to scale similar data sets. However, the GPD assumption did not hold for all the assessed extreme series. Future IDF curves constructed based on the obtained scaling relationships showed that there are large variations in projected intensity increase across locations, where projections for Bergen entail a much higher increase than Oslo and Trondheim. The implication of this is that local conditions should be considered in order to achieve optimal adaptation of stormwater management. Furthermore, climate factors were found to increase with return period, implying that an even higher safety requirement should be considered for stormwater design practices in vulnerable surroundings.
According to long-term water balance simulations, green roofs can contribute with reductions in annual stormwater runoff volumes by evapotranspiration in the range of 15–40% depending on local climate. Bioretention cells covering 5% of the catchment area with relatively low infiltration capacities in native soil (0.5 cm/h) were found to reduce stormwater runoff volumes by 54–85% and to filtrate as much as 63–88% for pollutant control. Future performance of green roofs was found to be comparable or improved due to increased evapotranspiration rates caused by increased temperatures, while future performance of bioretention cells was found to be slightly poorer due to increased precipitation amounts. The risk of green roof drought was found to increase in future scenarios, and can be reduced by increasing water storage capacities.
Detention basin volumes required to handle a 20-year event increased for almost all tested scenarios, but most for Bergen where the design events increased most in size. Green roofs and bioretention cells can contribute with peak reduction and peak delay for some of the tested 20-year return period, 1 h design events. However, for the largest and highest-intensity events or when the peak arrived on initial wet condition, little detention effect was found. Despite the poor performance alone on design events, green roofs and bioretention cells can make an important contribution to design events, reducing the required downstream detention basin volumes substantially if applied in series.
In this study, LID performance was assessed for selected climate scenarios. One major limitation of the study is the high level of uncertainty linked to climate projections. In addition, several assumptions were needed for the statistical analysis comprising the temporal downscaling, such as choice of independence criteria and threshold selection, introducing even more uncertainty. By coupling frameworks, this uncertainty was further propagated through the assessments of LID performance in water-balance and event-based models. The daily time step models used are continuous and will, therefore, capture the processes dependency of antecedent conditions, but can only be used to evaluate slow processes like evapotranspiration and infiltration. Assumptions had to be made to distribute the daily precipitation into the bioretention cell introducing uncertainties. However, future time series of higher time resolution were not available to make a more accurate model for long-term future performance. Performance during high intensity precipitation was based on synthetic design events created from IDF curves. This is a common design method for stormwater measures, but has the limitation of not including the antecedent conditions, which could be relevant for the performance of this type of LID measure. This was partly accounted for by introducing two different synthetic design events, where the peak arrived on different initial conditions.
No prediction of the future will be perfect, but assessing the uncertainty of projections is necessary to provide better decision support to practitioners. The inclusion of more scenarios, sensitivity analysis of GPD parameters, and testing the methodology on more data sets would be valuable for such an assessment. Evaluation of different stormwater measures and combinations are necessary for design of future resilient systems. In this study this was conducted with different tools, while a practitioner would prefer this to be integrated in one tool. Stormwater models have lately introduced modules for local stormwater measures, but more work is needed to improve these. Model outputs have to be tested further versus field observations to provide reliable material dependent model parameters. Long-term processes, e.g., evapotranspiration from green roofs, have to be represented more accurate in the model, and the possibility to model different combinations of stormwater measures both in series and in parallel, should be tested further.
Author Contributions
E.K. was responsible for the work associated with preparation of the climate projections. B.G.J. was responsible for the work associated with the stormwater applications. T.M.M. has supervised, edited and contributed to conceptualization of this study.
Funding
This research was funded in part by the European Commission through the H2020 project BINGO—Brining INnovation to onGOing water management—a better future under climate change (Grant No 641739), in part by The Research Council of Norway (Grant No 241827), and in part by the Municipality of Trondheim, Norway.
Conflicts of Interest
The authors declare no conflict of interest.
References
- US Environmental Protection Agency. Stormwater Management for Federal Facilities under Section 438 of the Energy Independence and Security Act; US Environmental Protection Agency: Washington, DC, USA, 2009.
- Intergovernmental Panel on Climate Change (IPCC). Climate Change 2013: The Physical Science Basis. Contribution of Working Group I to the Fifth Assessment Report of the Intergovernmental Panel on Climate Change; Cambridge University Press: Cambridge, UK; New York, NY, USA, 2013. [Google Scholar]
- Willems, P.; Olsson, J.; Arnbjerg-Nielsen, K.; Beecham, S.; Pathirana, A.; Gregersen, I.B.; Madsen, H.; Nguyen, V.-T.-V. Impacts of Climate Change on Rainfall Extremes and Urban Drainage Systems; IWA Publishing: London, UK, 2012; ISBN 9781780401263. [Google Scholar]
- Petrucci, G.; Rioust, E.; Deroubaix, J.-F.; Tassin, B. Do stormwater source control policies deliver the right hydrologic outcomes? J. Hydrol. 2013, 485, 188–200. [Google Scholar] [CrossRef] [Green Version]
- Fletcher, T.D.; Shuster, W.; Hunt, W.F.; Ashley, R.; Butler, D.; Arthur, S.; Trowsdale, S.; Barraud, S.; Semadeni-Davies, A.; Bertrand-Krajewski, J.-L.; et al. SUDS, LID, BMPs, WSUD and more—The evolution and application of terminology surrounding urban drainage. Urban Water J. 2015, 12, 525–542. [Google Scholar] [CrossRef]
- Goff, K.M.; Gentry, R.W. The Influence of Watershed and Development Characteristics on the Cumulative Impacts of Stormwater Detention Ponds. Water Resour. Manag. 2006, 20, 829–860. [Google Scholar] [CrossRef]
- Emerson, C.H.; Welty, C.; Traver, R.G. Watershed-Scale Evaluation of a System of Storm Water Detention Basins. J. Hydrol. Eng. 2005, 10, 237–242. [Google Scholar] [CrossRef]
- Dietz, M.E.; Arnold, C.L. Can Green Infrastructure Provide Both Water Quality and Flood Reduction Benefits? J. Sustain. Water Built Environ. 2018, 4, 02518001. [Google Scholar] [CrossRef]
- Pennino, M.J.; McDonald, R.I.; Jaffe, P.R. Watershed-scale impacts of stormwater green infrastructure on hydrology, nutrient fluxes, and combined sewer overflows in the mid-Atlantic region. Sci. Total Environ. 2016, 565, 1044–1053. [Google Scholar] [CrossRef] [PubMed] [Green Version]
- Damodaram, C.; Giacomoni, M.H.; Prakash Khedun, C.; Holmes, H.; Ryan, A.; Saour, W.; Zechman, E.M. Simulation of Combined Best Management Practices and Low Impact Development for Sustainable Stormwater Management1. JAWRA J. Am. Water Resour. Assoc. 2010, 46, 907–918. [Google Scholar] [CrossRef]
- Eckart, K.; McPhee, Z.; Bolisetti, T. Performance and implementation of low impact development—A review. Sci. Total Environ. 2017, 607–608, 413–432. [Google Scholar] [CrossRef] [PubMed]
- Palla, A.; Gnecco, I. Hydrologic modeling of Low Impact Development systems at the urban catchment scale. J. Hydrol. 2015, 528, 361–368. [Google Scholar] [CrossRef]
- Thomas, N.W.; Arenas Amado, A.; Schilling, K.E.; Weber, L.J. Evaluating the efficacy of distributed detention structures to reduce downstream flooding under variable rainfall, antecedent soil, and structural storage conditions. Adv. Water Resour. 2016, 96, 74–87. [Google Scholar] [CrossRef]
- Zhu, Z.; Chen, X.; Zhu, Z.; Chen, X. Evaluating the Effects of Low Impact Development Practices on Urban Flooding under Different Rainfall Intensities. Water 2017, 9, 548. [Google Scholar] [CrossRef]
- Qin, H.; Li, Z.; Fu, G. The effects of low impact development on urban flooding under different rainfall characteristics. J. Environ. Manag. 2013, 129, 577–585. [Google Scholar] [CrossRef] [PubMed] [Green Version]
- Gilroy, K.L.; McCuen, R.H. Spatio-temporal effects of low impact development practices. J. Hydrol. 2009, 367, 228–236. [Google Scholar] [CrossRef]
- The City of Bergen. Retningslinjer for Overvannshåndtering i Bergen Kommune [Guidelines for Surfacewater Management in the City of Bergen]. 2005. Available online: https://www.bergen.kommune.no/bk/multimedia/archive/00010/Retningslinjer_for_o_10779a.pdf (accessed on 25 February 2019).
- The City of Stavanger. Kommunaltekniske Normer for Vann- og avløpsanlegg. Vedlegg 9 Overvannshåndtering [Water and Wastewater Norm. Attachment 9. Stormwater Management]. 2017. Available online: http://www.va-norm.no/stavanger/ (accessed on 25 February 2019).
- The City of Trondheim. VA-norm. Vedlegg 5. Beregning av overvannsmengde Dimensjonering av ledning og fordrøyningsvolum [Water and Wastewater Norm. Attachment 5. Calculation of stormwater flows. Design of pipes and detention basins]. 2015. Available online: http://www.va-norm.no/trondheim/ (accessed on 25 February 2019).
- The City of Copenhagen. Cloudburst Management Plan 2012. 2012. Available online: https://en.klimatilpasning.dk/media/665626/cph_-_cloudburst_management_plan.pdf (accessed on 25 February 2019).
- Norges Offentlige Utredninger. Overvann i byer og tettsteder. Som problem og ressurs (NOU 2015:16) [Stormwater in Urban Areas. Problem and Resource (Norwegian Public Investigation)]; Departementenes sikkerhets- og serviceorganisasjon Informasjonsforvaltning: Oslo, Norway, 2015.
- The City of Oslo. Strategi for overvannshåndtering i Oslo 2013-2030 [Strategy for stormwater management]; The City of Oslo: Oslo, Norway, 2013. [Google Scholar]
- Semadeni-Davies, A.; Hernebring, C.; Svensson, G.; Gustafsson, L.-G. The impacts of climate change and urbanisation on drainage in Helsingborg, Sweden: Suburban stormwater. J. Hydrol. 2008, 350, 114–125. [Google Scholar] [CrossRef]
- Semadeni-Davies, A.; Hernebring, C.; Svensson, G.; Gustafsson, L.-G. The impacts of climate change and urbanisation on drainage in Helsingborg, Sweden: Combined sewer system. J. Hydrol. 2008, 350, 100–113. [Google Scholar] [CrossRef]
- Maraun, D.; Wetterhall, F.; Chandler, R.E.; Kendon, E.J.; Widmann, M.; Brienen, S.; Rust, H.W.; Sauter, T.; Themeßl, M.; Venema, V.K.C.; et al. Precipitation downscaling under climate change: Recent developements to bridge the gap between dynamical models and the end user. Rev. Geophys. 2010, 48, 1–38. [Google Scholar] [CrossRef]
- Fowler, H.J.; Blenkingsop, S.; Tebaldi, C. Linking climate change modelling to impacts studies: recent advances in downscaling techniques for hydrological modelling. Int. J. Climatol. 2007, 27, 1547–1578. [Google Scholar] [CrossRef] [Green Version]
- Benestad, R.E.; Chen, D.; Hanssen-bauer, I. Empirical-Statistical Downscaling; World Scientific Publishing Co. Inc.: Singapore, 2007. [Google Scholar]
- Jacob, D.; Petersen, J.; Eggert, B.; Alias, A.; Christensen, O.B.; Bouwer, L.M.; Braun, A.; Colette, A.; Déqué, M.; Georgievski, G.; et al. EURO-CORDEX: New high-resolution climate change projections for European impact research. Reg. Environ. Chang. 2014, 14, 563–578. [Google Scholar] [CrossRef]
- Willems, P. Compound IDF-relationships of extreme precipitation for two seasons and two storm types. J. Hydrol. 2000, 233, 189–205. [Google Scholar] [CrossRef]
- Nguyen, V.-T.-V.; Nguyen, T.-D.; Cung, A. A statistical approach to downscaling of sub-daily extreme rainfall processes for climate-related impact studies in urban areas. Water Sci. Technol. Water Supply 2007, 7, 183. [Google Scholar] [CrossRef]
- Herath, S.M.; Sarukkalige, P.R.; Van Nguyen, V.T. A spatial temporal downscaling approach to development of IDF relations for Perth airport region in the context of climate change. Hydrol. Sci. J. 2016, 61, 2061–2070. [Google Scholar] [CrossRef]
- Kristvik, E.; Kleiven, G.H.; Lohne, J.; Muthanna, T.M. Assessing the robustness of raingardens under climate change using SDSM and temporal downscaling. Water Sci. Technol. 2018, 77, 1640–1650. [Google Scholar] [CrossRef] [PubMed] [Green Version]
- Munkerud, M.Y. Assessing the performance of a combined sewer system under climate change using temporal downscaling. Master’s Thesis, Norwegian University of Science and Technology, Trondheim, Norway, June 2018. [Google Scholar]
- Johannessen, B.G.; Hanslin, H.M.; Muthanna, T.M. Green roof performance potential in cold and wet regions. Ecol. Eng. 2017, 106, 436–447. [Google Scholar] [CrossRef]
- The Norwegian Mapping Authority. Creative Commons Attribution ShareAlike 3.0. 2016. Available online: http://data.kartverket.no/download/content/illustrasjonskart (accessed on 15 December 2016).
- Norwegian Meteorological Institute. eKlima. 2018. Available online: http://sharki.oslo.dnmi.no/portal/page?_pageid=73,39035,73_39049&_dad=portal&_schema=PORTAL (accessed on 3 September 2018).
- Wong, W.K.; Haddeland, I.; Lawrence, D.; Beldring, S. Gridded 1 × 1 km Climate and Hydrological Projections for Norway Gridded 1 × 1 km Climate and Hydrological Projections for Norway; Norwegian Water and Energy Directorate: Oslo, Norway, 2016; ISBN 978-82-410-1512-0.
- Gupta, V.K.; Waymire, E. Multiscaling properties of spatial rainfall and river flow distributions. J. Geophys. Res. 1990, 95, 1999. [Google Scholar] [CrossRef]
- Arnbjerg-Nielsen, K.; Willems, P.; Olsson, J.; Beecham, S.; Pathirana, A.; Bülow Gregersen, I.; Madsen, H.; Nguyen, V.-T.-V. Impacts of climate change on rainfall extremes and urban drainage systems: A review. Water Sci. Technol. 2013, 68, 16. [Google Scholar] [CrossRef] [PubMed]
- Coles, S. An Introduction to Statistical Modeling of Extreme Values, 1st ed.; Springer: Bristol, UK, 2001; ISBN 978-1-4471-3675-0. [Google Scholar]
- Anagnostopoulou, C.; Tolika, K. Extreme precipitation in Europe: statistical threshold selection based on climatological criteria. Theor. Appl. Climatol. 2012, 107, 479–489. [Google Scholar] [CrossRef]
- Ragulina, G.; Reitan, T. Generalized extreme value shape parameter and its nature for extreme precipitation using long time series and the Bayesian approach. Hydrol. Sci. J. 2017, 62, 863–879. [Google Scholar] [CrossRef]
- Serinaldi, F.; Kilsby, C.G. Rainfall extremes: Toward reconciliation after the battle of distributions. Water Resour. Res. 2014, 50, 336–352. [Google Scholar] [CrossRef] [PubMed] [Green Version]
- Friederichs, P. Statistical downscaling of extreme precipitation events using extreme value theory. Extremes 2010, 13, 109–132. [Google Scholar] [CrossRef]
- Hope, A.C.A. A simplified Monte Carlo significance test procedure. J. R. Stat. Soc. Ser. B 1968, 30, 582–598. [Google Scholar] [CrossRef]
- Ribatet, M. A User’s Guide to the POT Package (Version 1.4). 2006. Available online: https://cran.r-project.org/web/packages/POT/vignettes/POT.pdf (accessed on 25 February 2019).
- Lindholm, O.; Endresen, S.; Thorolfsson, S.; Sægrov, S.; Jakobsen, G.; Aaby, L. Veiledning i klimatilpasset overvannshåndtering [Guide for Climate Addapted Stormwater Management]; Norsk Vann: Hamar, Norway, 2009. [Google Scholar]
- Watt, E.; Marsalek, J. Critical review of the evolution of the design storm event concept. Can. J. Civ. Eng. 2013, 40, 105–113. [Google Scholar] [CrossRef]
- Burns, M.J.; Fletcher, T.D.; Walsh, C.J.; Ladson, A.R.; Hatt, B.E. Hydrologic shortcomings of conventional urban stormwater management and opportunities for reform. Landsc. Urban Plan. 2012, 105, 230–240. [Google Scholar] [CrossRef]
- Johannessen, B.; Muthanna, T.; Braskerud, B.; Johannessen, B.G.; Muthanna, T.M.; Braskerud, B.C. Detention and Retention Behavior of Four Extensive Green Roofs in Three Nordic Climate Zones. Water 2018, 10, 671. [Google Scholar] [CrossRef]
- Direktoratet for Byggkvalitet (DiBK). Byggteknisk forskrift med veiledning (TEK10) [Building construction regulation (TEK17)]. 2017. Available online: https://dibk.no/byggeregler/tek/ (accessed on 25 February 2019).
- Minnesota Pollution Control Agency (MPCA). Minneasota Storm Water Manual. 2018. Available online: https://www.pca.state.mn.us/water/minnesotas-stormwater-manual (accessed on 25 February 2019).
- Paus, K.H.; Braskerud, B.C. Suggestions for Designing and Constructing Bioretention Cells for a Nordic Climate. VATTEN - J. Water Manag. Res. 2014, 70, 139–150. [Google Scholar]
- Gao, J.; Pan, J.; Hu, N.; Xie, C. Hydrologic performance of bioretention in an expressway service area. Water Sci. Technol. 2018, 77, 1829–1837. [Google Scholar] [CrossRef] [PubMed] [Green Version]
- Paus, K.H.; Muthanna, T.M.; Braskerud, B.C. The hydrological performance of bioretention cells in regions with cold climates: seasonal variation and implications for design. Hydrol. Res. 2016, 47, 291–304. [Google Scholar] [CrossRef]
- Solheim, E.B. Infiltration for Sustainable Urban Drainage Systems (SUDS)—An Assessment of Methods for Site Specific Infiltration Measurements. Master’s Thesis, Norwegian University of Life Sciences (NMBU), Ås, Norway, January 2017. [Google Scholar]
- Oudin, L.; Hervieu, F.; Michel, C.; Perrin, C.; Andréassian, V.; Anctil, F.; Loumagne, C. Which potential evapotranspiration input for a lumped rainfall–runoff model?: Part 2—Towards a simple and efficient potential evapotranspiration model for rainfall–runoff modelling. J. Hydrol. 2005, 303, 290–306. [Google Scholar] [CrossRef]
- Nash, J.E.; Sutcliffe, J.V. River flow forecasting through conceptual models part I—A discussion of principles. J. Hydrol. 1970, 10, 282–290. [Google Scholar] [CrossRef]
- Rossman, L.A. StormWater Magagement Model User’s Manual (Version 5.1); US EPA Office of Research and Development: Washington, DC, USA, 2015.
- Johannessen, B.G.; Hamouz, V.; Gragne, A.S.; Muthanna, T.M. The transferability of SWMM model parameters between green roofs with similar build-up. J. Hydrol. 2019, 569, 816–828. [Google Scholar] [CrossRef]
- Severson, L.; Atchison, D. RECARGA User ’s Manual (Version 2.3). 2004. Available online: https://dnr.wi.gov/topic/stormwater/documents/InfStdsTools/RECARGA2-3User_Manual.pdf (accessed on 25 February 2019).
- Butler, D.; Davies, J.W. Chapter 14: Storage. In Urban Drainage; Spon Press: London, UK, 2011. [Google Scholar]
- The City of Oslo. Overvannshåndtering. En veileder for utbygger [Stormwater management. A guideline for developers] Version 1.3; The City of Oslo: Oslo, Norway, 2017. [Google Scholar]
- Rossman, L.A.; Huber, W.C. Storm Water Management Model Reference Manual Volume III—Water Quality; US Environmental Protection Agency: Cincinnati, OH, USA, 2016.
- Muthanna, T.M.; Viklander, M.; Blecken, G.; Thorolfsson, S.T. Snowmelt pollutant removal in bioretention areas. Water Res. 2007, 41, 4061–4072. [Google Scholar] [CrossRef] [PubMed]
- Rosa, D.J.; Clausen, J.C.; Dietz, M.E. Calibration and Verification of SWMM for Low Impact Development. JAWRA J. Am. Water Resour. Assoc. 2015, 51, 746–757. [Google Scholar] [CrossRef]
Figure 1.
High-level description of the steps and data flow from temporal downscaling to performance assessment of local stormwater measures.
Figure 1.
High-level description of the steps and data flow from temporal downscaling to performance assessment of local stormwater measures.
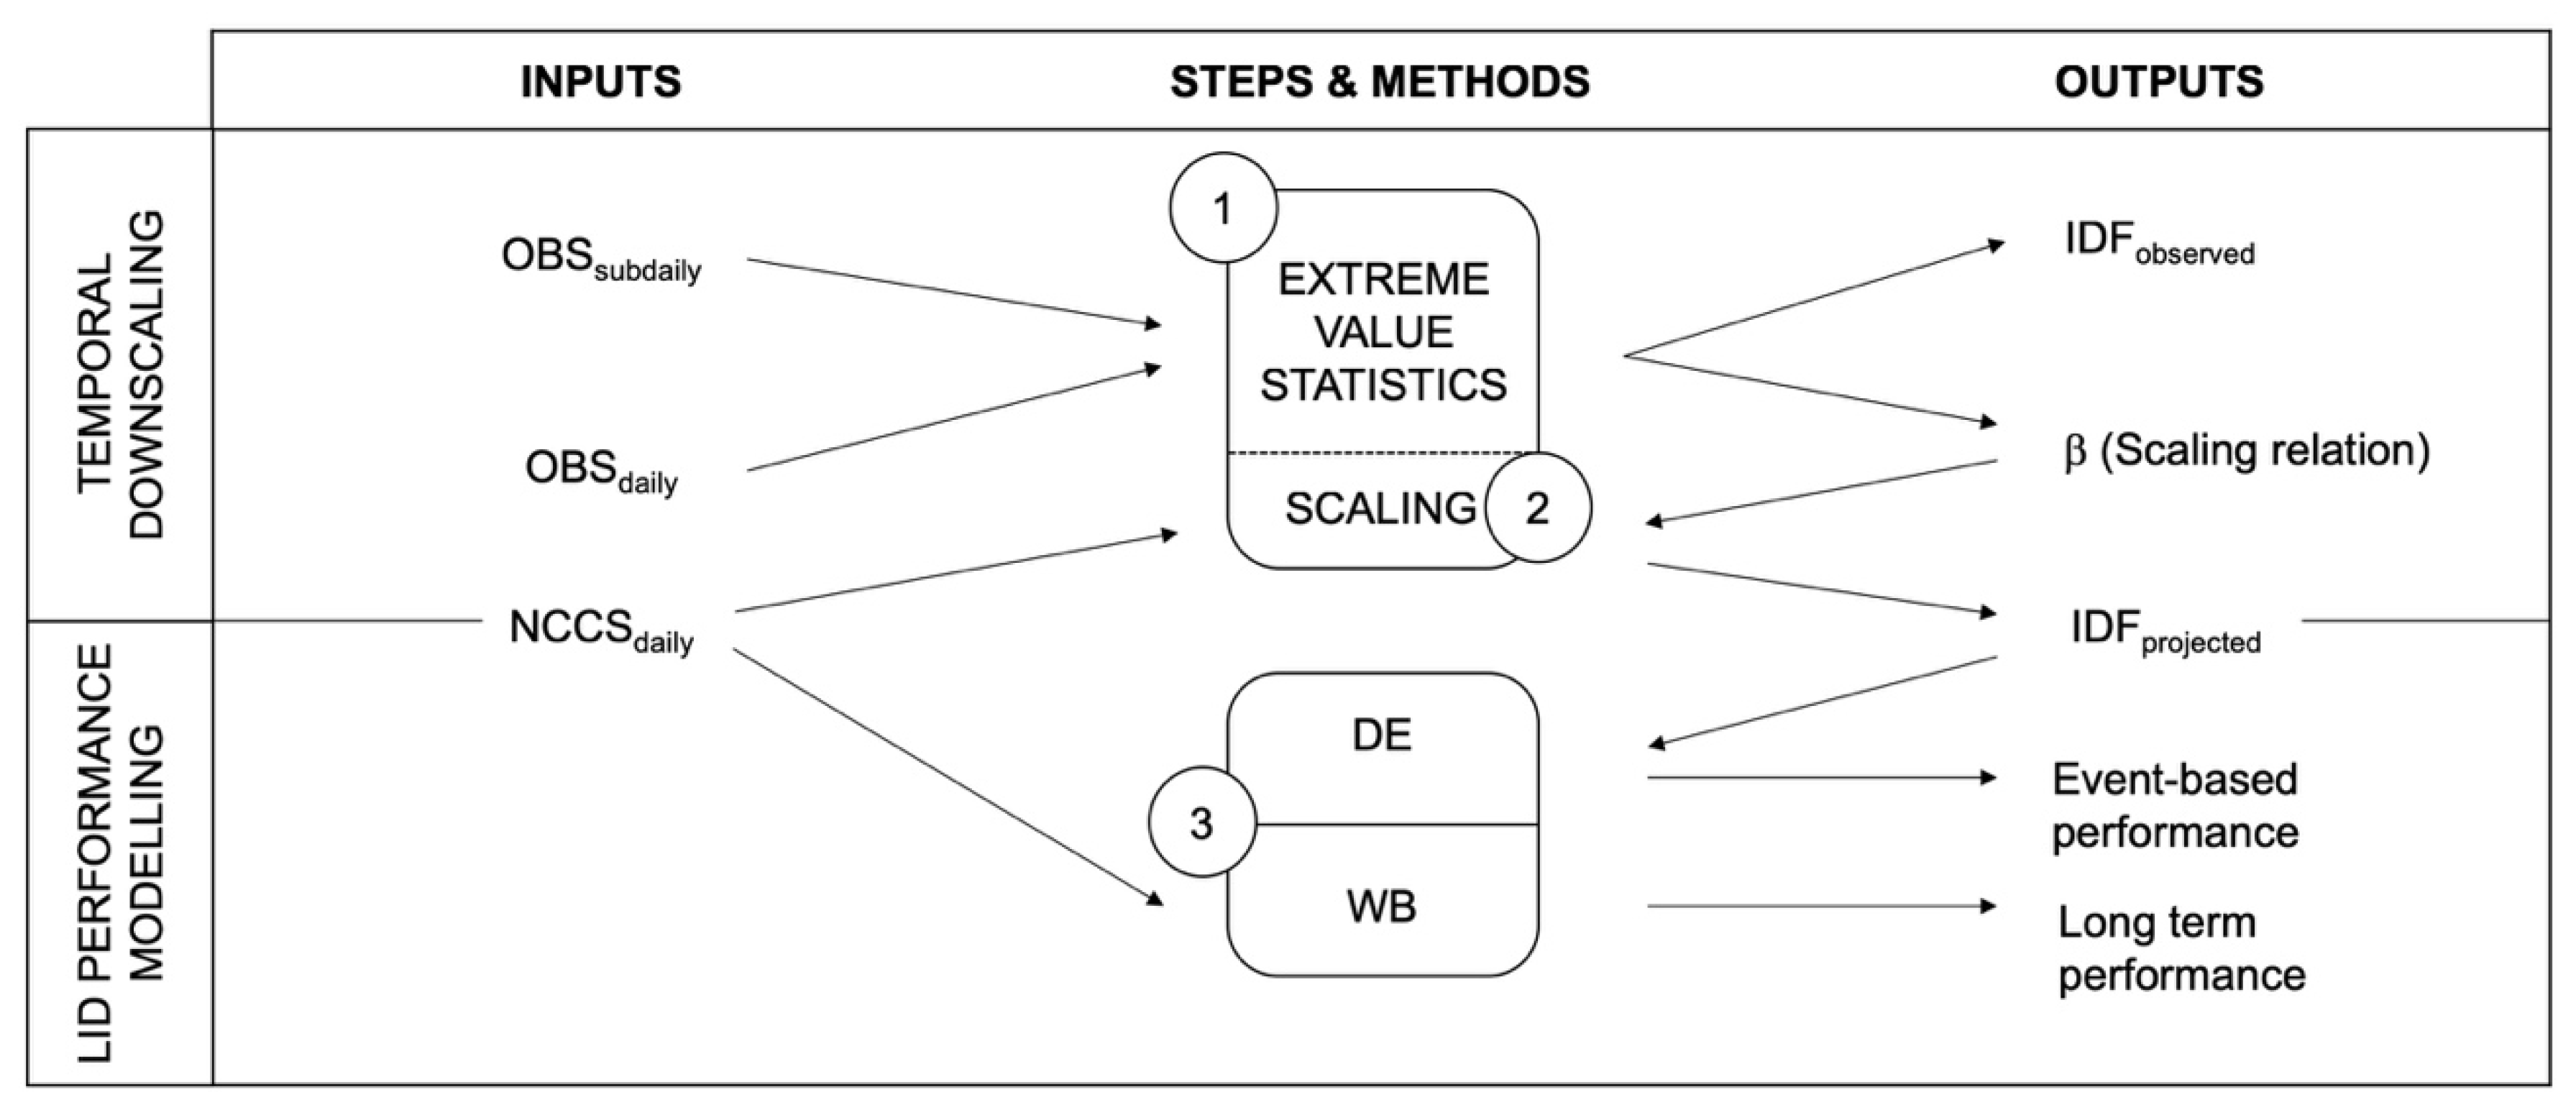
Figure 2.
Map showing the studied cities Bergen, Oslo, and Trondheim, and their location in Northern Europe [35].
Figure 2.
Map showing the studied cities Bergen, Oslo, and Trondheim, and their location in Northern Europe [35].

Figure 3.
Estimated return levels of observed precipitation depth and observed trend with increasing duration for the three locations: (a) Bergen, (b) Oslo, and (c) Trondheim.
Figure 3.
Estimated return levels of observed precipitation depth and observed trend with increasing duration for the three locations: (a) Bergen, (b) Oslo, and (c) Trondheim.

Figure 4.
Estimated observed and scaled intensity-duration-frequency (IDF) curves for return periods T = (2, 5, 10, 20, 30, 50, 100) years for the three locations Bergen (a), Oslo (b) and Trondheim (c).
Figure 4.
Estimated observed and scaled intensity-duration-frequency (IDF) curves for return periods T = (2, 5, 10, 20, 30, 50, 100) years for the three locations Bergen (a), Oslo (b) and Trondheim (c).

Figure 5.
Average climate for preset (year 1961–1990) and future (year 2071–2100, median, maximum and minimum of 10 projections) normal periods: (a) average annual temperature, (b) average daily precipitation.
Figure 5.
Average climate for preset (year 1961–1990) and future (year 2071–2100, median, maximum and minimum of 10 projections) normal periods: (a) average annual temperature, (b) average daily precipitation.

Figure 6.
Comparison of T = 20 year return levels for locations Bergen, Oslo and Trondheim. Observed curves are shown as lines, while projections are visualized as bans representing the max/min-range of the scenarios.
Figure 6.
Comparison of T = 20 year return levels for locations Bergen, Oslo and Trondheim. Observed curves are shown as lines, while projections are visualized as bans representing the max/min-range of the scenarios.

Figure 7.
Climate factors (CF) of hourly precipitation intensity, calculated as the relative difference between observed and projected return levels for locations Bergen, Oslo and Trondheim.
Figure 7.
Climate factors (CF) of hourly precipitation intensity, calculated as the relative difference between observed and projected return levels for locations Bergen, Oslo and Trondheim.

Figure 8.
Green roof retention performance for present (year 1961–1990) and future (year 2071–2100, median, maximum and minimum of 10 projections) normal periods: (a) average annual retention; (b) median available retention capacity in temperate season (May through October).
Figure 8.
Green roof retention performance for present (year 1961–1990) and future (year 2071–2100, median, maximum and minimum of 10 projections) normal periods: (a) average annual retention; (b) median available retention capacity in temperate season (May through October).

Figure 9.
Green roof drought considerations for preset (year 1961–1990) and future (year 2071–2100, median, maximum and minimum of 10 projections) normal periods: (a) maximum duration of temperate season dry periods expressed by the 99.5% percentile; (b) number of drought incidents in 30 years.
Figure 9.
Green roof drought considerations for preset (year 1961–1990) and future (year 2071–2100, median, maximum and minimum of 10 projections) normal periods: (a) maximum duration of temperate season dry periods expressed by the 99.5% percentile; (b) number of drought incidents in 30 years.
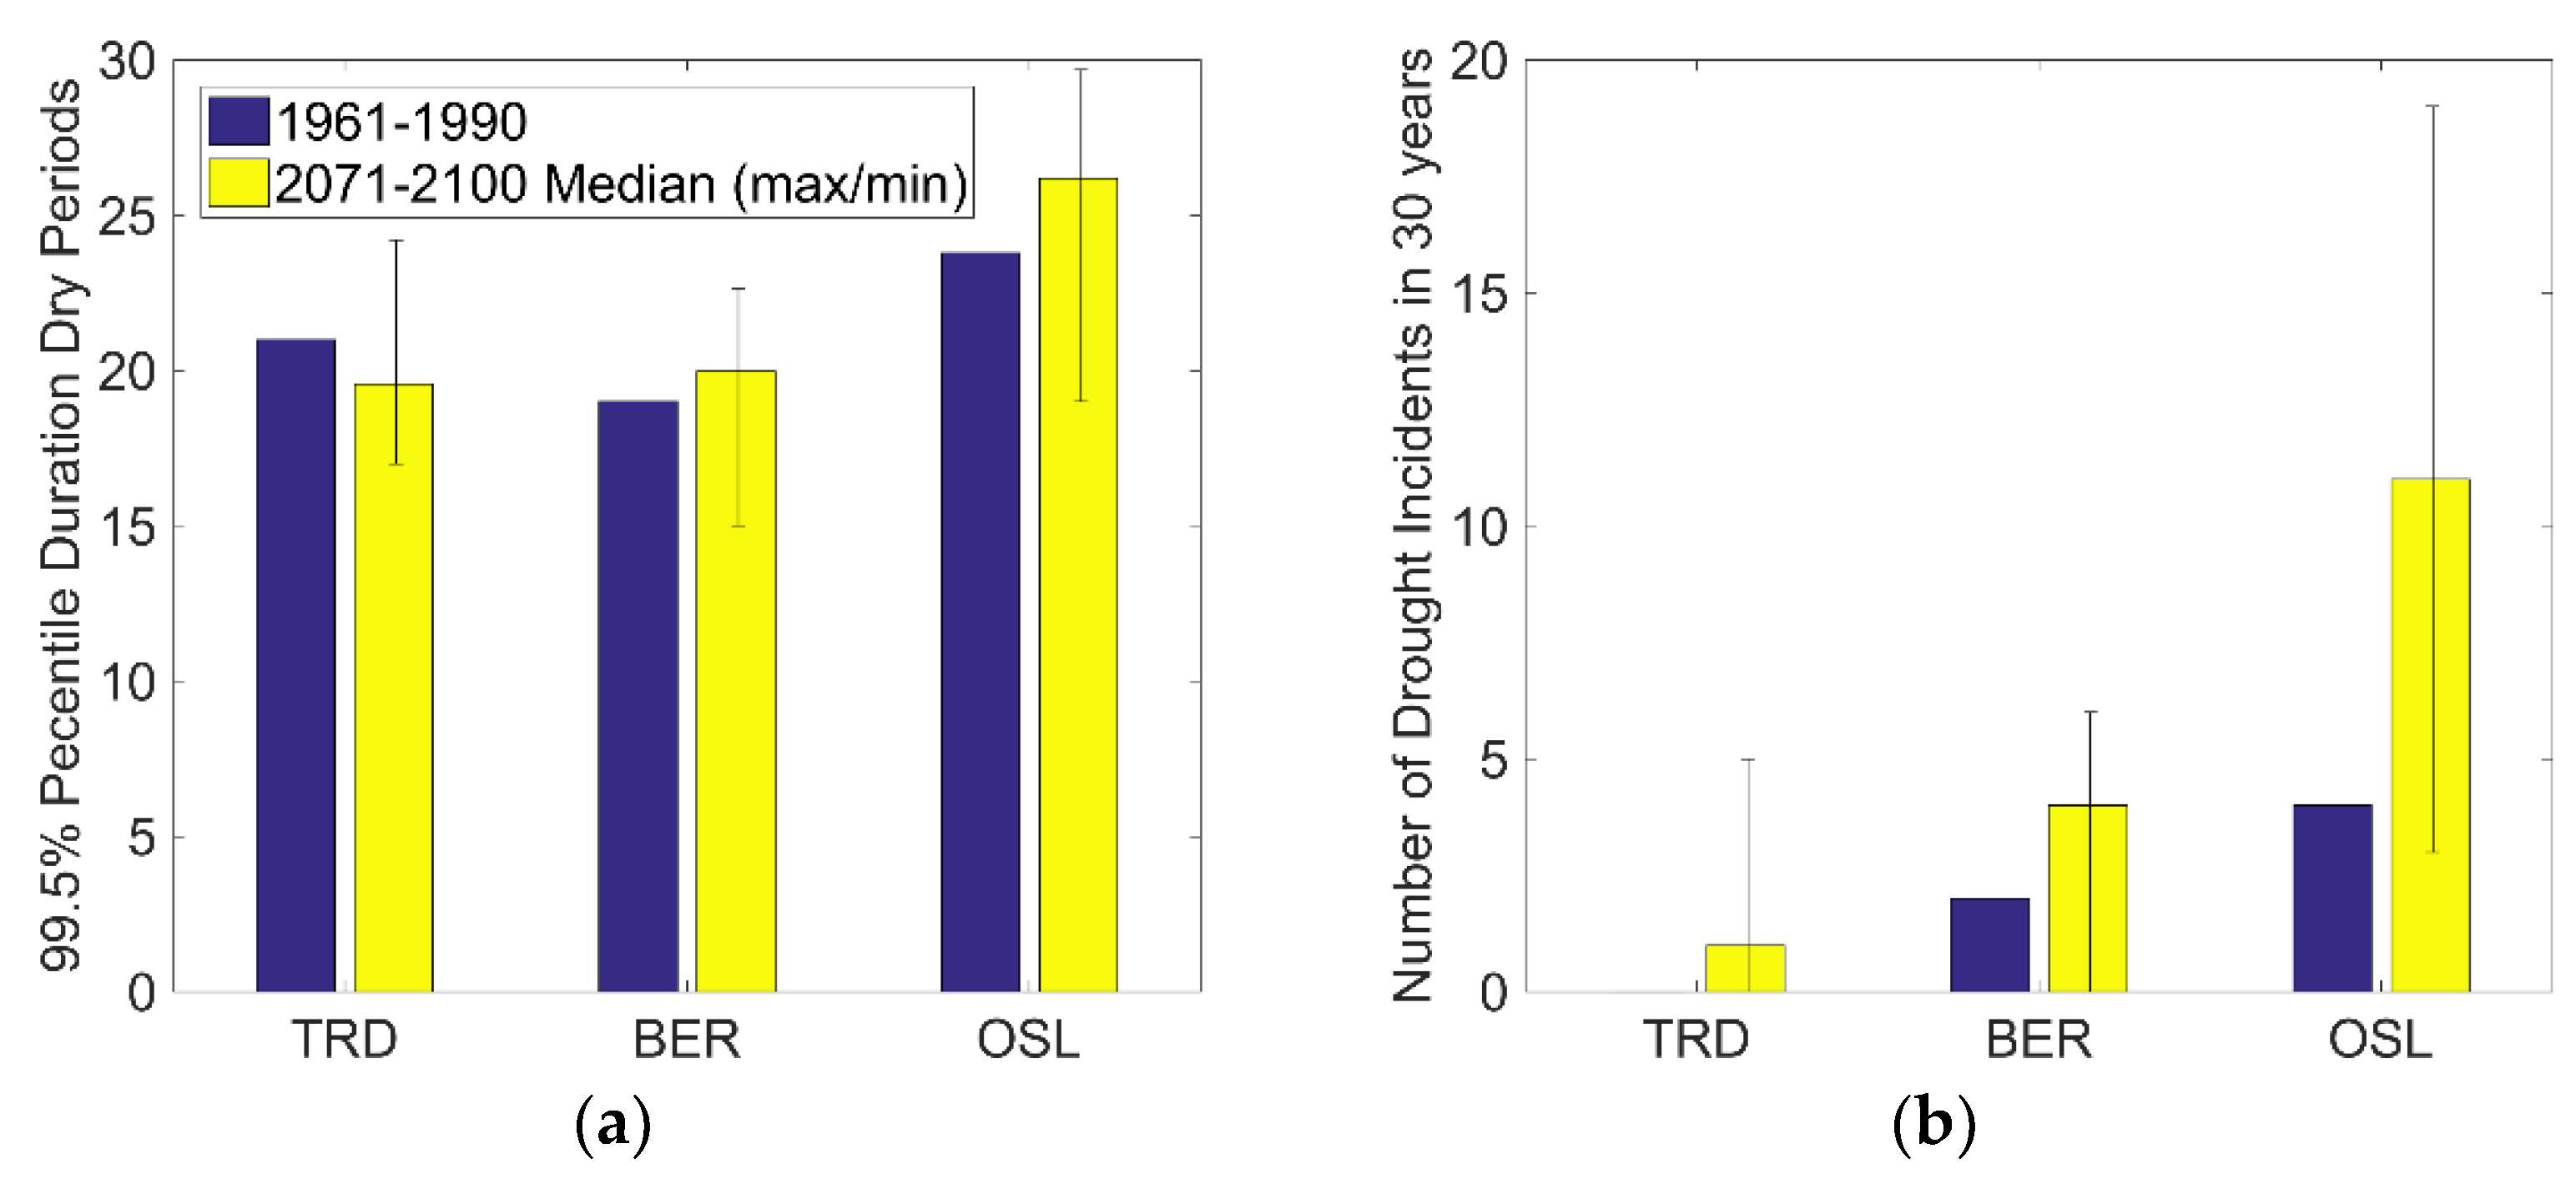
Figure 10.
Bioretention cell performance for preset (year 1961–1990) and future (year 2071–2100, median, maximum and minimum of 10 projections) normal periods: (a) fraction of inflow treated for pollution control; (b) fraction of inflow infiltrated to native soil (volume control).
Figure 10.
Bioretention cell performance for preset (year 1961–1990) and future (year 2071–2100, median, maximum and minimum of 10 projections) normal periods: (a) fraction of inflow treated for pollution control; (b) fraction of inflow infiltrated to native soil (volume control).

Figure 11.
Green roof detention performance. Model results of design events (present, future max and future min) for initial dry and initial wet conditions, in addition to field observations for the locations Trondheim (TRD), Bergen (BER), Oslo (OSL) and Sandnes (SAN): (a) peak reduction; (b) peak delay.

Figure 12.
Bioretention cell detention performance. Model results of design events (present, future max and future min) for initial dry and initial wet conditions, for the locations Trondheim (TRD), Bergen (BER) and Oslo (OSL): (a) peak reduction; (b) peak delay; (c) volume fraction overflowing the unit.

Figure 13.
Stormwater detention basins for present and future situation (median, maximum and minimum of 10 projections), sized based on IDF curves, 20-year return period, 1000 m2 impervious area and a runoff threshold of 20 l/s*ha: (a) required volumes; (b) dimensional rain duration.
Figure 13.
Stormwater detention basins for present and future situation (median, maximum and minimum of 10 projections), sized based on IDF curves, 20-year return period, 1000 m2 impervious area and a runoff threshold of 20 l/s*ha: (a) required volumes; (b) dimensional rain duration.

Figure 14.
Required stormwater detention basin volumes for different combinations of green roofs (GR), bioretention cells (BRC) and detention basins (DB). Model results of design events for present (bar), future- max and min (error bars) for initial wet conditions, based on 1000 m2 impervious area and a runoff threshold of 20 l/s·ha.


Table 1.
Metadata for observed precipitation [36].
Table 1.
Metadata for observed precipitation [36].
| Location | Station ID | Latitude | Longitude | m.a.s.l. | Data Available From | %Missing Data |
|---|---|---|---|---|---|---|
| Bergen | 50539 | 60.4 | 5.3 | 12 | 2003-06-18 | 13.2 |
| Oslo | 18701 | 59.9 | 10.7 | 94 | 1969-04-16 | 31.3 |
| Trondheim | 68230 | 63.4 | 10.4 | 127 | 1986-12-11 | 9.7 |
Table 2.
Modelling framework for local stormwater measures’ performance, with methods and type of results.
Table 2.
Modelling framework for local stormwater measures’ performance, with methods and type of results.
| Measure | Long-Term Performance | Event-Based Performance |
|---|---|---|
| Bio retention cells | Water balance model 1 Infiltration to native soil Filtration for pollutant removal Evapotranspiration | RECARGA Peak reduction Peak delay Infiltration to native soil Filtration for pollutant removal |
| Extensive green roofs | Water balance model 1 Evapotranspiration Runoff Drought considerations | SWMM Green roof module Peak reduction Peak delay |
| Detention basins | No investigation relevant | Rain envelope method Volumes needed Dimensional rain duration |
| Combined measures | No investigation | Comparison of: (1) Detention basin alone (2) Green roof and detention basin (3) Bioretention cell and detention basin (4) Green roof and bioretention cell and detention basin. Detention basin volumes needed |
1 Water balance models were run in MATLAB.
Table 3.
Results of the generalized Pareto distribution (GPD) fitting of daily extremes.
| Location | Value | CPOT | 0.950p | 0.990p | 0.995p |
|---|---|---|---|---|---|
| Bergen | Threshold, μ | 42.904 | 35.680 | 54.136 | 64.140 |
| Scale, σ | 13.338 | 13.117 | 15.227 | 12.427 | |
| Shape, ξ | 0.044 | 0.044 | 0.044 | 0.044 | |
| Chi-sq. p-value | 0.405 | 0.13 | 0.304 | 0.112 | |
| % sub-daily GPD fits with p > 0.05 | 67 | 67 | 67 | 78 | |
| Oslo | Threshold, μ | 21.413 | 18.400 | 31.400 | 35.400 |
| Scale, σ | 8.469 | 8.370 | 6.811 | 8.738 | |
| Shape, ξ | 0.044 | 0.044 | 0.044 | 0.044 | |
| Chi-sq. p-value | 0.095 | 0.044 | 0.192 | 0.183 | |
| % sub-daily GPD fits with p > 0.05 | 33 | 11 | 33 | 44 | |
| Trondheim | Threshold, μ | 19.422 | 15.600 | 27.600 | 36.686 |
| Scale, σ | 9.672 | 8.636 | 10.636 | 8.056 | |
| Shape, ξ | 0.044 | 0.044 | 0.044 | 0.044 | |
| Chi-sq. p-value | 0.120 | 0.035 | 0.163 | 0.570 | |
| % sub-daily GPD fits with p > 0.05 | 44 | 11 | 44 | 56 |
© 2019 by the authors. Licensee MDPI, Basel, Switzerland. This article is an open access article distributed under the terms and conditions of the Creative Commons Attribution (CC BY) license (http://creativecommons.org/licenses/by/4.0/).
Share and Cite
MDPI and ACS Style
Kristvik, E.; Johannessen, B.G.; Muthanna, T.M. Temporal Downscaling of IDF Curves Applied to Future Performance of Local Stormwater Measures. Sustainability 2019, 11, 1231. https://doi.org/10.3390/su11051231
AMA Style
Kristvik E, Johannessen BG, Muthanna TM. Temporal Downscaling of IDF Curves Applied to Future Performance of Local Stormwater Measures. Sustainability. 2019; 11(5):1231. https://doi.org/10.3390/su11051231
Chicago/Turabian StyleKristvik, Erle, Birgitte Gisvold Johannessen, and Tone Merete Muthanna. 2019. "Temporal Downscaling of IDF Curves Applied to Future Performance of Local Stormwater Measures" Sustainability 11, no. 5: 1231. https://doi.org/10.3390/su11051231
Note that from the first issue of 2016, this journal uses article numbers instead of page numbers. See further details here.