Spatial-Temporal Variance of Coupling Relationship between Population Modernization and Eco-Environment in Beijing-Tianjin-Hebei

1
Business School, Hohai University, Nanjing 211100, China
2
School of Public Administration, Hohai University, Nanjing 211100, China
*
Author to whom correspondence should be addressed.
Sustainability 2019, 11(4), 991; https://doi.org/10.3390/su11040991
Submission received: 5 January 2019
/
Revised: 9 February 2019
/
Accepted: 12 February 2019
/
Published: 14 February 2019
(This article belongs to the Special Issue Economic Geography and Sustainable Urban Sprawl)
Abstract
:Steady population growth promotes economic and societal progress, and the symbiotic coordination between the ecological environment and the local population is the necessary requirement for realizing sustainability. We used population modernization and ecological environment data of the Beijing-Tianjin-Hebei from 2005 to 2016 to construct two index systems. We used the variation coefficient method, the coupling degree model, and a geographical detector to analyze the coordination degree of population modernization and the ecological environment. The results showed that: (1) From 2005 to 2016, the coupling degree was stable at a high level, the degree of coordination increased, and the growth rate decreased; (2) From the perspective of spatial distribution, the types of good harmony and high harmony were located in the middle, eastern, and western regions. The adjacent disorder and moderate disorder regions were distributed in the north and south sides; (3) Through influence detection, we found the main factors that influenced the spatial distribution of coordination degree were the natural population growth rate, health technicians/10,000 people, etc. These factors had some characteristics of space-time heterogeneity. Such results can contribute to the understanding of characteristics of population-environment development in different regions, promoting sustainable development of regional environment in Beijing-Tianjin-Hebei.
1. Introduction
Human development is affected by two aspects of the ecological environment. First, the ecological environment provides human beings with resources and energy, which humans then live on and create various sources of production. Second, the waste generated by human beings is purified and absorbed by the ecological environment, so the balance between human society and the natural environment can be maintained. Since the reform and opening of the Chinese society and economy to the world, the accelerated economic development, the sustained growth of population, and the continuous improvement of living standards, people’s need for resources has been constantly increasing. The interaction between human society and the ecological environment has become closer. Effectively measuring the degree of coupling evolution and coordination between population development and the resource environment is an important guarantee for alleviating growth contradictions and promoting sustainable development.
The views on the coordinated development of population and ecological environment can be divided into two categories: optimism and pessimism. Optimism believes [1,2,3,4,5,6] that the limiting problems of economic growth and social development can be avoided under the condition that the regeneration rate of environmental resources is faster than the growth rate of population and consumption. With economic growth, the quality of the ecological environment will not only be free from damage but can be improved to a certain extent, that is, the coordinated development between social economy and the ecological environment can be realized. Pessimism believes [7,8,9,10,11] that the development of human society is the main reason for the increased emissions of environmental pollutants. When the influence of social and economic activities exceeds the carrying capacity of environment, the ecological environment system will be destroyed. There is a certain gap between the social welfare enjoyed by the public and the cost of self-conscious environmental governance. As the gap accumulates, the cost of environmental governance increases rapidly, and increases in social and economic output will worsen the quality of ecological environment. China’s studies on the coordination degree between population and eco-environment mostly use the coupling coordination model to measure the degree of coordination between systems or elements. Principal component analysis (pca) [12,13], the gray correlation degree [14], hierarchical analysis method [15,16,17,18,19], TOPSIS method [20], etc. are widely adopted and classified according to rank to measure issues related to social development.
In recent years, the development of urban agglomeration was promoted to an unprecedented strategic height. At the end of 2016, the urbanization rate of China’s permanent population reached 57.4%. However, with the vigorous development of urban agglomerations, various “urban agglomeration diseases” prominently appeared in various regions, which may be due to the imbalance development between population and environment. The Beijing-Tianjin-Hebei urban agglomeration, as one of China’s largest urban agglomerations, has a high socioeconomic level, but the gap between population modernization and the ecological environment is large in this area. The allocation of resources is highly uncoordinated. In some places, there are even cliff-like gaps in the unequal allocation of human, medical and health, and educational resources [21,22]. At present, there is still a certain gap in the quantitative research of the relationship between the development of China’s population and ecological environment coordination. Presently, urban social development needs to be coupled with population policy and ecological environment policy. Performing quantitative research on the coordination between population modernization and ecological environment will provide practical solutions such as data support for relevant policy operations.
2. Materials and Methods
2.1. Construction of Evaluation Index System
Population modernization is a process of development and change in which the population reproduction type changes from traditional to modern, the population quality is constantly improved, industrialization and urbanization go hand-in-hand, and economic development moves toward modernization. First, the modernization of population reproduction is the foundation and premise of population modernization. In the process of industrialization, urbanization and economic modernization, there are many factors contributing to the decline of fertility rate, such as the increase in the cost of raising a child, the change of women’s social status, etc. In addition, some countries and regions vigorously promote the population policy of birth control, thus resulting in the decline of fertility rate. Only when the fertility rate falls below the replacement level can we say that the modernization of population reproduction is basically complete. Therefore, birth rate and death rate were selected to measure the modernization of population reproduction. Second, the modernization of population quality includes the modernization of population physical health quality and the modernization of educational technology quality. The higher the national health level is, the higher the national population quality modernization level is. Educational quality is not only the knowledge crystallization accumulated for a long time in the process of understanding nature and society and transforming nature and society, but also the ability to understand and transform the world gradually formed by human beings. Therefore, the number of full-time teachers in ordinary colleges and universities, the number of students in ordinary colleges and universities, hospital beds/10,000 people, and health technicians/10,000 people were selected to measure the modernization of population quality. Third, the modernization of population structure mainly includes the modernization of population industrial structure and the modernization of urban-rural population structure. The modernization of population industrial structure refers to the process in which the proportion of the population employed in the primary industry gradually decreases and the proportion of the population employed in the tertiary industry gradually increases. The modernization of the urban-rural population structure refers to the process of improving the urbanization rate. Therefore, the proportion of employees in the tertiary industry and urbanization rate were selected to measure the modernization of population structure. Fourth, the modernization of social economy and the population modernization complement each other. Therefore, GDP per capita, retail sales of consumer goods per capita, and the proportion of the tertiary industry in the GDP were selected to measure the modernization of social economy. Based on above and previous research achievements [23,24,25,26,27], this paper selected 11 indicators to represent the population modernization level from four aspects of population reproduction modernization, the modernization of population quality, the modernization of population structure and the modernization of social economy. According to the structural concept defined by the PSR model, nine indicators were selected from three aspects of pressure, state, and response to characterize the ecological environment level, and the evaluation index systems for population modernization and the ecological environment were formed together (Table 1).
The original data were obtained from the Chinese urban statistical yearbook (2006–2017), the Hebei economic yearbook (2006–2017), as well as the government work reports and statistical bulletins of Beijing, Tianjin and various prefecture-level cities in Hebei province.
2.2. Methods
2.2.1. Variation Coefficient Method
Population modernization systems and ecological environment systems are both comprehensive and complex. To reflect the relative importance of each index in the system objectively and determine the index weight more reasonably, the coefficient of the variation method is used in relevant calculations.
To avoid the influence of the dimensionality of indexes, the indexes are first classified and standardized according to the positive and negative directions. The formula is as follows:
where is the original value; is the maximum value; is the minimum value; is the standardized value.
The variation method coefficient is used to determine the weight of each index, and the formula is as follows [25]:
where is the standard deviation; is the average; is the weight; is the variation coefficient.
2.2.2. Coupling Harmonious Degree Model
Assuming that the indicators representing the population modernization system include , then its comprehensive evaluation function is [28,29]:
where is the number of indicators; is the weight; is the standardized value; is the comprehensive development index.
Assuming that the indicators representing the eco-environmental system include , then its comprehensive evaluation function is [28,29]:
where is the number of indicators; is the weight; is the standardized value; is the comprehensive development index.
The phenomenon in which two or more systems interact due to their own multiple interactions with the outside world is called coupling. The coupling model of the two systems is [27,30,31,32,33]:
where is the degree of coupling between population modernization and the ecological environment, . The larger the value is, the higher the degree of coupling between population modernization and the ecological environment, and vice versa. The degree of coupling is minimal in , thus indicating that the two systems do not affect each other.
The degree of interaction between the two systems can be represented by the degree of coupling. However, the coordinated development level of population modernization and the ecological environment has not been reflected. Based on this finding, the coupling coordination degree model is constructed as follows [27,30,31,32,33]:
where is the coupling coordination degree; is the coupling degree of population modernization and the ecological environment; is the comprehensive coordination index of the two systems; are the undetermined coefficients. They are, respectively, the contribution of population modernization and ecological environment to coupling coordination degree. Because the contribution of the modern population system and the ecological environment system to the coupling coordination relationship is equivalent, we take . According to the value of , the coupling coordination degree between the two systems increases with the increase of value. According to the method of uniform distribution function and in combination with the actual socioeconomic development of Beijing-Tianjin-Hebei, the coordination types of the two systems are divided into six levels from inferior to superior [25,26] (Table 2).
2.2.3. Geographic Detector Analysis
In combining the economic society, natural environment, and other factors, the analysis of the coupling relationship between population modernization and the ecological environment needs to satisfy various traditional assumptions. The study of disease risk factors was initially applied to the geographical detector, and in its subsequent development, the geographical detector method was widely used in the interdisciplinary field. To further explore the genetic mechanism of coupling and the coordination degree between the population modernization and ecological environment systems, the geographical detector model is used for analysis [34]:
where is the number of sub-region samples; is the total sample number; is the number of sub-regions; is the overall variance of the coupling coordination degree of population modernization and ecological environment; is the variance of the sub-regions; is the detection force value of the detection factor . ; the larger the value of , the greater the influence of the factor on the coupling coordination degree. We confirmed that the factor had no influence on the coupling coordination degree in .
3. Results
3.1. Overall Development Trend of Coupling Coordination Degree
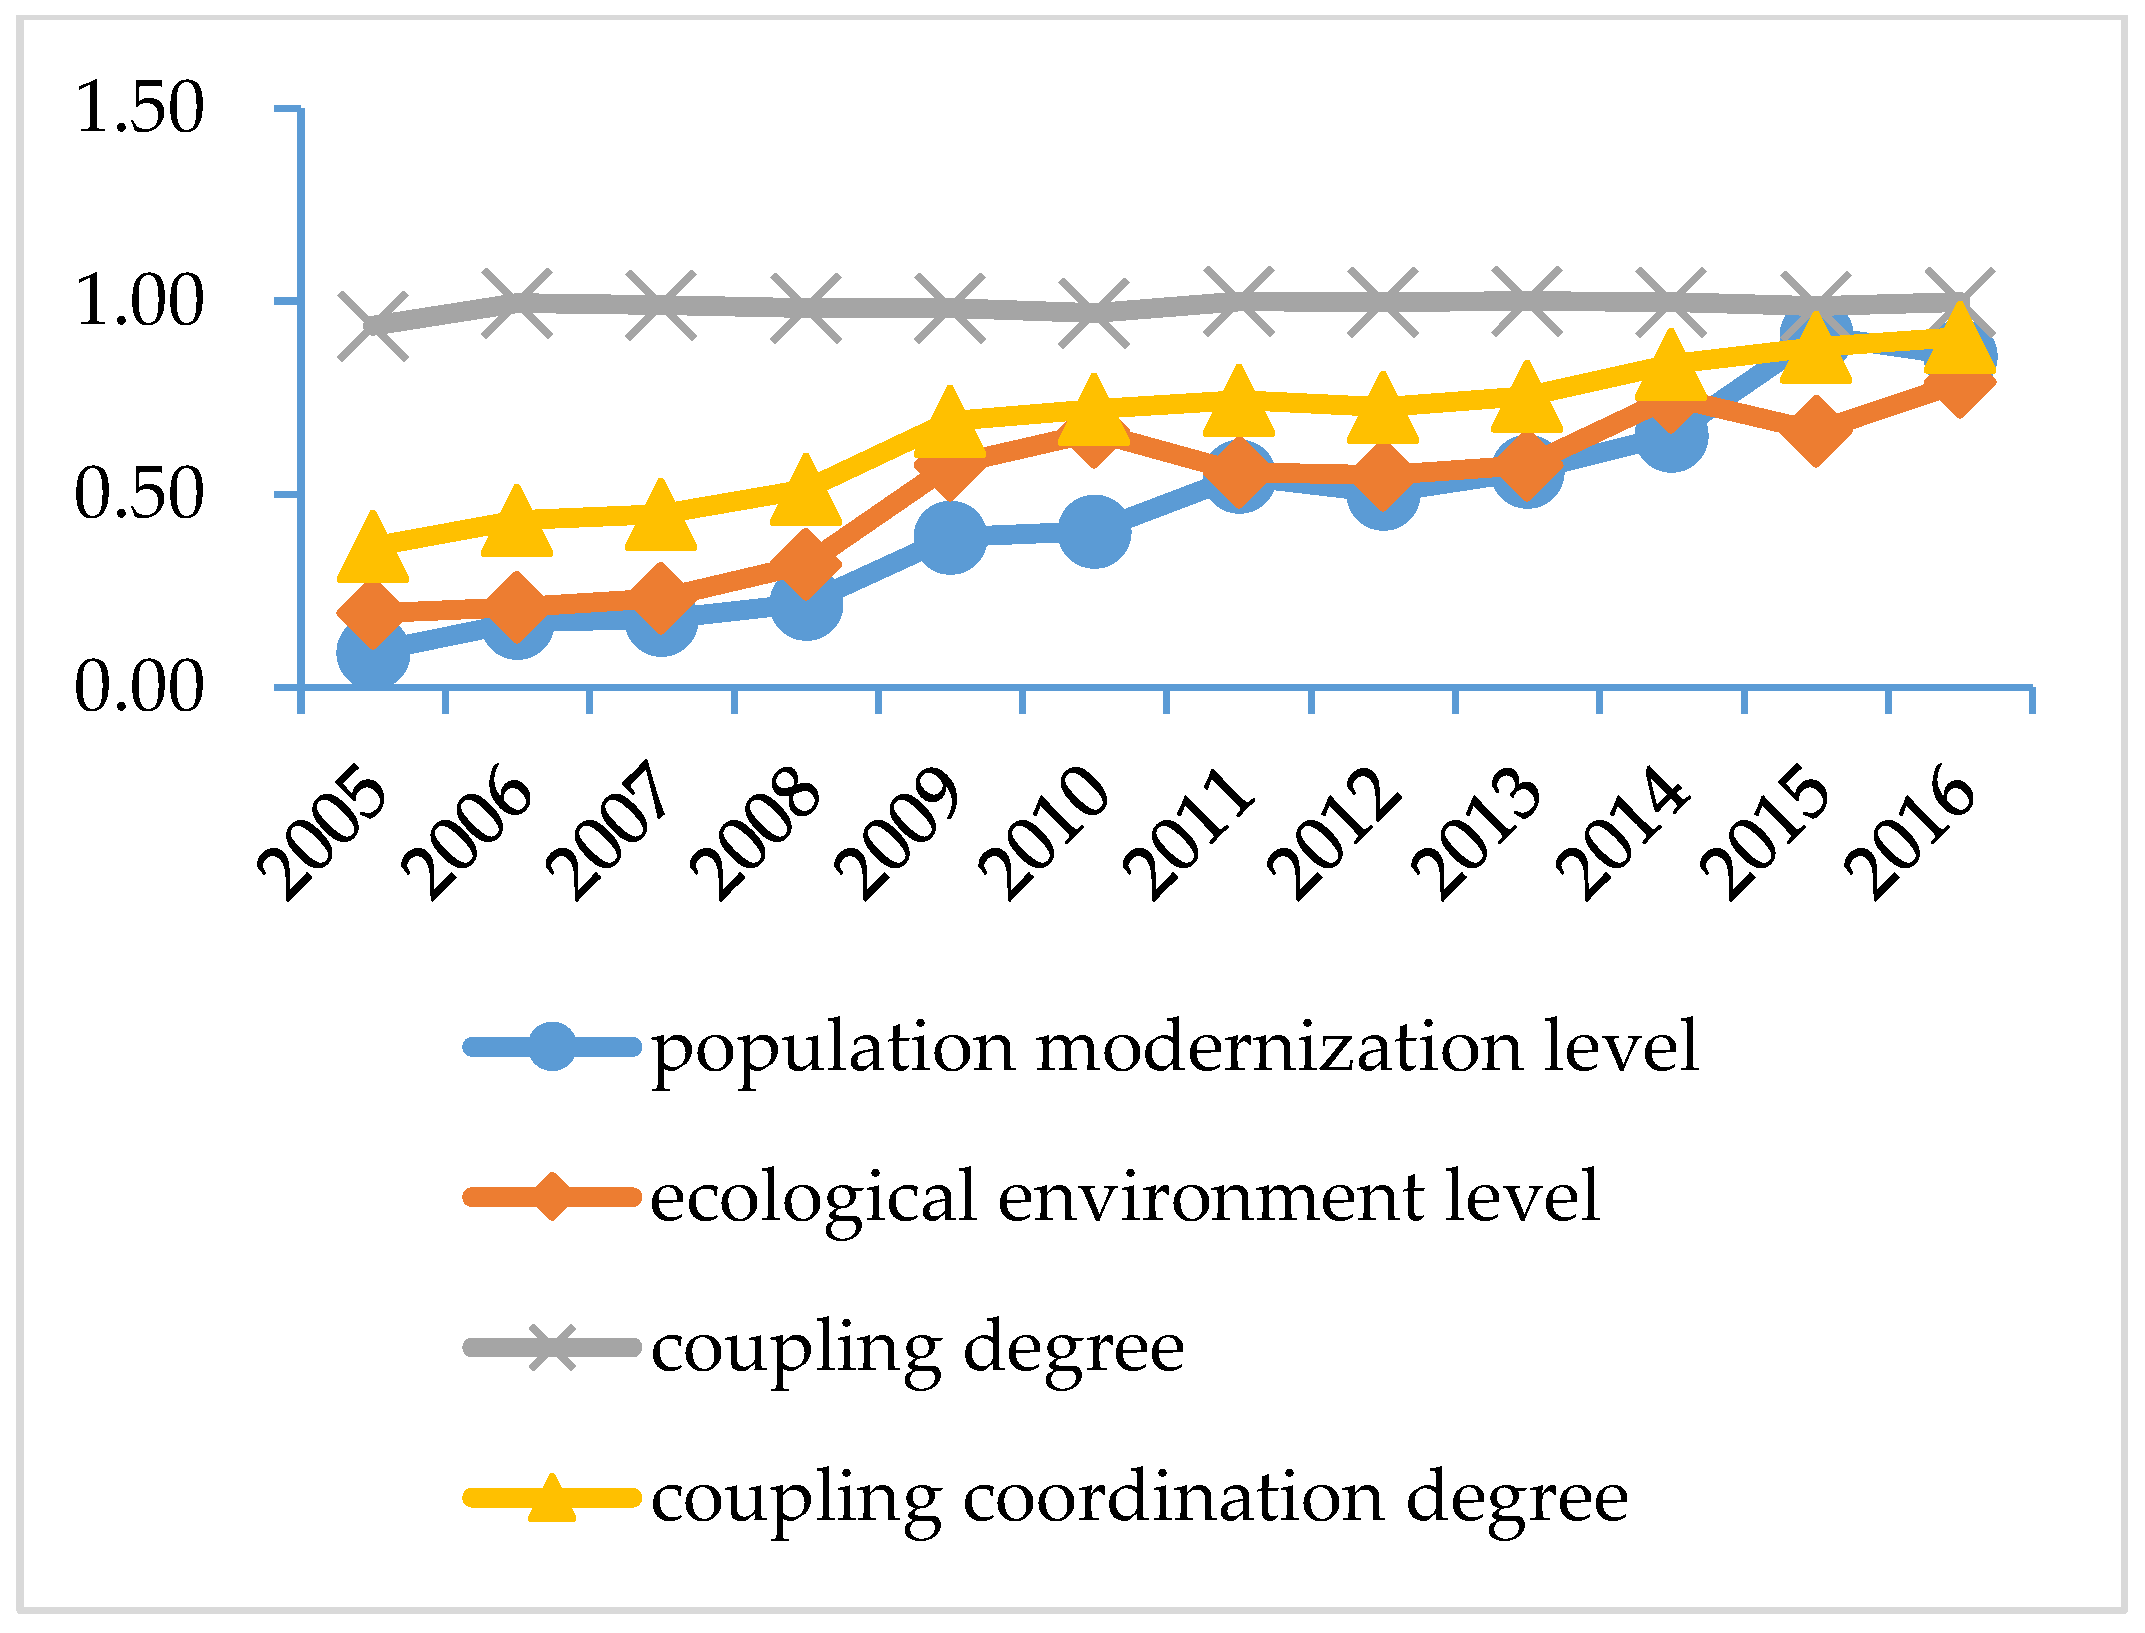
After classifying the indexes in positive and negative directions and standardizing them, the weight of each index was determined by the variation method coefficient, and the development level of population modernization and the ecological environment from 2005 to 2016 and the development trend of the degree of coupling and coordination between the two systems were obtained (Figure 1). From 2005 to 2016, the degree of coupling was stable at a higher level, and the degree of coordination continued to rise. The rates then increased from high to low, which indicated that: First, the coupling coordination degree between population modernization and the ecological environment showed the dissimilation at different stages of economic and social development. At present, the population modernization of the Beijing-Tianjin-Hebei urban agglomeration is closely related to the ecological environment and presents a state of dependent development. Second, from Figure 1, the coupling coordination degree of the Beijing-Tianjin-Hebei urban agglomeration development can be divided into two phases: (1) From 2005—2010, the population modernization development level slightly lagged behind the ecological environment development level. However, at this stage, the Beijing-Tianjin-Hebei urban agglomeration depended on its locational advantage and policy support, thus meeting a fast increase of the population modernization level and bringing greater pressure onto the ecological environment. The ecological environment level fluctuated significantly. The coupling and coordination degree of population modernization and the ecological environment were both improved. (2) From 2011—2016, the population modernization level tied and gradually moved beyond the development of the ecological environment. In this phase, the extensive economic growth pattern gradually disappeared. The development of the Beijing-Tianjin-Hebei urban agglomeration relied more on improving resource utilization and environmental awareness. The degree of coupling between population modernization and the ecological environment was stable at a higher level, and the degree of coordination improved slowly.
3.2. Analysis of Spatial Distribution Characteristics of the Coupling Coordination Degree
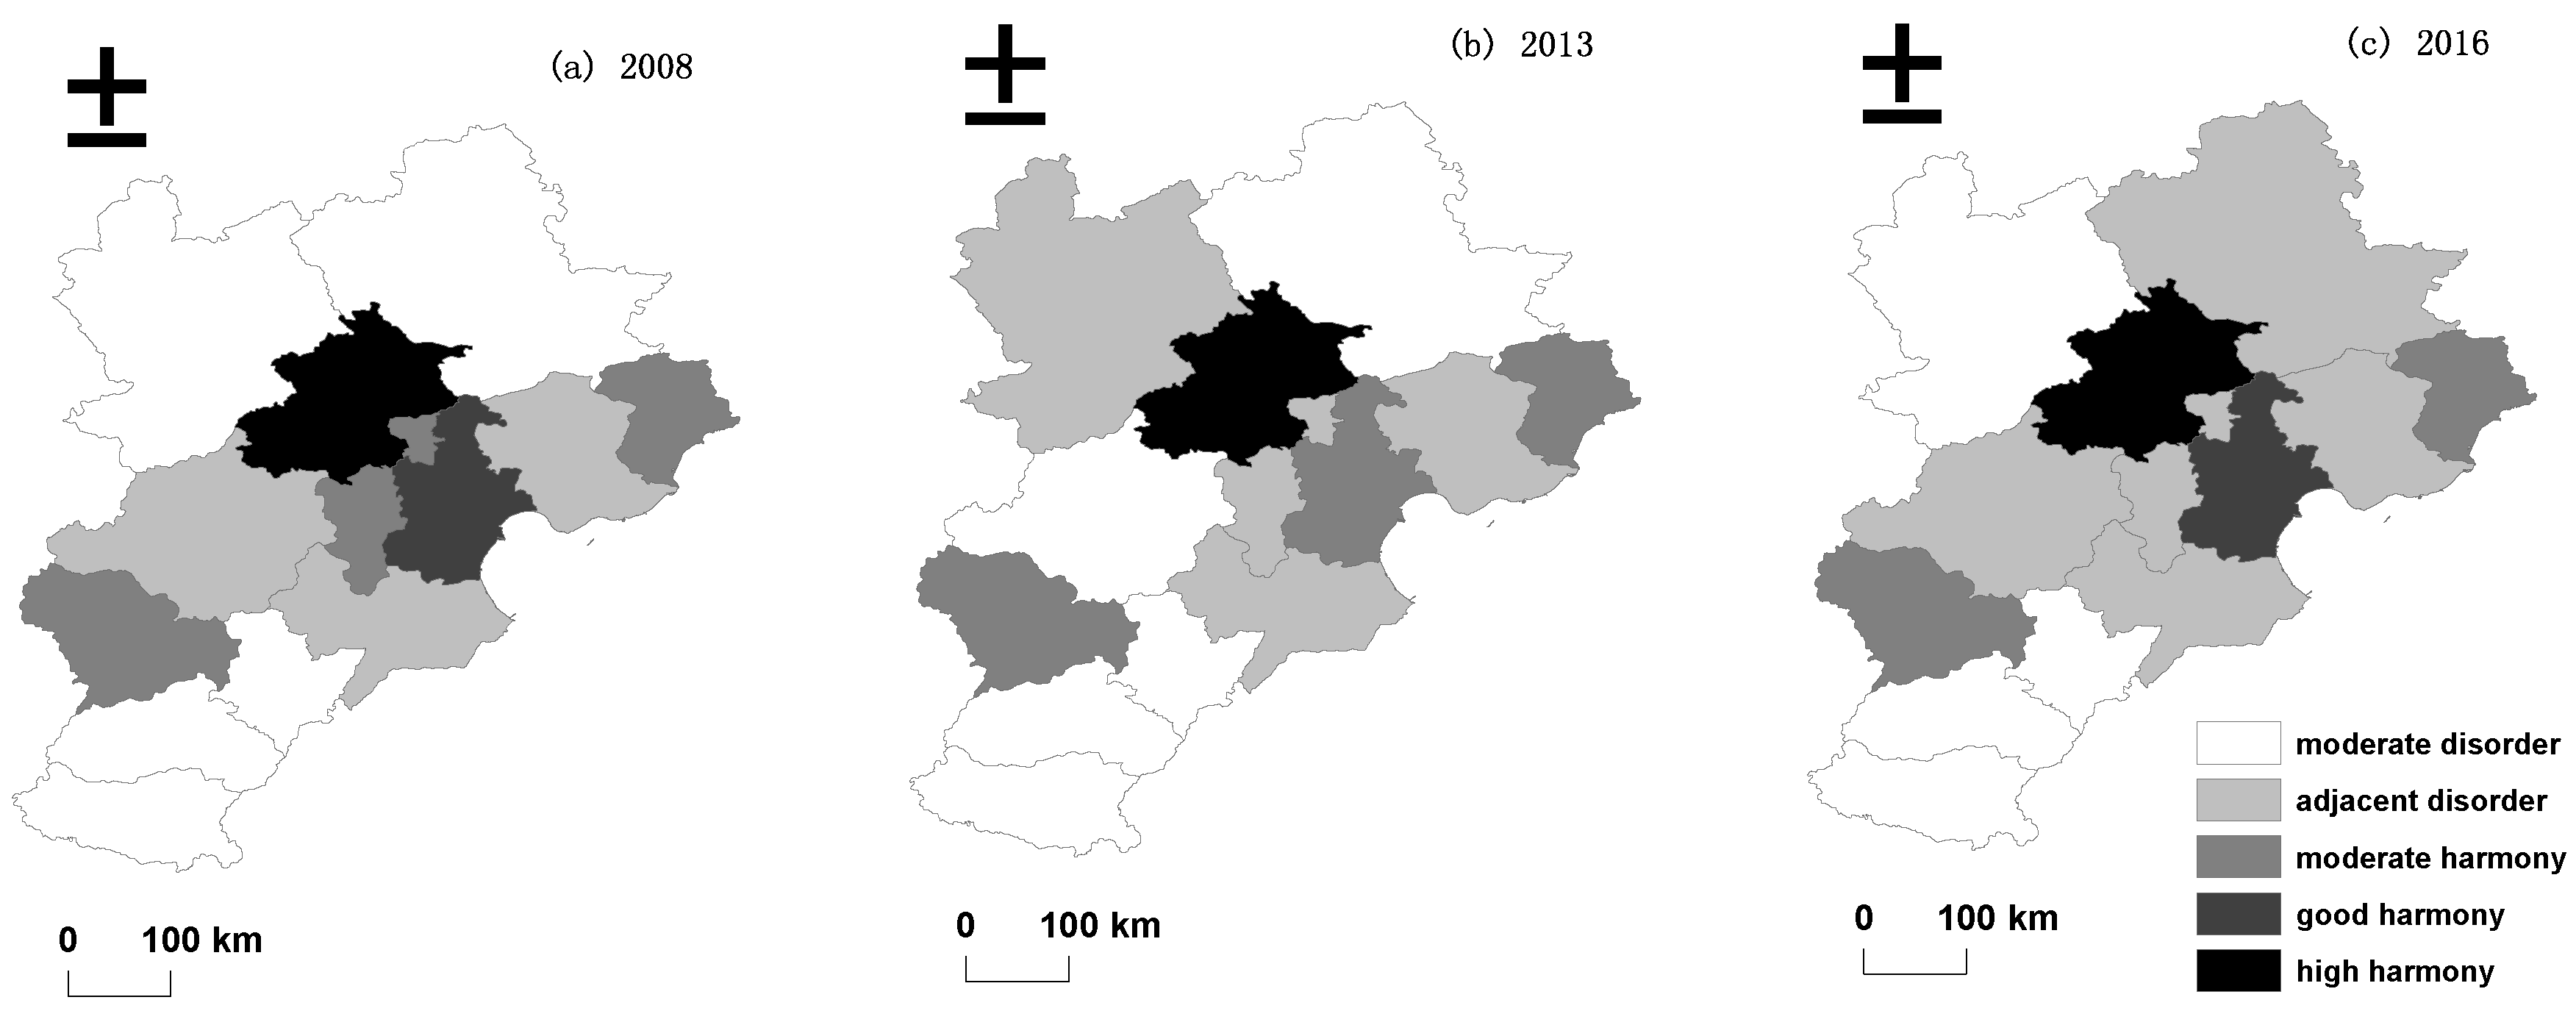
Based on the coupled coordination degree data in 2008, 2013, and 2016, the spatial distribution of population modernization and the ecological environment coupling coordination degree among different regions of the Beijing-Tianjin-Hebei urban agglomeration was plotted by using ArcGIS 10.2 (ESRI, Redlands, CA, USA) (Figure 2).
The coupling coordination degree of population modernization and the eco-environmental characteristics of the Beijing-Tianjin-Hebei urban agglomeration showed an increasing trend in total, but some cities fell back. Moderate disorder, adjacent disorder, and moderate harmony were the main coordination types, and there were few cities with good harmony and high harmony. The overall distribution pattern of the coordination degree is high in the middle and low in the north and south, specifically: (1) High harmony regions due to the high levels of population modernization and the ecological environment, and the coordination degree of Beijing city was maintained at the level of high harmony. (2) Good harmony regions in 2008 and 2016, when Tianjin had relatively high levels of population modernization and ecological environment. As an intermediate node, the degree of coupling and coordination in 2013 was at a relatively low level, which was related to the negative environmental impacts brought by the accelerated economic development and sustained population growth of Tianjin. The rapid development of population size and urbanization has increased the burden on the ecological environment, causing its ecological environment development to lag behind the modernization level of population. (3) Moderate harmony regions Shijiazhuang and Qinhuangdao were in a moderate coordination state, indicating that the two cities were in a benign state of development. This is related to the political and economic status of the capital city, Shijiazhuang and the coastal location advantage of Qinhuangdao. Langfang was in a moderate coordination state in 2008. From 2013 to 2016, Langfang fell into an adjacent disorder state. Langfang is adjacent to Beijing and Tianjin, so it has the locational advantage of economic development. However, in recent years, Langfang undertook the industrial transfer of Beijing and Tianjin, which led to the imbalance between population modernization and the ecological environment development. As a city with a special location in the Beijing-Tianjin-Hebei urban agglomeration, Langfang needs to promote modernization development based on protecting the original ecological environment. (4) Adjacent disorder—in these three years, the proportion of adjacent disorder cities was at 23.1%, 30.8%, and 38.5%, respectively. Although the proportions rose gradually, Figure 1 shows that the percentage increase was all from cities in the “moderate disorder” category of the previous stage. The number of low-coordinated cities with a large base tended to decrease. The imbalance between population modernization and ecological environment development had been alleviated. (5) Moderate disorder—its scope shrank and was gradually concentrated in the south of the Beijing-Tianjin-Hebei urban agglomeration. From figure 1, Chengde, Baoding, Zhangjiakou were all relieved of the imbalance, but there were unstable fluctuations. Hengshui, Xingtai, and Handan were moderate disorder cities. Their industrial structures were dominated by iron and steel, building materials, and petrochemical and electric power industries, which are highly polluting and energy-consuming. The south part of the Beijing-Tianjin-Hebei urban agglomeration needs to become a model demonstration for the Beijing-Tianjin-Hebei region. This can be done by accepting industrial transfers as well as improving the utilization rate of resources. The southern zone can also actively build a base for the transformation of high-tech achievements, build a base for innovation and development, and a build base for cooperation between industries, universities and research institutes. The area needs to shift from being dominated by a single industry into a diversified economy and utilize sustainable development, which will then promote the benign coordination and interaction between population modernization and the ecological environment.
3.3. Time Heterogeneity Analysis
The coordinated development of population modernization and the ecological environment is affected by multiple factors of two systems. This paper combines the actual situation of the modernization of population and the coordinated development of the ecological environment in the Beijing-Tianjin-Hebei urban agglomeration. On the basis of the four criteria including modernization of population reproduction, modernization of population quality, modernization of population structure, and modernization of social economy from education, medical care, employment, economic development, and other perspectives, six indicators were selected as exploratory factors for analysis. These six indicators included the natural population growth rate, the number of students in ordinary colleges and universities, health technicians/10,000 people, the proportion of employees in tertiary industries, the urbanization rate, and GDP per capita. In ArcGIS 10.2 (ESRI, Redlands, CA, USA), the natural discontinuous point grading method (Jenks) was used to classify various factors, and the geographical detector analysis method was used to detect the influence of various factors on the coordination degree of population modernization and the ecological environment (Table 3). As shown in Table 3, “the proportion of employees in tertiary industries” was an important factor in all three years, and other factors had different influences on the degree of coordination in different years. In 2008, the coordination degree was mainly affected by health technicians/10,000 people and the proportion of employees in tertiary industries. In 2013 and 2016, the coordination degree was mainly affected by the natural population growth rate and the proportion of employees in tertiary industries. The coordinated development of population modernization and the ecological environment is the result of the interaction of various factors. The sources of driving forces can be summarized as:
- (1)
- Population quality improvement. The modernization of population quality is an important prerequisite for the coordinated development of population modernization and the ecological environment. First, the improvement of civilization represents a higher level of social development and the enhancement of social groups’ awareness of ecological and environmental protections. Second, the first resource for social development is human resources. One of the important prerequisites for population modernization is the maintenance and strong development of national health. The rational allocation of medical resources and education resources is not only related to the interests of the people but also an important basis for promoting economic and social development. As shown in Table 3, the number of students in ordinary colleges and universities and health technicians/10,000 people had an important influence on the degree of coupling coordination. Because the Beijing-Tianjin-Hebei urban agglomeration has important regional advantages, convenient traffic conditions, a suitable climate environment, relatively concentrated universities and profound cultural deposits, the coordinated development of population modernization and the ecological environment is guaranteed.
- (2)
- Optimize social structure. Population structure optimization and industrial structure upgrading play important roles in improving social structure. In the three years, the P value of the proportion of employees in tertiary industries and the urbanization rate increased with fluctuations, and the proportion of tertiary industry practitioners was an important factor in all three years. The optimization of population and industrial structures can improve the stability of urban agglomerations undergoing economic development. When faced with changes in external economic conditions, urban agglomerations can reduce their degree of loss to the minimum or even avoid loss to improve the breadth and depth of the interaction between population modernization and the ecological environment.
- (3)
- Policy guidance and regulation. Government behavior has a certain regularity and regulation. The social economy contains order and disorder states under natural development conditions. The government may feasibly regulate the disordered state of social development. However, when the social economy is in a healthy and orderly development state, the government’s regulation should be reduced or avoided, and only the supervision role of the government should be brought into play to give some incentives to other stakeholders according to their contribution. From 2011 to 2015, China completed the transition from the “two child policy” to the “selective two-child policy,” and finally implemented the “universal two-child policy.” According to Table 3, the P value of the natural population growth rate in 2013 and 2016 were higher than 0.9, which showed a large improvement over 2008. If economic, cultural, political, and other factors remain the original force, to a certain extent, policy factors have an important impact on the development of the coordination degree between population modernization and of the ecological environment.
3.4. Spatial Heterogeneity Analysis
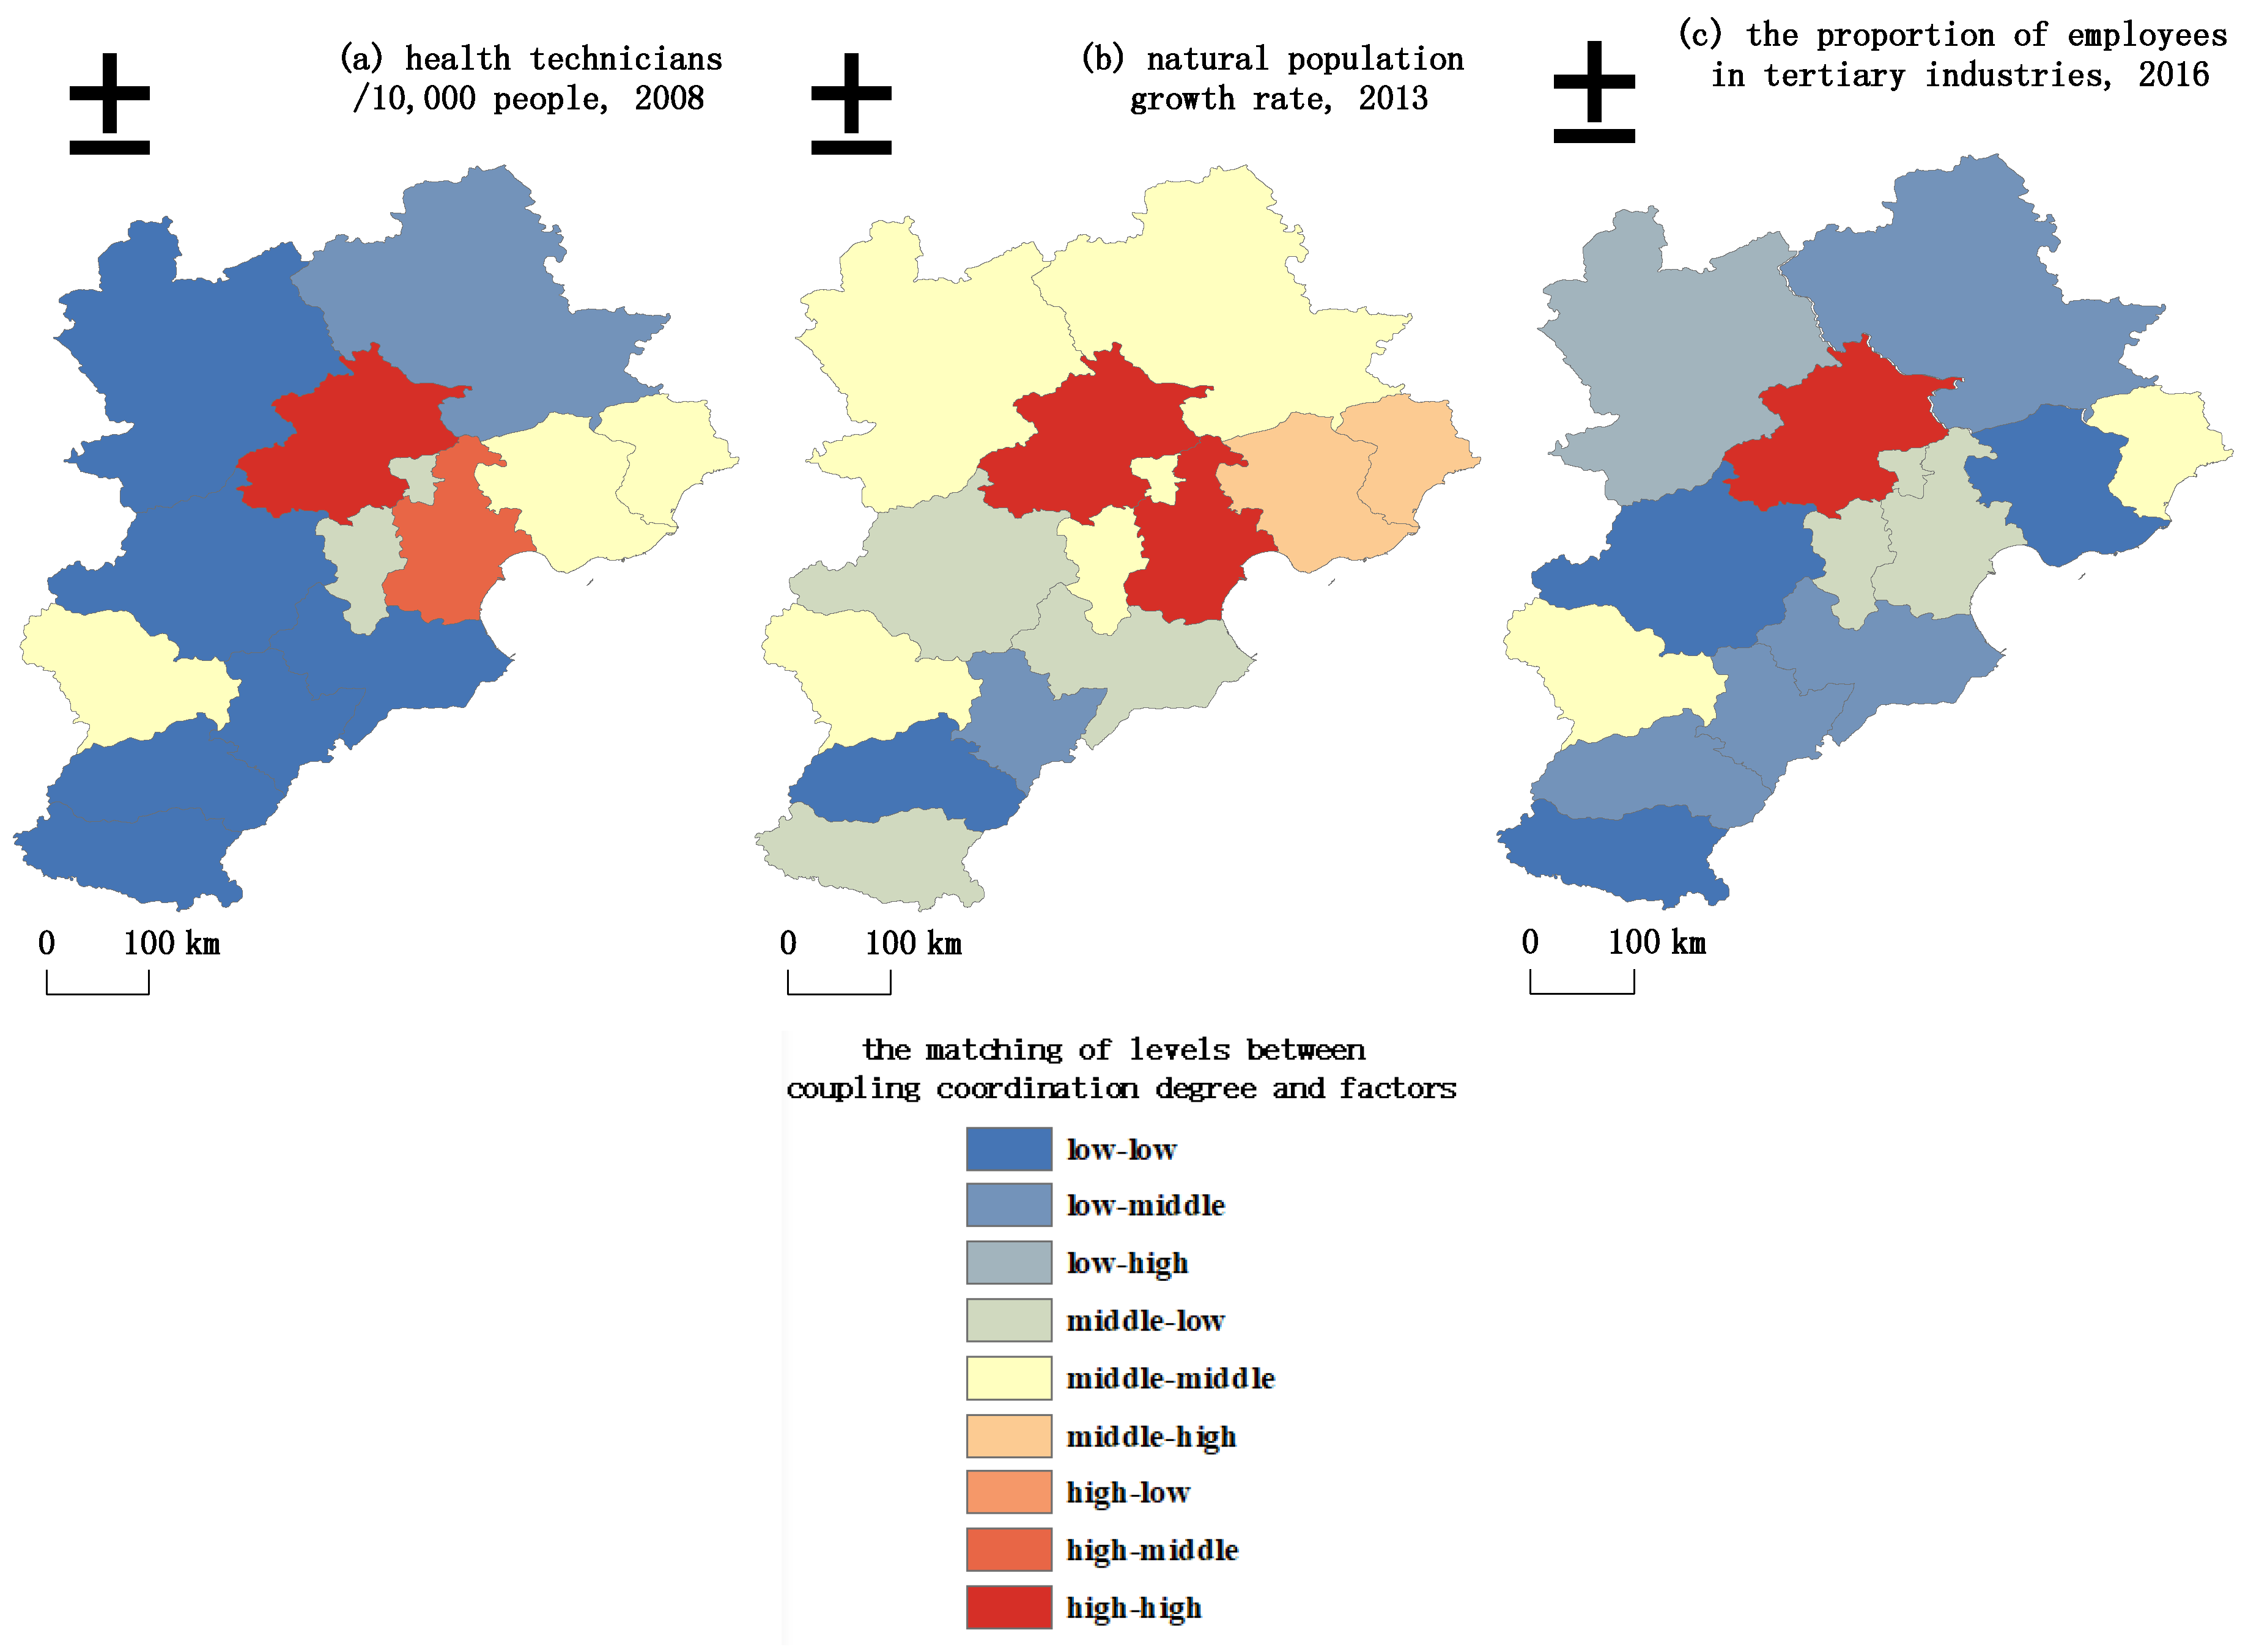
To further analyze the spatial differences of the P value, on the premise of avoiding a repeated selection of elements, this analysis extracts the primary factor of “natural growth rate of population” in 2013, the key factor of “health technicians/10,000 people” in 2008, and the key factor of “the proportion of employees in the tertiary industry” in 2016. The coordination degree and the extracted factors in the three years were classified and processed to further explore their coupling degree (Figure 3). As shown in Figure 3, in 2008, a high coordination-high factor level and a medium coordination-medium factor level were distributed in the Shijiazhuang, Beijing, and Tianjin area and to its east. The figure shows that Beijing, Tianjin, and Shijiazhuang brought together most of the medical resources and medical talents in the Beijing-Tianjin-Hebei urban agglomeration due to their prominent advantages in political, economic, social development, and regional locations. In comparison, other cities lack high-quality medical resources and high-level medical talents, thus presenting a distribution state of low coordination and a low factor level. In 2013, a high coordination-high factor level and a medium coordination-medium factor level were distributed in Shijiazhuang and the central and northern parts of the Beijing-Tianjin-Hebei urban agglomeration. Low coordination-low factor level regions were seldom distributed. This shows that the overall natural population growth rate of the Beijing-Tianjin-Hebei urban agglomeration was relatively low in 2013, and the degree of coordination decreased from the central region to the north and south. In 2016, a high coordination-high factor level and a medium coordination-medium factor level were distributed in Beijing, Shijiazhuang and Qinhuangdao. This indicated that the three cities, relying on a relatively developed economic level and a relatively optimized industrial structure, promote positive interactions between population modernization and the ecological environment. Moreover, the area’s dynamics were also conducive to attracting talent, thus further optimizing the regional social structure and promoting social and economic development.
4. Discussion and Conclusions
4.1. Findings
First, from 2005 to 2016, the degree of coupling between population modernization and the ecological environment was stable at a high level, and the degree of coordination increased while the growth rate slowed down. From the perspective of spatial distribution, in the selected years, the good harmony and high harmony regions were mostly distributed in the central, eastern, and western regions of the Beijing-Tianjin-Hebei urban agglomeration, while the adjacent disorder and moderate disorder regions are mostly distributed on the north and south sides of the city cluster. The indexes on which these conclusions are based are a combination of China city statistical yearbooks, provincial economic yearbooks, local statistical bulletins and government work reports, etc. The accuracy of the analysis results was affected by inconsistent statistical calibers to a certain extent.
Second, the influence degree of each factor on the coupling degree of population modernization and ecological environment was measured via the geographic detector analysis method. The main factors influencing the temporal and spatial differentiation of the coordination degree included the natural population growth rate, health technicians/10,000 people, the proportion of employees in tertiary industries, the urbanization rate, and so on. Therefore, improving population quality, optimizing social structure and guiding policy regulation, and exploring a feasible way to promote the coordinated development of population modernization and the ecological environment are solutions that should all be explored.
Based on the above analysis combined with the research conclusions on the coordinated development of population modernization and the ecological environment in the Beijing-Tianjin-Hebei urban agglomeration, our suggestions and prospects are proposed as follows: (1) The transition from a “government-oriented” population growth model to a “compound” population growth model can promote the healthy development of population modernization. As the Beijing-Tianjin-Hebei urban agglomeration has an extremely important political and economic location, it is highly responsive to national policies. Taking the “natural growth population rate” as an example, the influence of this factor in 2016 is significantly higher than that in 2013, which is related to the implementation of the two-child policy to an extent. In recent years, the constant adjustments of fertility policy affect the progress of the population at the policy level. In addition, the rapid economic and social operation has a growing influence on the modernization level of the population. When the spontaneous mediation mechanism of “economic and social development” can effectively deal with the problems arising from population development, more attention should be paid to the “compound” population growth model. We should respect the law of development and promote the healthy development of a modernized population. (2) Resources can be rationally allocated by improving the grasp on the “chain effect” of education, medical and health development on population modernization. The Beijing-Tianjin-Hebei urban agglomeration is rich in education and medical resources, but the distribution of resources in the region is unbalanced. With the development of education and the medical industry, the physical quality and comprehensive quality of the population are guaranteed. With the improvement in population quality, the chain effect can promote the optimization of employment, industrial and urban social structures. When maintaining the coordination and symbiosis between population development and resource quantity in Beijing and Tianjin, we should provide the matching resources needed by relatively less developed cities to maintain their own development and thus cope with the pressures of transformation, attract talent, and promote the coordinated development of social structure and population quality. (3) Restrict market access for industrial transfers and emphasize green performance on local assessments to avoid “polluting exports.” When the cities of Langfang, Hengshui, Xingtai, and Handan undertake the industrial transfer of Beijing and Tianjin, they should use the resources’ carrying capacity and the capacity of the ecological environment as the important bases for development. In addition, government performance assessments and official environmental assessments must be integrated into the green GDP accounting system and must be subject to the most stringent ecological and environmental protection system, from industrial access to acceptance inspection.
4.2. Conclusions and Future Research
The uncoordinated development of population, resources, and environment is absolute, while the coordinated development is relative. It is urgent to develop resources and protect the environment rationally. At the national and local levels, it is necessary to maintain healthy growth of the population and improve the quality of the population. By transforming the economic growth pattern and optimizing industrial structure, a circular economy can be achieved. By vigorously developing the environmental protection industry and strengthening the protection and governance of the ecological environment, the carrying capacity of environment can be improved. Regions with ecological conditions should rely on tourism economic industry to develop ecological tourism appropriately, so as to realize the promotion of coordinating degree between population modernization and eco-environment.
The interaction between population and ecological environment is a very complicated system engineering. It is of certain exploration value to measure the coupling coordination relationship between population modernization system and ecological environment system by constructing the two systems. However, due to the time constraints of data sources, it was difficult to obtain the latest yearly data for empirical analysis of research problems. Further research is still needed. The scope of research can be expanded. This paper is only a single research of Beijing-Tianjin-Hebei urban agglomeration. The future direction of the research can expand into China’s other urban agglomeration, such as the Yangtze River delta urban agglomeration and the Pearl River delta urban agglomeration. Through the comparative analysis between regions, different regions can learn from each other, so as to achieve a win-win policy effect. Internationally, India, Indonesia, Vietnam, and some other developing countries are also facing the adjustment of population policy and fertility policy, and their ecological environment and resources are also threatened to varying degrees. The results and conclusions of this paper have certain reference significance for the development of countries with similar social environment.
Author Contributions
Conceptualization, M.L.; Data curation, M.L. and C.M.; Formal analysis, M.L.; Funding acquisition, C.M.; Methodology, M.L.; Resources, C.M.; Software, M.L.; Supervision, C.M.; Writing—original draft, M.L.; Writing—review & editing, M.L.
Funding
This work was supported by: The Fundamental Research Funds of Central Universities of China and the fund number is 2018B713X14; Postgraduate Research & Practice Innovation Program of Jiangsu Province and the fund number is KYCX18_0518.
Conflicts of Interest
The authors declare no conflict of interest.
References
- Beckerman, W. Economic growth and the environment: Whose growth? Whose environment? World Dev. 1992, 20, 481–496. [Google Scholar] [CrossRef]
- Arrow, K.; Bolin, B.; Costanza, R.; Dasgupta, P.; Folke, C.; Holling, C.S.; Jansson, B.O.; Levin, S.; Maler, K.G.; Perrings, C.; et al. Economic growth, carrying capacity, and the environment. Science 1995, 268, 520–521. [Google Scholar] [CrossRef] [PubMed]
- Mageau, M.T.; Costanza, R.; Ulanowicz, R.E. Quantifying the trends expected in developing ecosystems. Ecol. Model. 1998, 112, 1–22. [Google Scholar] [CrossRef]
- Bernstam, M.S. The wealth of nations and the environment. Popul. Dev. Rev. 1990, 16, 333–373. [Google Scholar] [CrossRef]
- Hefner, R.A., III. Toward sustainable economic growth: The age of energy gases. Int. J. Hydrog. Energy 1995, 20, 945–948. [Google Scholar] [CrossRef]
- Meadows, D.; Randers, J. The limits to Growth: The 30-Year Update; Routledge: London, UK, 2012. [Google Scholar]
- Ekins, P.; Simon, S.; Deutsch, L.; Folke, C.; De Groot, R. A framework for the practical application of the concepts of critical natural capital and strong sustainability. Ecol. Econ. 2003, 44, 165–185. [Google Scholar] [CrossRef] [Green Version]
- Mishan, E.J.; Mishan, E.J. The Costs of Economic Growth; Staples Press: London, UK, 1967; p. 112. [Google Scholar]
- Pearce, D.; Barbier, E.; Markandya, A. Sustainable Development: Economics and Environment in the Third World; Routledge: London, UK, 2013. [Google Scholar]
- Siebert, H. Nature as a life support system: Renewable resources and environmental disruption. Z. Für Natl. 1982, 42, 133–142. [Google Scholar] [CrossRef]
- Hueting, R. New Scarcity and Economic Growth: More Welfare Through Less Production? North-Holland Publishing Company: Amsterdam, The Netherlands, 1980. [Google Scholar]
- Li, X.M.; Li, W.N. Quantitative analysis about coordinating development of environment of urban human settlements and economy in Dalian since the 1990s. Econ Geogr. 2005, 3, 383–390. [Google Scholar]
- Wu, W.H.; Niu, S.W.; Guo, X.D.; Chang, H.L.; Li, G. Evolutional analysis of coupling between population and resource-environment in China. Procedia Environ. Sci. 2012, 12, 793–801. [Google Scholar] [CrossRef] [Green Version]
- Liu, Y.B.; Li, R.D.; Song, X.F. Grey Associative Analysis of Regional Urbanization and Eco-environment Coupling in China. Acta Geogr. Sin. 2005, 2, 007. [Google Scholar]
- Guan, D.J.; Gao, W.J.; Su, W.C.; Li, H.F.; Hokao, K. Modeling and dynamic assessment of urban economy-resource-environment system with a coupled system dynamics-geographic information system model. Ecol. Indic. 2011, 11.5, 1333–1344. [Google Scholar] [CrossRef]
- Senetra, A.; Szarek-Iwaniuk, P. The implementation of the Wroclaw taxonomic method for the identification and evaluation of problem areas in the Warmia and Mazury Region in Poland—A case study. Socio-Econ. Plan. Sci. 2018, in press. [Google Scholar] [CrossRef]
- Ozus, E.; Akın, D.; Çiftçi, M. Hierarchical Cluster Analysis of Multicenter Development and Travel Patterns in Istanbul. J. Urban Plan. Dev. 2012, 138, 303–318. [Google Scholar] [CrossRef]
- Petrisor, A.; AndronacheI, C.; Petrisor, L.E.; Ciobotaru, A.M.; Peptenatu, D. Assessing the fragmentation of the green infrastructure in Romanian cities using fractal models and numerical taxonomy. Procedia Environ. Sci. 2016, 32, 110–123. [Google Scholar] [CrossRef]
- Šimpach, O.; Pechrová, M. Cluster Analysis of EU’s Regions according to Demographic Criteria. 2016. Available online: https://msed.vse.cz/msed_2016/article/166-Simpach-Ondrej-paper.pdf (accessed on 10 September 2016).
- Liu, C.M.; Zhang, R.Y.; Wang, M.; Xu, J. Measurement and Prediction of Regional Tourism Sustainability: An Analysis of the Yangtze River Economic Zone, China. Sustainability 2018, 10, 1321. [Google Scholar] [CrossRef]
- Wang, S.J.; Ma, H.T.; Zhao, Y.B. Exploring the relationship between urbanization and the eco-environment-A case study of Beijing-Tianjin-Hebei region. Ecol. Indic. 2014, 45, 171–183. [Google Scholar] [CrossRef]
- Pataki, D.E.; Carreiro, M.M.; Cherrier, J.; Grulke, N.E.; Jennings, V.; Pincetl, S.; Pouyat, R.V.; Whitlow, T.H.; Zipperer, W.C. Coupling biogeochemical cycles in urban environments: Ecosystem services, green solutions, and misconceptions. Front. Ecol. Environ. 2011, 9, 27–36. [Google Scholar] [CrossRef]
- Zhang, M.; Liu, Y.M.; Wu, j.; Wang, T.N. Index system of urban resource and environment carrying capacity based on ecological civilization. Environ. Impact Assess. Rev. 2018, 68, 90–97. [Google Scholar] [CrossRef]
- Wang, S.; Fu, B.J.; Zhao, W.W.; Liu, Y.X.; Wei, F.L. Structure, function, and dynamic mechanisms of coupled human–natural systems. Curr. Opin. Environ. Sustain. 2018, 33, 87–91. [Google Scholar] [CrossRef]
- Ding, L.; Zhao, W.T.; Huang, Y.L.; Cheng, S.G.; Liu, C. Research on the coupling coordination relationship between urbanization and the air environment: A case study of the area of Wuhan. Atmosphere 2015, 6, 1539–1558. [Google Scholar] [CrossRef]
- Liao, C.B. QUANTITAITVE JUDGEMENT AND CLASSIFICATION SYSTEM FOR COORDINATED DEVELOPMENT OF ENVIRONMENT AMD ECONOMY—A Case Study of the City Group in the Pearl River Delta. Trop. Geogr. 1999, 19, 171–177. [Google Scholar]
- Wu, Y.Q.; Zhu, X.Q.; Gao, W.J.; Qian, F.Y. The spatial characteristics of coupling relationship between urbanization and eco-environment in the Pan Yangtze River Delta. Energy Procedia 2018, 152, 1121–1126. [Google Scholar] [CrossRef]
- Tang, Z. An integrated approach to evaluating the coupling coordination between tourism and the environment. Tour. Manag. 2015, 46, 11–19. [Google Scholar] [CrossRef]
- Zhang, P.Y.; Fei, S.; He, L.; Qiu, S. Coordination degree of urban population, economy, space, and environment in Shenyang since 1990. China Popul. Resour. Environ. 2008, 18, 115–119. [Google Scholar] [CrossRef]
- Wang, R.; Cheng, J.H.; Zhu, Y.L.; Lu, P.X. Evaluation on the coupling coordination of resources and environment carrying capacity in Chinese mining economic zones. Resour. Policy 2017, 53, 20–25. [Google Scholar] [CrossRef]
- He, J.Q.; Wang, S.J.; Liu, Y.Y.; Ma, H.T.; Liu, Q.Q. Examining the relationship between urbanization and the eco-environment using a coupling analysis: Case study of Shanghai, China. Ecol. Indic. 2017, 77, 185–193. [Google Scholar] [CrossRef]
- Zhou, D.; Xu, J.C.; Lin, Z.L. Conflict or coordination? Assessing land use multi-functionalization using production-living-ecology analysis. Sci. Total Environ. 2017, 577, 136–147. [Google Scholar] [CrossRef]
- Sun, Y.; Cui, Y. Evaluating the coordinated development of economic, social and environmental benefits of urban public transportation infrastructure: Case study of four Chinese autonomous municipalities. Transp. Policy 2018, 66, 116–126. [Google Scholar] [CrossRef]
- Wang, J.F.; Xu, C.D. Geodetector: Principle and prospective. Acta Geogr. Sin. 2017, 72, 116–134. [Google Scholar]
Figure 1.
Tendencies of coupling coordination degree between population modernization and the eco-environment
Figure 1.
Tendencies of coupling coordination degree between population modernization and the eco-environment

Figure 2.
Spatial distribution of coupling coordination degree between population modernization and the eco-environment.
Figure 2.
Spatial distribution of coupling coordination degree between population modernization and the eco-environment.

Figure 3.
Spatial distribution of the relationship between systems’ coordination degree and impacts of factors.
Figure 3.
Spatial distribution of the relationship between systems’ coordination degree and impacts of factors.


Table 1.
Indicator system of population modernization and eco-environment.
| System Layer | Criterion Layer | Index Layer | Index Property |
|---|---|---|---|
| population modernization system | modernization of population reproduction | X1 birth rate (‰) | backward |
| X2 death rate (‰) | backward | ||
| modernization of population quality | X3 the number of full-time teachers in ordinary colleges and universities | forward | |
| X4 the number of students in ordinary colleges and universities | forward | ||
| X5 hospital beds/10,000 people | forward | ||
| X6 health technicians/10,000 people | forward | ||
| modernization of population structure | X7 the proportion of employees in the tertiary industry (%) | forward | |
| X8 urbanization rate (%) | forward | ||
| modernization of social economy | X9 GDP per capita (CNY) | forward | |
| X10 retail sales of consumer goods per capita (CNY) | forward | ||
| X11 the proportion of the tertiary industry in the GDP (%) | forward | ||
| eco-environment system | pressure | Y1 per capita industrial dust emissions (t) | backward |
| Y2 per capita industrial SO2 emissions (t) | backward | ||
| Y3 per capita industrial wastewater discharge (t) | backward | ||
| Y4 per capita electricity consumption by urban and rural residents (kW·h) | backward | ||
| state | Y5 green coverage of built-up area (%) | forward | |
| Y6 per capita green area (m2) | forward | ||
| response | Y7 comprehensive utilization rate of industrial solid waste (%) | forward | |
| Y8 centralized treatment rate of sewage processing plant (%) | forward | ||
| Y9 harmless disposal rate of household garbage (%) | forward |
Table 2.
Classification standard and the types of coupling coordination degree.
| D Value | 0 < D < 0.4 | 0.4 ≤ D < 0.5 | 0.5 ≤ D < 0.6 | 0.6 ≤ D < 0.7 | 0.7 ≤ D < 0.8 | 0.8 ≤ D < 1 |
| Coordination Degree | serious disorder | moderate disorder | adjacent disorder | moderate harmony | good harmony | high harmony |
Table 3.
Influence of factors on the coupling degree of population modernization and the eco-environment.
Table 3.
Influence of factors on the coupling degree of population modernization and the eco-environment.
| Year | Natural Population Growth Rate | The Number of Students in Ordinary Colleges and Universities | Health Technicians/10,000 People | The Proportion of Employees in The Tertiary Industry | Urbanization Rate | GDP Per Capita |
|---|---|---|---|---|---|---|
| 2008 | 0.1399 | 0.0532 | 0.4064 | 0.8504 | 0.0275 | 0.1641 |
| 2013 | 0.9358 | 0.1860 | 0.0447 | 0.6751 | 0.1206 | 0.1844 |
| 2016 | 0.9334 | 0.0363 | 0.2223 | 0.8662 | 0.1576 | 0.0903 |
© 2019 by the authors. Licensee MDPI, Basel, Switzerland. This article is an open access article distributed under the terms and conditions of the Creative Commons Attribution (CC BY) license (http://creativecommons.org/licenses/by/4.0/).
Share and Cite
MDPI and ACS Style
Li, M.; Mao, C. Spatial-Temporal Variance of Coupling Relationship between Population Modernization and Eco-Environment in Beijing-Tianjin-Hebei. Sustainability 2019, 11, 991. https://doi.org/10.3390/su11040991
AMA Style
Li M, Mao C. Spatial-Temporal Variance of Coupling Relationship between Population Modernization and Eco-Environment in Beijing-Tianjin-Hebei. Sustainability. 2019; 11(4):991. https://doi.org/10.3390/su11040991
Chicago/Turabian StyleLi, Meicun, and Chunmei Mao. 2019. "Spatial-Temporal Variance of Coupling Relationship between Population Modernization and Eco-Environment in Beijing-Tianjin-Hebei" Sustainability 11, no. 4: 991. https://doi.org/10.3390/su11040991
Note that from the first issue of 2016, this journal uses article numbers instead of page numbers. See further details here.