1. Introduction
Nowadays, global warming and climate change effects have been of such impact that several countries around the world are enforcing public policies to mitigate them. The European Union has created the European Regulatory Gas and Electricity Group (ERGEG) to draft guidelines and to generate and distribute electric power using smart grids. Those guidelines are designed to make utilities operate in a sustainable way in order to improve energy efficiency [
1]. China has developed a program to retrofit existing buildings into green buildings, the “Green Building Action Plan”, which specifies that the total floor area of retrofitting existing buildings should reach 570 million square meters by 2015 [
2].
Mexico has shown a strong commitment to the environment and rational use of energy, as signed on the General Law for Climate Change (GLCC) and stating, in its second article, the goal of a 30% reduction of greenhouse gases by 2020 [
3]. This commitment was ratified in the Fifth National Communication under the UN Framework Convention on Climate Change in 2012 [
4]. This goal cannot be achieved with just the replacement of electric power generation technology—it also needs a more efficient use of electric power, as stated in GLCC in its third article. By 2020, Mexico must have in place an incentive program for using non-fossil fuels and energy efficient systems [
3].
Buildings represent a large section of a nation’s energy consumption. In the US, it is about 40% of the total [
5,
6]; in the European Union, just the residential buildings’ energy consumption reaches 30% of the total [
7]. In 2008, lighting in residential and commercial buildings represented 15% of the total energy consumption in the US [
8], and some other studies place the consumption in the 17% to 20% range [
9,
10,
11]; additionally, heating, ventilating, and air conditioning (HVAC) represented nearly 55% in 2014 [
5]. Energy consumption in buildings (residential and commercial) presents a wide range of opportunities for deployment of wiser energy usage. In most cases, users of electric power only have access to monthly bills provided by utilities, and these bills do not give detailed information about how the energy is used [
12].
Retrofitting existing buildings for energy efficiency improvement requires the mixing of different technologies at an affordable cost [
5], and savings in lighting consumption can be achieved by intelligent control technologies. For example, European regulations require the use of presence and light detectors to control artificial lighting [
13]. Lighting control systems had received some attention as a way to improve the energy consumption of organizations [
14,
15,
16,
17].
This paper presents the results from the implementation of a pilot energy saving program of the Hermosillo Institute of Technology. The program is focused on saving electric power in one of the academic buildings of the campus, and to serve as baseline for an energy and environmental management system. The objective is to improve the performance of the artificial lighting, by combining retrofitting of the lighting system with the implementation of a building automation and control system. Moreover, the replacement of lamps also involves a new lamp distribution that complies with the Mexican standard for handling areas, classrooms, and offices. The energy savings are analyzed in complementary ways: environmental impacts and economic impacts.
2. Role of Higher Education Institutions on Climate Change, Energy Efficiency, and Energy Saving
This section analyses the role of higher education institutions (HEI) with respect to climate change and energy saving. First, the UNESCO’s point of view is discussed. Afterward, an overview of the efforts made in the US by Harvard University regarding green building and the Leadership in Energy and Environmental Design (LEED) program is presented. Subsequently, the efforts of China HEI on sustainability, the commitment and leadership in sustainability of the US, and the EU programs related to climate change and global warming are examined. Finally, Mexico’s commitment to climate change mitigation is reviewed.
All these programs helped to focus on actions that allowed the development of the present project. These actions were designed to mitigate the effects of climate change using an energy efficiency approach. The project has an additional function, that is, to serve as a “laboratory” of validation for the technological developments made in the institution.
The educational sector should have a very important role in global warming and climate change mitigation. Organizations, like UNESCO [
18], have stated that to face this problem, science is not enough, something more is required. UNESCO presented a Climate Change Initiative supported upon four axes: science, education, environment, and ethics. The education axis is focused on sensitizing the general public on issues such as how to face, mitigate, and adapt to climate change effects [
18]. In this regard, UNESCO is working with the Member States in the development of education programs at different educational levels, and the strengthening of new public policies based on analysis and research of the problem.
It would seem obvious that higher education institutions should play the role of leaders in teaching about and researching these issues, and inserting them in their sustainability programs, since they generate the ideas and technologies to address global warming and climate change mitigation. Instead, many HEI fail to do so [
19]. Since the creation of the Harvard University’s Green Campus Initiative (HGCI) in 2000, Harvard has become the world´s largest green campus organization with 97 LEED certified buildings, and it is recognized as one of the most influential organizations [
19,
20]. Through the 1990s and at the beginning of the new millennium, HEI around the world developed several projects toward achieving a green campus, but they have fall short of producing a deep transformation in the HEI organizational structure. For example, a university implemented a lighting retrofit program one year and, the next year, added more HVAC equipment to the same buildings. Until recent years, one force slowing the implementation of green initiatives was the perception that the projects were too expensive, and that they would take funds away from teaching and researching [
19].
There are two key factors HEI must overcome to become green: first, any action taken will impact all areas of operation of HEI; second, any effective solution will become a moving target, generating new information and revealing new requirements and opportunities [
21]. This means that HEI should expand its core mission of teaching and research by including learning [
21].
Around 2003–2004, some changes started to happen in the higher education sector, moving it to reach for larger environmental goals, driven by the success of the previous small projects. By 2007, there were 285 construction projects of HEI that had been certified by the United States Green Building Council´s Leadership in Energy and Environmental Design (LEED) program in the US [
19].
China is viewing the educational sector—and higher education in particular—as a key actor to help China achieve its strategic sustainable development goals. In 2012, there were 2492 colleges and universities as part of a broader educational sector, responsible for nearly 40% of the energy consumption of the public sector. HEI also have a significant impact on students, particularly about their attitude and knowledge regarding sustainable development, that should be broadened beyond energy consumption. China’s government decided to promote sustainable development in their universities using a holistic approach, that includes [
22]:
- (1)
Educating future professionals.
- (2)
Improving campus energy efficiency.
- (3)
Promoting renewable energy usage.
- (4)
Increasing social responsibility in the environment of universities.
- (5)
Expanding perception for action on environment issues.
A sustainable university has to incorporate to its normal operation style six issues: sustainable campus operation, sustainable research, public outreach, inter-institution cooperation, sustainable curricula, and reporting [
22]. Since 1998, Tsinghua University was selected to be the first “Green University” of China, following efforts produced the China Green University Network (CGUN) in 2011, CGUN had an expectative of more than 100 universities joining by 2015. HEI have a critical role in the future of sustainability since they educate students that will become the professional, governmental, industrial, and academic leaders, with the will to change the future [
22].
In the US, there are over 4300 HEI with different number of buildings, some of them are from before Civil War years, and some others are new architectural icons. Until recent years, these buildings were energy hungry entities filled with toxic chemicals and poor air exchange systems, but universities have begun to include a green agenda in their master plans [
23]. The green agenda focused on new buildings and the retrofitting of old ones to reduce their carbon footprint, saving energy, reducing waste and, as a bottom line,
saving money. This is just one strategy of HEI to demonstrate their commitment and leadership in sustainability. Nowadays, there are 353 campuses recognized for their strong commitment to sustainability, among them are MIT, University of California, Georgia Institute of Technology, and Stanford University [
23].
European Union has also supported academic cooperation, high-level human resources education, and the update of educational systems regarding public health, climate change, and environmental issues, through programs like ALFA III, ERASMUS MUNDUS and ERASMUS+ [
24].
In Mexico, the General Law on Climate Change [
3] stated that education, research, development, and technology transfer must be encouraged and it provides, in Articles 7, 8 and 9, the commitment to implement actions for the mitigation and adaptation, and to climate change in education at all three levels of government. It also promotes coordination between the Ministry of Public Education and research and higher education institutions of the country, regarding sustainable development, environment, and climate change, through the National Institute of Ecology and Climate Change, INECC (Article 22).
There is a local effort to impulse the sustainability agenda among Mexican HEI and, in 2000, the Mexican Consortium of University Environmental Programs for Sustainable Development (complexus) was created. It is a joint effort between the Environmental and Natural Resources Ministry of the Mexican government (SEMARNAT), and the National Association of Higher Educations Universities and Institutions (ANUIES), to promote quality improvement of academic processes regarding environmental and sustainable development—through collaboration and concurrence—of HEI initiatives and actions. Nowadays, most of its actions are focused on education [
25].
Nevertheless, the role of the Mexican education sector, particularly higher education, must be broader than just training individuals and developing of science and technology. It must be an example of commitment and implementation of actions that will have a significant impact on the environment that surrounds it.
3. ITH Facing Climate Change from the Political Point of View of the Mexican State
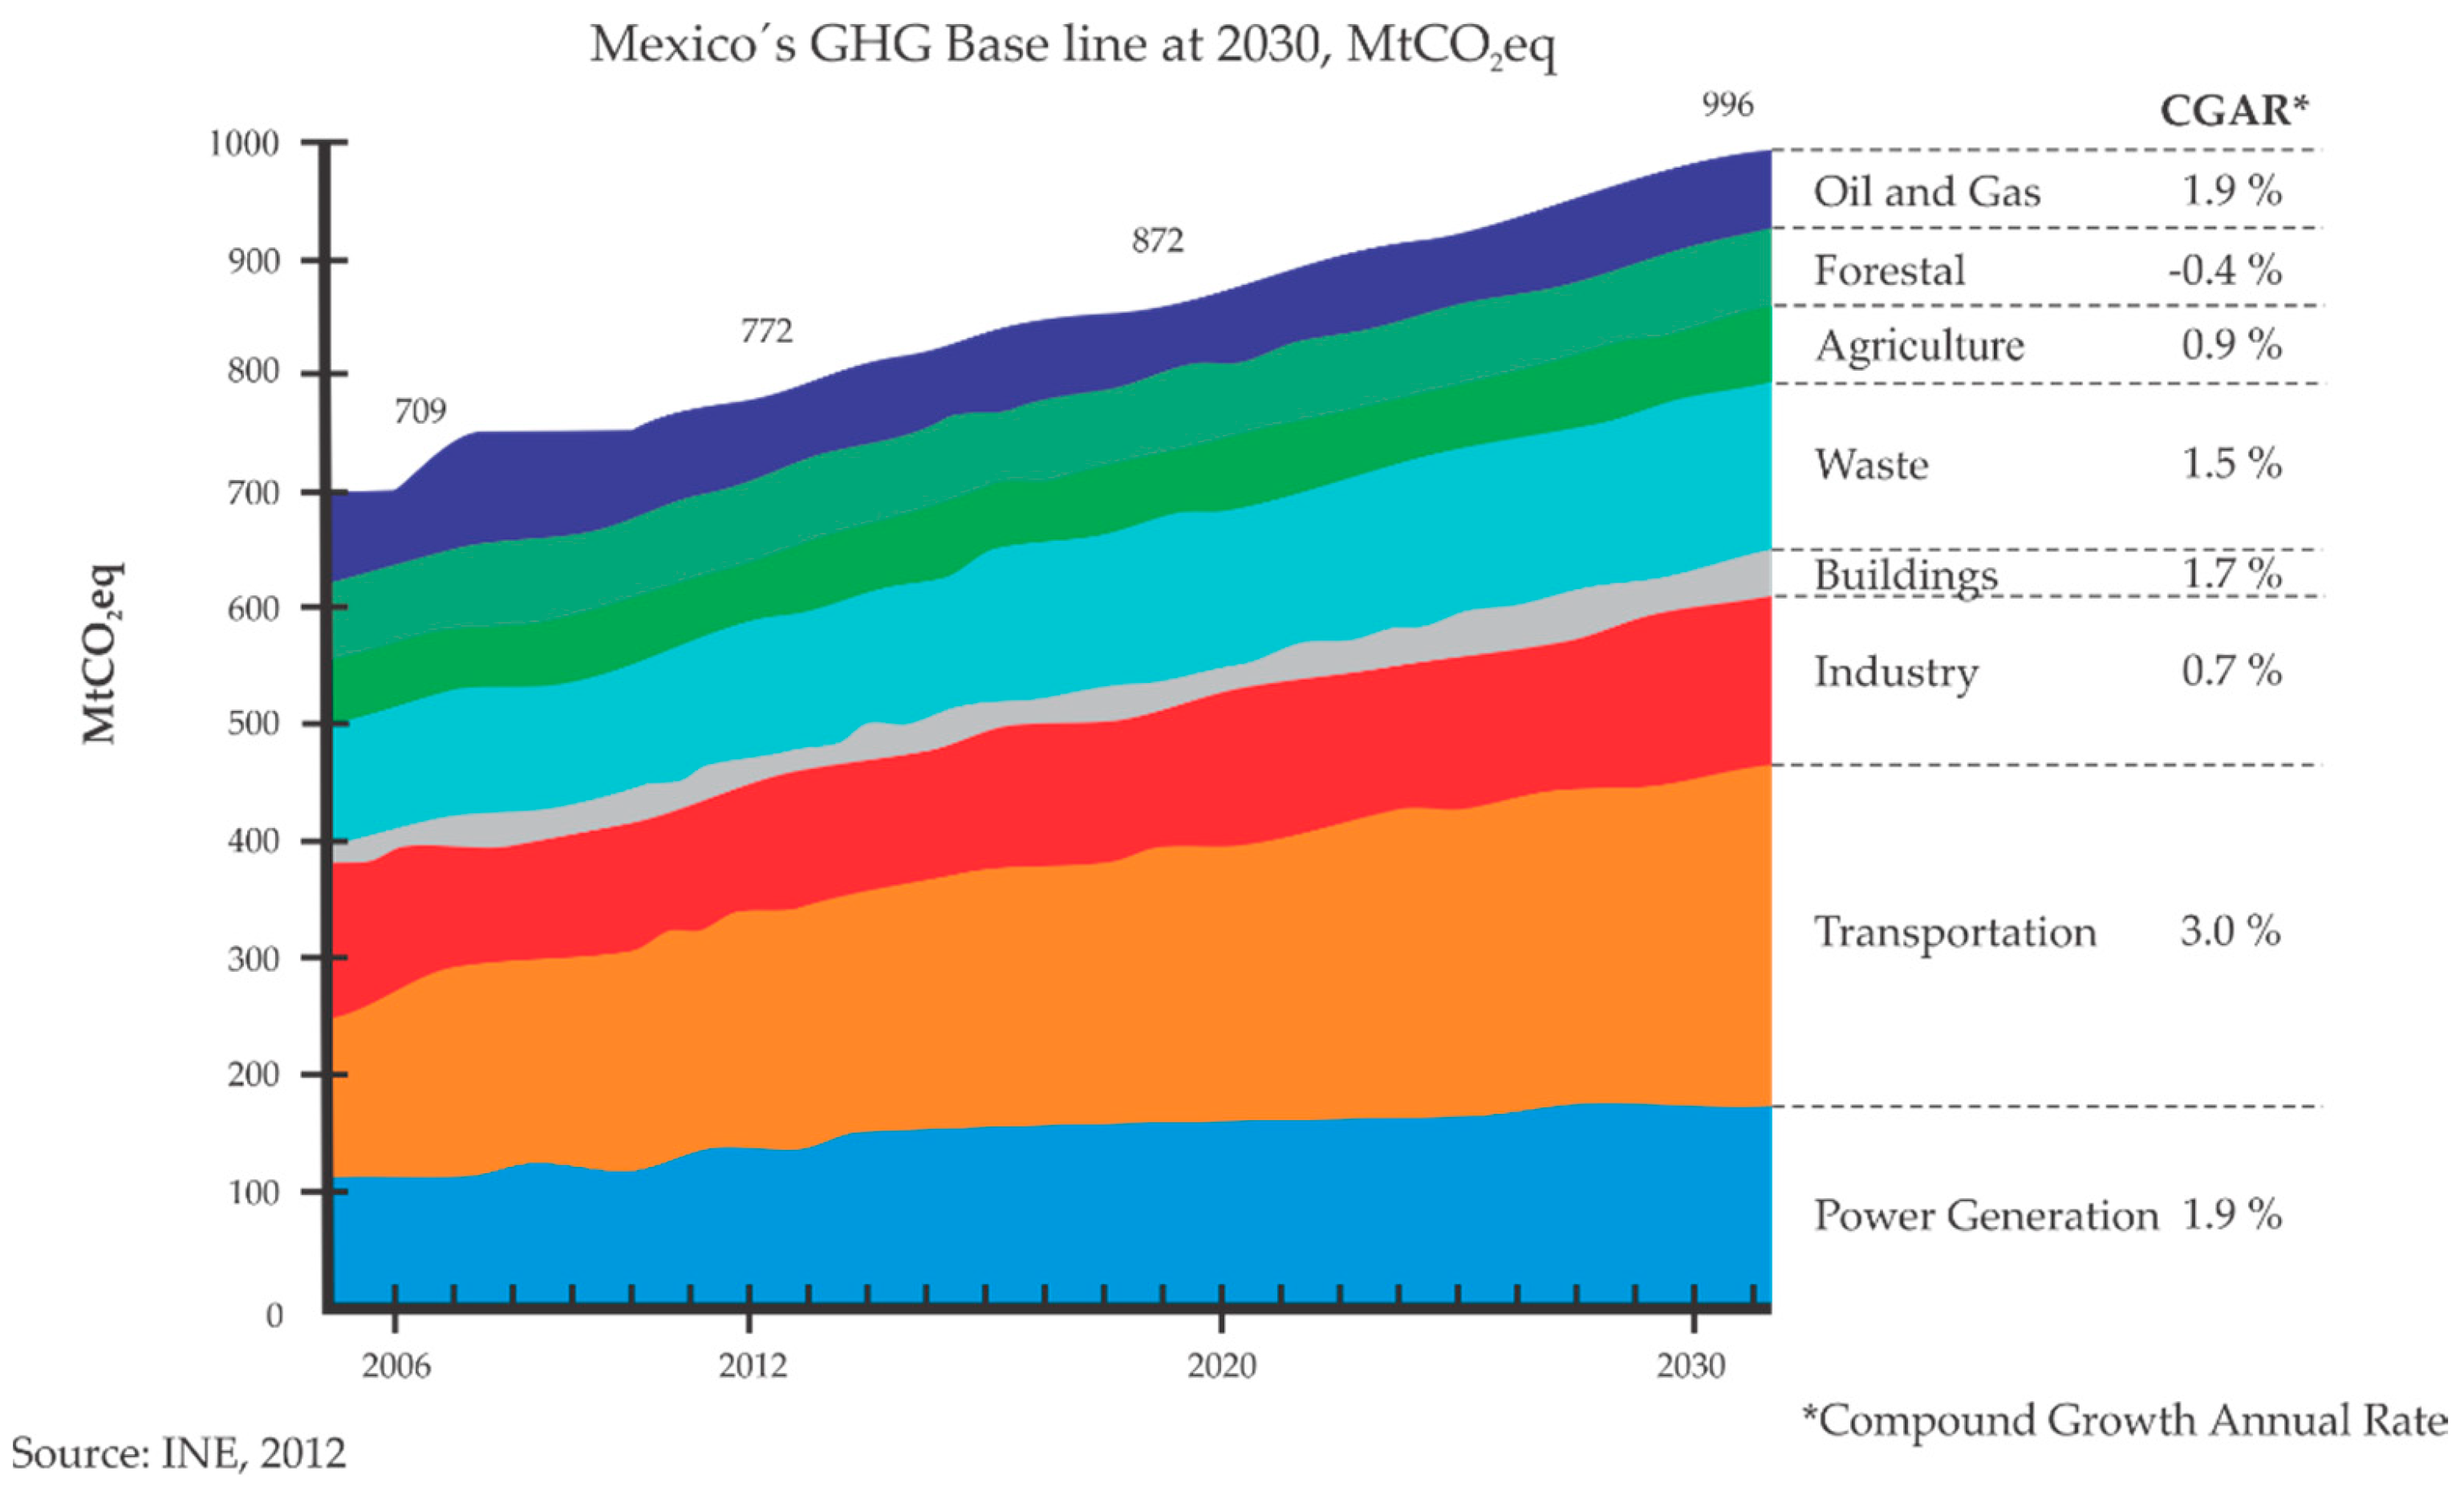
Mexico has set an aspirational goal of reducing its greenhouse gas (GHG) emissions by 30% by 2020, using a baseline of 872 MtCO
2eq representing 261.6 MtCO
2eq, as stated in GLCC [
3].
Figure 1 shows the baseline emissions in which buildings are accountable for 2.43% of the total. From the GLCC, many plans and programs have been created involving different sectors of the Mexican society to achieve this goal, such as the National Development Plan 2013–2018 [
26], Energy Sector Program 2013–2018 [
27], and the Education Sector Program 2013–2018 [
28].
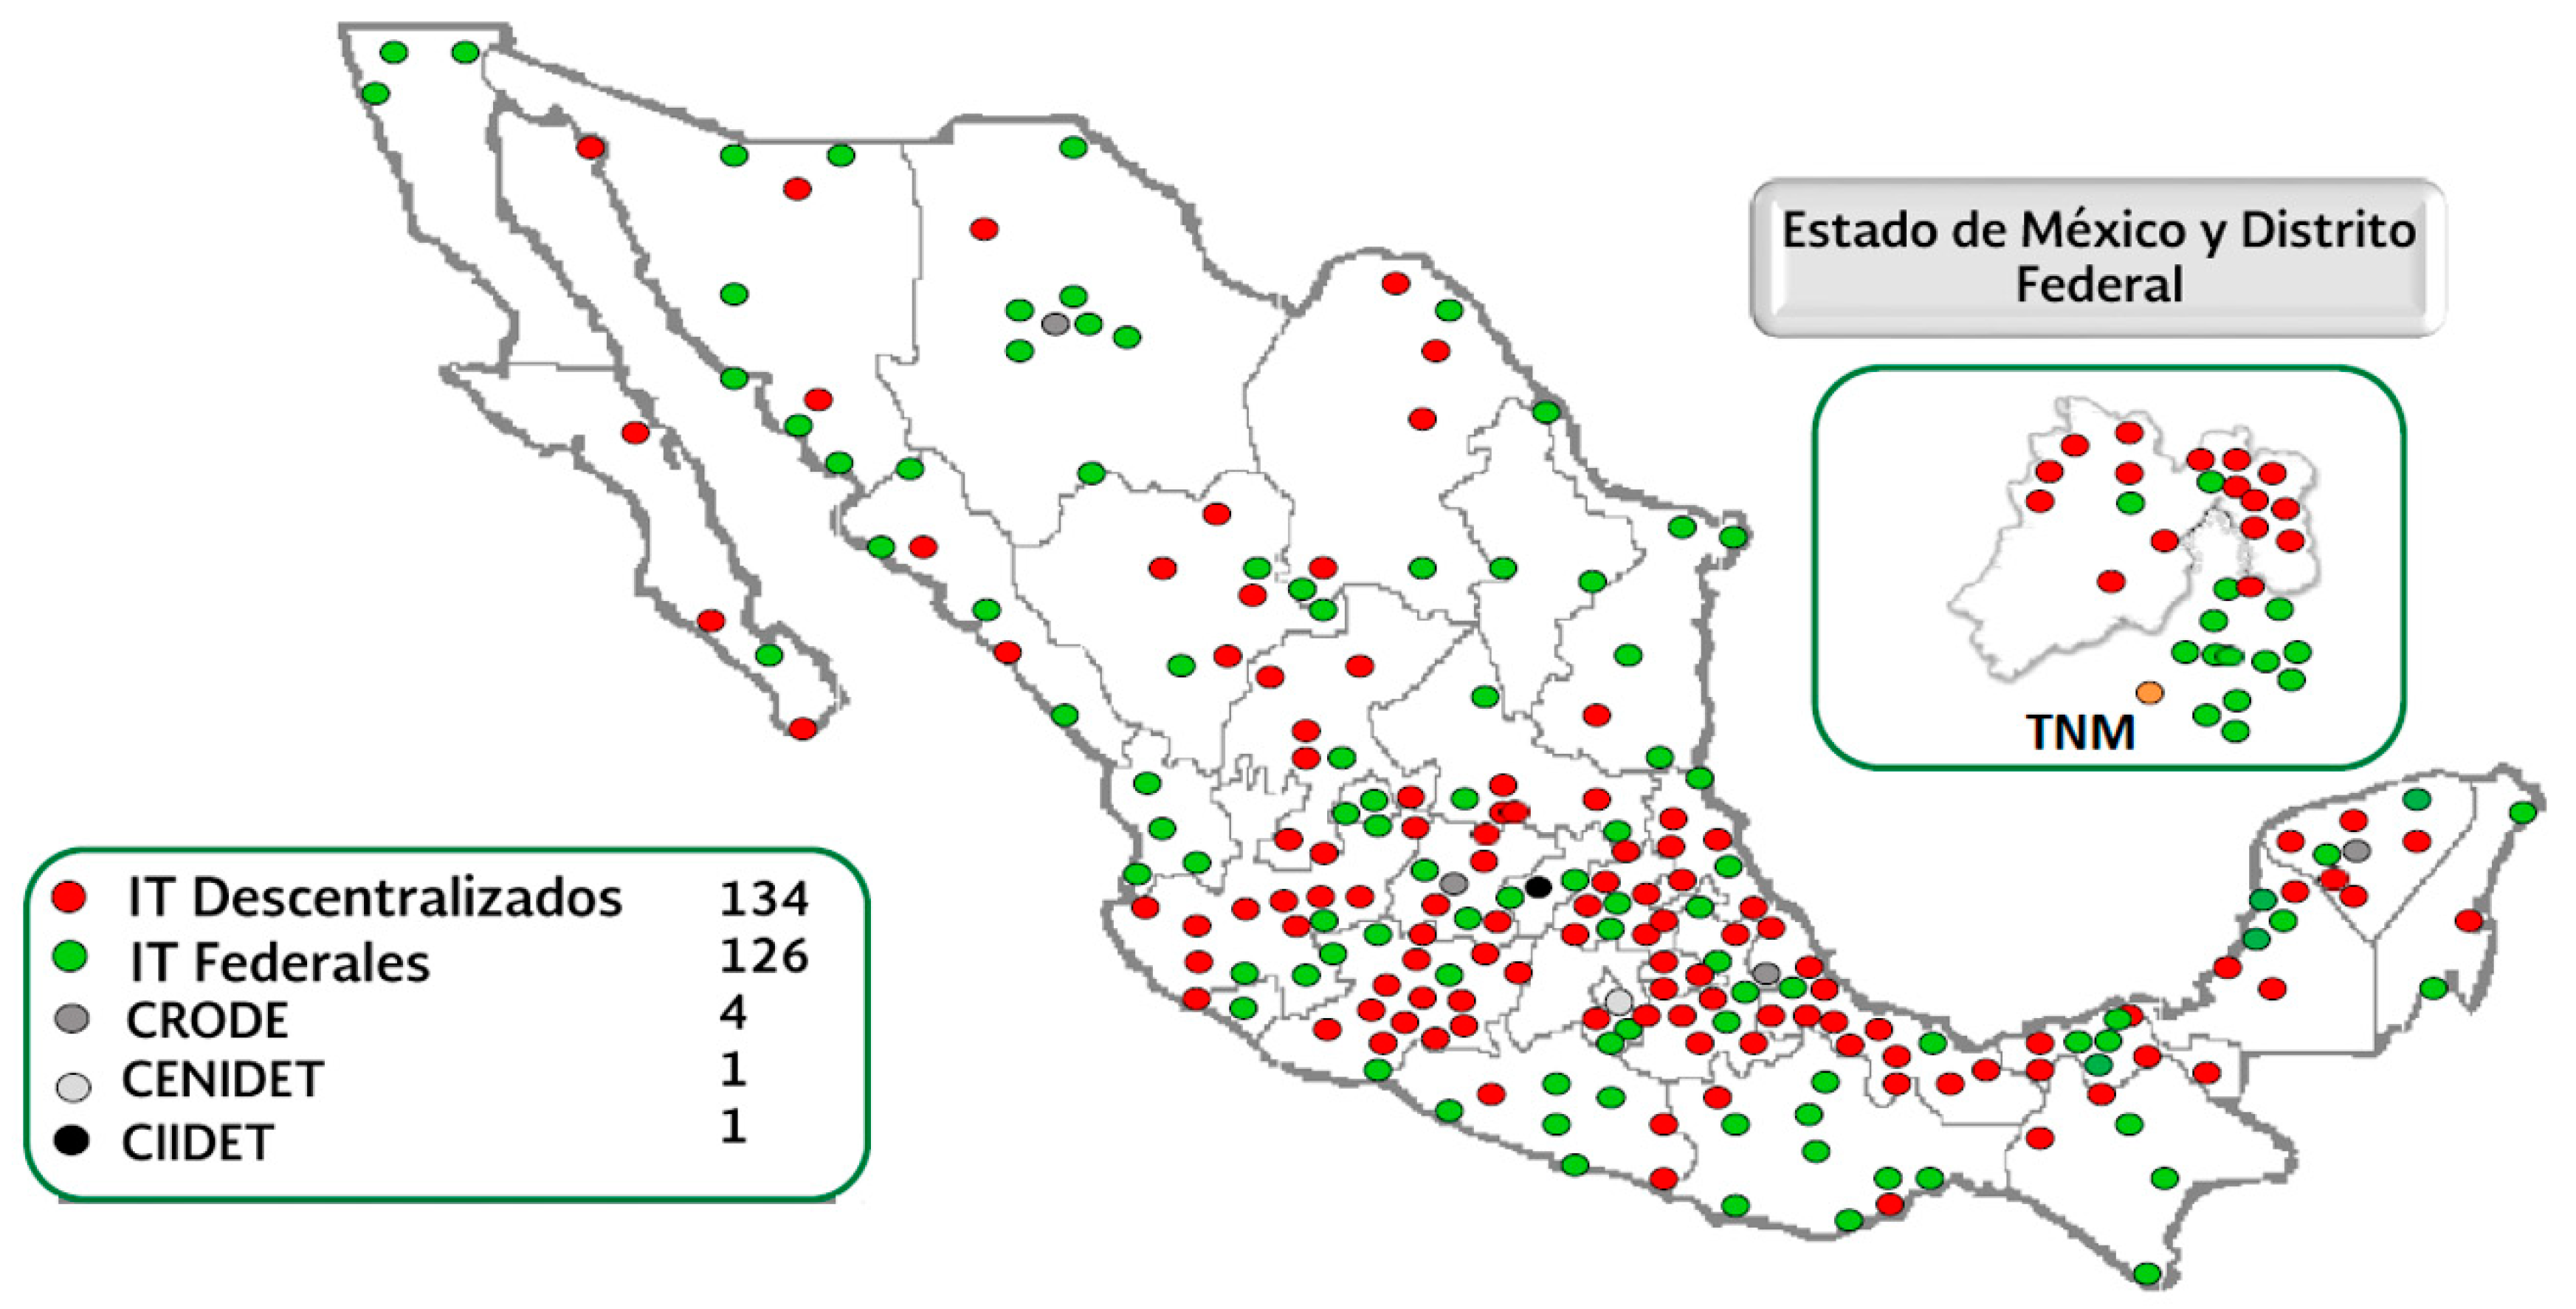
Within this context of official plans, and the State Ministries involved, it is necessary to place Hermosillo Institute of Technology (TecNM/ITH for its short-form name in Spanish) on the map. TecNM/ITH is part of the biggest National Higher Education System in Mexico: National Technological Institute of Mexico (TecNM, short for
Tecnológico Nacional de México, in Spanish) [
29]. TecNM is a deconcentrated organism of the Ministry of Public Education (SEP), with 266 institutions across the country, and 556,270 undergraduate and graduate students [
30].
Figure 2 shows the distribution of institutions across the country.
Within this system, TecNM/ITH is a medium size campus of 216,533 m
2 [
31], with an enrollment of over 4400+ students in 10 undergraduate and 5 graduate programs [
32]. Being part of the educational system of the Federal Government, its plans and actions must be aligned with the national programs and strategies. ITH’s mission is to train high-level professionals with a vision toward sustainable, technological, social, and economic development, required in today’s global environment; being able to respond to public policies through its teaching, research, and liaison [
33].
The proposed project is aligned with several national plans and programs, specifically with:
- (1)
National Development Plan 2013–2018 (PND 2013–2018) in its National Goal III, and objective 3.5 of making the scientific, technologic development, and innovation pillars of sustainable economic and social progress [
26];
- (2)
National Educational Plan 2013–2018 (PDE 2013–2018), its objective 6, promoting scientific, and technological education as an essential element for transforming Mexico into a knowledge society and, particularly, in strategy 6.2, increasing scientific research, and experimental development in HEI and public research centers [
28];
- (3)
Strategic Training of Human Resources on Energy Program 2014–2018 (PEFRHME 2014–2018), in its strategic condition 3, talent that applies, and generates, knowledge, products, and services of high value; and its objectives 4: strengthen infrastructure, and research training; 5: strengthen support for research and innovation; and 6: increase research capacity for productivity and innovation in the sector [
34];
- (4)
National Program for Sustainable Use of Energy 2014–2018 (PRONASE 2014–2018), in its objectives 3, strengthen the governance systems, and levels of energy efficiency at the federal, state, and municipal levels, and integrate public, private, academic, and social institutions; 4, encourage the development of technical and technological capabilities related to the sustainable use of energy; and 6, promote research and technological development in energy efficiency; and objectives 1, strengthen the quality of educational services; 4, promote science, technology, and innovation; and 5, building links with the public, social, and private sectors [
35]; and
- (5)
Institutional Innovation, and Development Program 2013–2018 of TecNM, particularly with strategies 1.4, strengthening the quality and relevance of graduate programs; 4.1, promoting the development of scientific and technological capacity with a focus on the productive vocation of the regions; 4.2, promoting the training of highly specialized human resources in research and technological development; 4.4, strengthening the infrastructure of scientific, technological, and innovation activity; and 5.3, fostering the transfer of knowledge and technological development to the productive sector [
36].
Internally, TecNM/ITH is implementing an environmental management program to reduce the impact of its operations on the environment and, with the guidance of TecNM, it is designing the inclusion of an energy management system within its Master Management Program, however, TecNM/ITH must take additional steps to support actions to mitigate the effects of climate change.
4. Energy Consumption of ITH
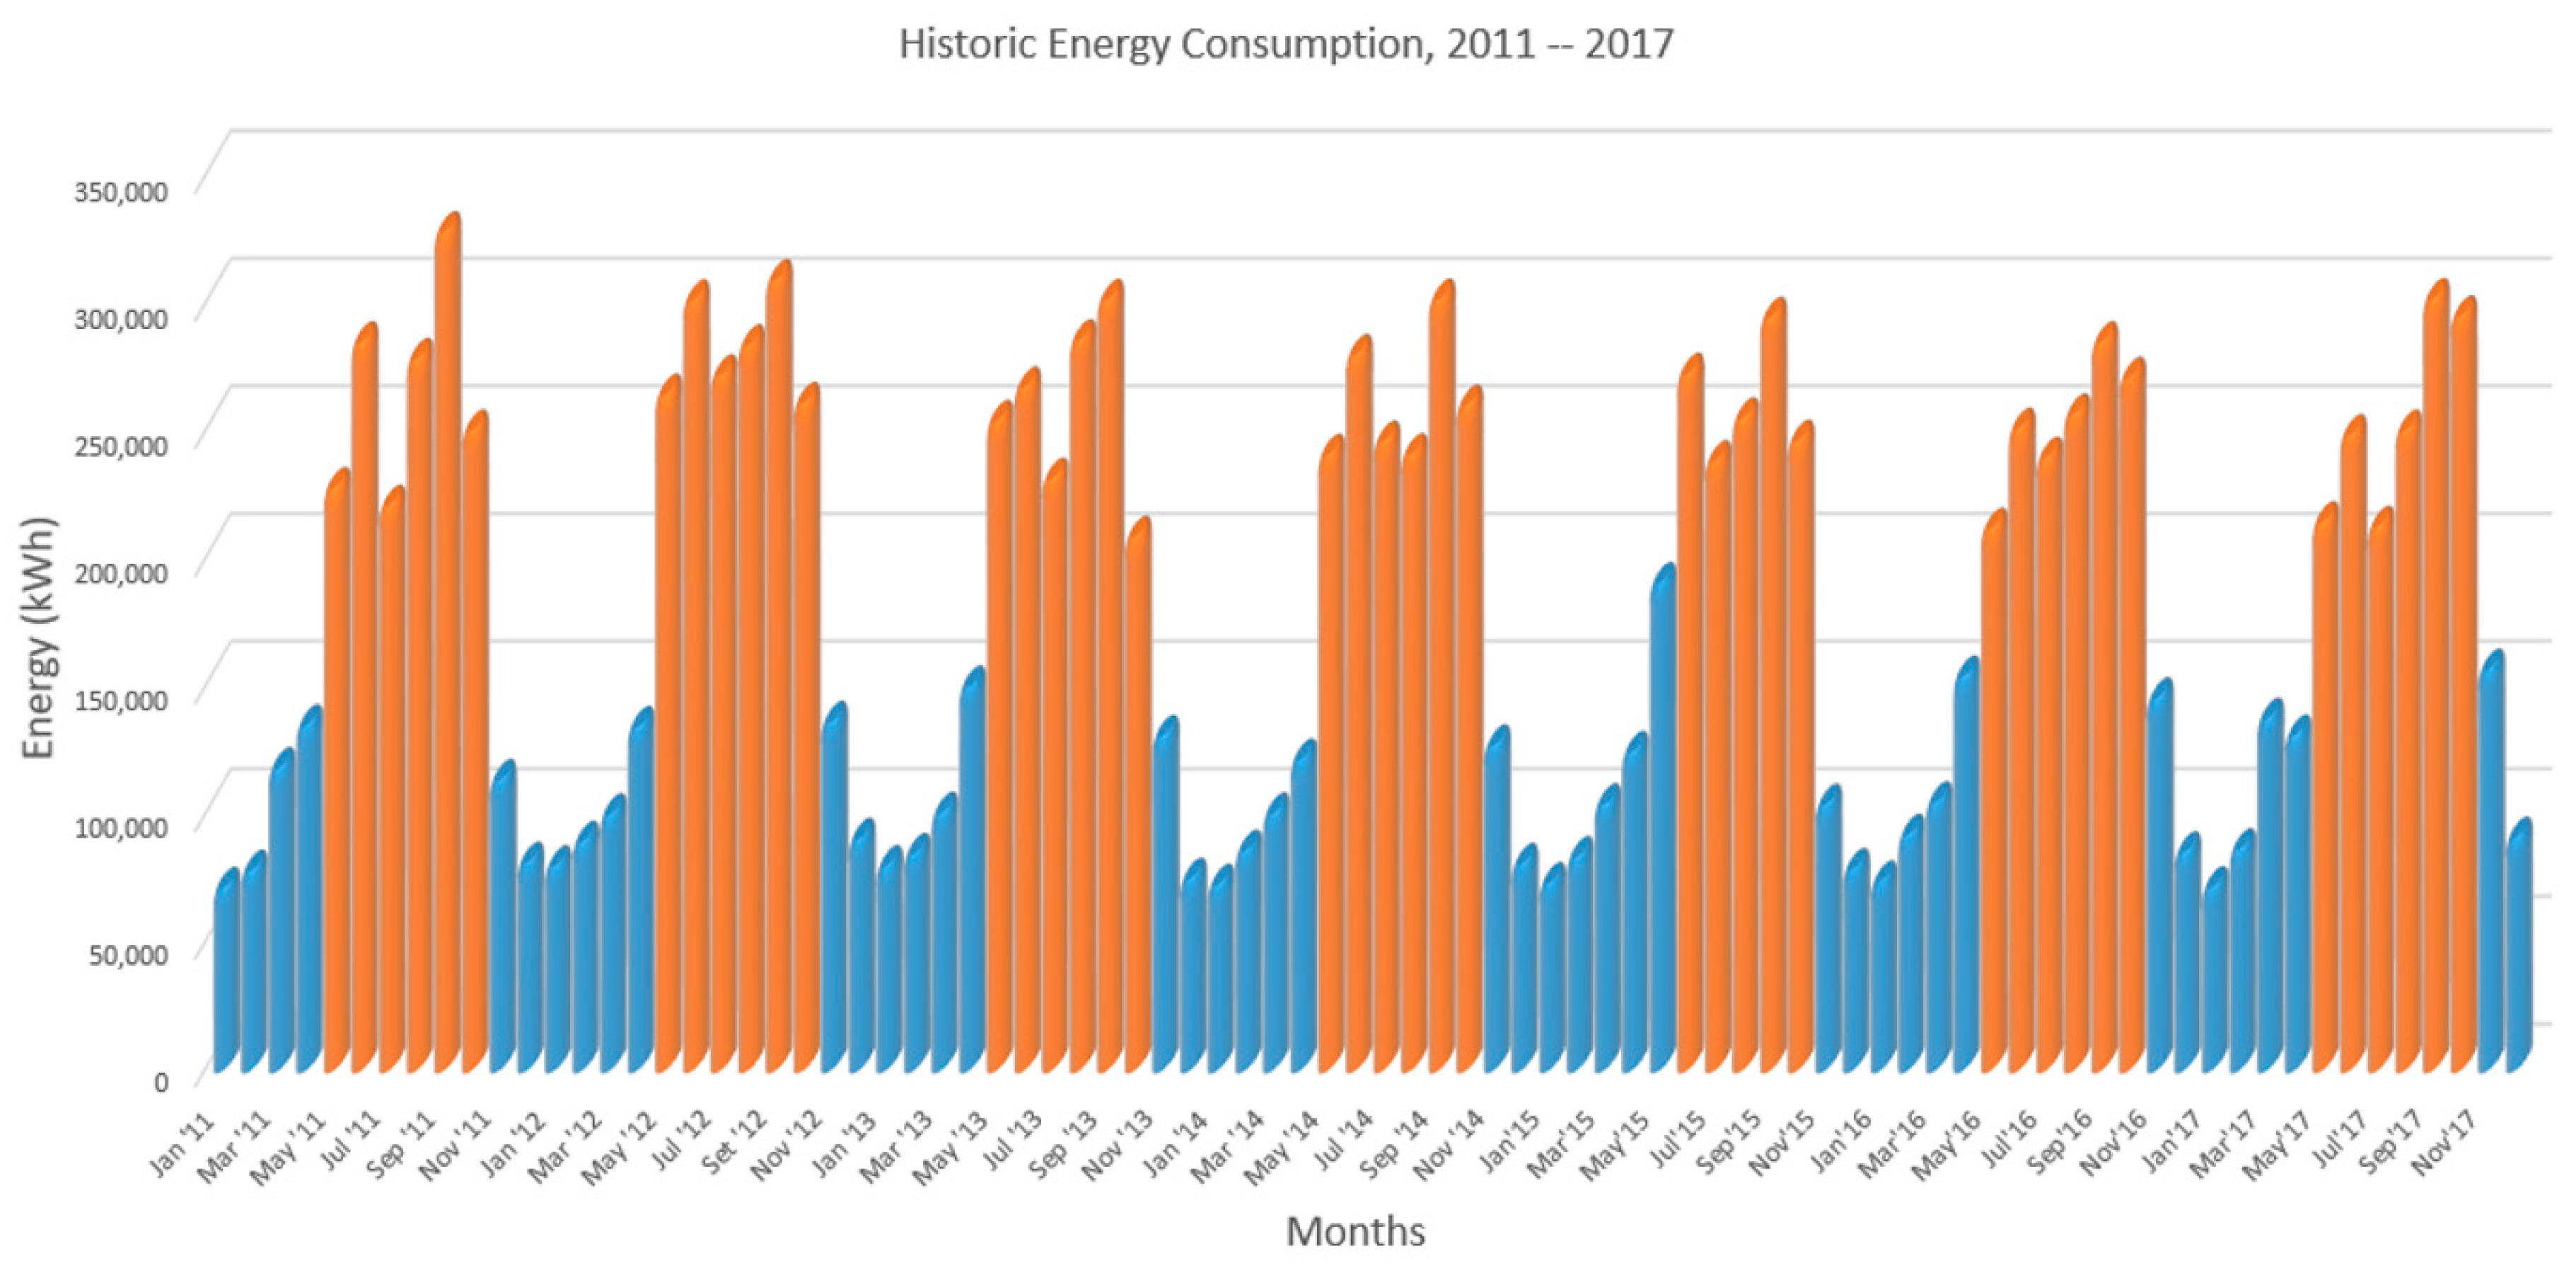
Energy savings and demand reduction during peak hours are two issues that have become imperatives during recent years to TecNM/ITH. Excessive demand during hot weather season, from May through October, has resulted in the activation of protections in the distribution system of the utility (Federal Electricity Commission, CFE), leaving TecNM/ITH without energy for several hours, affecting normal classroom operation, laboratory practices, and research activities.
Energy consumption of TecNM/ITH during the 2011–2017 period had an average value of 2’158,291 kWh per year, with peak consumptions over 250,000 kWh per month during the hot weather season, exceeding, several times, the maximum demand contracted with the utility. Monthly energy consumption from 2011 to 2017 is shown in
Figure 3.
The energy consumption of March, April, and November can be used to estimate the baseline consumptions of TecNM/ITH. These months were selected for the estimation because the institute is working normally and the air conditioner (A/C) systems are not operating and, therefore, the air conditioner system does not impact the energy consumption for those months. During the 2011–2017 period, March, April, and November presented an average consumption of 123,277 kWh per month; extrapolating this consumption to the whole year, it represents an annual average consumption of 1,479,329 kWh, representing 68.54% of the annual average.
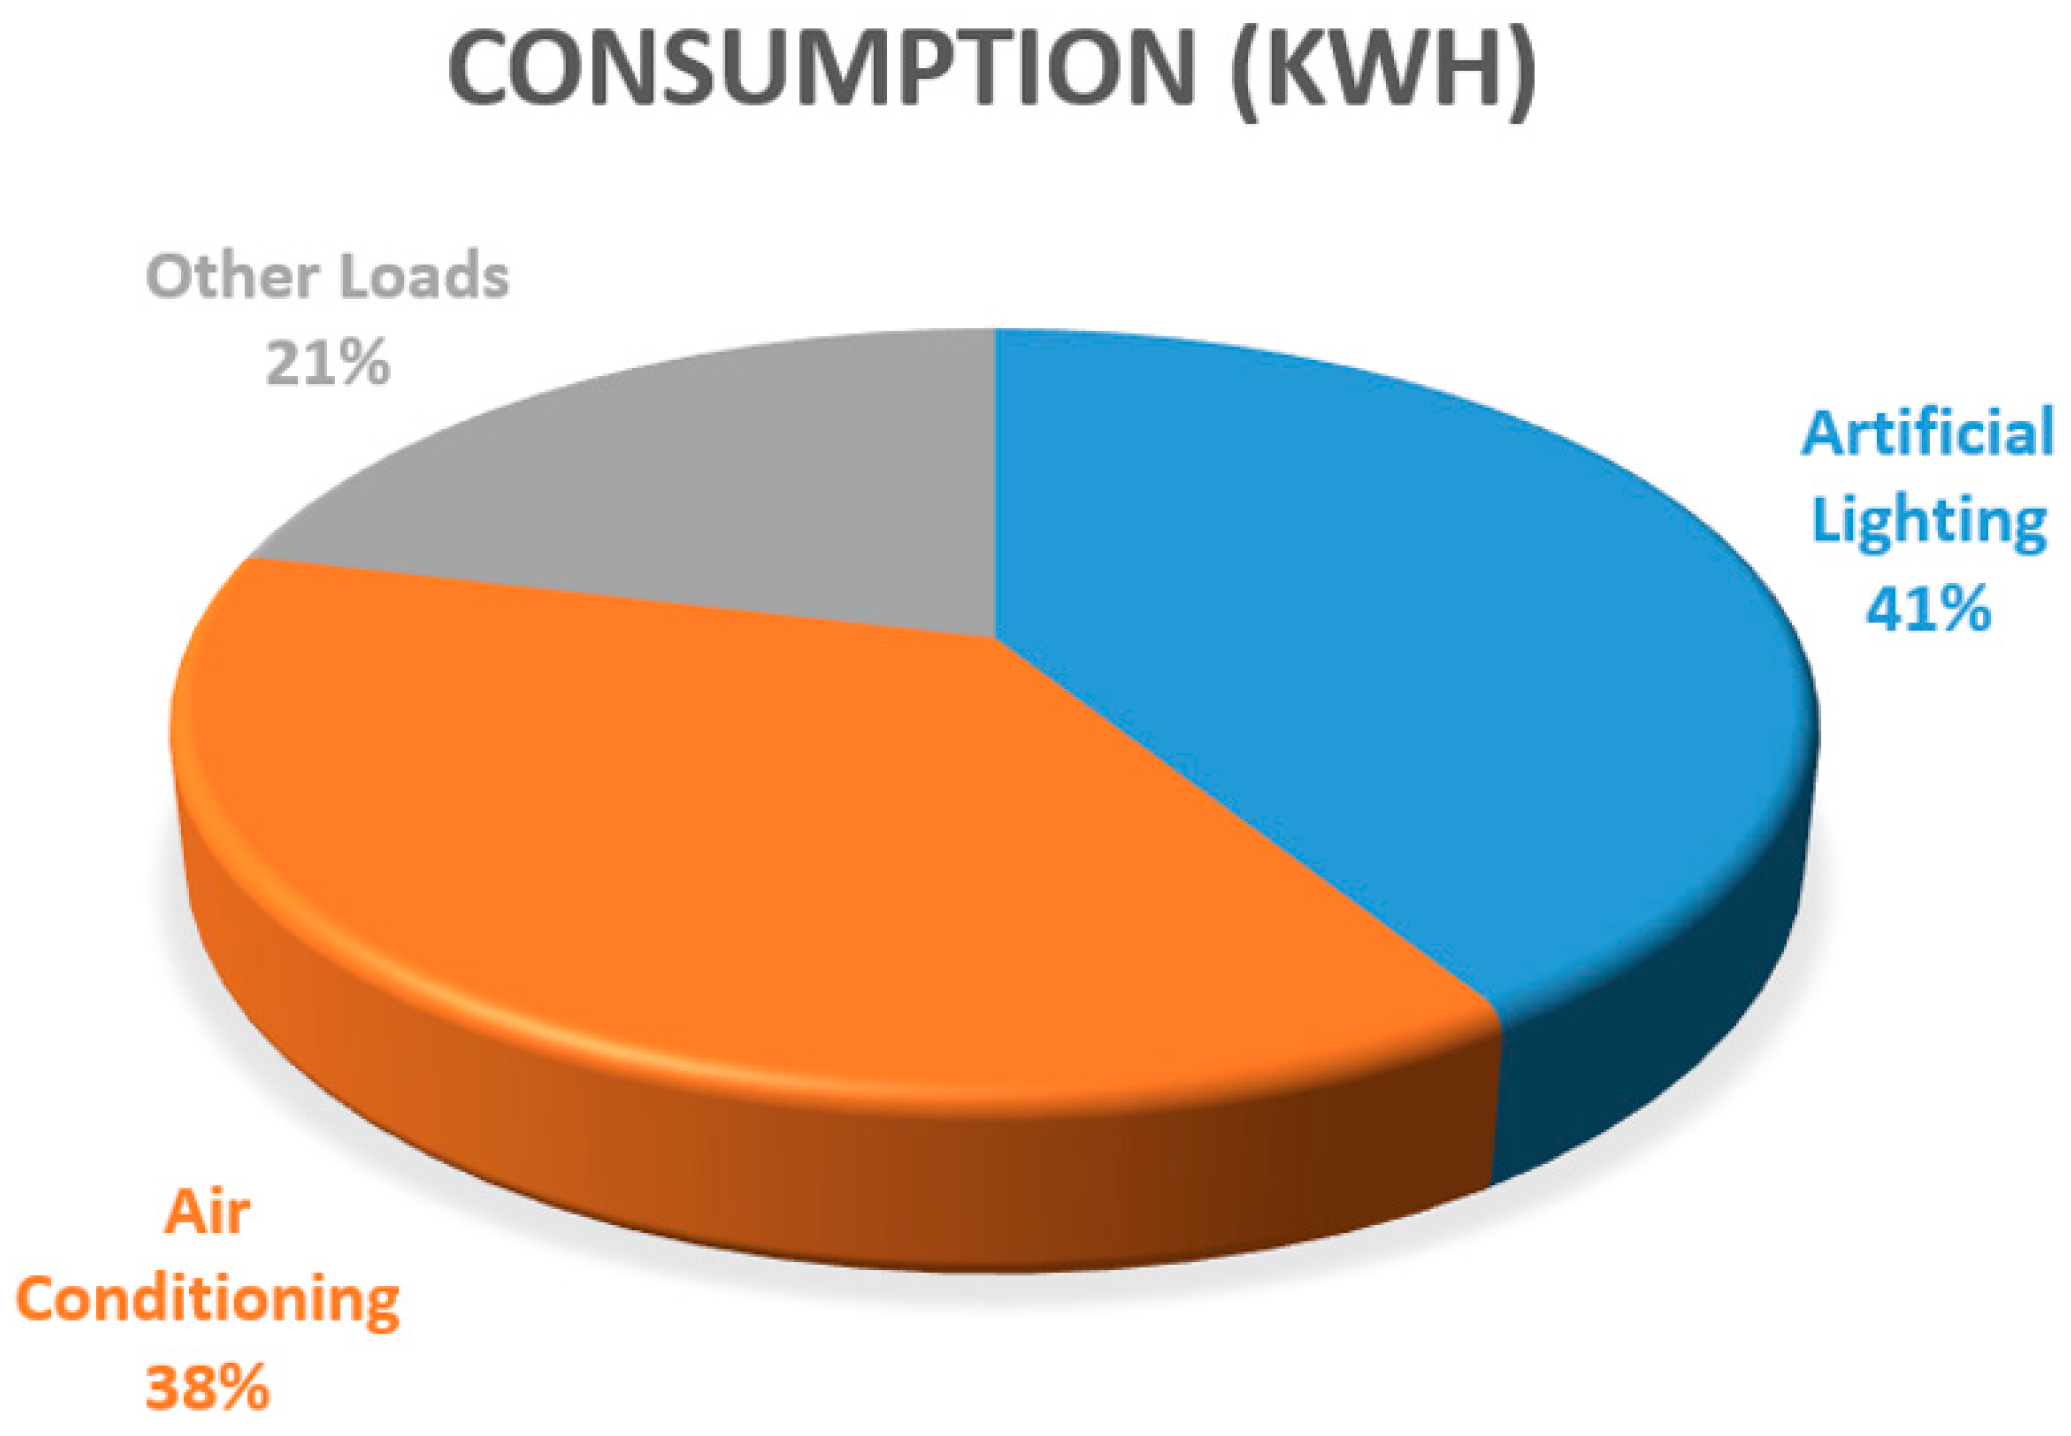
Setting artificial lighting as 60% of the average base consumption, its average yearly consumption is 887,597 kWh, about 41 % of the total. During the hot weather season, the average monthly consumption rises to 258,506 kWh, if the average monthly baseline consumption is subtracted; the remainder is an estimation of the monthly consumption on A/C during the hot weather season, about 135,229 kWh.
Figure 4 shows the average yearly distribution of energy consumption by load type.
These figures must be reduced in order to achieve three goals: reducing financial load produced by energy bills, improving school operation during hot weather season by reducing energy outbreaks, and most importantly, reducing environmental footprint.
To achieve these goals, TecNM/ITH has started a research and development project, with short-term (retrofitting), medium-term (automation), and long-term stages (power generation). These stages will allow TecNM/ITH to become a self-contained institution regarding electric power consumption, and to generate an energy surplus that can be used to reduce the energy bill that the utility sends to SEP each month, or used in the surrounding area, especially during the hot weather season, when the utility presents difficulties to satisfy the demand.
The project approach is to mix energy efficiency technology, and clean energy generation, by using high-efficiency lighting technology, a proprietary technology (TecNM/ITH) building automation and control system (BACS), and a robust energy generation system.
5. ITH Project Characteristics
The project aims to help TecNM/ITH become an energy-wise institution, implementing an energy management and generation program that will achieve energy independence in the long run. The proposed solution mixes three kinds of technologies: retrofit of building artificial light system, a building automation control system, and photovoltaic power generation system.
First, to get a fast improvement in buildings’ energy efficiency, a retrofit of the artificial light system is proposed by replacing actual T8 fluorescent tubes and High-Intensity Discharge (HID) lamps with LED lamps. The reason for this action relies upon the greater luminous efficiency (lumens per watt), lifetime greater than 35,000 h, better color render index (CRI), and color temperature closer to daylight of the LED lamps.
Second, the retrofit action itself is not enough, it requires the inclusion of a BACS capable of controlling the turn on, and off, of lamps, and the operation of A/C to increase the energy savings in each building of the campus by enabling operation of lights and A/C equipment only during the scheduled hours and areas. Given the size of the ITH campus, there will be two kinds of networks used in the implementation of BACS to achieve the control goals: (i) there is an inner wireless mesh network based on ZigBee technology in each building, this network carries the commands and information to control the lighting and A/C equipment; and (ii) an outer private Ethernet network to communicate each building with a central control station. This station is isolated from internet traffic to achieve higher security levels. An operation schedule of BACS can be programmed using a graphic Human–Machine Interface (HMI) to provide user-friendly access to the system, or via an interface module with the ITH integrated information system (SII by its acronym in Spanish).
The third part of the project involves power generation, which will be implemented using 300 W peak polycrystalline photovoltaic panels. These panels must comply with a minimum 16% efficiency and a lifetime of 25 years. Instead of using a centralized inverter approach in each building, a small grid of microinverters will be used to compensate shading effects and maintenance time better when a panel or microinverter fail. The third part of the project has been delayed due to the recent changes in the Mexican Regulation regarding power generation; TecNM/ITH is currently negotiating an arrangement with a private company to cover this topic.
5.1. Retrofit
The first stage of the project involves the retrofitting of both the lighting and A/C systems. The artificial light system was upgraded by replacing its Fluorescent 96 in. 59 W T8 tubes and ballast with 46 in 18 W T8 LED tubes. The A/C systems were upgraded by replacing the old F-22-refrigerant-based compressors with new compressors using R-410A refrigerant.
The project was implemented in the academic building A5. The A5 building is a two-story building with four classrooms in each floor. The power consumption of the artificial light system was measured using a Fluke 43B Power Quality Analyzer connected to the building’s distribution board. The old artificial light system had an energy consumption of 354 W per classroom, i.e., 2832 W total.
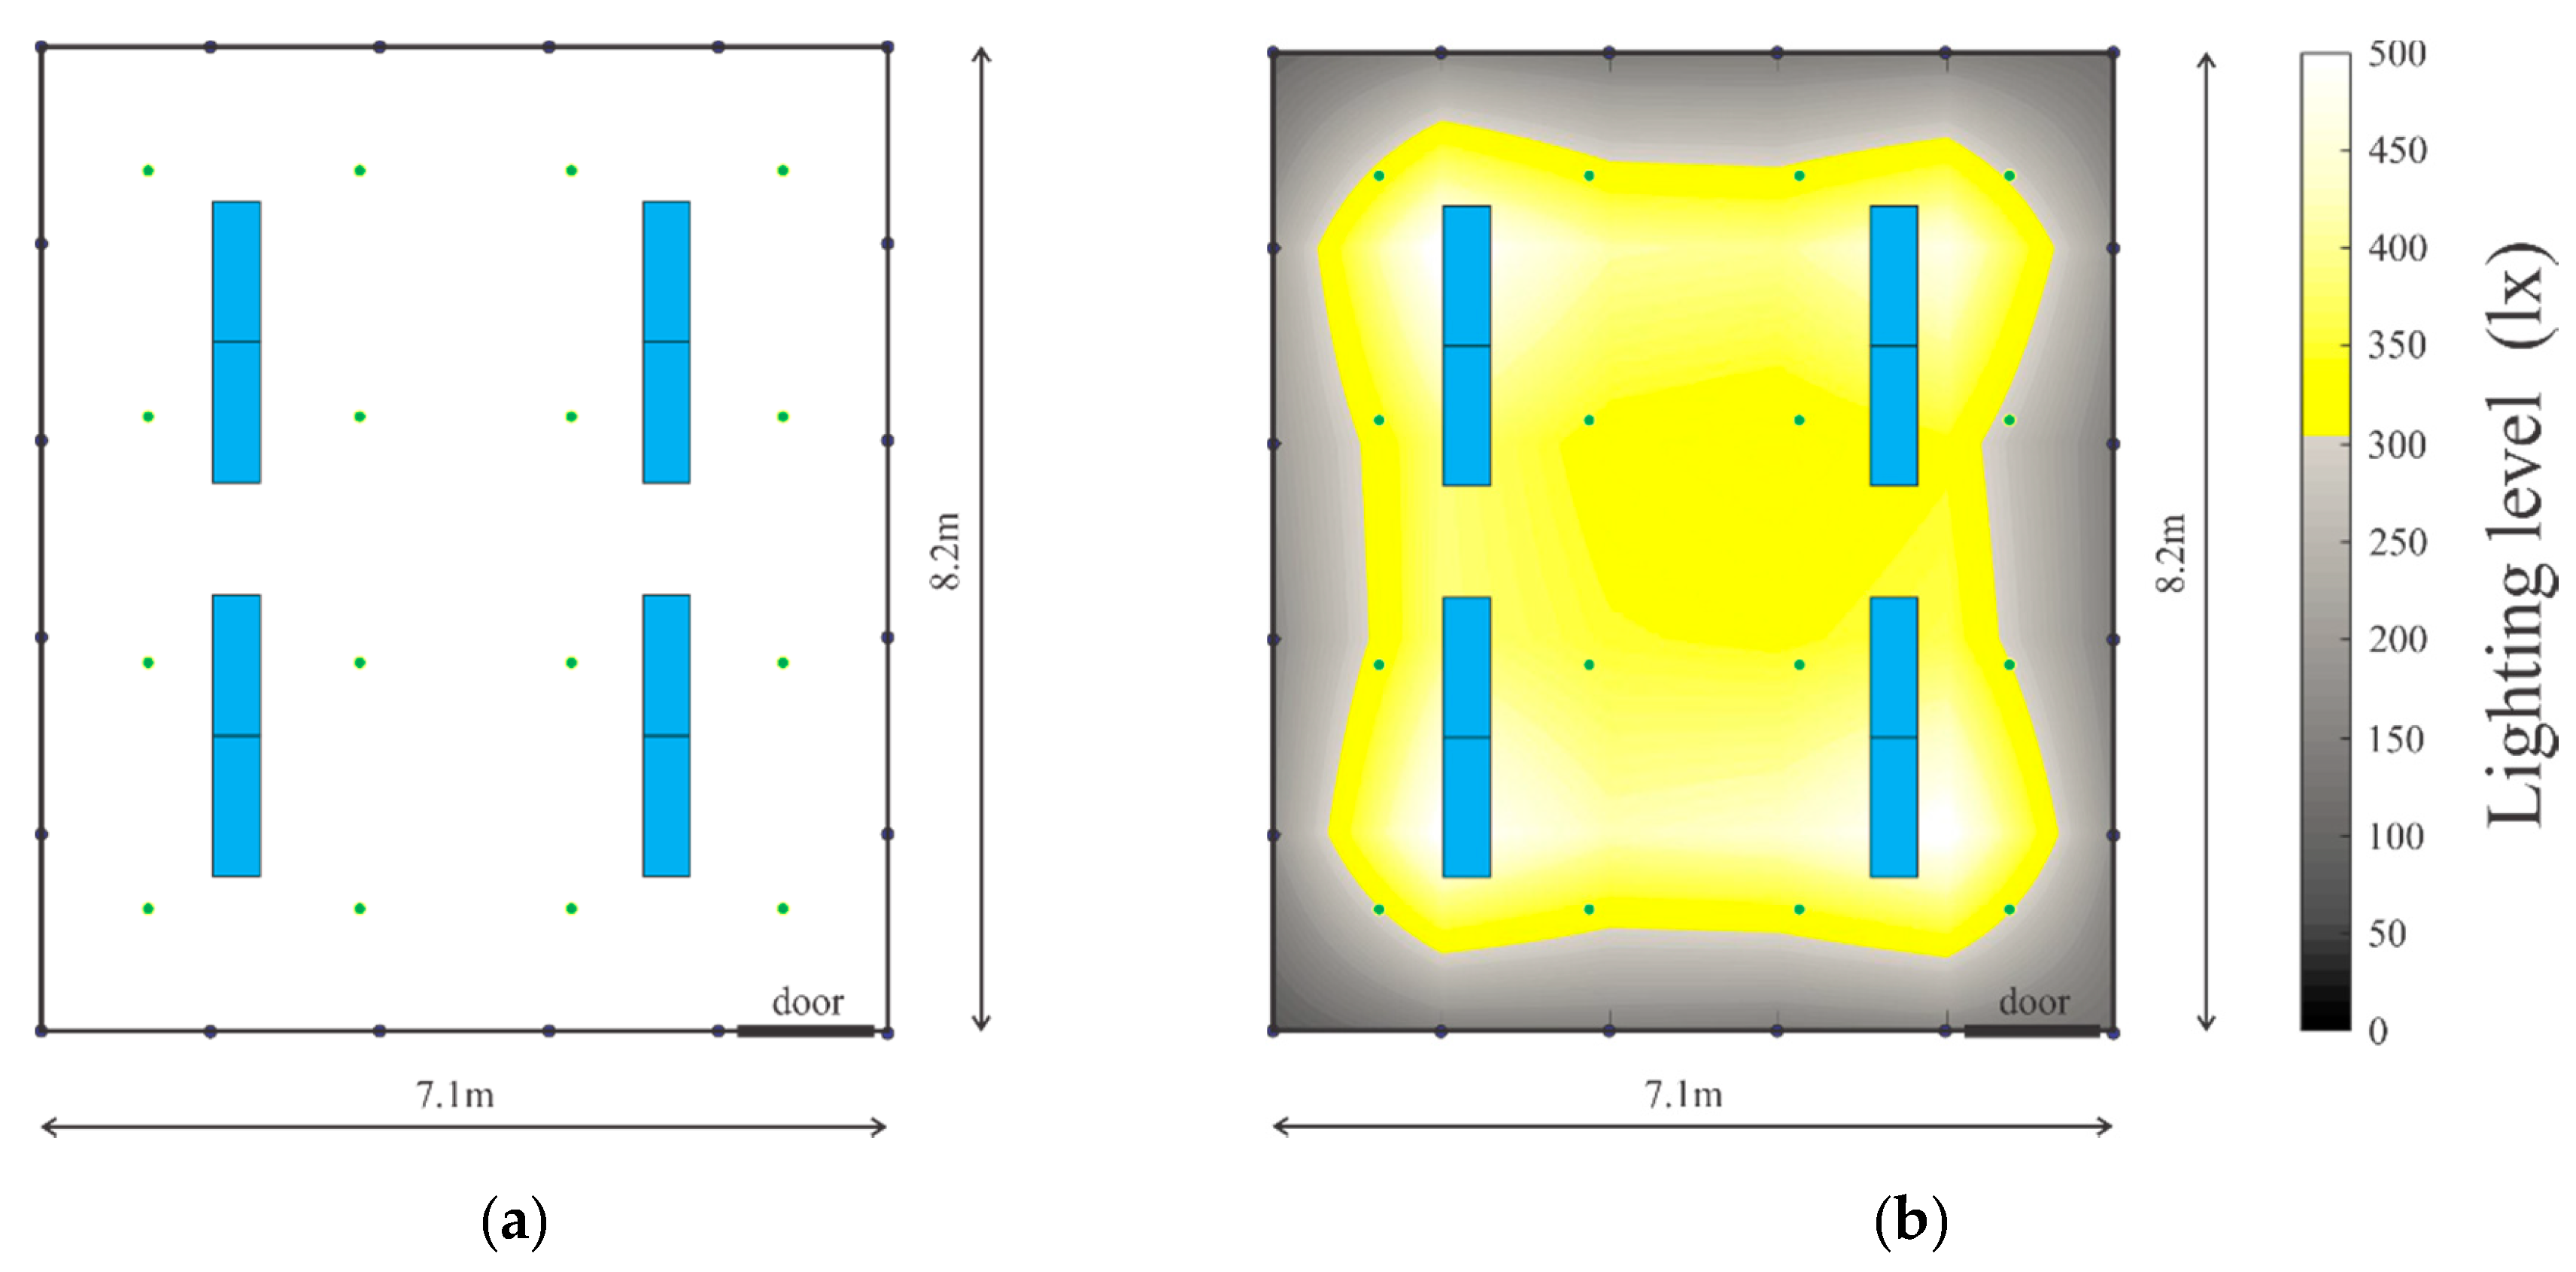
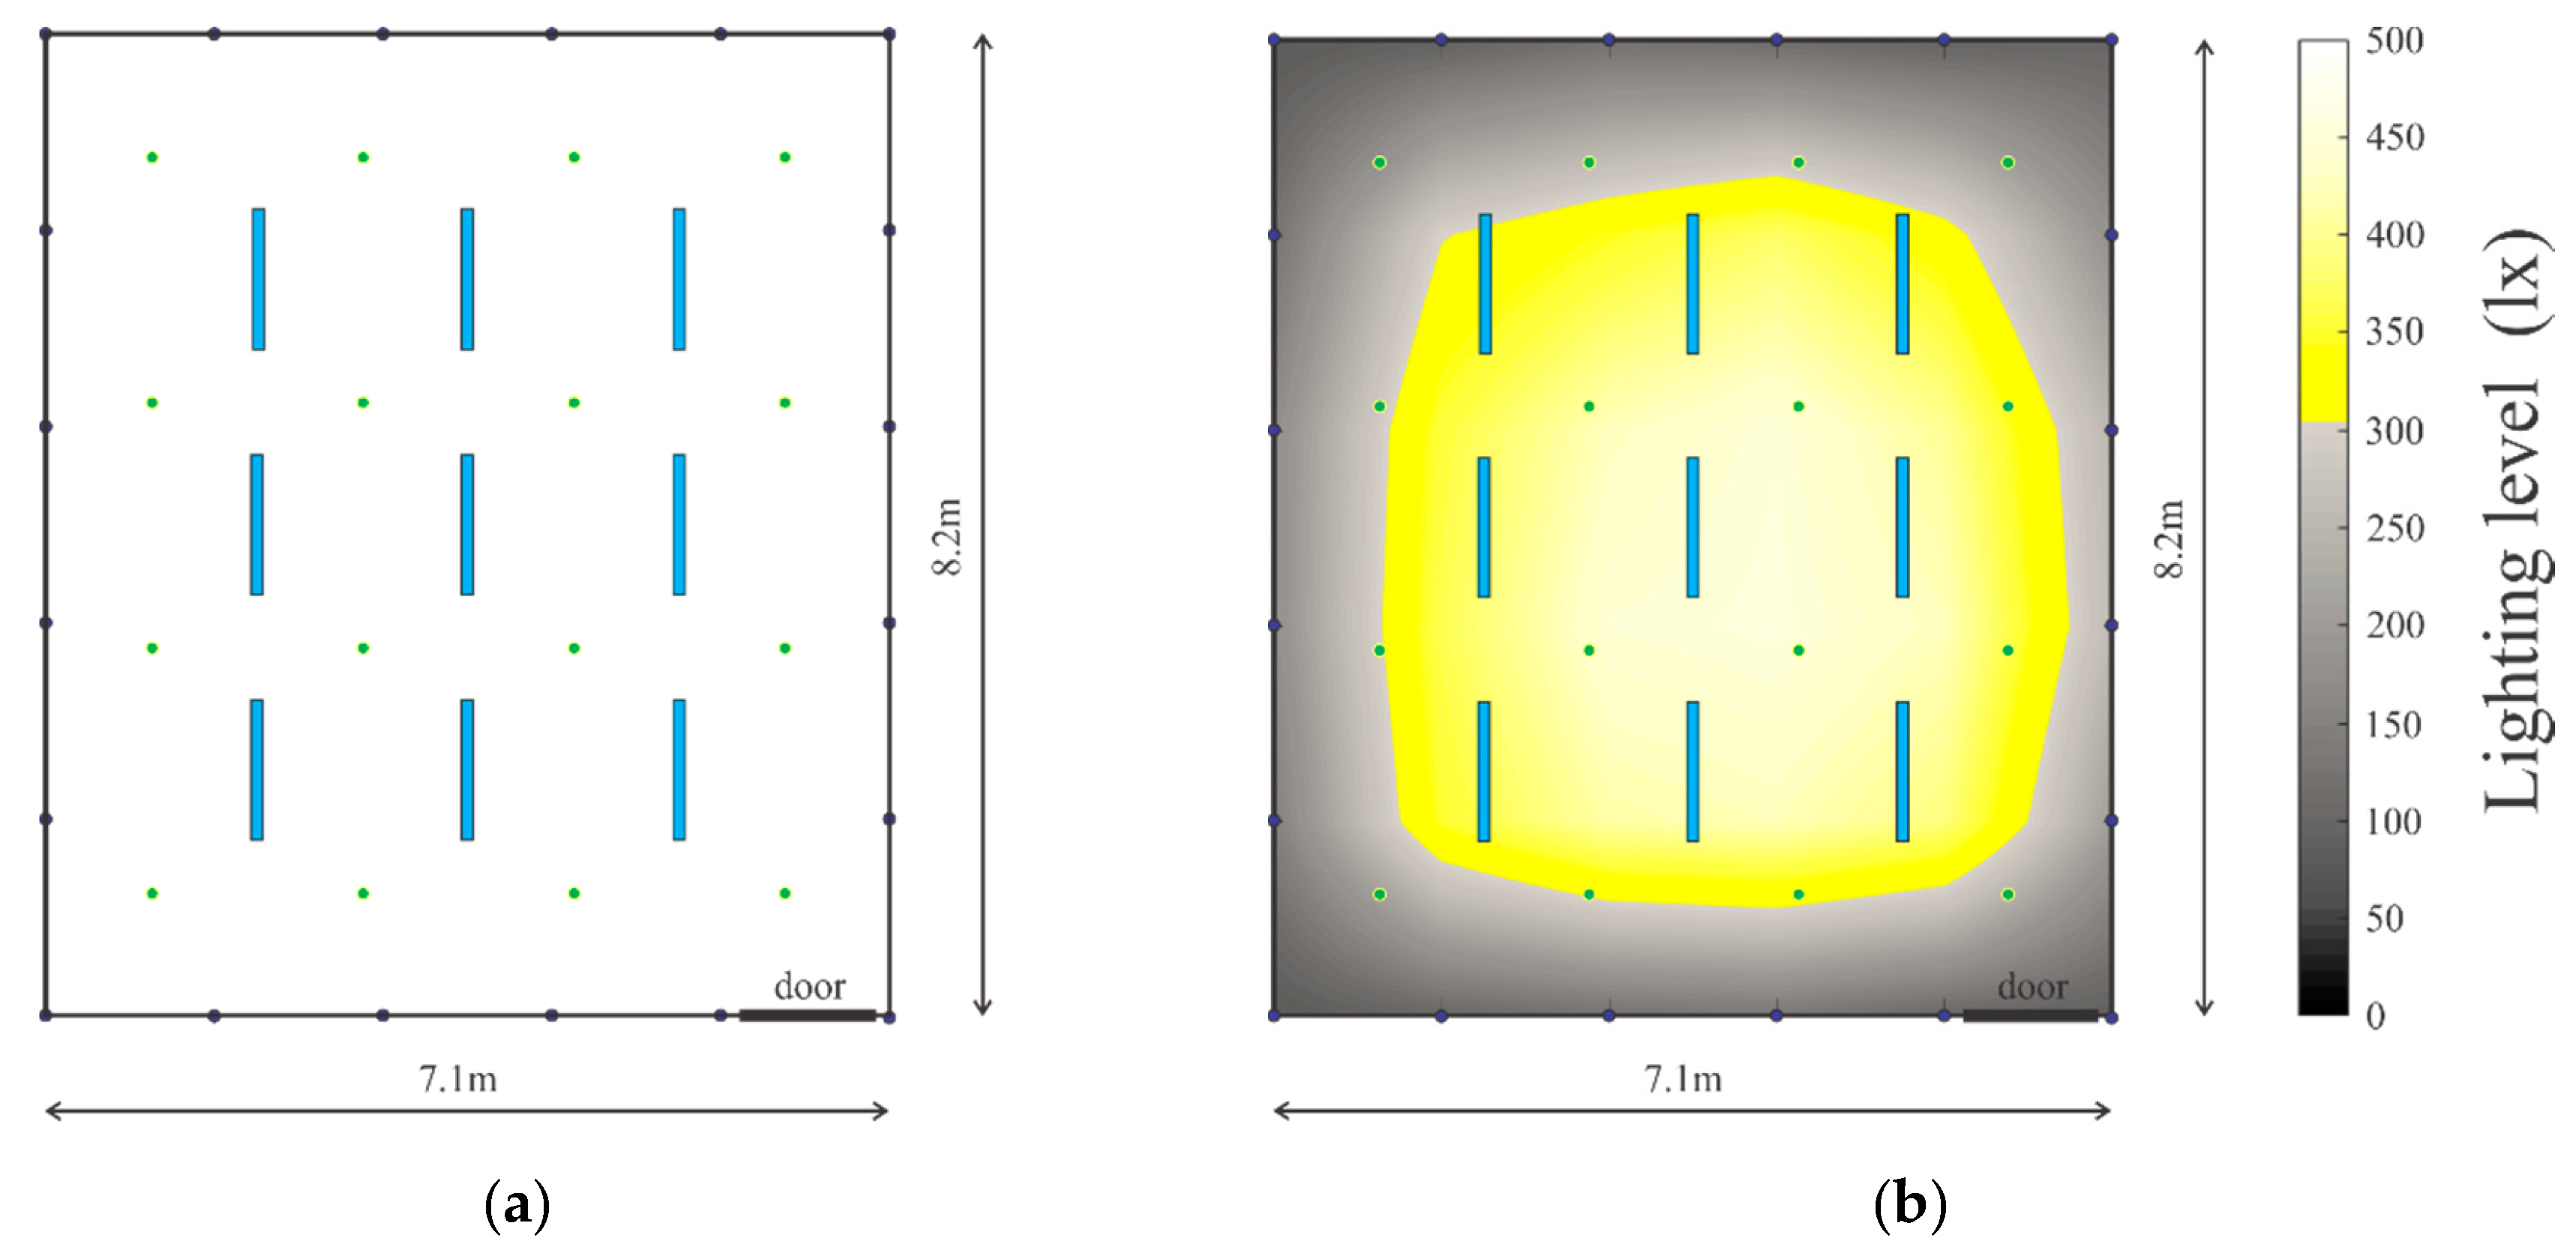
Figure 5a,b show the lamps setup and illumination distribution of classroom A58 with fluorescent T8 tubes, it must be highlighted that the selection of colors in the figure have the purpose of delimiter the zone above and below a 300 lm limit, the zone in the grayscale is not in darkness, just between 200 and 300 lm. The illumination levels were measured using a Hioki FT3424 light meter capable of measure illumination provided by LED lamps. The measure points were set according to the Mexican Standard NOM-025-STPS-2008 [
37]; the standard requires a minimum of 16 points for the area of the classroom, however, for the purpose of having a better image of the illumination distribution, additional points at the walls of the room were added to the measurements. With the points required by the standard, the illumination level of the classroom was found to be 314.63 lx, complying with the minimum level set by the standard for shipping and handling areas, classrooms and offices of 300 lx.
The fluorescent T8 tube system was replaced by Besser Lighting standard efficiency T8 LED tubes, and these tubes have a nominal luminous flux of 2520 lm at 18W, CRI >80, 5000 K color, and a Power Factor (PF) >0.93. Initial tests of the retrofitting were performed in classroom A58 to validate improvements, and they include power consumption and illumination level and distribution measurements. The results of these tests are presented in the following sections.
5.2. BACS
Academic Building A5 has been scheduled to host Electric and Electronics Engineering courses; it has a scheduled occupancy of 356 h/week out of the available 560 h/week. Normally, the main switches of the building are turned on at 07:00 and turned off at 21:00 by the maintenance crew. There is a huge possibility that many unoccupied classrooms could have their lamps turned on if the last person going out did not turn them off.
A BACS programmed with building schedules can reduce energy waste by disabling the operation of lighting systems when required. In the case of Building A5, there are 204 h/week (Monday to Friday) when the lighting system must be turned off. These hours represent a 36.4% of the possible waste of energy. Other buildings of ITH have a scheduled occupancy ranging from 71% to 78% per week. A5 scheduled occupancy of 63.6% makes it an excellent subject to test a BACS.
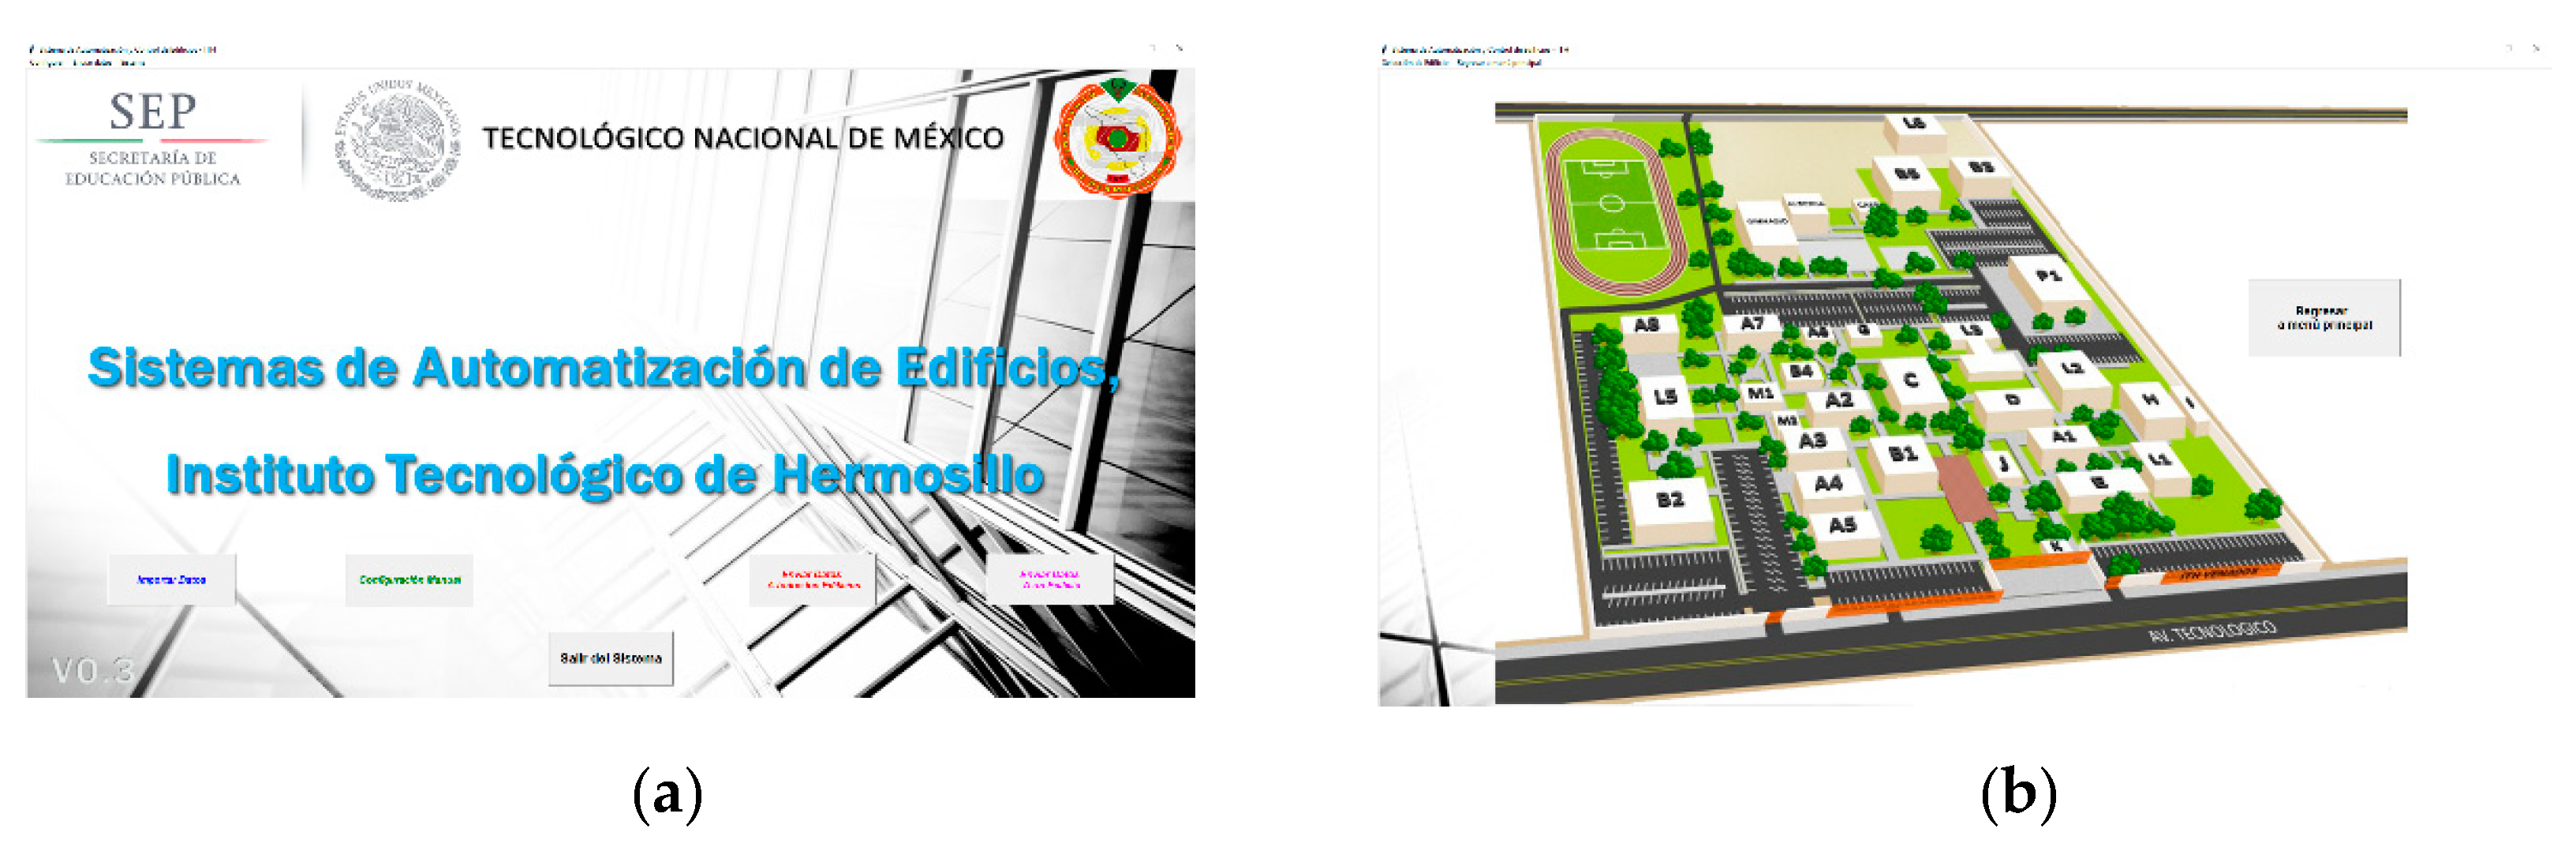
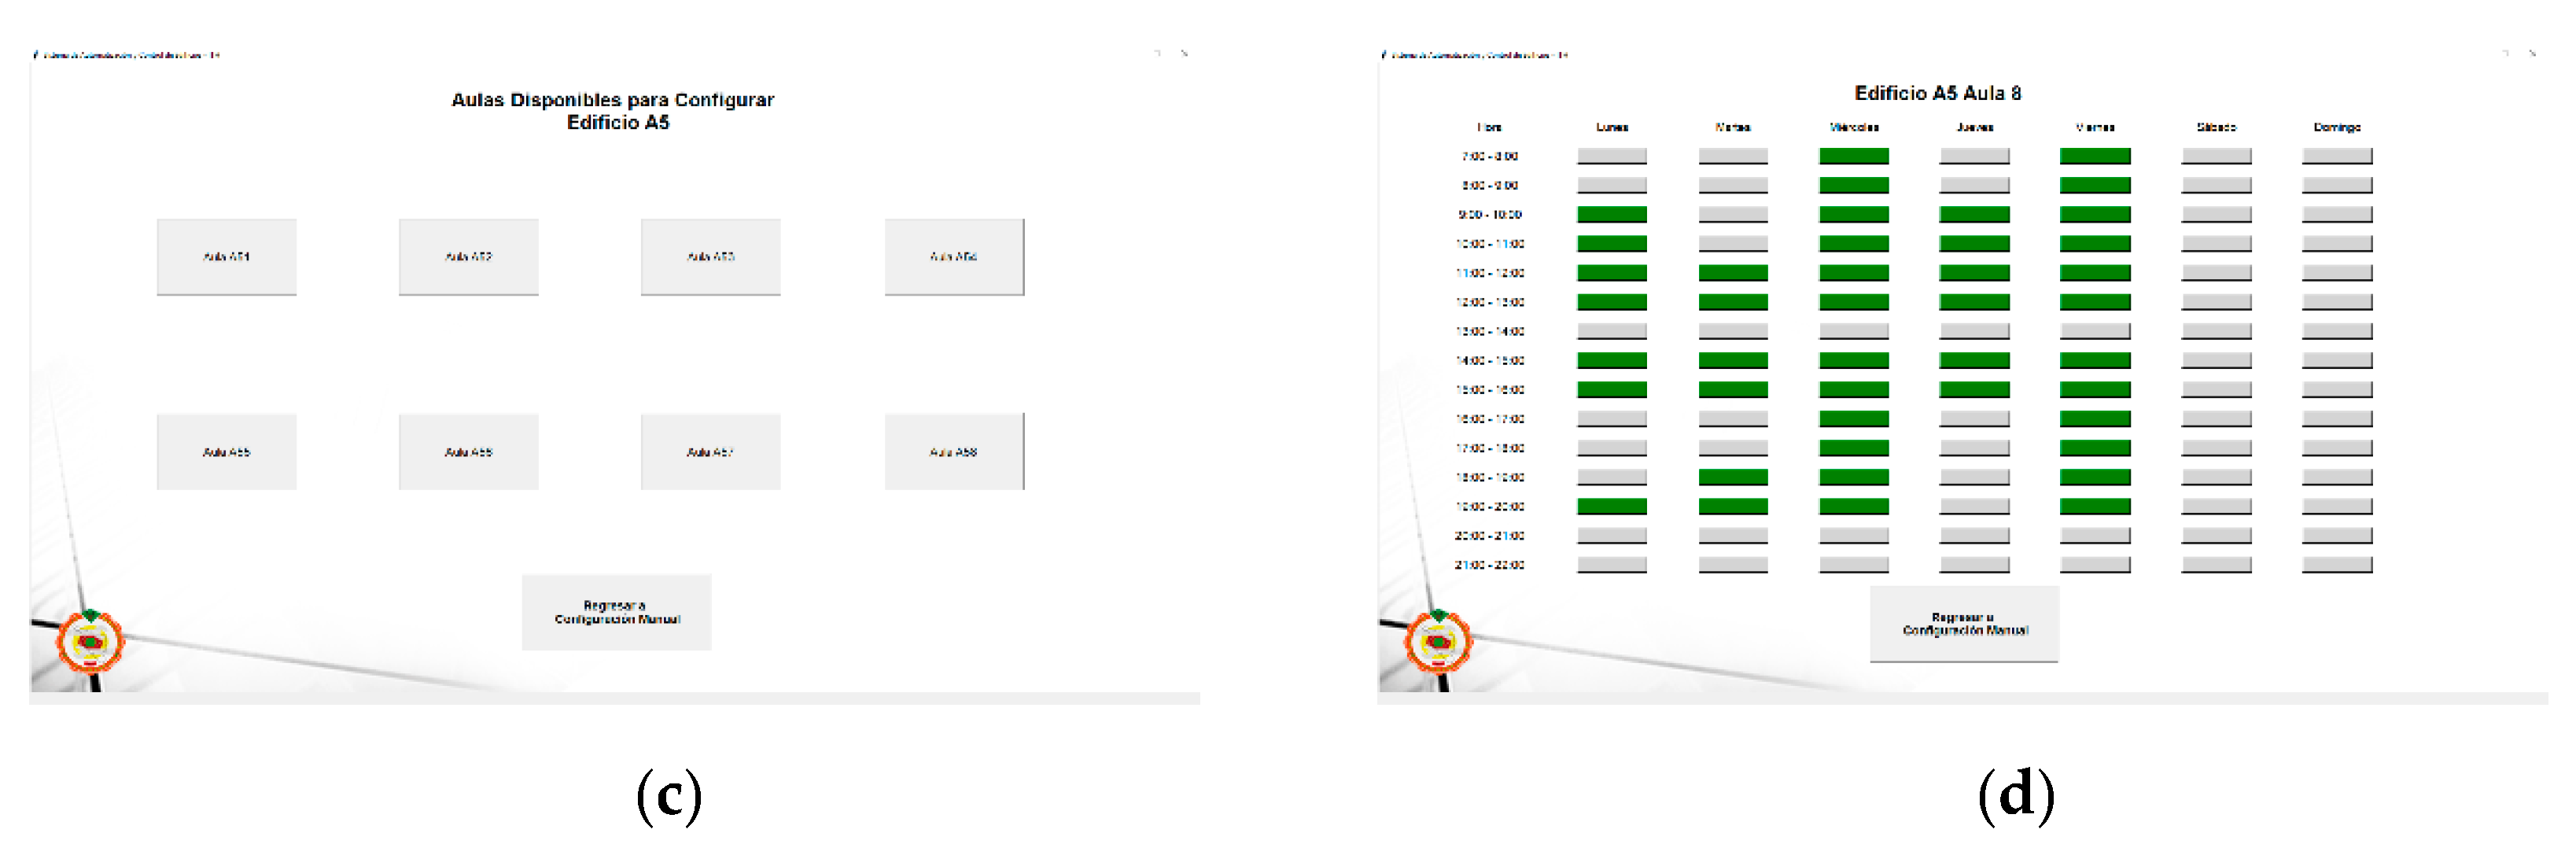
The proposed BACS has a graphic HMI to facilitate its usage,
Figure 6 shows some of the screens of the system. Primary schedule for BACS comes from ITH SII (Integrated Information System)—this schedule can be modified in the BACS when necessary.
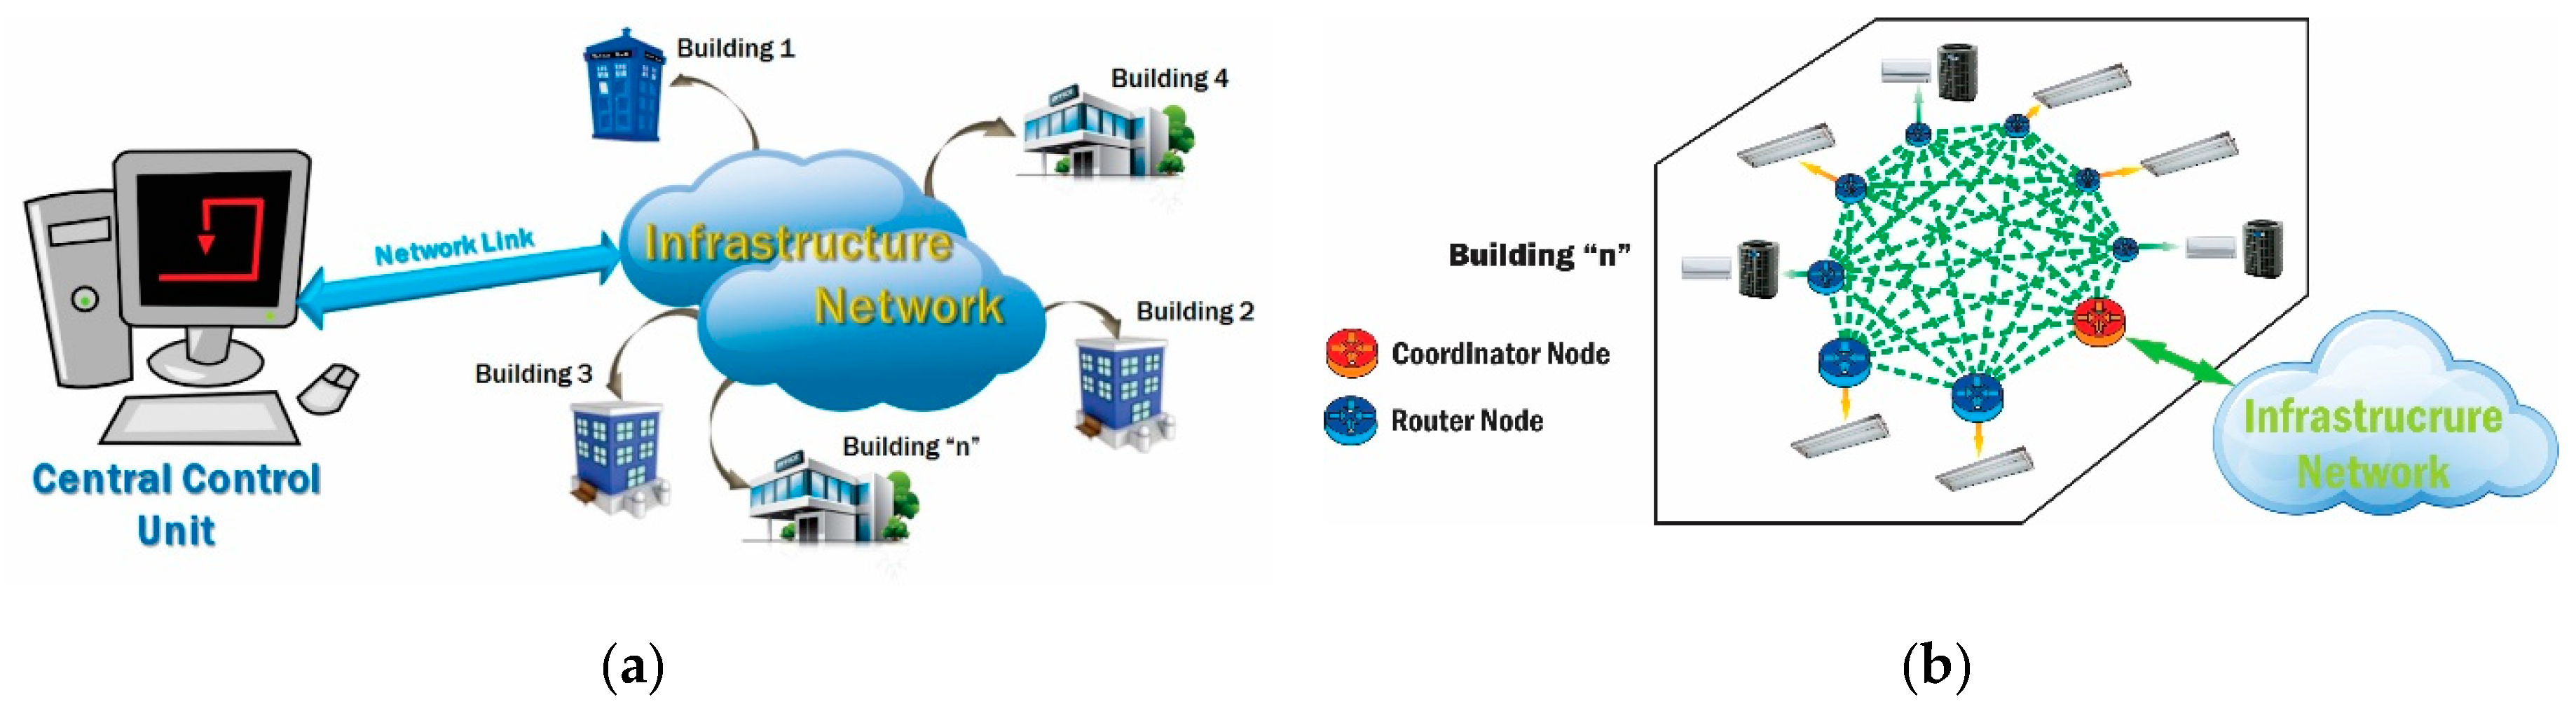
The main HMI of the BACS can be installed in the building administrator’s PC or in the academic head office PC, and it is capable of transferring the schedule to a local controller in the buildings at the beginning of the term or when necessary. The local controllers are located at the building distribution boards. Each local controller is connected to an internal wireless sensor network capable of enabling/disabling the lighting system of each classroom and to control the operation of HVAC, and
Figure 7 shows the general structure of the BACS.
The energy savings obtained by the BACS operation can be estimated as
5.3. Impact Metrics of the Project
The impact of the project can be measured by translating the reduction in the power consumption into economic and environmental parameters. Environmental impacts can be expressed as the amount of pollutants not sent to the atmosphere by the power plant supplying energy to ITH, such as methane, CO2, N2O, SO2, and particular matter 2.5 (PM2.5), directly related to the amount of power consumption reduction. It can be also related to the reduction goals set by the Mexican government in the GLCC. The economic impact can be monetized into indirect and direct savings. Indirect savings are expressed in terms of health and social costs of not emitting pollutants to the atmosphere; meanwhile, direct savings are expressed in terms of billing reduction by the utility.
5.3.1. Environment Impacts
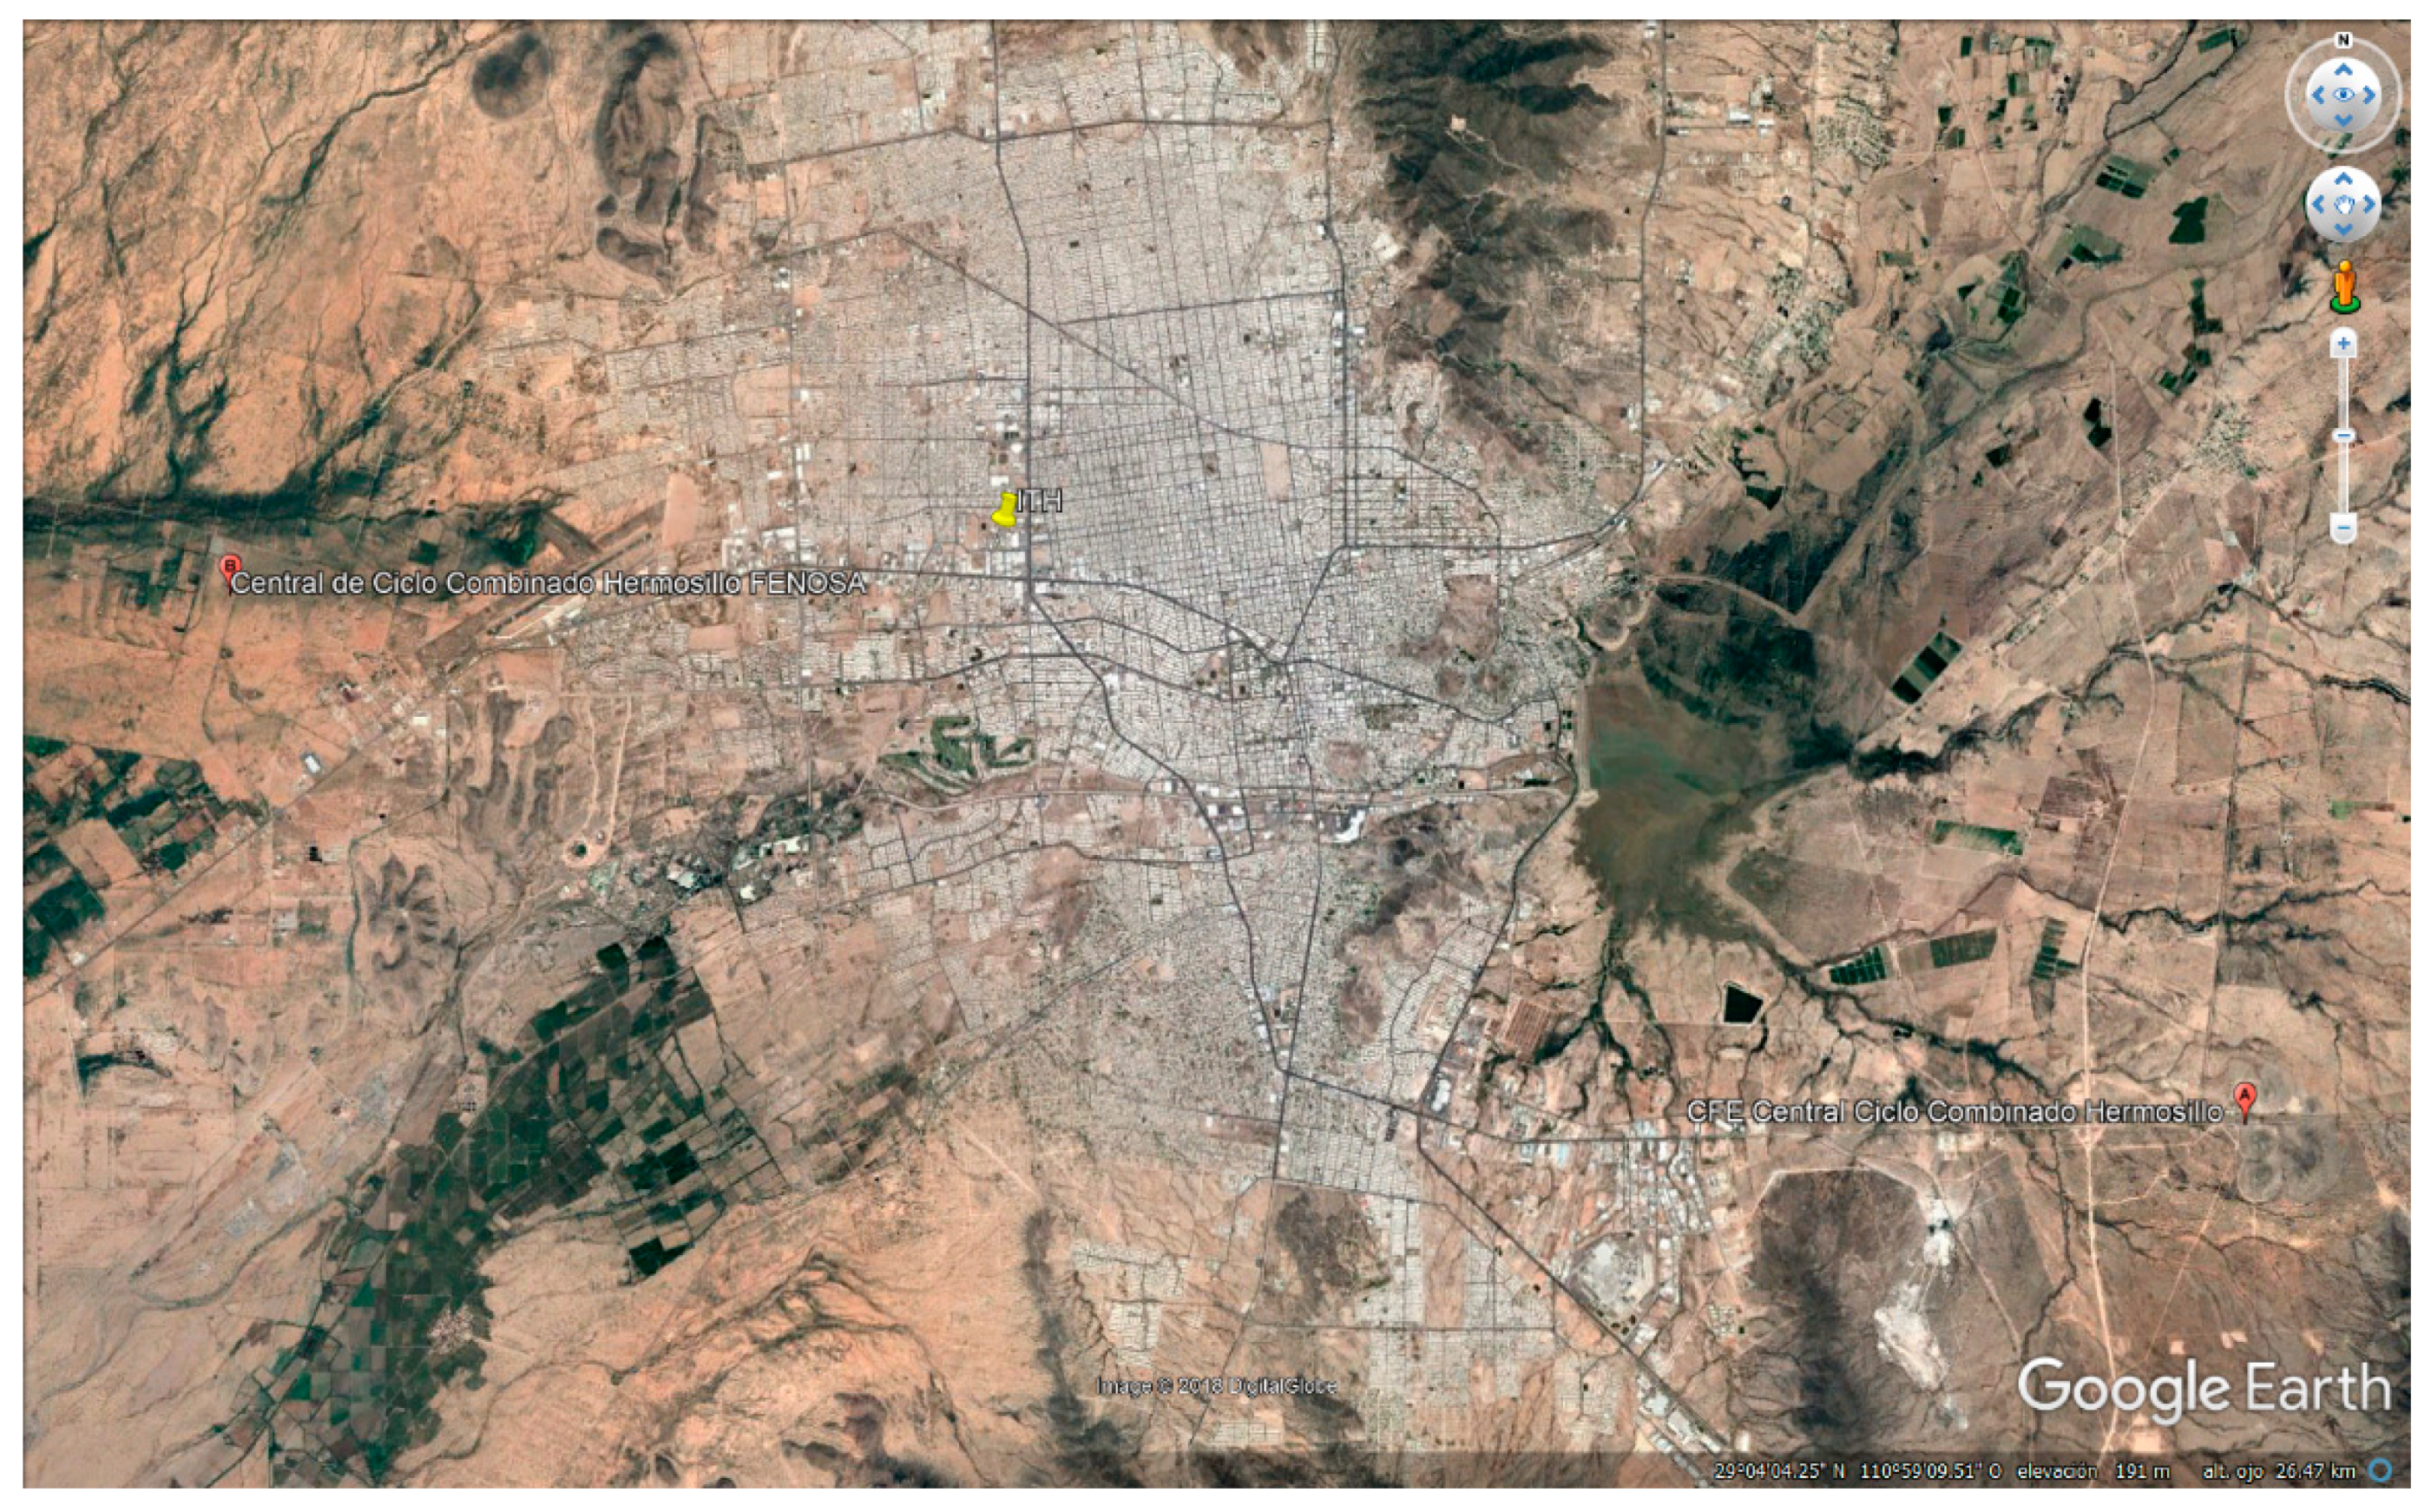
To rate the environmental impact of the power consumption reduction, the amount of pollutants not emitted must be estimated using the amount of energy saved and the characteristics of the utility plant that provides energy to the site. Hermosillo has two power plants nearby, and both run on Natural Gas:
Fuerza y Energía de Hermosillo (Unión Fenosa), and
CFE CCC Hermosillo.
Fuerza y Energía de Hermosillo is a private owned facility located at 9.8 km from ITH, and CFE CCC Hermosillo is a public utility plant located at 17.5 km from ITH.
Figure 8 shows a topographic picture with the localization of both plants and ITH.
Fuerza y Energía de Hermosillo is the closest to ITH and is also the biggest, so it should be used to estimate the reduction of pollutants.
Fuerza y Energía de Hermosillo has a Power Generation capacity of 1’316,209 MWh/year. Taking into account the plant characteristics [
38] and the amount of energy saved, the pollutants not sent to the atmosphere—methane (CH
4), carbon dioxide (CO
2), nitrous oxide (N
2O), particular matter 2.5 (PM2.5), sulfur dioxide (SO
2), and nitric oxide (NO
x)—can be calculated as
Methane, carbon dioxide, and nitrous oxide are directly linked to global warming, and they can be expressed in terms of CO
2 equivalent using the coefficients set by the Environmental Protection Agency (EPA) [
39] as
5.3.2. Indirect Economic Impacts
Indirect savings are linked to carbon social costs and health benefits. Carbon social cost is defined as an estimation of the economic damages that can be related with a gradual increase of CO
2 emissions in any given year and, according to the World Resources Institute, the US government gave it a value of
$41 USD/tCO
2 in 2015 [
40]. Health benefits in this context can be defined as the monetized index related to the mortality prevention due to the reduction in PM2.5 air pollutants (primary and secondary) [
41,
42].
To obtain the value of the carbon social costs and health benefits, the amount of pollutants not emitted is used.
The carbon social cost (CSC) saved by the energy consumption reduction takes into account the result of (8) as
The estimation of the health benefits (
HB) is based on the Harvard’s Six Cities Study by Dockery [
43], where the author estimated the effects of air pollution on mortality while controlling for individual risk factors. It found that an increment of 10 μg/m
3 in the concentration of PM2.5 increases the probability of cardiovascular mortality by 9%. SO
2 and NO
x are considered as secondary PM2.5 pollutants, thus they must be included in the estimation, and
HB are calculated using
where
ND is the average number of deaths by year related to cardiovascular diseases,
CT is the sum of the change rate of all the PM2.5 pollutants (μg/m
3), and
VSL is the value of a statistical life (USD),
where
xxx represents the pollutant, PM2.5, CO
2, NO
x,
Exxx is the reduction on pollutant
xxx in μg/day,
iFxxx is the intake fraction of pollutants,
Br is the average breathing rate (20 m
3/day),
P is the total population affected, and
Poxxx is the amount of pollutant
xxx not sent to the atmosphere.
Intake fraction average values for fine particles for Mexico are taken from column “
Resto del País” of Table 5 of [
44] and presented in
Table 1.
Sonora is a Mexican State with a high death rate from cardiovascular diseases of 137 deaths for every 100,000 persons in 2015 [
45]. Hermosillo had a reported population of 884,273 in 2015 [
46], this means that it is very likely that nearly 1211 deaths are occurring in Hermosillo every year due to cardiovascular diseases. The reduction in the PM2.5 pollutants linked to the energy savings produced by the operation of the project can be estimated as
and their concentration change rates as
The VSL for Mexico can be extrapolated using EPA VSL for the US and GDP per capita of both countries [
1]:
The base value of
VSLUS set by EPA is
$7.4M in USD for 2006 [
47]; GDP for the US and Mexico for 2017 are
$59,531.70 and
$8902.80, respectively [
48].
ε is an economic elasticity factor and, according to [
49], ranges from 1.4 to 2.0. In this project, a logarithmic average of 1.673 is used, resulting in a VSL of
Using the values of the Sonoran cardiovascular diseases death rate, Hermosillo’s population, (19), and (21), the health benefits can be estimated as
5.3.3. Direct Savings
Direct economic benefits are reflected in the utility bills because of monetizing the energy savings. ITH has a mid-voltage tariff called GDMTH (great demand medium tension hourly) and this means that the cost of the kWh changes with time of day and season of year. To evaluate the savings, the average 2018 kWh cost is calculated using the accumulated consumption monthly average through July of 178,853 kWh/month, resulting in a price of $0.0951 USD/kWh.
The energy savings obtained by the retrofitting and control of the lighting system yearly can be computed by
6. Implementation
The implementation of the retrofit actions and BACS operation provided a different level of energy savings, as presented below.
6.1. Retrofit
For the retrofitting of the lighting system in Building A5, four double tube fluorescent lamps were replaced by nine single tube LED lamps. Besser standard T8 LED tubes were used as stated in
Section 5.1. The same procedure and measurement equipment described in
Section 5.1 was used to measure the illumination distribution and power consumption of the LED lamps.
Figure 9a shows the new lamp distribution. This rearrangement in the number and placement of the lamps produced a reduction in power consumption from 354 to 155 W, representing a saving of 199 W (56.2%) per classroom. The illumination level obtained with this new arrangement can be seen in
Figure 9b. The illuminated area with levels above 300 lx was reduced by nearly 11%, however, the classroom has an average illumination level of 305.2 lx, enough to comply with the actual Mexican standard. Moreover, this less illuminated area is outside the working area.
The estimated energy savings, assuming a normal operation of 560 h/week of Building A5, are calculated as
Additional savings are obtained by the operation of BACS.
6.2. BACS
The BACS operation of Building A5 translates the occupancy schedule to an operational matrix for the building controller. The BACS disables the operation of the lighting system inside the classrooms when scheduled; this can be translated as further energy savings of 155 W/h. Since there are 204 h/week of non-occupancy in Building A5, the amount of energy saved by disabling the operation of the lighting system can be estimated using (1):
The total amount of energy saved by week is the sum of the retrofit and BACS savings and, to expand these savings to the whole year without taking into account summer term, a total of 34 weeks/year of usage is considered.
7. Results
Using the energy savings projected for Building A5 with the retrofit change and BACS operation, the environmental and economic impacts can now be estimated. Those savings will be increased with the upgrade and BACS-based control of HVAC.
7.1. Environmental Impact Results
The energy savings obtained with (27) can be used in Equations (2) through (7) to calculate the amount of pollutants not send to the atmosphere in the operation of Building A5. The amount of these pollutants are summarized in
Table 2.
The total CO
2eq saved is estimated using (8) as
As stated above in
Section 3, Mexico has an aspirational goal of reducing its GHG emissions by 30% (in 2020), and buildings are accountable for 1.7% of those emissions, that is, 4.44 MtCO
2eq. The total CO
2eq saved in this project at this point, represents only 0.000409% of the goal, however, if the size of the campus and, more importantly, the size of the TecNM system are taken into consideration, the impact of these results can be seen as an important factor in the achieving of the goal.
7.2. Economic Impact Results
As it was presented in
Section 5.3.2 and
Section 5.3.3, the economic impact of the project can be divided into indirect and direct savings and, in the following sections, the monetized impact of the environmental and power consumption is presented.
7.2.1. Indirect Economic Impact Results
As has been stated above, indirect economic impacts are related to carbon social costs and health benefits. To estimate the CSC, the amount of pollutants not sent to the atmosphere has to be monetized using (28) in (9) as
This amount is not very high, however, as this only represents one building of the campus as stated in
Section 7.1. When the project gets scaled, a significant improvement will be achieved.
Health benefits can be estimated using (23), and it requires that the change in PM2.5 pollutants breathed to be calculated using (11)–(20). The partial calculations are presented in
Table 3.
Combining (29) with (30), the total amount of indirect savings is $4762.97 USD/year.
7.2.2. Direct Economic Impact Results
The direct reduction in the energy bills as a result of the retrofitting and BACS operations is calculated using (27) in (24), resulting in
7.2.3. Financial Analysis
The cost of retrofitting building A5 with LED tubes is $1263 USD. BACS with eight router nodes (light switches), one concentrator node, software for CCU, wiring, and installation for one building requires an investment of $4230.00 USD. The cost of CCU is neglected since the BACS software can be run in any Windows or Linux computer. The total investment for building A5 is $5493.00 USD.
The new lamps and BACS components are not failure-free— there will be occasions when replacing faulty components would be necessary. A reasonable failure rate for the lamps is 2.5% annually, and 1% for BACS components; representing an additional maintenance cost of $137.00 USD/year.
For financial analysis purposes, the expected Mexican inflation rate of 2.73% is being used as the interest rate for cost of capital.
The amount of annual economic savings is calculated as the difference between billing savings and maintenance cost. As stated earlier, the average cost of energy in 2018 was
$0.0951 USD/kWh. Annual billing savings are estimated as
$3700.56 USD and indirect savings are estimated as
$4762.97 USD, then, total savings are estimated as the sum of billing and indirect savings which is
$8463.53 USD, and the maintenance cost is
$137.00 USD/year; this means that the annual equivalent cash flow of the project is
$8326.53 USD. Given an investment of
$5493 USD (CF0), a cost of capital rate of 2.73% (k), an investment period of 3 years (n) to recover the investment, and a cash flow (CFt) of
$8326.53 USD, the internal rate of return (IIR) can be obtained from
At year three, IIR has a value of 140.71%, greater than the cost of capital rate, meaning that the investment will be recovered. To estimate the payback period (PP) of the investment, the data presented in
Table 4 is used in
The payback period is approximately 8 months.
8. Conclusions
This paper presented results from the implementation of two stages of a pilot energy saving program of the Hermosillo Institute of Technology. These stages comprised (i) the retrofitting of the artificial light system, and (ii) the implementation of a building automation and control system for the management of the artificial light system. The retrofitting process involved not only a change in the technology of the lamps, but also a new physical distribution of them to make a trade-off between power consumption and the fulfillment of the Mexican standard for handling illumination in working areas, classrooms, and offices. The results for the energy saved for the BACS is 36.42% with respect to the upgraded artificial light system and the total amount of energy saved by the retrofit plus the BACS is 72.16% with respect to the original artificial light system. The energy savings were analyzed in two complementary ways: environmental impacts and economic impacts. The financial analysis of these two stages shows that the payback period to recover the investment of retrofitting and implementing a BACS in Academic Building A5 is 8 months.
These actions will be complemented with additional improvements proposed as future work. For instance, the retrofit stage will be upgraded with the replacement of the air conditioning equipment (HVAC system) of the institution with more efficient systems. The building automation stage will include the HVAC control in the BACS. This would result in greater savings and, particularly, it will contribute to mitigating the excessive energy demand during the hot weather season. Of course, these actions need to be replicated in the rest of the campus, and the replication of the entire project to the other campuses of TecNM represents a great challenge.
Finally, the third stage of the pilot energy saving program also remains as future work. This stage contemplates the generation of energy using renewable sources such as solar energy (through the integration of solar panels) and the supplying of electric power to the wireless sensors by a micro energy harvesting system inside the building.

 ,
, 


