Workplace Parking Provision and Built Environments: Improving Context-Specific Parking Standards Towards Sustainable Transport

1
School of Architecture and Urban Planning, Shenzhen University, Shenzhen 518000, China
2
School of Design, South China University of Technology, Guangzhou 510006, China
3
Faculty of Architecture, Harbin Institute of Technology, Shenzhen 518000, China
*
Author to whom correspondence should be addressed.
Sustainability 2019, 11(4), 1142; https://doi.org/10.3390/su11041142
Submission received: 14 January 2019
/
Revised: 18 February 2019
/
Accepted: 18 February 2019
/
Published: 21 February 2019
Abstract
:Both academics and practitioners concur that parking restraints should be actively introduced in urban centers and job-intensive areas, to prevent overdependence on automobiles. Many Chinese metropolises have reduced the level of parking minimums for non-residential premises in central and transit-rich areas. However, there is a lack of research examining the effectiveness of these policies. Taking Shenzhen as a case study, this paper compares the parking supply with the parking minimums at each policy period, and analyzes the spatial characteristics of parking provision for office use. The descriptive analysis found that the effects of minimum parking requirements (MPRs) on parking provision vary by floor area ratio (FAR), operation period, and transit accessibility. By conducting a geographical weighted regression (GWR) model, this paper further examines the spatially varying effects of the built environment on parking provision. The modeling results conclude that the significance and strength of the effects of built environments on parking provision vary across space. (1) The total parking quantity increases with the growth of the FAR, and this increasing effect is larger in suburban areas than in the city proper. (2) Lot size has a positive relationship with parking provision, and the effects are stronger in areas with higher parking demand. (3) Transit accessibility has inconsistent associations with parking provision at different locations, in terms of the direction and strength of the influence. These results provide relevant insights into the development of context-specific parking policies in the high-density contexts of China’s large cities.
1. Introduction
Parking policy is significant in influencing travel behavior, and has been extensively employed by urban and transport planners in an attempt to promote sustainable transport [1]. Many studies have examined the performance of various parking restriction measures [2,3,4,5] and the effects of parking, in addition to other built environment variables, on car ownership [6] and use [7,8,9,10,11,12]. This literature concludes that parking charges and restraints on parking provision are effective in reducing car use and ownership. Some of the most recent research has further shown that the parking effects are not independent of, but rather are interrelated with, the effects of other built environment characteristics. Using Norwegian National Travel Survey data, Christiansen et al. [13] showed that parking restrictions perform better in city centers and high-density and transit-accessible areas than otherwise (i.e., suburban, low-density and transit-poor areas). Similarly, Liu et al. [14] showed that the benefits of compact land use and transit-oriented development (TOD) for reducing car use can be either reinforced or offset, depending on the various interrelationships between parking and the built environment. These studies demonstrate the necessity of placing parking regulations into a larger context, one in which the land use pattern, public transport, and urban form are all taken into account.
The rise of the New Urbanism, associated with the increasing emphasis on integrated transportation and land-use planning, has spawned a new perspective on parking management. The sufficient parking supply engendered by conventional minimum parking standards has been profoundly criticized for aggravating automobile dependency. Rather than setting uniform parking standards that exclusively relate to the land-use type, setting context-sensitive standards, which are supposed to be integrated with built environments in a sophisticated manner, has been advocated. As suggested by Cuddy [15], context-sensitive parking standards are combined with a range of factors (e.g., location, density, transit accessibility, lot size, sociodemographic characteristics) when deciding the level of parking provision for new developments [15]. This shift in rationale has led to a series of parking standard reforms—many countries have regulated the amount of parking by location and transit accessibility. Worldwide, cities that have employed location/transit-based minimum/maximum reductions include London, Paris, New York, Hong Kong, Tokyo, Strasbourg, Zurich, Antwerp, and Amsterdam [16]. Reduced parking standards, or even exemptions, have also been applied to small lots and/or high-density developments. These practices have been observed in Hong Kong, Tokyo, New York, London, and many other developed cities.
Parking policies in China and other developing countries in Asia have been frequently attacked for the resilience of minimum parking standards. Wang and Yuan [17] are among those to have reviewed parking practices and policies in China. They argue that “parking shortages and mismanagement are critical issues in China’s dense cities” [17]. With rapid and ongoing motorization, the mismatch between parking supply and demand, together with parking mispricing, are causing a series of negative consequences for urban transport [11,17]. Local authorities are used to raising the level of parking minimums to accommodate increased demand in residential areas. For non-residential areas, however, some Chinese cities have realized the significance of restrictive parking measures, and have planned their parking standards in a zone-specific manner. With the intention of discouraging car use and encouraging transit adoption, for example, Shenzhen has allowed a 40–60% reduction in parking minimums for non-residential properties (e.g., offices, stores, restaurants and hotels) in the city center, with good transit services since 2004 [18].
Although well designed parking-built environment relationships have been emphasized through regulation, limited research has empirically investigated the consequences of parking standards, or the effects of initiatives that eliminate minimum parking standards for some developments. The few studies available suggest that the effectiveness of the initiatives depends on market demand and site circumstances. Apart from parking standards, parking supply is also influenced by the provisional willingness of property developers to provide parking.
The aim of this study is to fill the aforementioned research gaps, and to expand the knowledge of how parking provision is influenced by both parking standards and the market. It examines a policy change in Shenzhen, China, in the early 2000s, when reduced parking minimums were applied to non-residential developments located in the city center and transit-rich areas. This paper first analyzes how parking provisions change with the adjustment of parking standards, and then examines parking-built environment relationships using a geographical weighted regression (GWR) modeling approach. This study intends to answer the following two questions: Do zone-specific parking standards reduce the parking supply in central and transit-rich areas, as the decision makers expected? If not, how can urban planning and parking policies be reformed to contribute to an efficient and sustainable transport system?
This paper is structured as follows: Section 2 reviews the literature, focusing on parking-built environment integration, and the collaborative effects of parking standards and the market on parking provisions. Section 3 introduces the research design and methodology. Section 4 presents the empirical outcomes, followed by Section 5, which discusses the conclusions and policy implications.
2. Literature Review
2.1. The Paradigm Shift in Parking Policy
As an effective instrument of transport demand management [19], well-designed parking policy has gained increasing attention in recent years—partly due to the gradual awareness of the negative externalities of minimum parking standards and free parking [20,21], and partly due to the emphasis on integrated transportation and land use planning.
With the purpose of avoiding shortages and spillovers, setting minimum parking standards in zoning is the norm throughout the world. Despite these goals, this policy approach has been intensely criticized. Opponents argue that generous minimum parking standards activate automobile-oriented built environments by potentially increasing the land area dedicated to parking, lowering development intensity and pedestrian accessibility, and encouraging further car dependence [20,21,22]. Represented by Shoup [21] some scholars advocate abolishing minimum parking standards and establishing a market-based approach instead. They argue that a market clearing price will adjust both parking supply and demand to efficient levels, with no need for off-street parking requirements. Although the market-based approach is economically justified, parking deregulation has by no means proceeded smoothly, due to concerns over market uncertainties [23]. There is a lack of consensus regarding what happens to parking supply after deregulation takes place. The general agreement is that the market mechanism is inadequate for addressing the negative externalities caused by the parking supply, unless special planning efforts are made to limit the number of parking spaces, improve their location, and require better design of parking lots [24]. Barter [23] advocates a less relaxed “market fostering” approach, in which parking supply is informed by efficient market signals and regulated to correct for market failure (e.g., parking oversupply in places where automobile travel should be restrained).
In departing from the conventional supply-focused approach, therefore, the rationale of parking standards has changed remarkably. Modern parking standards have emerged which consider the degree to which parking supply contributes to wider economic, environmental, and social goals [8] The utilization of parking maximums and/or relaxed minimums is an important strategy. Setting context-specific standards, instead of one-size-fits-all standards, is another. Location, density, lot size, and transit accessibility are major factors in the discussion of context-specific parking standards. Both academics and practitioners concur that parking restraints should be actively introduced in high-density, fine-grained, TOD, and/or mixed-use areas based on the consideration that the driving demand in these areas would, and should, be lower. Context-specific standards are usually implemented via zone-based differentiation. Many cities, such as Hong Kong, London, Portland, and Singapore, define distinct parking standards between the central and suburban areas, and/or between different zones of the central area based on land-use and accessibility characteristics.
2.2. Parking Supply and Its Relationships with Built Environments
Although there have been few pure market-based parking initiatives, researchers are increasingly paying attention to the role of property developers in affecting the parking supply. As parking supply is truncated by the minimum or maximum standards, many studies discuss the provisional willingness of property developers to provide parking by comparing the actual parking supply and parking standards. However, the results from these studies are somewhat diverse. Some evidence suggests that property developers actively respond to a reduction in or elimination of parking standards by providing less parking. Shoup [20] and Willson [25] provided case studies to show that minimum parking standards have forced property developers to build more parking than they otherwise would have in the absence of parking minimums. Manville and Shoup [26] found that, in 55 new developments that were exempt from the minimum parking standards in downtown Los Angeles, onsite parking supply exhibited a 40–55% decrease. Using citywide data from Los Angeles, Cutter and Franco [22] further confirmed that the average parking supplied is quite close to the required amount, and that a reduction in parking minimums results in reductions in parking supply, which seems to have a larger impact on service retail properties, and a smaller but still substantial impact on offices, shopping centers, and warehouses.
There is also evidence that reducing parking standards does not necessarily lead to the expected reductions in parking supply. The reduction effects depend on the characteristics of the built environment. Using the case of Toronto, Canada, Engel-Yan et al. [27] —whose research was based on an extensive commercial parking survey—suggested that the land-use type is relevant to whether developers provide less/more parking than required. The parking supply for general offices, medical offices, general retail, and large retail tends to be lower than the requirements, whereas it tends to exceed the requirements for banks and large grocery stores [27].
The parking reducing effects are weak for areas with better transit accessibility. Existing studies conducted in different contexts of North American, European, and Asian cities have observed similar phenomena; that is, developers appear to provide more parking than required in transit-rich areas. Nelson et al. [28] examined the effects of the special public interest district (SPID) in Atlanta, United States, showing that developments located inside SPIDs are allowed to not provide parking facilities. Their investigation of 13 new commercial and office developments found that the exemptions from parking standards did not reduce parking supply, and that the actual parking ratios of projects inside SPIDs are slightly higher than those outside. McDonnel et al. [29] surveyed 96 new residential developments in Queens and Brooklyn, New York City, and found that only 18% provided less parking than the estimated minimum standards, and that 40% provided the exact number of parking spaces required. In total, 40 of the projects (approximately 42%) provided parking that exceeded the estimated minimum standards, and the majority of these projects were located within a half mile of a rail transit station [29]. In London, Guo and Ren [30] found that property developers usually provide more parking in areas with higher density and better transit accessibility, than in the immediate adjacent areas with lower density and poorer transit services. In urban China, Liu et al. [14] discussed undesired parking-transit relationships, in which central and transit-rich areas actually exhibit a relatively high parking density, even though minimum parking standards have been reduced in these areas. The ubiquitous mismatch between parking and transit supply is greatly attributed to the potentially higher premium that parking can bring to developers. In transit-rich areas, the benefits of providing parking can exceed its construction and opportunity costs.
Parking standards often permit exemptions for small developments. Studies that examine the exemption effects demonstrate that a small lot size is an important stimulator depressing developers’ willingness to provide more parking. Been et al. [31] found that the vast majority (83%) of residential developments in New York City that qualified for the waiver of parking minimums because of smaller lots provided no parking at all. McDonnell et al. [29] also found that some developers would split a single development into multiple smaller developments to receive a parking minimum exemption. Li and Guo’s [32] analysis of the “binding” and “capping” effects of minimum and maximum parking standards in London indicated that small units, small developments, and inner city neighborhoods are more sensitive to the elimination of parking minimums. In the Chinese city of Shenzhen, Wang and Liu [11] found that residential parking provisions (measured by parking ratio and parking quantity) decrease significantly in areas with dense street networks, even though parking minimums have not been designed to vary with road density and the lot size of developments.
Parking demand changes dramatically over space. The emergence of context-specific parking standards aims to geographically balance parking supply and demand. The existing literature has accumulated some evidence that parking supply changes with a certain built environment over space. However, comprehensive research on how built environments affect parking provision is still lacking. Our previous research on the same topic was limited to residential land use. This study extends our previous research to office land use, where reduced minimum parking requirements (MPRs) and context-specific parking standards are widely implemented. This study also enriches our knowledge of the relationships between parking provision and built environments, considering geographical variance.
3. Research Context
3.1. Parking Standards in Shenzhen
Shenzhen is a major city in Guangdong Province, China. It is located on the east coast of the Pearl River Delta, and is immediately adjacent to the Hong Kong Special Administrative Region. In 1980, Shenzhen was designated China’s first special economic zone (SEZ), holding sub-provincial administrative status. Shenzhen was established as a city in 1979. Its core area (including the four core districts of Luohu, Futian, Nanshan, and Yantian) was designated as a “Special Economic Zone (SEZ)” in 1980. Since then, Shenzhen has experienced astonishing development in both economic terms and urban construction. In the mid-1990s, the boundary control between the SEZ and the rest of Shenzhen was removed, and in 2010, the Shenzhen SEZ was expanded to the entirety of the city, incorporating Bao’an, Longgang, and other outer districts. The study area of the current paper covers the entire administrative area (1989 km2) of the municipality of Shenzhen. As an SEZ, notable urban and economic developments have been achieved in recent decades. Shenzhen is also a pioneering city that has initiated many innovative reforms in urban governance. Shenzhen was among the first group of cities in China to have regulated off-street parking supply via MPRs. Following the example of Hong Kong, Shenzhen established the first “Urban Planning Standards and Guidelines of Shenzhen” (UPSG) [33] in 1990, in which the MPRs for different land-use types were stipulated. The MPRs were quite low at the outset; they were set to only 0.3–0.4 spaces per 100 m2 of floor area for general offices, and 0.7–0.8 for administrative and financial offices, in the first UPSG (Table 1). As car ownership skyrocketed, however, local authorities yielded to growing pressure for parking. In response to the growing demand, in 1997, the MPRs were increased to 0.4–0.6 spaces per 100 m2 of floor area for general offices, 0.9–1.2 for financial offices, and 2.5–3.0 for administrative offices. These relatively generous parking standards have supported auto-centric development in Shenzhen. Since the 2000s, the demand-oriented philosophy in parking and other transport planning has occasionally been questioned. Having learned from international experience, the Shenzhen government applied new MPRs in 2004, attempting to integrate the parking-transit relationships of non-residential developments by differentiating parking standards by transit accessibility and location. The MPRs were cut to 0.3–0.5 spaces per 100 m2 of floor area for general offices in central and transit-rich areas, and 0.3–1.0 in other areas. Facing severe parking issues and overwhelmed transport systems, Shenzhen officials have put more vigorous parking restrictions in place since the 2010s. In the most recent UPSG, issued in 2014, zone-specific MPRs were stipulated for nonresidential developments, in which parking provisions are constrained to 0.3–0.5 spaces per 100 m2 of floor area in Zone One, followed by 0.5–0.8 in Zone Two, and 0.8–1.0 in Zone Three. Although the parking standards in Shenzhen are still relatively generous compared with those in some international cities (e.g., Hong Kong, London, Tokyo, and New York) that are known for sustainable transport, the zone-specific and transit-sensitive MPRs are advantageous compared to other Chinese cities.
3.2. Data and Methodology
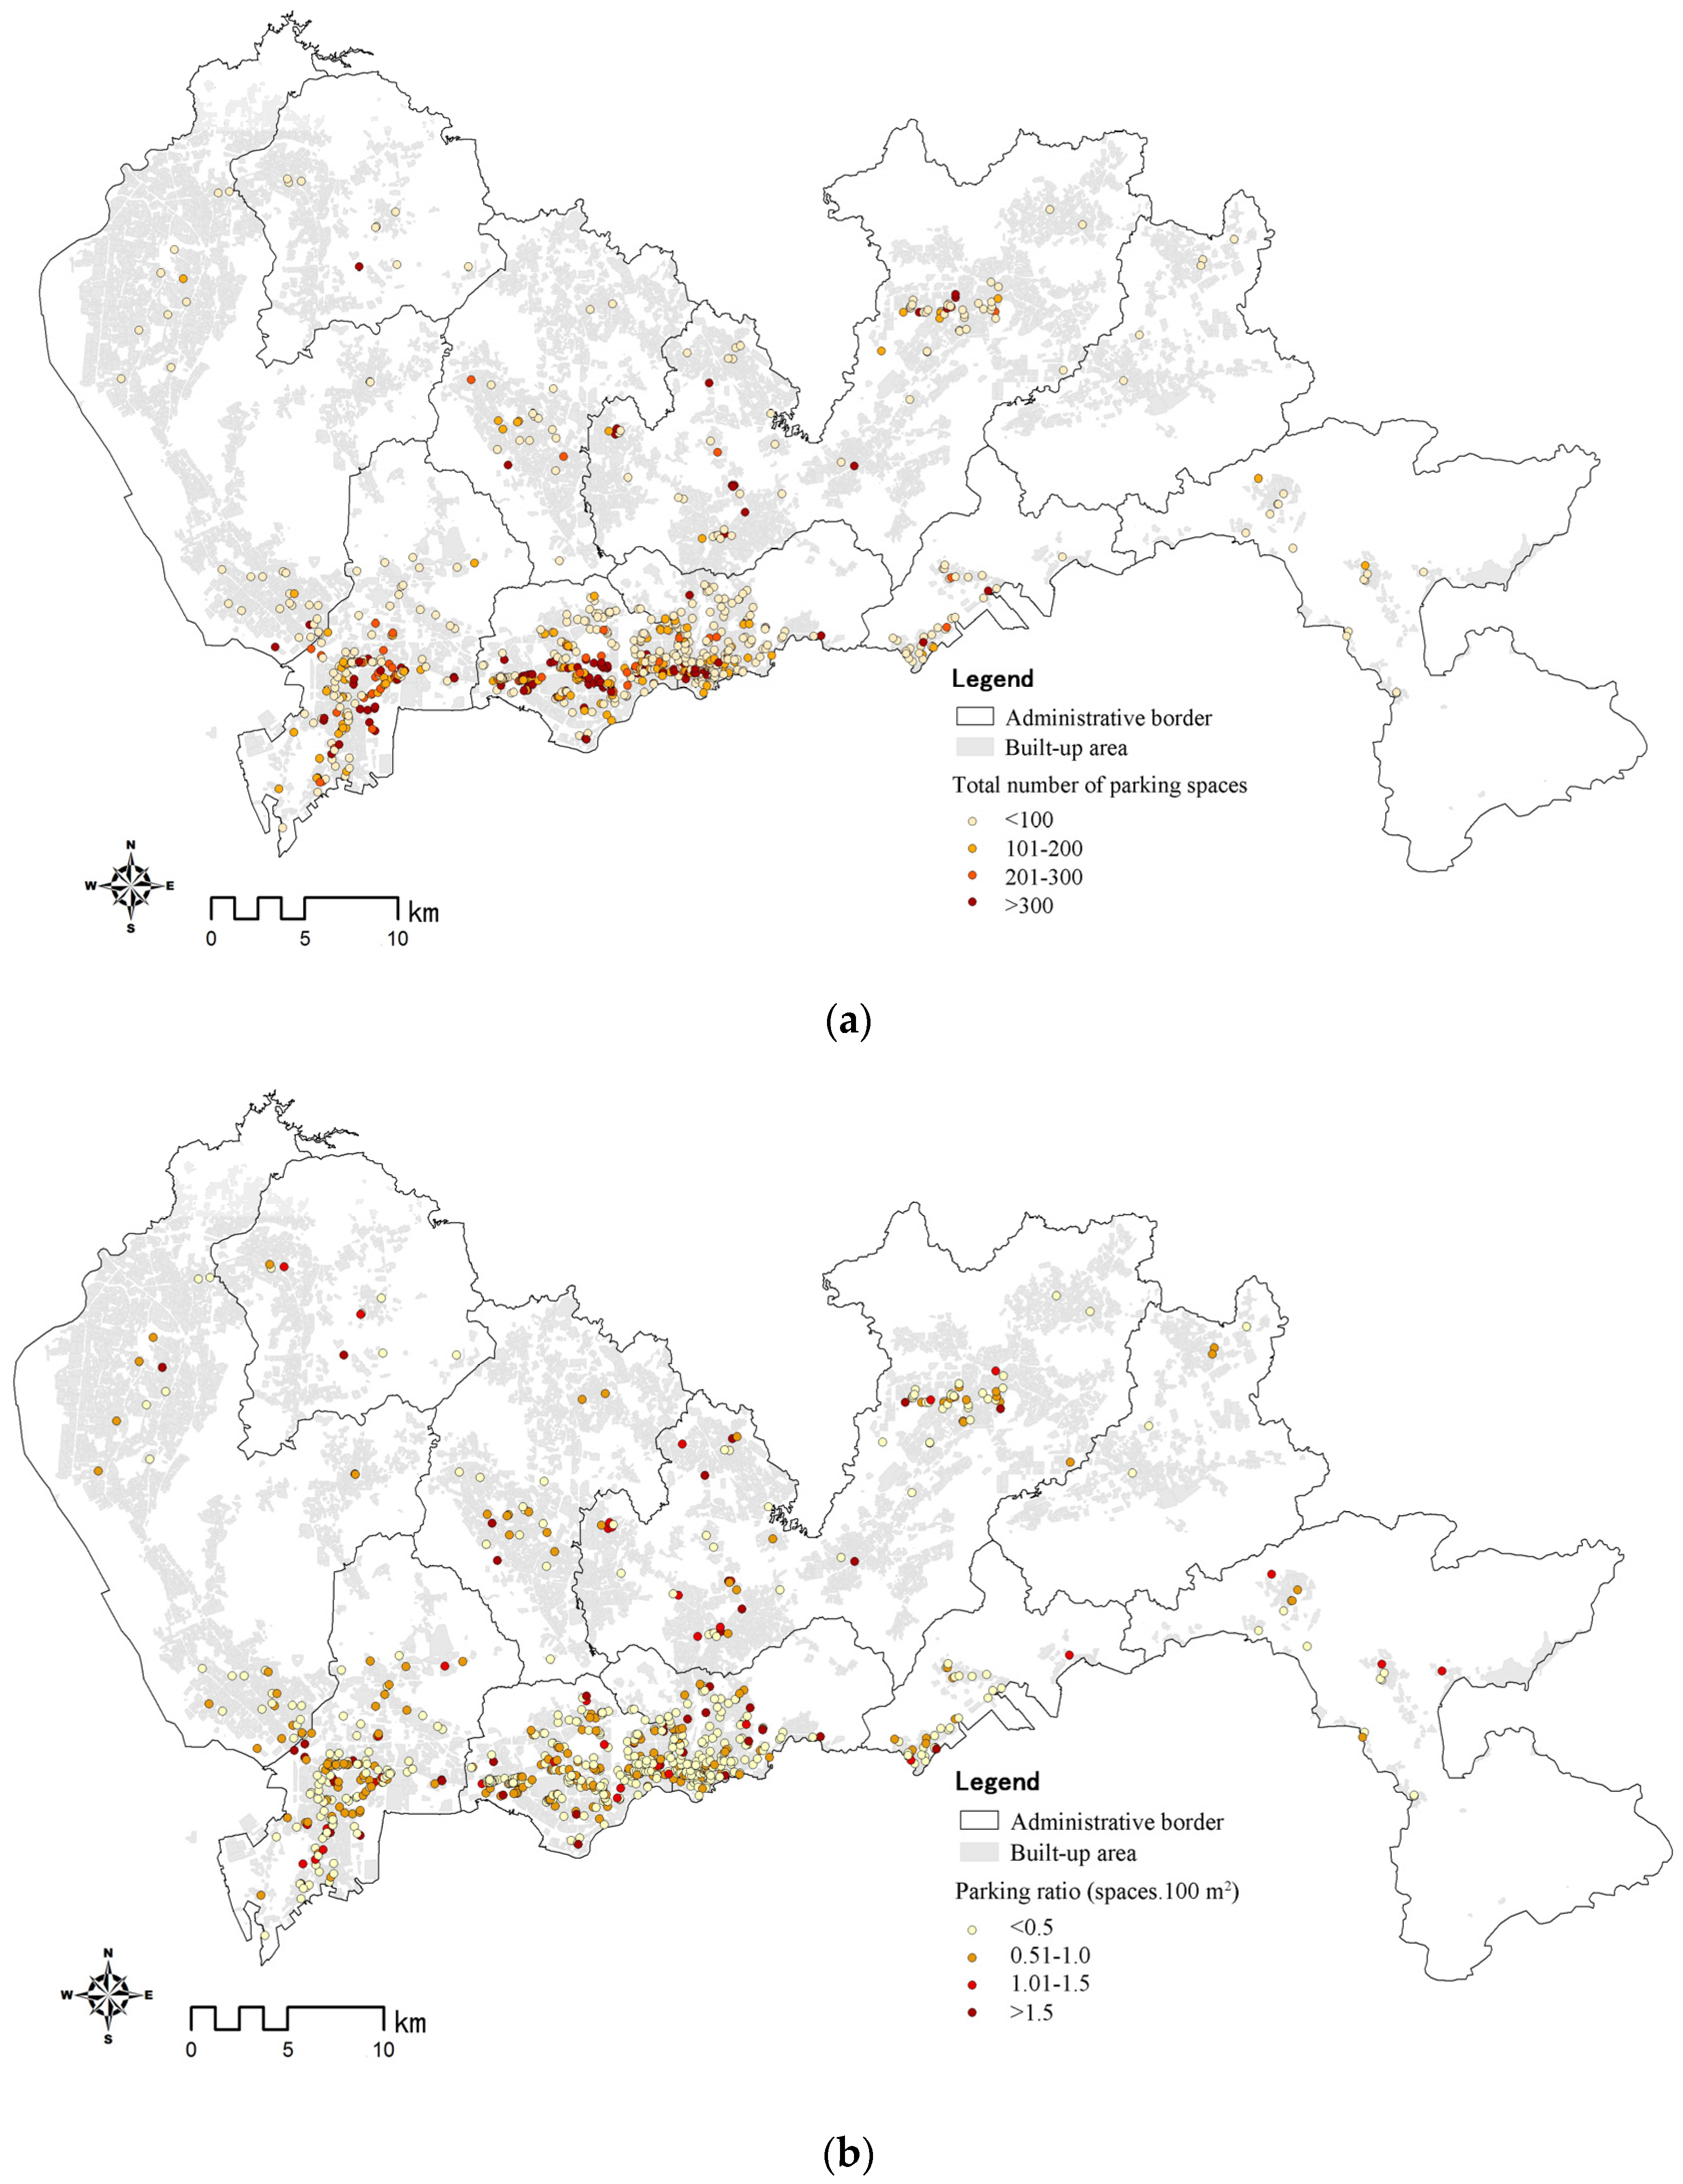
The analysis of this study is based on the most recent parking, building, and land-use datasets, all of which were updated by the Shenzhen city government in 2017. This study sub-selected the general office samples. In total, 829 general office developments were obtained (Figure 1). The parking dataset contains the number of parking spaces affiliated with each general office development. In relation to the building and land-use datasets, built environment, and location characteristics, including the floor area ratio (FAR), the lot size, distance to the city center, and transit accessibility were calculated. The building dataset also provides the operation periods of the developments. Job density at the level of the traffic analysis zone (TAZ) was drawn from the Shenzhen population survey.
To fulfill the research objective, both descriptive and modeling analyses are conducted. The descriptive analysis aims to identify the MPR’s effects on parking supply. To detect how changes in MPRs influence parking supply, the spectrum of required parking spaces for each development is calculated and compared with the actual number of parking spaces.
The modeling analysis employs both ordinary least square (OLS) and GWR modeling approaches to detect the factors that affect parking provision (Table 2). Both the absolute and relative parking provisions of each development, which refer to the total number of parking spaces and the parking ratio (the number of parking spaces divided by floor area), respectively, are used as dependent variables. Six independent variables are defined in the OLS models: FAR, lot size, transit accessibility, distance to the city center, operation period, and job density. The GWR models include the same explanatory variables but omit distance to the city center, since this variable is spatially related.
4. Effects of Minimum Parking Requirements (MPRs) on Parking Provisions
To conduct the analysis, the number of required parking spaces in each office building is calculated according to its floor area, operation period, transit accessibility, and location. Compared with the number of actual parking spaces, the three categories identified are less than, within the range of, and more than the requirements. Given that Shenzhen’s MPRs regulate the lowest bound of the parking supply, the buildings that provide parking either within or over the MPRs satisfy their parking requirements, whereas those that provide parking below the required level violate the parking regulations.
The descriptive analysis shows that the actual parking supply is not fully consistent with the MPRs. The effects of the MPRs on the actual parking supply have the following three features:
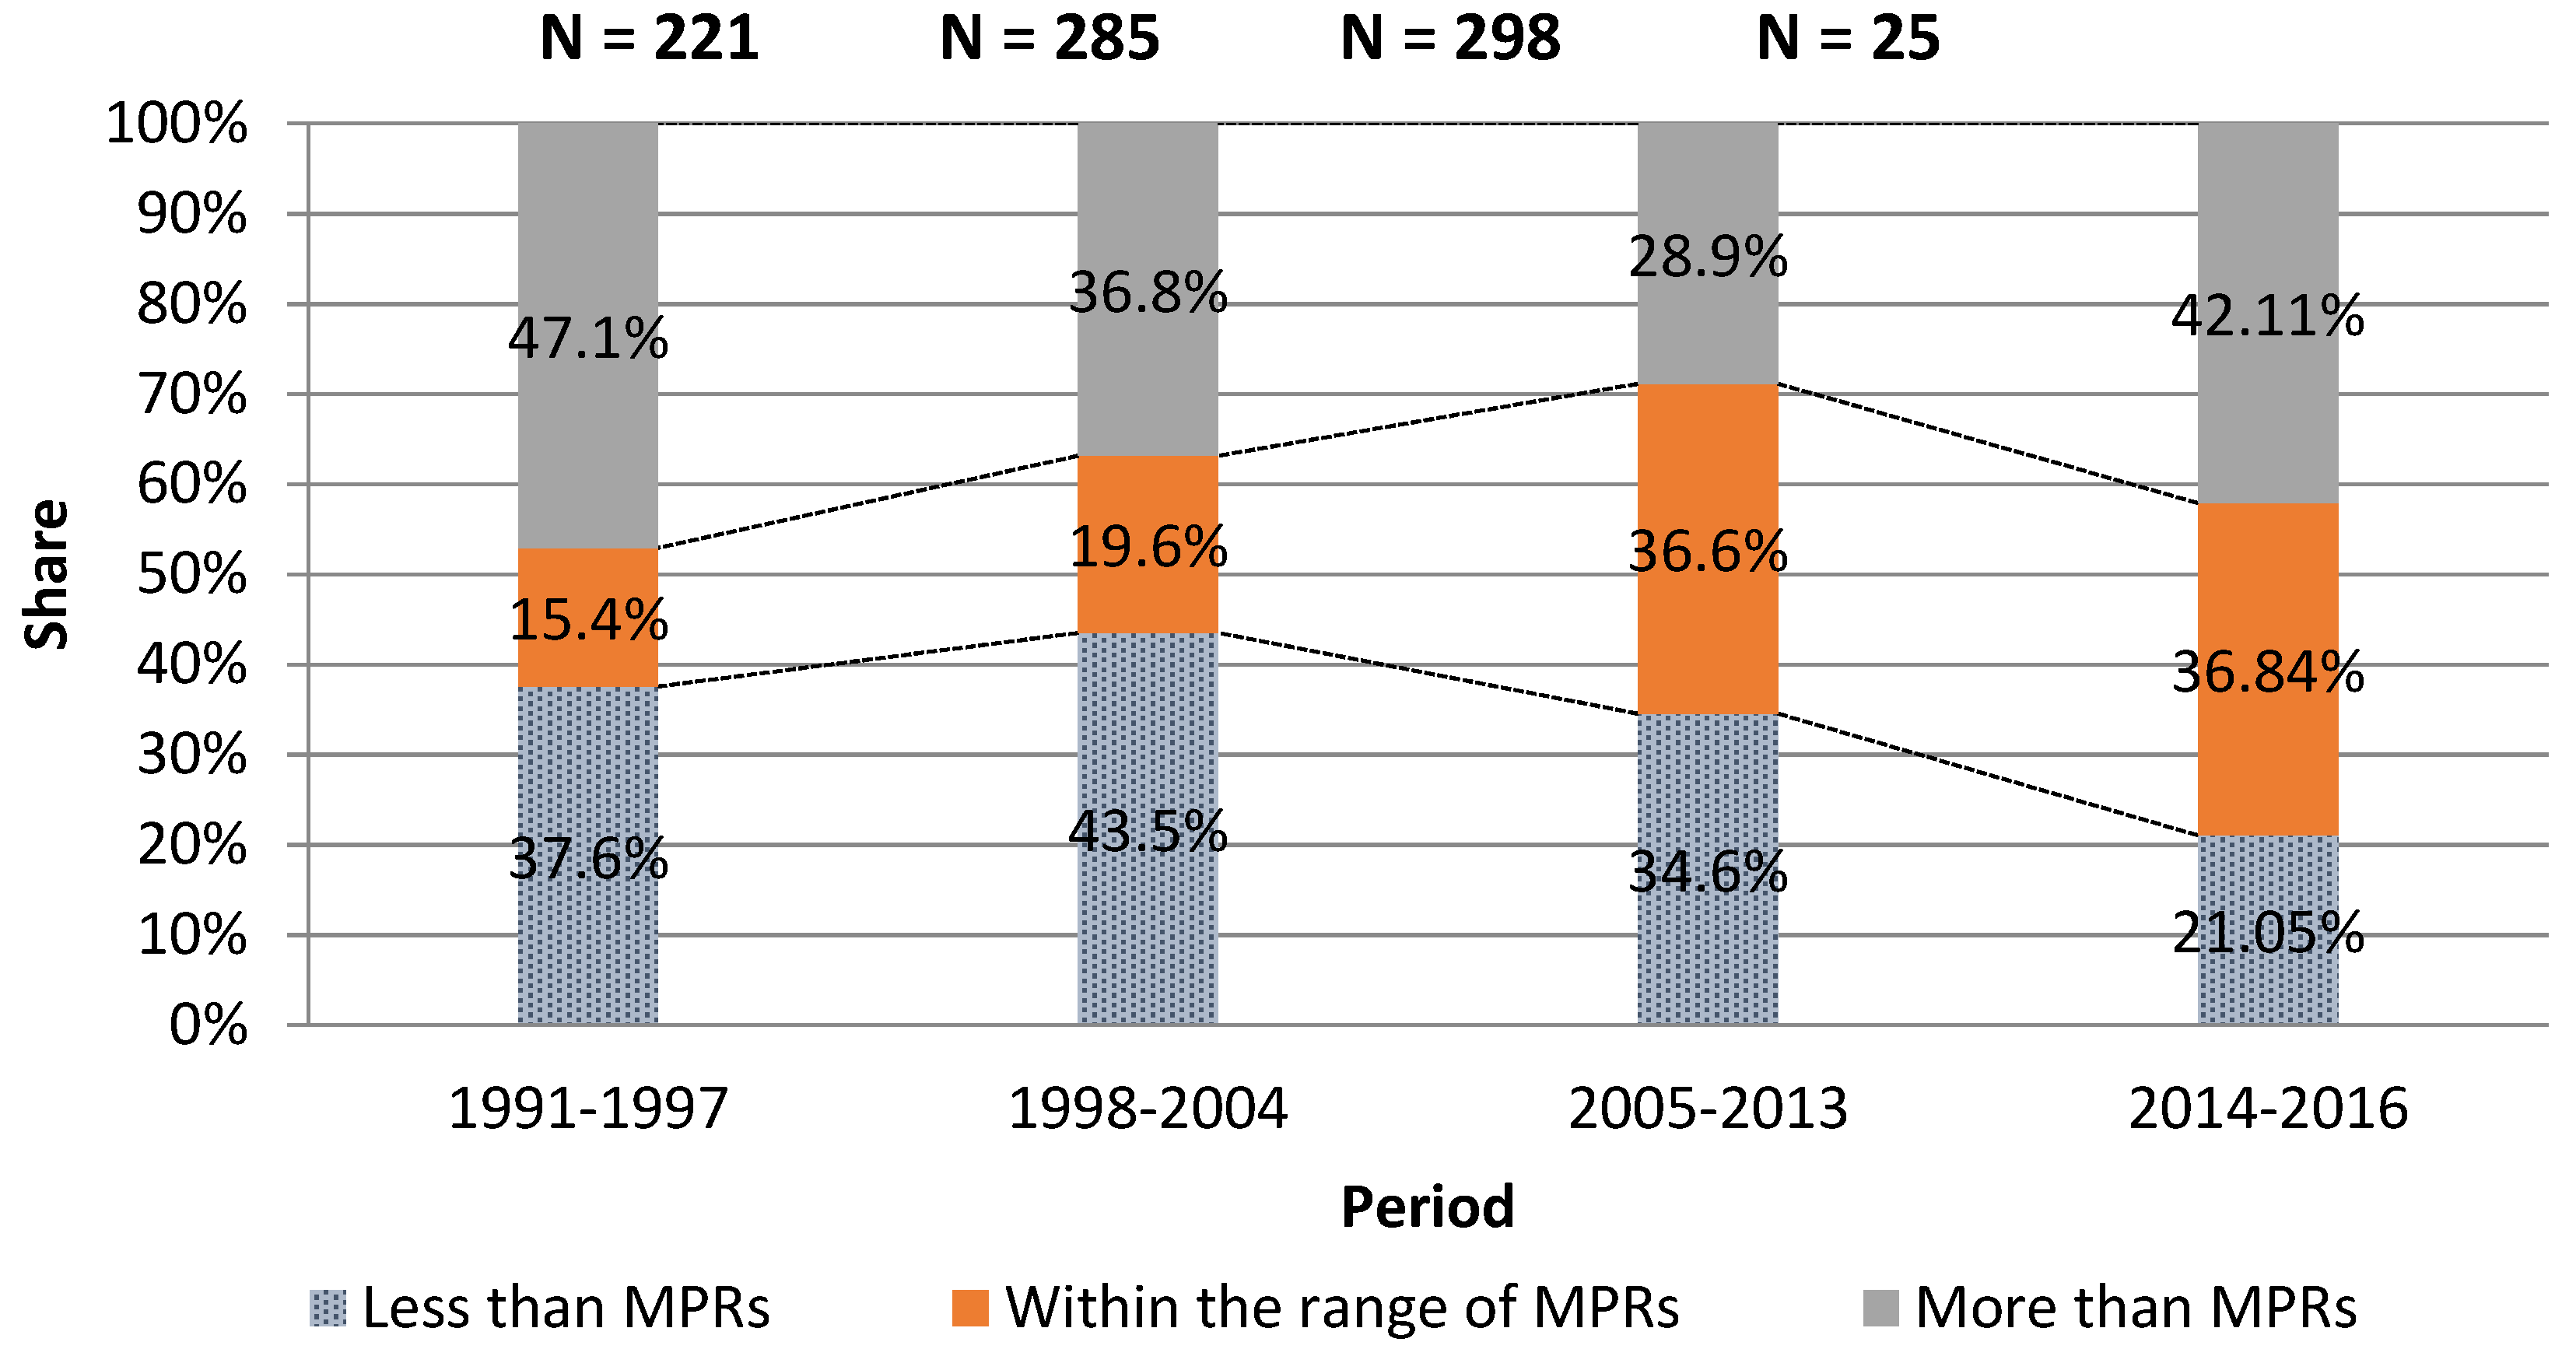
First, the proportion of samples violating the MPRs notably decreases. As mentioned above, the violating sample is defined as that with an actual parking supply less than the MPR (Figure 2). This proportion among office projects built after 2014 is a mere 21.05%, whereas it is as high as 37.6% among those built between 1991 and 1997. Given that the MPRs were adjusted to a broader spectrum, the proportion of samples with an actual parking supply within the MPRs gradually increased from 15.4% between 1991 and 1997 to 36.8% between 2014 and 2016. On the one hand, this better performance shows improved management. On the other hand, it may also show the willingness of developers to provide more parking. In the face of continuously tightening parking standards and an increasing demand for parking, nearly half (42.1%) of the new projects (after 2014) have more actual parking spaces than the MPRs.
Second, the effects of MPRs on parking provisions change with the development intensity. With the increase in the FAR, the samples with fewer parking provisions than MPRs increase, whereas those with more parking than MPRs notably decrease (Figure 3). As shown in Figure 3, in the case of 44.6% of developers, the number of parking spaces provided is more than the MPRs when the FAR is below 1.0, while this proportion is only 19.8% among projects with a FAR over 6. In contrast, more than half of developers violate the MPRs, with fewer parking spaces than required, once the FAR is over 2. When the FAR is below 1, only 29.7% of developers offered less parking than the MPRs. The cost concerns of property explain this phenomenon. When the FAR grows higher, the construction cost of parking spaces increases because less ground space can be used for parking, and parking spaces should be provided in the form of underground parking (the construction cost is approximately RMB 2000 per square meter for the first layer of underground parking. The cost increases by RMB 1500–2000 for each additional layer.).
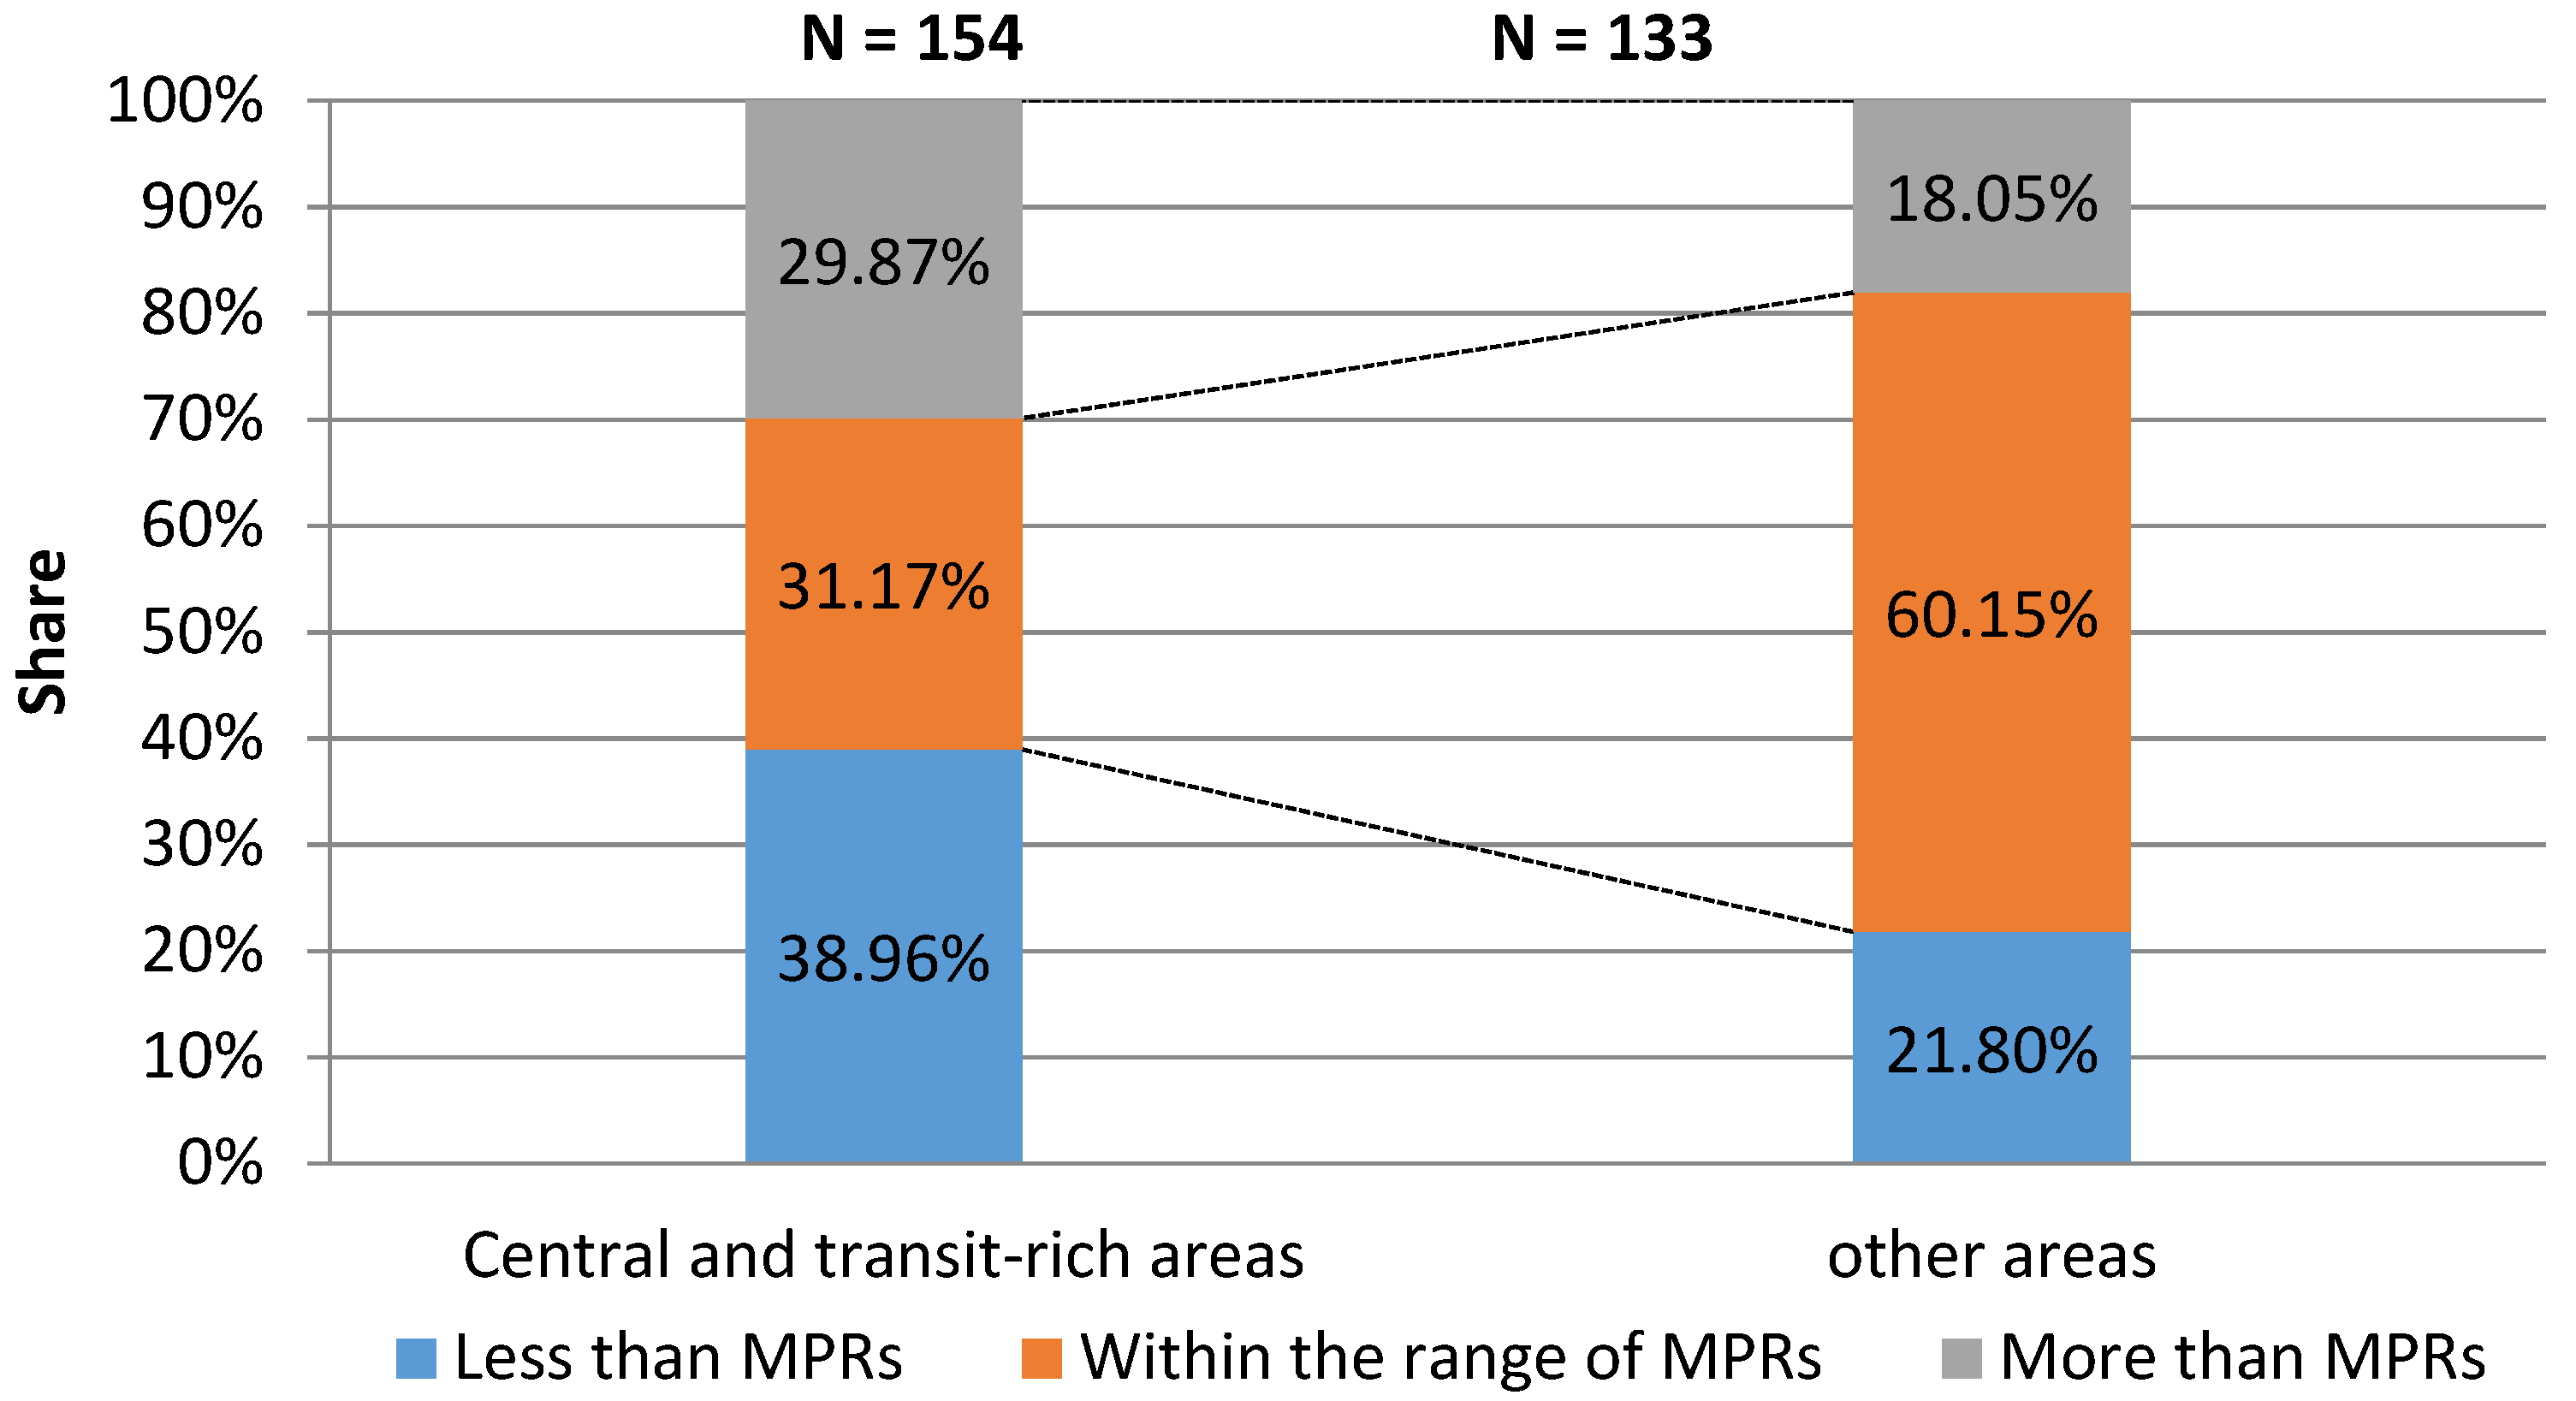
Third, the changes in developers’ willingness in regards to parking provision via transit accessibility are ambiguous. Between 2004 and 2013, general offices in central and transit-rich areas had lower MPRs of 0.3–0.5 space/100 m2, compared to those in other areas where the MPRs were 0.3–1.0 space/100 m2. This analysis extracts a subset that contains 287 general offices constructed during the application of the third UPSG. Only 31.17% of office projects in central and transit-rich areas provided parking provisions within the range of the MPRs, while this proportion is more than 60% for projects located in other areas (Figure 4). This result is largely due to the smaller spectrum of MPRs applied in the former. Given the lower MPRs in central and transit-rich areas, 29.87% of developers opt to provide more parking than the requirements. This proportion is only 18.05% in other areas, where the upper limit of MPRs is set to 1.0 space/100 m2. Inexplicably, however, there is a relatively large percentage (38.96%) of developers who offer less parking than the MPRs in central and transit-rich areas. One possible explanation is that the denser developments in those areas depress the willingness of developers to prioritize parking provisions because of cost concerns.
5. Modeling Analysis
5.1. Ordinary Least Square (OLS) Results
Table 3 shows a summary of the OLS results. The OLS results indicate some general tendencies regarding parking supply and its relationships with built environments. First, both the absolute and relative volume of the parking supply increased significantly over time. Second, the parking quantity increased, while the onsite parking ratio decreased with the increase in the FAR. This outcome is in accordance with the results of the descriptive analysis above. Third, lot size is positively correlated with absolute parking provisions. We can infer that developers will provide adequate parking spaces if the lot areas are large. This result supports current practices in which fine-grained street networks are encouraged for sustainable transportation. Fourth, the parking quantity is significantly and negatively correlated with transit accessibility and distance to the city center.
The OLS diagnostics show that the adjusted R2 is 0.208 and 0.047 in models 1 and 2, respectively. The adjusted R2 in Model 1 is acceptable, while the adjusted R2 is only 4.7% in Model 2. Four statistics (joint F-statistic, joint Wald statistic, Koenker statistic, and Jarque–Bera statistic) in both models are significant (p = 0), indicating that the OLS models are biased. Moran’s I test shows that the residuals generated from Model 1 are not significantly random (p = 0), which indicates that the residuals are spatially correlated. Based on these diagnostics, the OLS approach is not the best approach for analyzing the relationships between parking provisions and the built environment in this study. GWR models are thus utilized to solve the issue of spatial heterogeneity.
5.2. Geographically Weighted Regression Results
The GWR approach is a spatial model that extends the global OLS model with spatially varying parameters. It estimates a local coefficient that is specific to location i for each independent variable [34]:
where is the dependent variable for location i, are independent variables, and is the error term. is the local coefficient for the ith location and the jth independent variable, based on a sample of observations.
GWR 4.0 software was used in this study. Given that the GWR model estimates coefficients for each observed point to a certain number of neighboring points, the outcomes are significantly influenced by the chosen kernel function and bandwidth. There are two types of kernel functions in GWR: fixed or adaptive. We selected the adaptive bi-square kernel type because doing so is recommended when data points are sparsely distributed [34,35], as in our case here. The golden section search method in GWR 4.0 is used to efficiently identify the optimal bandwidth size. We used Akaike Information Criterion (AICc) as a criterion to choose the best model. The optimal bandwidth size is 217 in Model 3, and 54 in Model 4.
Table 4 shows the results of the GWR models, diagnostics, and global Moran’s I test. The adjusted R2 values show that the variation in the independent variables could explain 59.0% of the change in absolute parking provision, and 24.7% of the change in relative parking provision, each of which is much higher (20.2% and 4.0%, respectively) than in the OLS analysis. The GWR models also show better performance than the OLS models in terms of AICc minimization (10,975 vs. 11,276 for absolute provision, and 3149 vs. 3307 for relative provision; see Table 3 and Table 5). In addition, Moran’s I test indicates that the GWR models managed the issue of spatial autocorrelation that occurred in the previous OLS analysis.
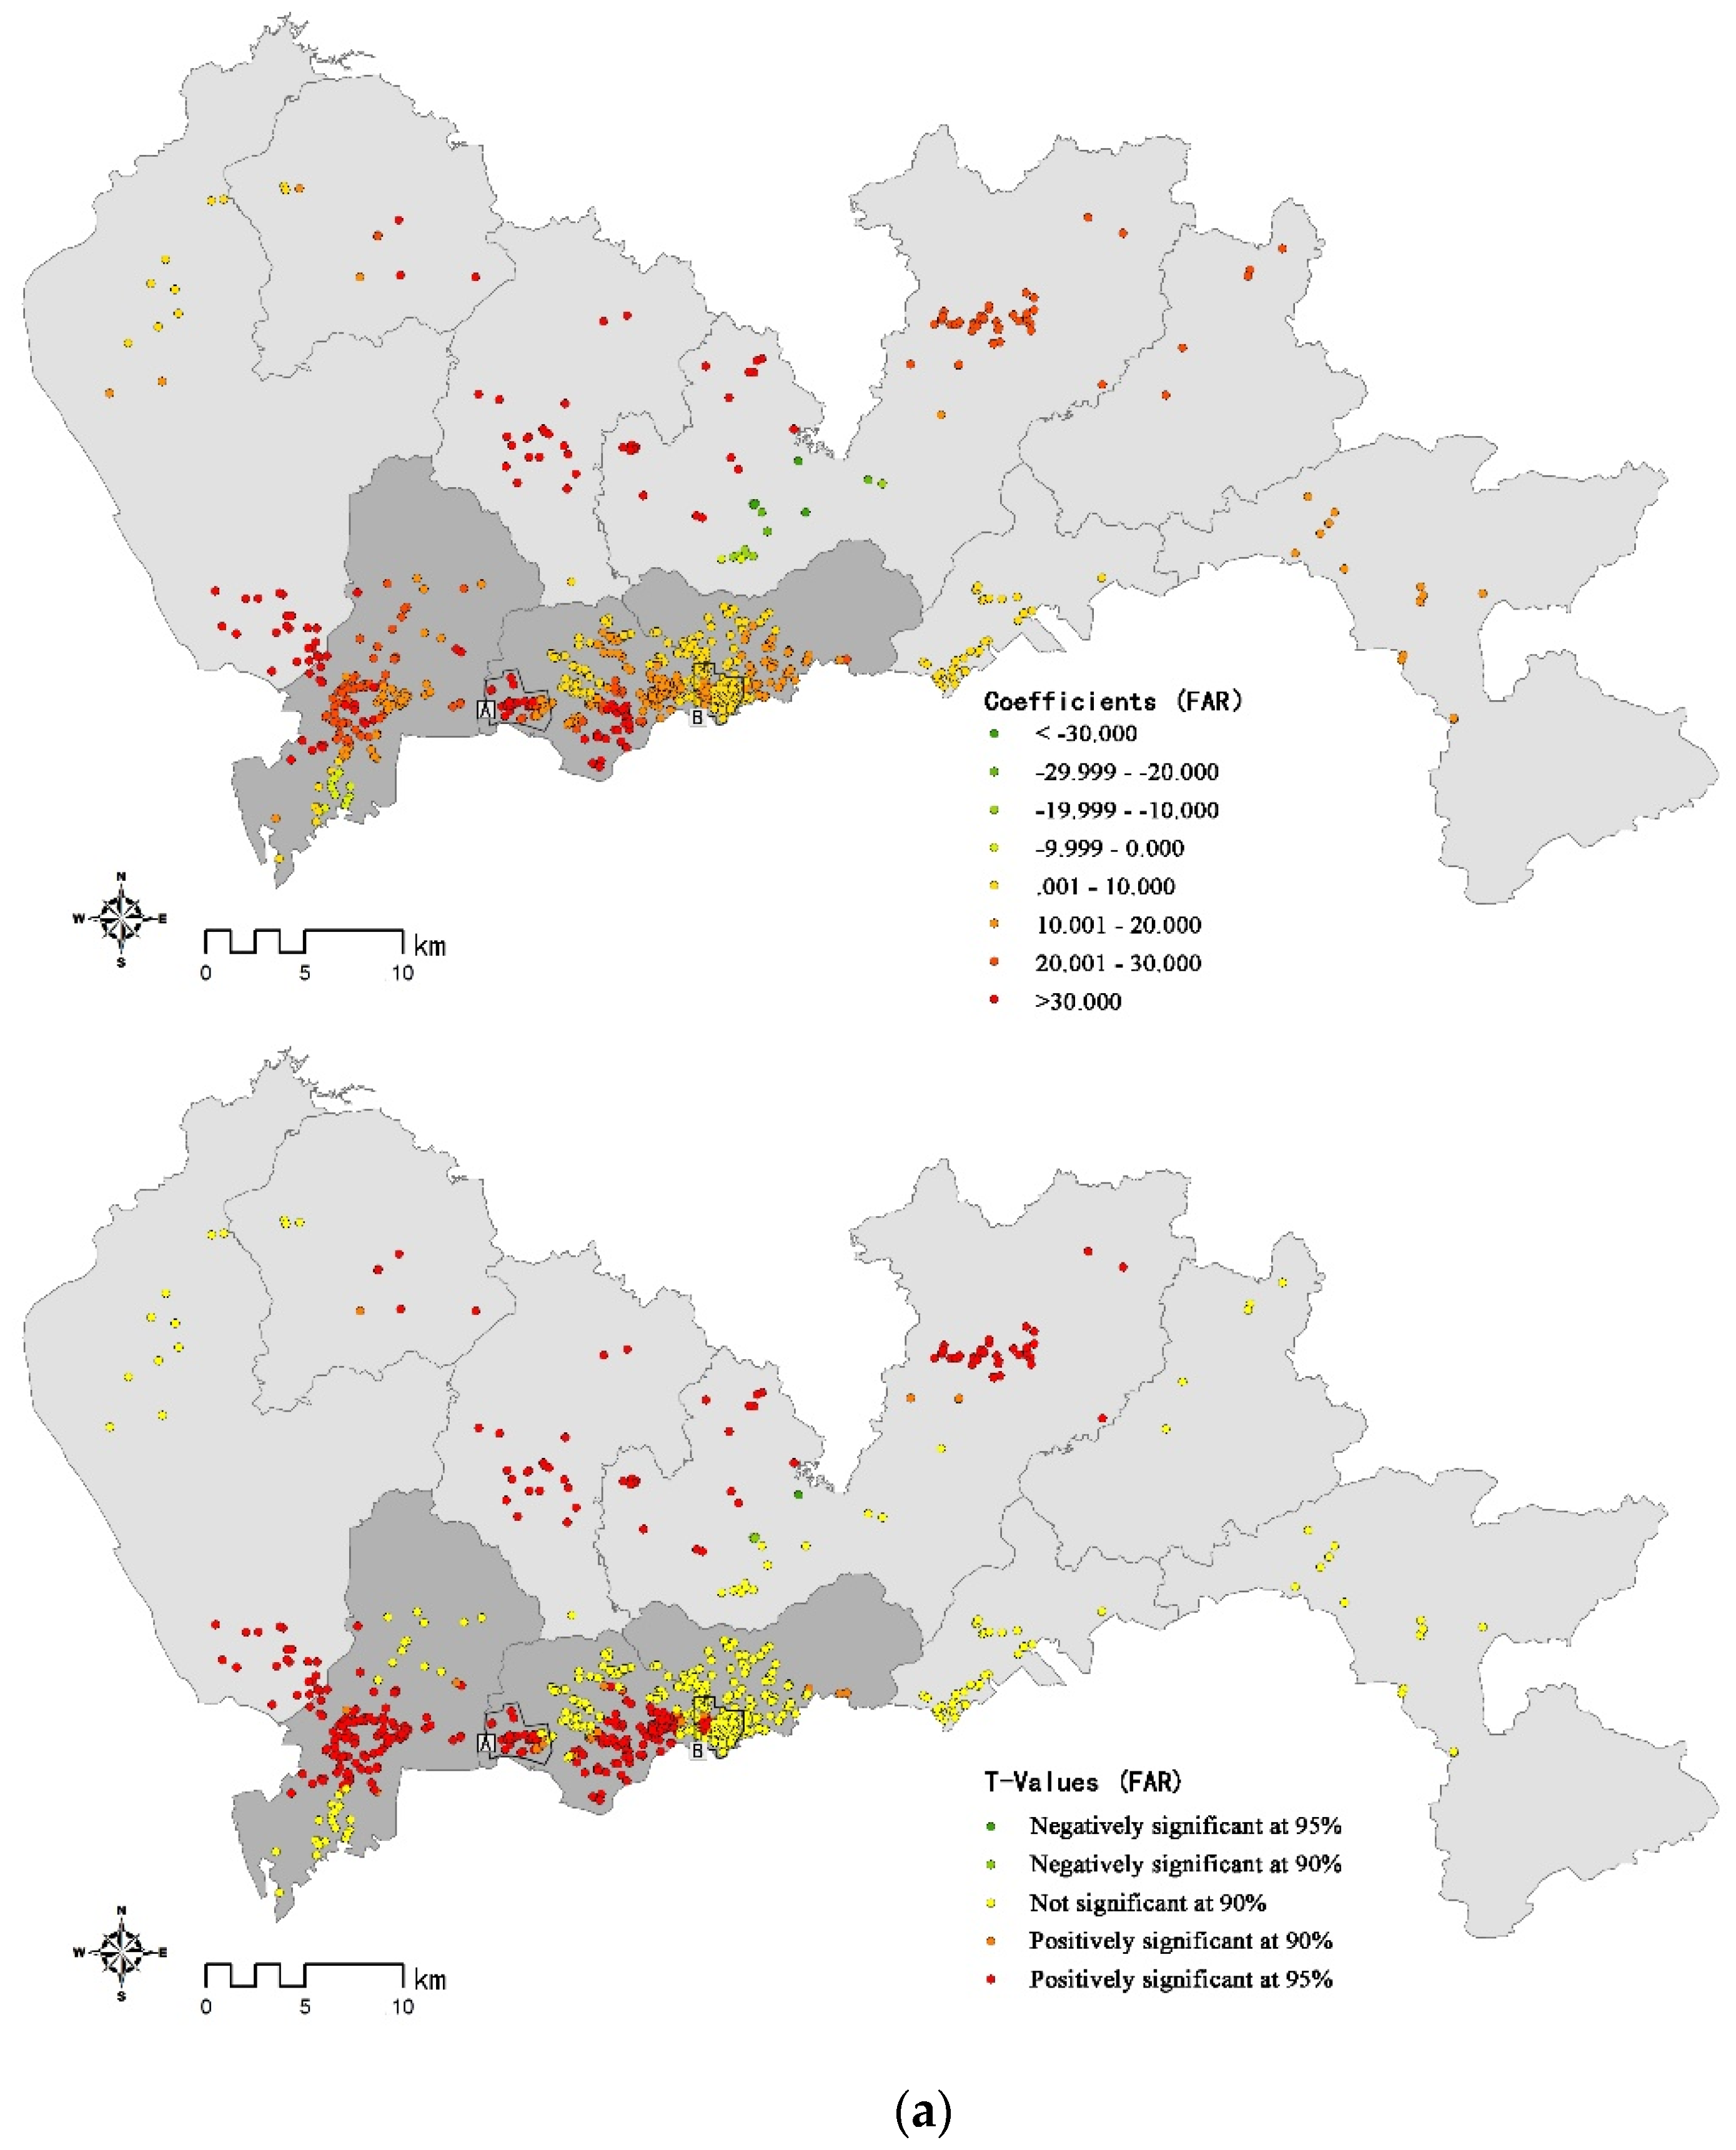
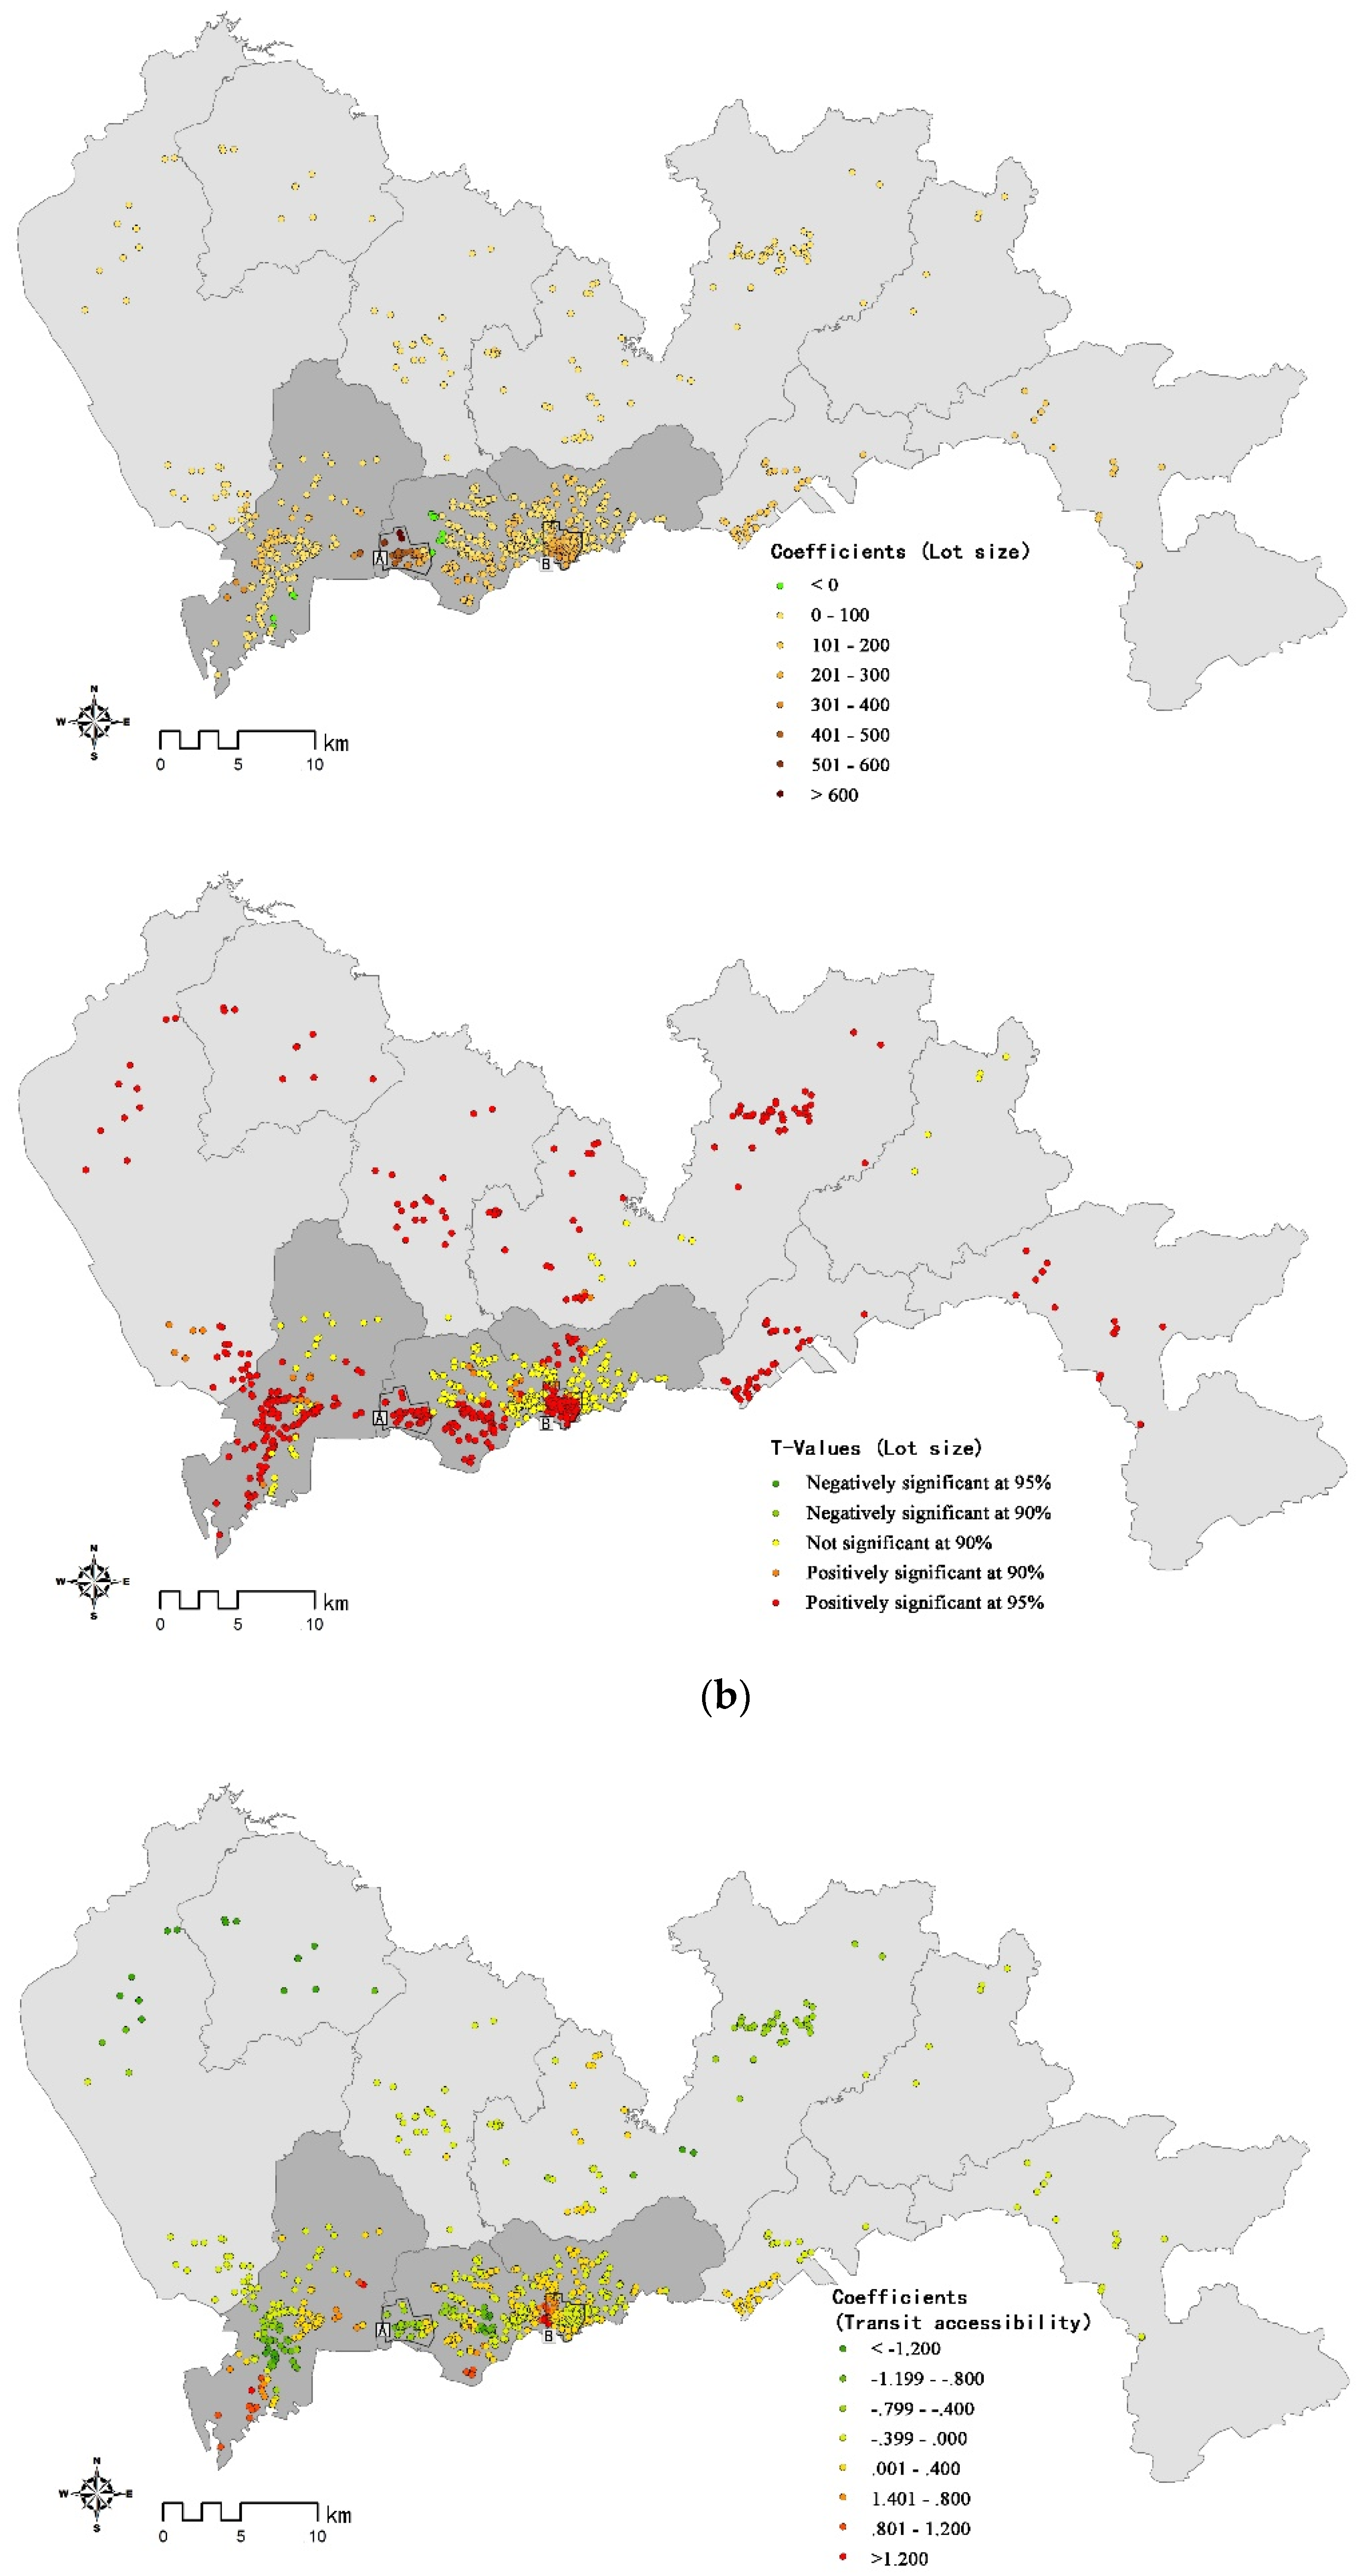
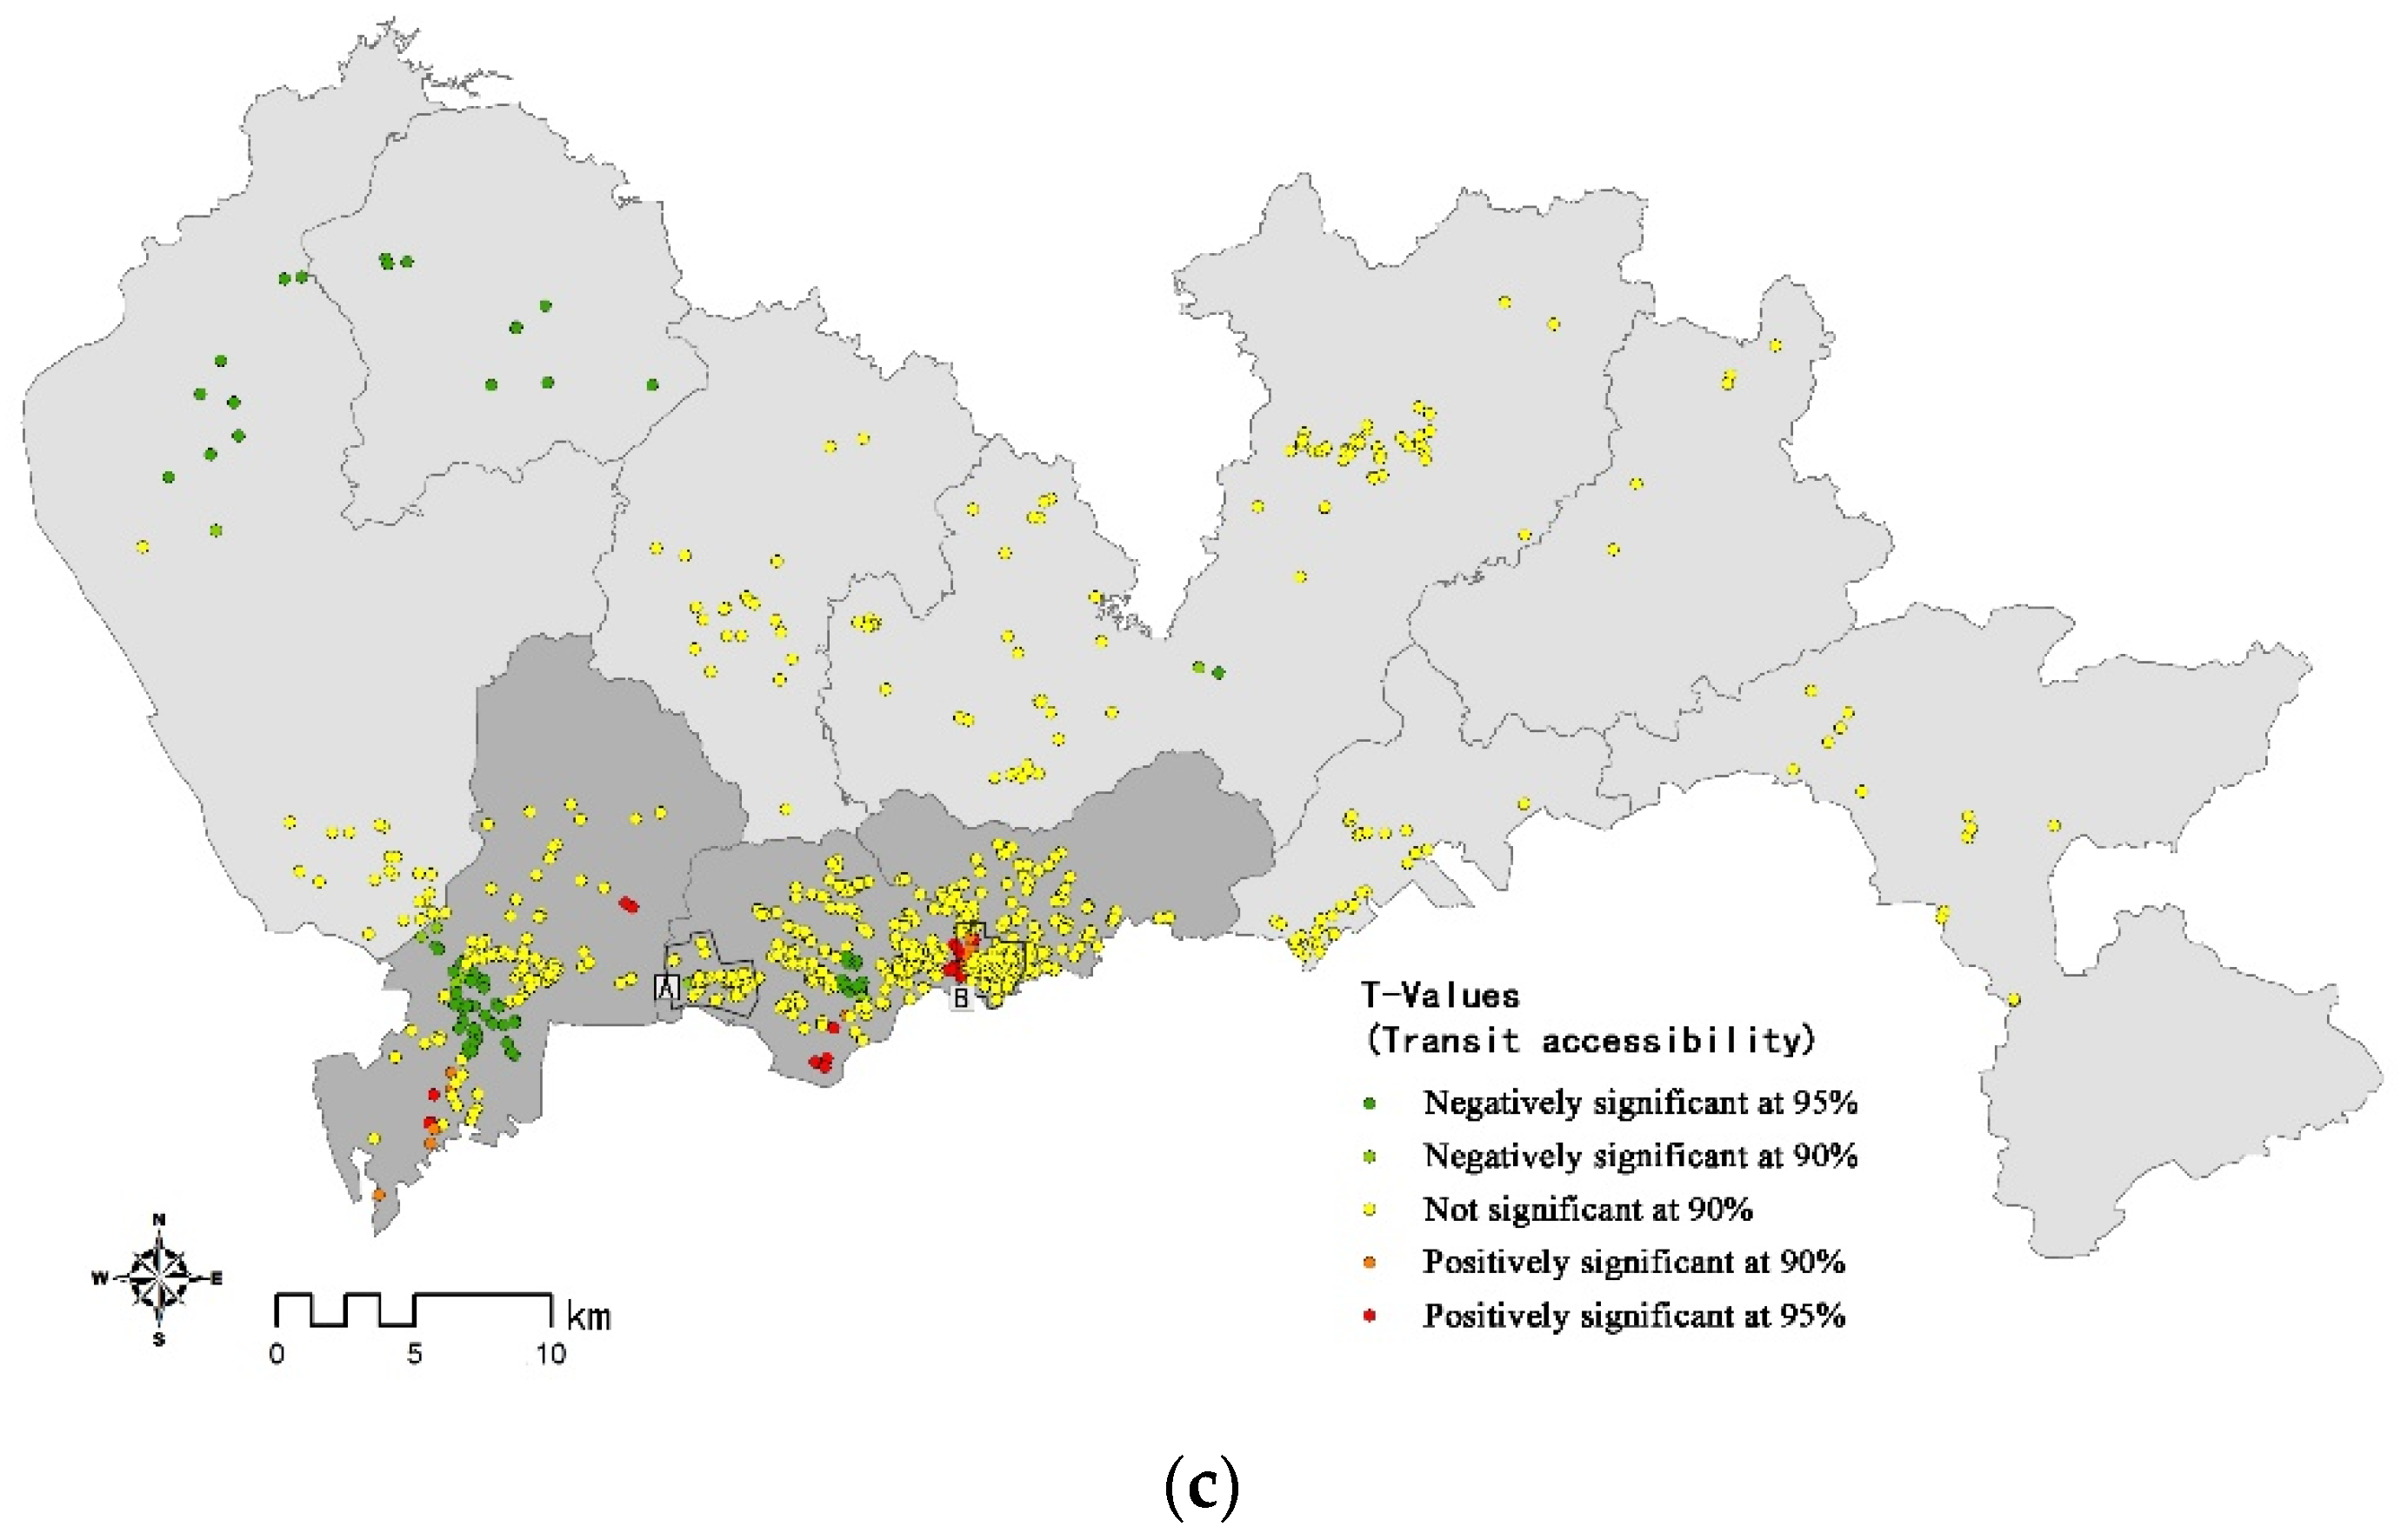
As the t-value statistics and maps in Table 4 and Figure 5 show, the significance level of each independent variable varies over space. In certain areas, an independent variable may have significant relationships with parking provision; however, the relationships in other areas are not significant. To better understand the spatial non-stationarity of the relationships, Table 4 summarizes the percentage of coefficients that are negatively or positively significant at the 90% and 95% level, respectively, and the percentage of coefficients that are not significant. The effect of important explanatory variables on parking provision can be spatially investigated, as shown in Figure 5 and Figure 6.
The two built environment variables, the FAR and lot size, have stronger explanatory power for parking provision. The FAR is significantly and positively related to absolute parking provision in most office samples (approximately 60%). This outcome is consistent with our OLS model, and is in line with the MPRs implemented in Shenzhen. The MPRs stipulate the minimum number of parking spaces per 100 m2 of floor area for new office developments. With the increase in development intensity, the number of parking spaces provided by developers must increase as well. The significant positive correlations that existed between the FAR and the number of parking spaces were primarily distributed in the core area of the Futian and Nanshan districts, and in most suburban areas. As shown in Figure 6, the estimated coefficients for suburban developments were generally higher than those for developments in the central area. This result indicates that a one-unit increase in the FAR leads to a greater increase in parking spaces in suburban areas than in central areas. We may infer that developers have a strong provisional willingness to provide parking spaces when the projects are located in suburban areas because the land cost is relatively low. The relationships between the FAR and the number of parking spaces are not significant in the core area of Luohu district, and parts of the Nanshan and Futian districts. We speculate that the reason for this is that the construction of these areas occurred earlier (prior to 2000), and that the development intensity was generally low and relatively homogeneous.
Similar to the FAR, lot size also has relatively consistent coefficients with absolute parking provision. In most of our study area, a larger lot size was associated with more parking spaces. This result is in line with the fact that developers are more likely to provide more parking spaces in large block developments. As shown in Figure 6, the samples with coefficients of 0–200 accounted for the vast majority, and were distributed in both the central and suburban areas. That is, in most areas of Shenzhen, a one-hectare increase in the site area of the office development caused an increase of 0–200 parking spaces. The spatially varying effects of lot size on absolute parking provision between central and suburban areas are not obvious. However, as marked in Figure 5, two typical areas (Guomao and Chegongmiao central business district, CBD), in which lot size has a significantly higher impact on absolute parking provision and the coefficients are as high as 400–700, can be identified. This result suggests that a one-hectare increase in the site area leads to a two or threefold increase in parking provision in these two areas, compared with other areas. We speculate that developers have a strong provisional willingness to provide parking due to market demand. Two typical CBDs have higher parking demands due to the concentration of office and business jobs.
Transit accessibility has no significant effects on the absolute parking provision in most areas (approximately 80%). A total of 20% of the significant correlations were primarily distributed in the core area of the Futian, Luohu and Nanshan districts. However, the direction and the strength of the effects vary dramatically over space. Significant negative correlations for transit accessibility and absolute parking provision are found for the Nanshan and Futian districts, whereas significant positive correlations are found primarily for Luohu district. This outcome implies positive impacts have occurred from parking regulation. The Shenzhen government has been lowering the MPRs in central and transit-rich areas since 2004. In contrast to the earlier development of Luohu district, most parts of the Futian and Nanshan districts were constructed after the implementation of this policy. Given the small percentage (less than 15%) of significant negative correlations between transit accessibility and absolute parking provision, parking-transit relationships warrant continued attention and policy support.
The percentage of significant coefficients for the operation period (16.28%) is relatively low in the GWR model, even though this variable has a significant effect on the absolute parking provision in the OLS model. One possible explanation for this counterintuitive result is the spatial homogenization of the explanatory variable. Since the office buildings in a certain area were often developed during the same period, a global analysis is superior to a local regression model in interpreting the overall relationships between the operation period and parking provision.
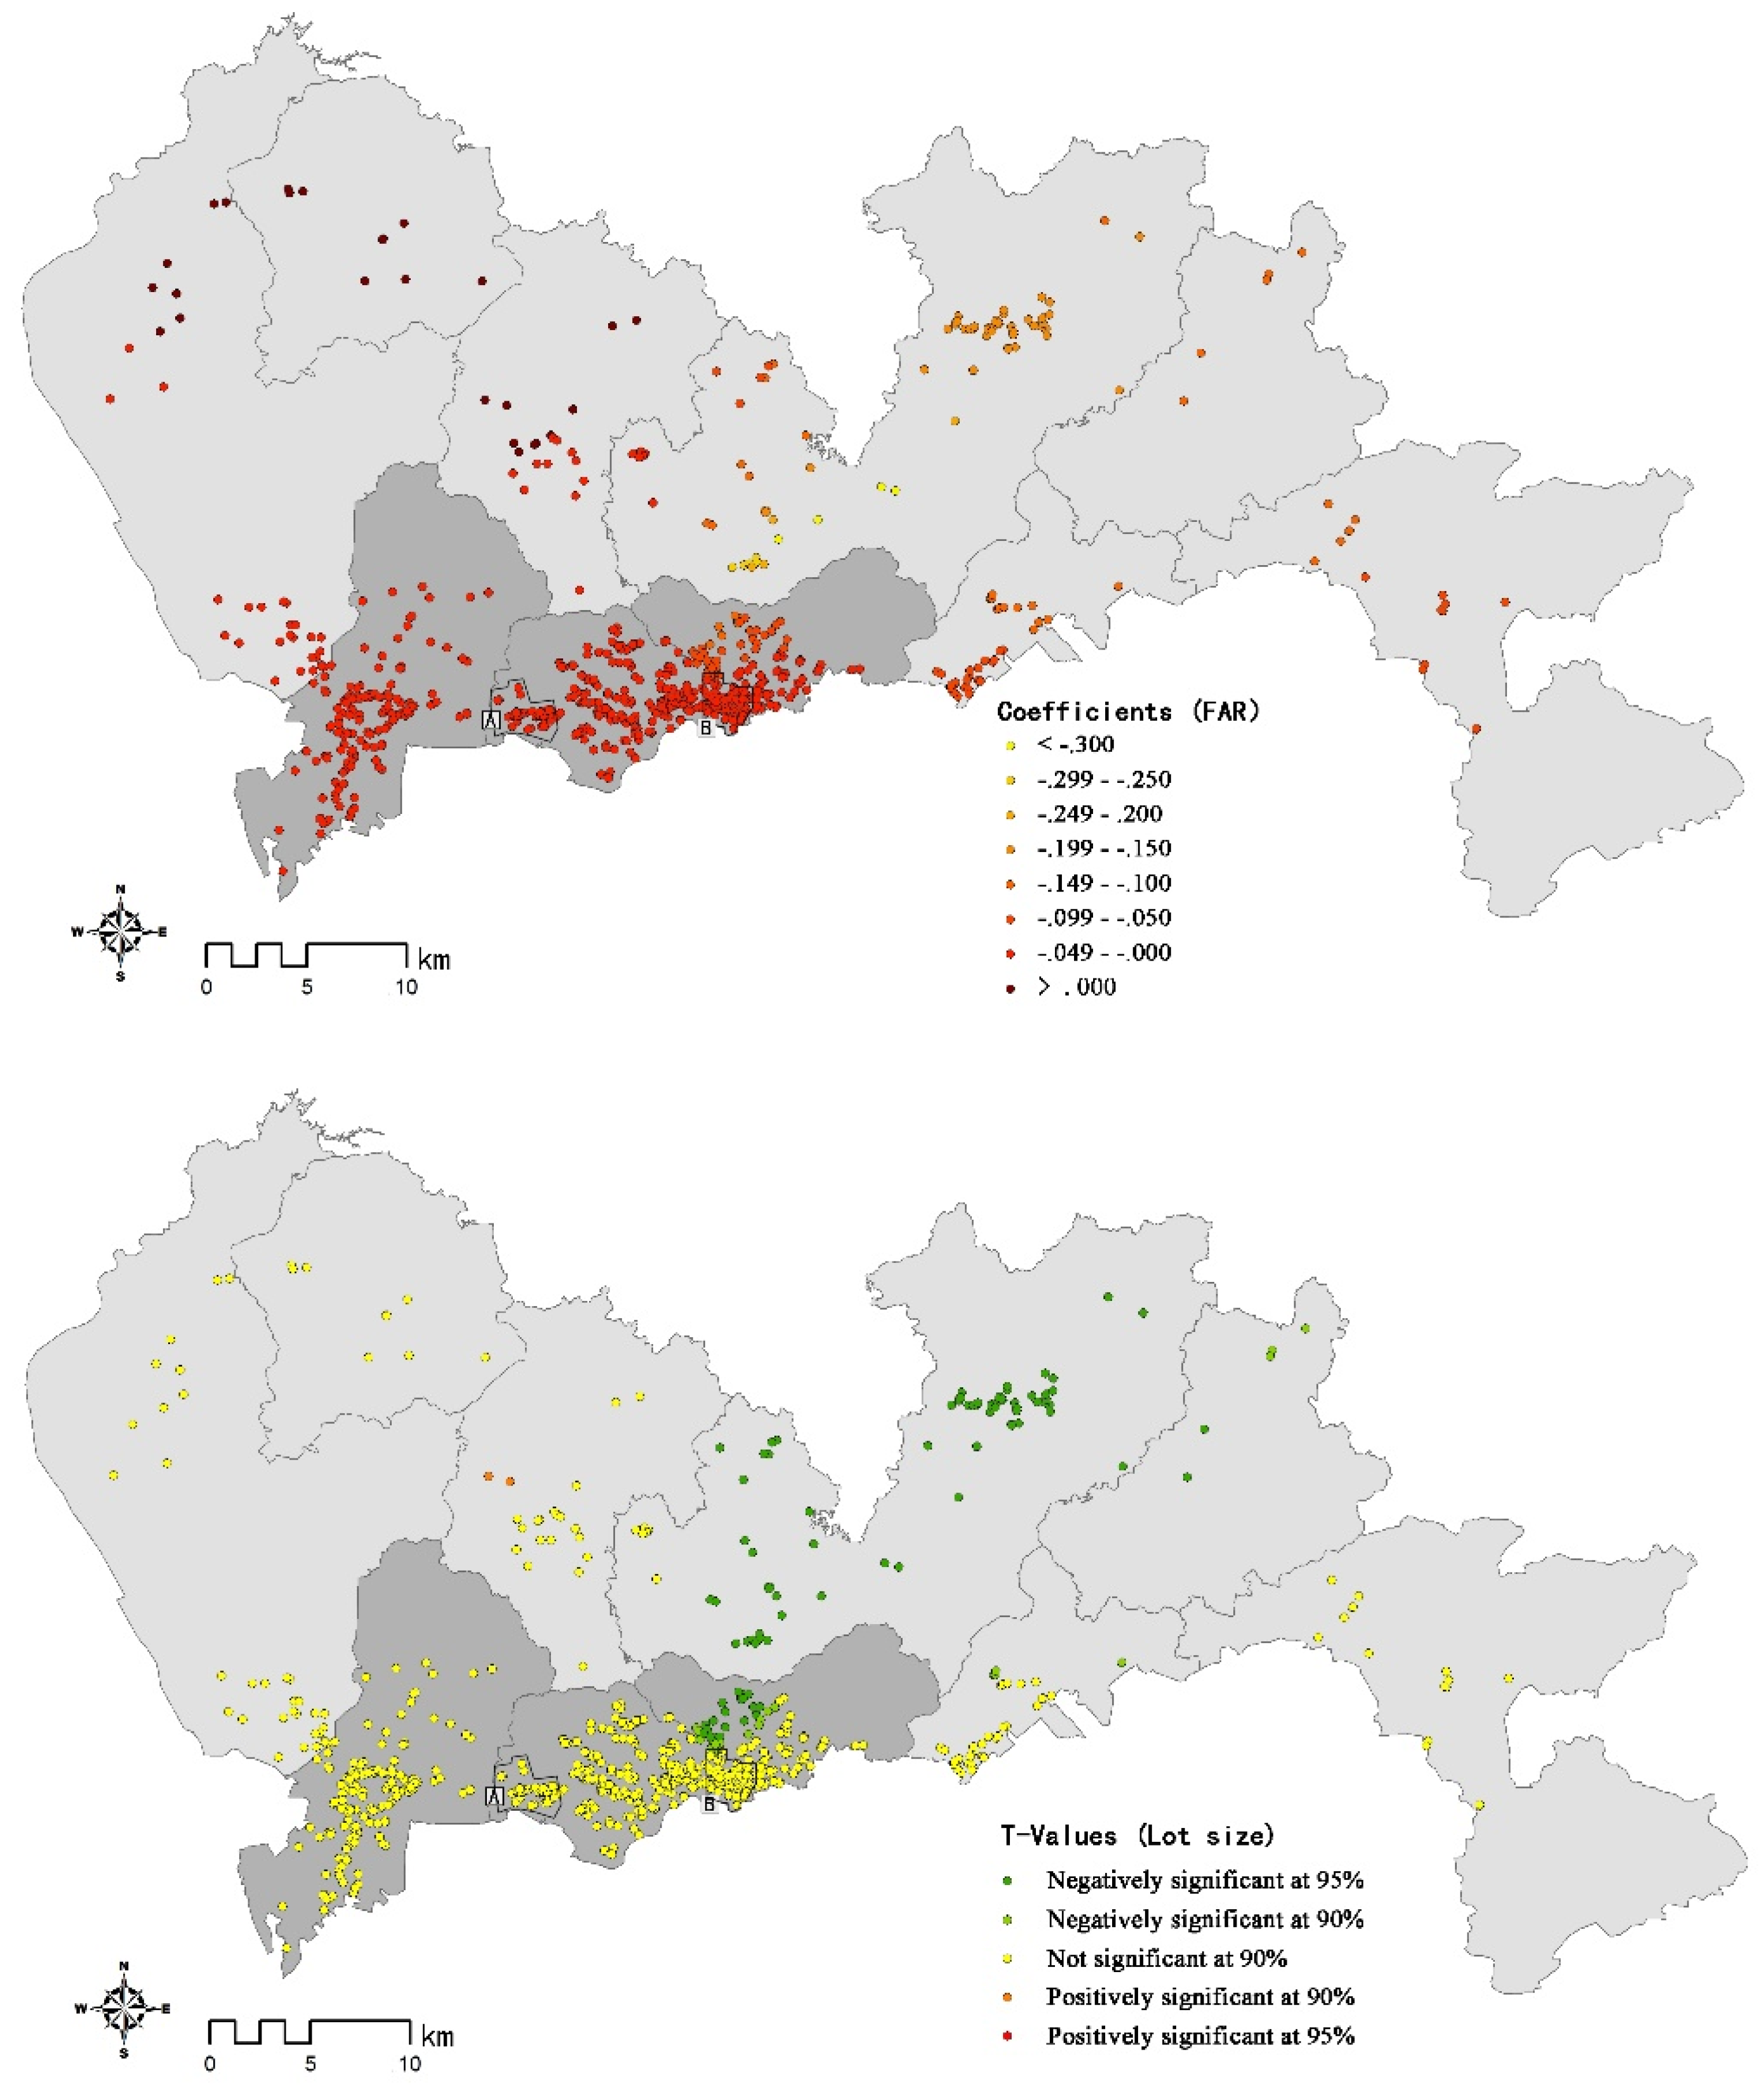
The GWR model with relative parking provision as the dependent variable performed much better than the OLS model. The adjusted R2 increased to 24.7% in the GWR model, compared to 4.0% in the OLS model. The GWR results indicate that there were significant negative correlations between the FAR and relative parking provision, primarily in Longgang district, where several industrial parks and business office buildings have been newly developed in recent years. Moreover, the absolute values of the coefficient of the FAR in Longgang district are much higher than those in the city proper. This outcome reconfirmed that developers will balance the parking provision in relation to its market demand. The parking supply–demand relationships may vary over space. The proportion of employees who drive to work is generally lower in suburban areas than in the city proper, since the former have a lower rate of car ownership. Hence, with the increase in the FAR, relative parking provision decreases more in suburban areas than in central areas.
In addition to the FAR, the GWR model did not find any other explanatory variables that have acceptable local significant correlations with relative parking provision. The percentage of significant coefficients for the other four explanatory variables are unacceptable (lower than 20%). These results are consistent with those in the OLS model. The coefficients and t-value maps are not shown in this paper if the percentage of significant correlations is lower than 20%.
6. Discussion and Conclusions
This study compares the actual and required number of parking spaces in office buildings to examine the effects of MPRs on parking provision. To better understand the determinants of parking supply, this research then applies OLS and GWR models to identify the potential influencing factors in regards to absolute and relative parking provision, with a total of 829 office samples in Shenzhen, China. In terms of the modeling diagnostics and Moran’s I test analysis, the GWR approach performs better than the OLS approach, suggesting the superiority of local regression in alleviating the problems of spatial autocorrelation. The modeling results demonstrate that the relationships between parking provision and the built environment variables, primarily the FAR, lot size, and transit accessibility, vary significantly over space. The spatially varying effects from the non-built environment variables, such as the operation period and job density, on parking provision are weak.
The varied local connections between parking provision and the built environment variables are interpretable; most of them are in line with the descriptive analysis in Section 4, and further confirmed our hypotheses on developers’ provisional willingness to provide parking.
First, in line with previous studies [11,30], parking supply is always positively correlated with the FAR. However, this study further found that the strength of the relationships between the FAR and parking provision differs across space. With the increase in the FAR, developers have a greater willingness to provide more parking spaces in suburban areas than in the city proper, which is indicated by the larger coefficients in the former. The difference in land cost helps explain this result.
Second, the OLS models found that the total number of parking spaces increases, whereas the parking ratio decreases, with a rise in the FAR. The global negative correlations between the FAR and the parking ratio indicate that the parking spaces provided by developers do not proportionally increase with the growth in the FAR. When the FAR reaches a certain threshold, the increasing rate of parking demand may be reduced accordingly. As shown in the GWR model, the negative correlations between the parking ratio and the FAR are significant only in Longgang district and the outer ring of Luohu district, probably because the industrial parks in these areas attract many blue-collar workers who may not have access to private cars. Developers may actively decrease the ratio of parking supply due to the lower demand.
Third, lot size has positive relationships with absolute parking provision, and the positive coefficients are larger in the two CBDs, where parking demand is higher, implying the sensitivity of developers to parking supply–demand relationships under market conditions.
Fourth, the significant correlations between transit accessibility and absolute parking provision show opposing signs—there are negative relationships in the Nanshan and Futian districts, but positive relationships in Luohu district. This outcome implies the effectiveness of the lowered MPRs that have been applied since 2004 in central and transit-rich areas. Otherwise, developers will provide more parking in areas with better transit accessibility, as indicated by the positive correlations in Luohu district. Many existing studies have also found that developers tend to provide more parking in transit-rich areas, due to the higher premiums, when effective restraints are lacking [28,29].
These findings are sufficient to answer the two research questions: (1) the transit/location-relevant parking standards perform better than a one-size-fits-all parking regulation in terms of the reducing effects on parking provisions in central and transit-rich areas. (2) Nonetheless, a wider range of factors, such as the FAR and lot size, should be considered in order to improve context-specific parking standards. The total number of parking spaces will inevitably increase with the rise in the FAR because the government regulates MPRs by unit area (per 100 square meters). Although the increasing rate of parking supply by the FAR is smaller in the city proper than that in suburban areas, there may still be more parking spaces in urban centers due to the higher development intensity. An upper limit to or cap on the total parking quantity, rather than a FAR-based MPR, is recommended for downtown areas. Parking constraints reduce the willingness of travelers to drive into downtown areas [3,36]. Fine-grained streets and small blocks, as encouraged by New Urbanism, are advantageous for reducing parking provision, particularly in downtown areas. MPRs differentiated based on transit accessibility can be further improved to better integrate parking–transit relationships. The GWR technique allows us to acknowledge spatial non-stationarity, and to gain a better understanding of the local relationship between parking provision and built environments. The GWR approach has advantages over global regression in examining local factors that affect parking provision, and can help urban and transportation planners identify potentially important locations for further investigation to improve parking supply management. However, there are several limitations in this study. As with OLS models, GWR models cannot be used to prove causality. Although many speculations are discussed, additional research is still needed to further understand the underlying mechanism behind the spatially varying relationships between the built environment and parking provisions. Depending on data availability, more explanatory variables, such as a subdivision of office types, land prices, and traffic volumes, could be incorporated into the models. These additional variables may contribute to furthering the understanding of cost-benefit tradeoffs when deciding the level of parking provisions. The operation period variable has no significant correlations in the GWR models, which is counterintuitive. Advanced tools need to be developed to help gauge both the spatially and temporally varying effects. Geographical and temporal weighted regression (GWTR), an extension of GWR, has recently been developed [37,38], and could be applied to model spatiotemporal non-stationary processes in the future.
Author Contributions
Conceptualization, Q.L.; Literature review, Q.L. and Z.X.; methodology, Q.L. and M.Z.; data curation, Q.L.; writing—original draft, Q.L. and M.Z.; writing—review & editing, Q.L., M.Z. and Z.X.
Funding
This research was funded by [National Natural Science Foundation for Young Scholar of China] grant number [51608328 and 31600437].
Conflicts of Interest
The authors declare no conflict of interest.
References
- Johansson, F.; Henriksson, G.; Åkerman, J. Parking Benefit Districts—The transferability of a measure to reduce car dependency to a European context. Transp. Res. Part D Transp. Environ. 2017, 56, 129–140. [Google Scholar] [CrossRef]
- Chu, C.P.; Tsai, M.T. A study of an environmental-friendly parking policy. Transp. Res. Part D Transp. Environ. 2011, 16, 87–91. [Google Scholar] [CrossRef]
- Hensher, D.A.; King, J. Parking demand and responsiveness to supply, pricing and location in the sydney central business district. Transp. Res. Part A 2001, 35, 177–196. Available online: https://raw.githubusercontent.com/gwrtools/gwr4/master/GWR4manual_409.pdf (accessed on 4 April 2018). [CrossRef]
- Su, Q.; Zhou, L. Parking management, financial subsidies to alternatives to drive alone and commute mode choices in Seattle. Reg. Sci. Urban Econ. 2012, 42, 88–97. [Google Scholar] [CrossRef]
- Vaca, E.; Kuzmyak, J.R. Traveler Response to Transportation System Changes. Chapter 13—Parking Pricing and Fees; TCRP Report; TCRP: Washington, DC, USA, 2005. [Google Scholar]
- Guo, Z. Does residential parking supply affect household car ownership? The case of New York City. J. Transp. Geogr. 2013, 26, 18–28. [Google Scholar] [CrossRef]
- Guo, Z. Home parking convenience, household car usage, and implications to residential parking policies. Transp. Policy 2013, 29, 97–106. [Google Scholar] [CrossRef]
- Marsden, G. The evidence base for parking policies—A review. Transp. Policy 2006, 13, 447–457. [Google Scholar] [CrossRef]
- McCahill, C.; Garrick, N. Influence of parking policy on built environment and travel behavior in two New England cities, 1960 to 2007. Transp. Res. Rec. J. Transp. Res. Board 2010, 2187, 123–130. [Google Scholar] [CrossRef]
- Weinberger, R. Death by a thousand curb-cuts: Evidence on the effect of minimum parking requirements on the choice to drive. Transp. Policy 2012, 20, 93–102. [Google Scholar] [CrossRef]
- Wang, J.J.; Liu, Q. Understanding the parking supply mechanism in China: A case study of Shenzhen. J. Transp. Geogr. 2014, 40, 77–88. [Google Scholar] [CrossRef]
- Caicedo, F.; Lopez-Ospina, H.; Pablo-Malagrida, R. Environmental repercussions of parking demand management strategies using a constrained logit model. Transp. Res. Part D Transp. Environ. 2016, 48, 125–140. [Google Scholar] [CrossRef]
- Christiansen, P.; Engebretsen, Ø.; Fearnley, N.; Hanssen, J.U. Parking facilities and the built environment: Impacts on travel behaviour. Transp. Res. Part A Policy Pract. 2017, 95, 198–206. [Google Scholar] [CrossRef]
- Liu, Q.; Wang, J.; Chen, P.; Xiao, Z. How does parking interplay with the built environment and affect automobile commuting in high-density cities? A case study in China. Urban Stud. 2017, 54, 3299–3317. [Google Scholar] [CrossRef]
- Cuddy, M.R. A Practical Method for Developing Context-Sensitive Residential Parking Standards. Ph.D. Dissertation, Rutgers University-Graduate School-New Brunswic, New Brunswick, NJ, USA, 2007. [Google Scholar]
- Kodransky, M.; Hermann, G. Europe’s Parking U-Turn: From Accomodation to Regulation; Institute for Transportation and Development Policy: New York, NY, USA, 2010. [Google Scholar]
- Wang, R.; Yuan, Q. Parking practices and policies under rapid motorization: The case of China. Transp. Policy 2013, 30, 109–116. [Google Scholar] [CrossRef]
- Liu, Q.; Chen, P.; Sun, F. Parking policies in China’s metropolises: Rationales, consequences, and implications. Urban Policy Res. 2018, 36, 186–200. [Google Scholar] [CrossRef]
- Litman, T.; Burwell, D. Issues in sustainable transportation. Int. J. Glob. Environ. Issues 2006, 6, 331–347. [Google Scholar] [CrossRef]
- Shoup, D.C. The trouble with minimum parking requirements. Transp. Res. Part A Policy Pract. 1999, 33, 549–574. [Google Scholar] [CrossRef] [Green Version]
- Shoup, D. The High Cost of Free Parking; American Planning Association: Chicago, IL, USA; Washington, DC, USA, 2005. [Google Scholar]
- Cutter, W.B.; Franco, S.F. Do parking requirements significantly increase the area dedicated to parking? A test of the effect of parking requirements values in Los Angeles County. Transp. Res. Part A Policy Pract. 2012, 46, 901–925. [Google Scholar] [CrossRef] [Green Version]
- Barter, P.A. Off-street parking policy without parking requirements: A need for market fostering and regulation. Transp. Rev. 2010, 30, 571–588. [Google Scholar] [CrossRef]
- Ben-Joseph, E. Book Review: The High Cost of Free Parking. J. Plan. Lit. 2005, 20, 135–136. [Google Scholar] [CrossRef]
- Willson, R.W. Suburban parking requirements: A tacit policy for automobile use and sprawl. J. Am. Plan. Assoc. 1995, 61, 29–42. [Google Scholar] [CrossRef]
- Manville, M.; Shoup, D.C. Parking Requirements as a Barrier to Housing Development: Regulation and Reform in Los Angeles; University of California Transportation Center: Berkeley, CA, USA, 2010. [Google Scholar]
- Engel-Yan, J.; Hollingworth, B.; Anderson, S. Will reducing parking standards lead to reductions in parking supply? Results of extensive commercial parking survey in Toronto, Canada. Transp. Res. Rec. 2007, 2010, 102–110. [Google Scholar] [CrossRef]
- Nelson, A.; Meyer, M.; Ross, C. Parking supply policy and transit use: Case study of Atlanta, Georgia. Transp. Res. Rec. J. Transp. Res. Board 1997, 1604, 60–66. [Google Scholar] [CrossRef]
- McDonnell, S.; Madar, J.; Been, V. Minimum parking requirements and housing affordability in New York City. Hous. Policy Debate 2011, 21, 45–68. [Google Scholar] [CrossRef]
- Guo, Z.; Ren, S. From minimum to maximum: Impact of the London parking reform on residential parking supply from 2004 to 2010? Urban Stud. 2013, 50, 1183–1200. [Google Scholar] [CrossRef]
- Been, V.; Brazill, C.; Madar, J.; McDonnell, S. Searching for the Right Spot: Minimum Parking Requirements and Housing Affordability in New York City; Policy Brief; Furman Center for Real Estate and Urban Policy: New York, NY, USA, 2012. [Google Scholar]
- Li, F.; Guo, Z. Do parking standards matter? Evaluating the London parking reform with a matched-pair approach. Transp. Res. Part A Policy Pract. 2014, 67, 352–365. [Google Scholar] [CrossRef]
- Urban Planning Land and Resources Commission of Shenzhen. Urban Planning Standards and Guideline; Urban Planning Land and Resources Commission of Shenzhen: Shenzhen, China, 1990–2014. [Google Scholar]
- Fotheringham, A.S.; Brunsdon, C.; Charlton, M. Geographically Weighted Regression; John Wiley & Sons, Limited: Chichester, UK, 2003; pp. 159–183. [Google Scholar]
- Nakaya, T. GWR4.09 User Manual: Windows Application for Geographically Weighted Regression Modelling. 2016. [Google Scholar]
- Wang, J.; Zhang, X.; Zhang, H.M. Parking permits management and optimal parking supply considering traffic emission cost. Transp. Res. Part D Transp. Environ. 2018, 60, 92–103. [Google Scholar] [CrossRef]
- Fotheringham, A.S.; Crespo, R.; Yao, J. Geographical and temporal weighted regression (GTWR). Geogr. Anal. 2015, 47, 431–452. [Google Scholar] [CrossRef]
- Huang, B.; Wu, B.; Barry, M. Geographically and temporally weighted regression for modeling spatio-temporal variation in house prices. Int. J. Geogr. Inf. Sci. 2010, 24, 383–401. [Google Scholar] [CrossRef]
Figure 1.
Sample distribution by total number of parking spaces (a) and parking ratio (b).

Figure 2.
Share distributions under, over, and within the required parking level (total observations: 829).
Figure 2.
Share distributions under, over, and within the required parking level (total observations: 829).

Figure 3.
Changes in share distributions under, over, and within the required parking level based on the floor area ratio (FAR) in office buildings (total observations: 829).
Figure 3.
Changes in share distributions under, over, and within the required parking level based on the floor area ratio (FAR) in office buildings (total observations: 829).
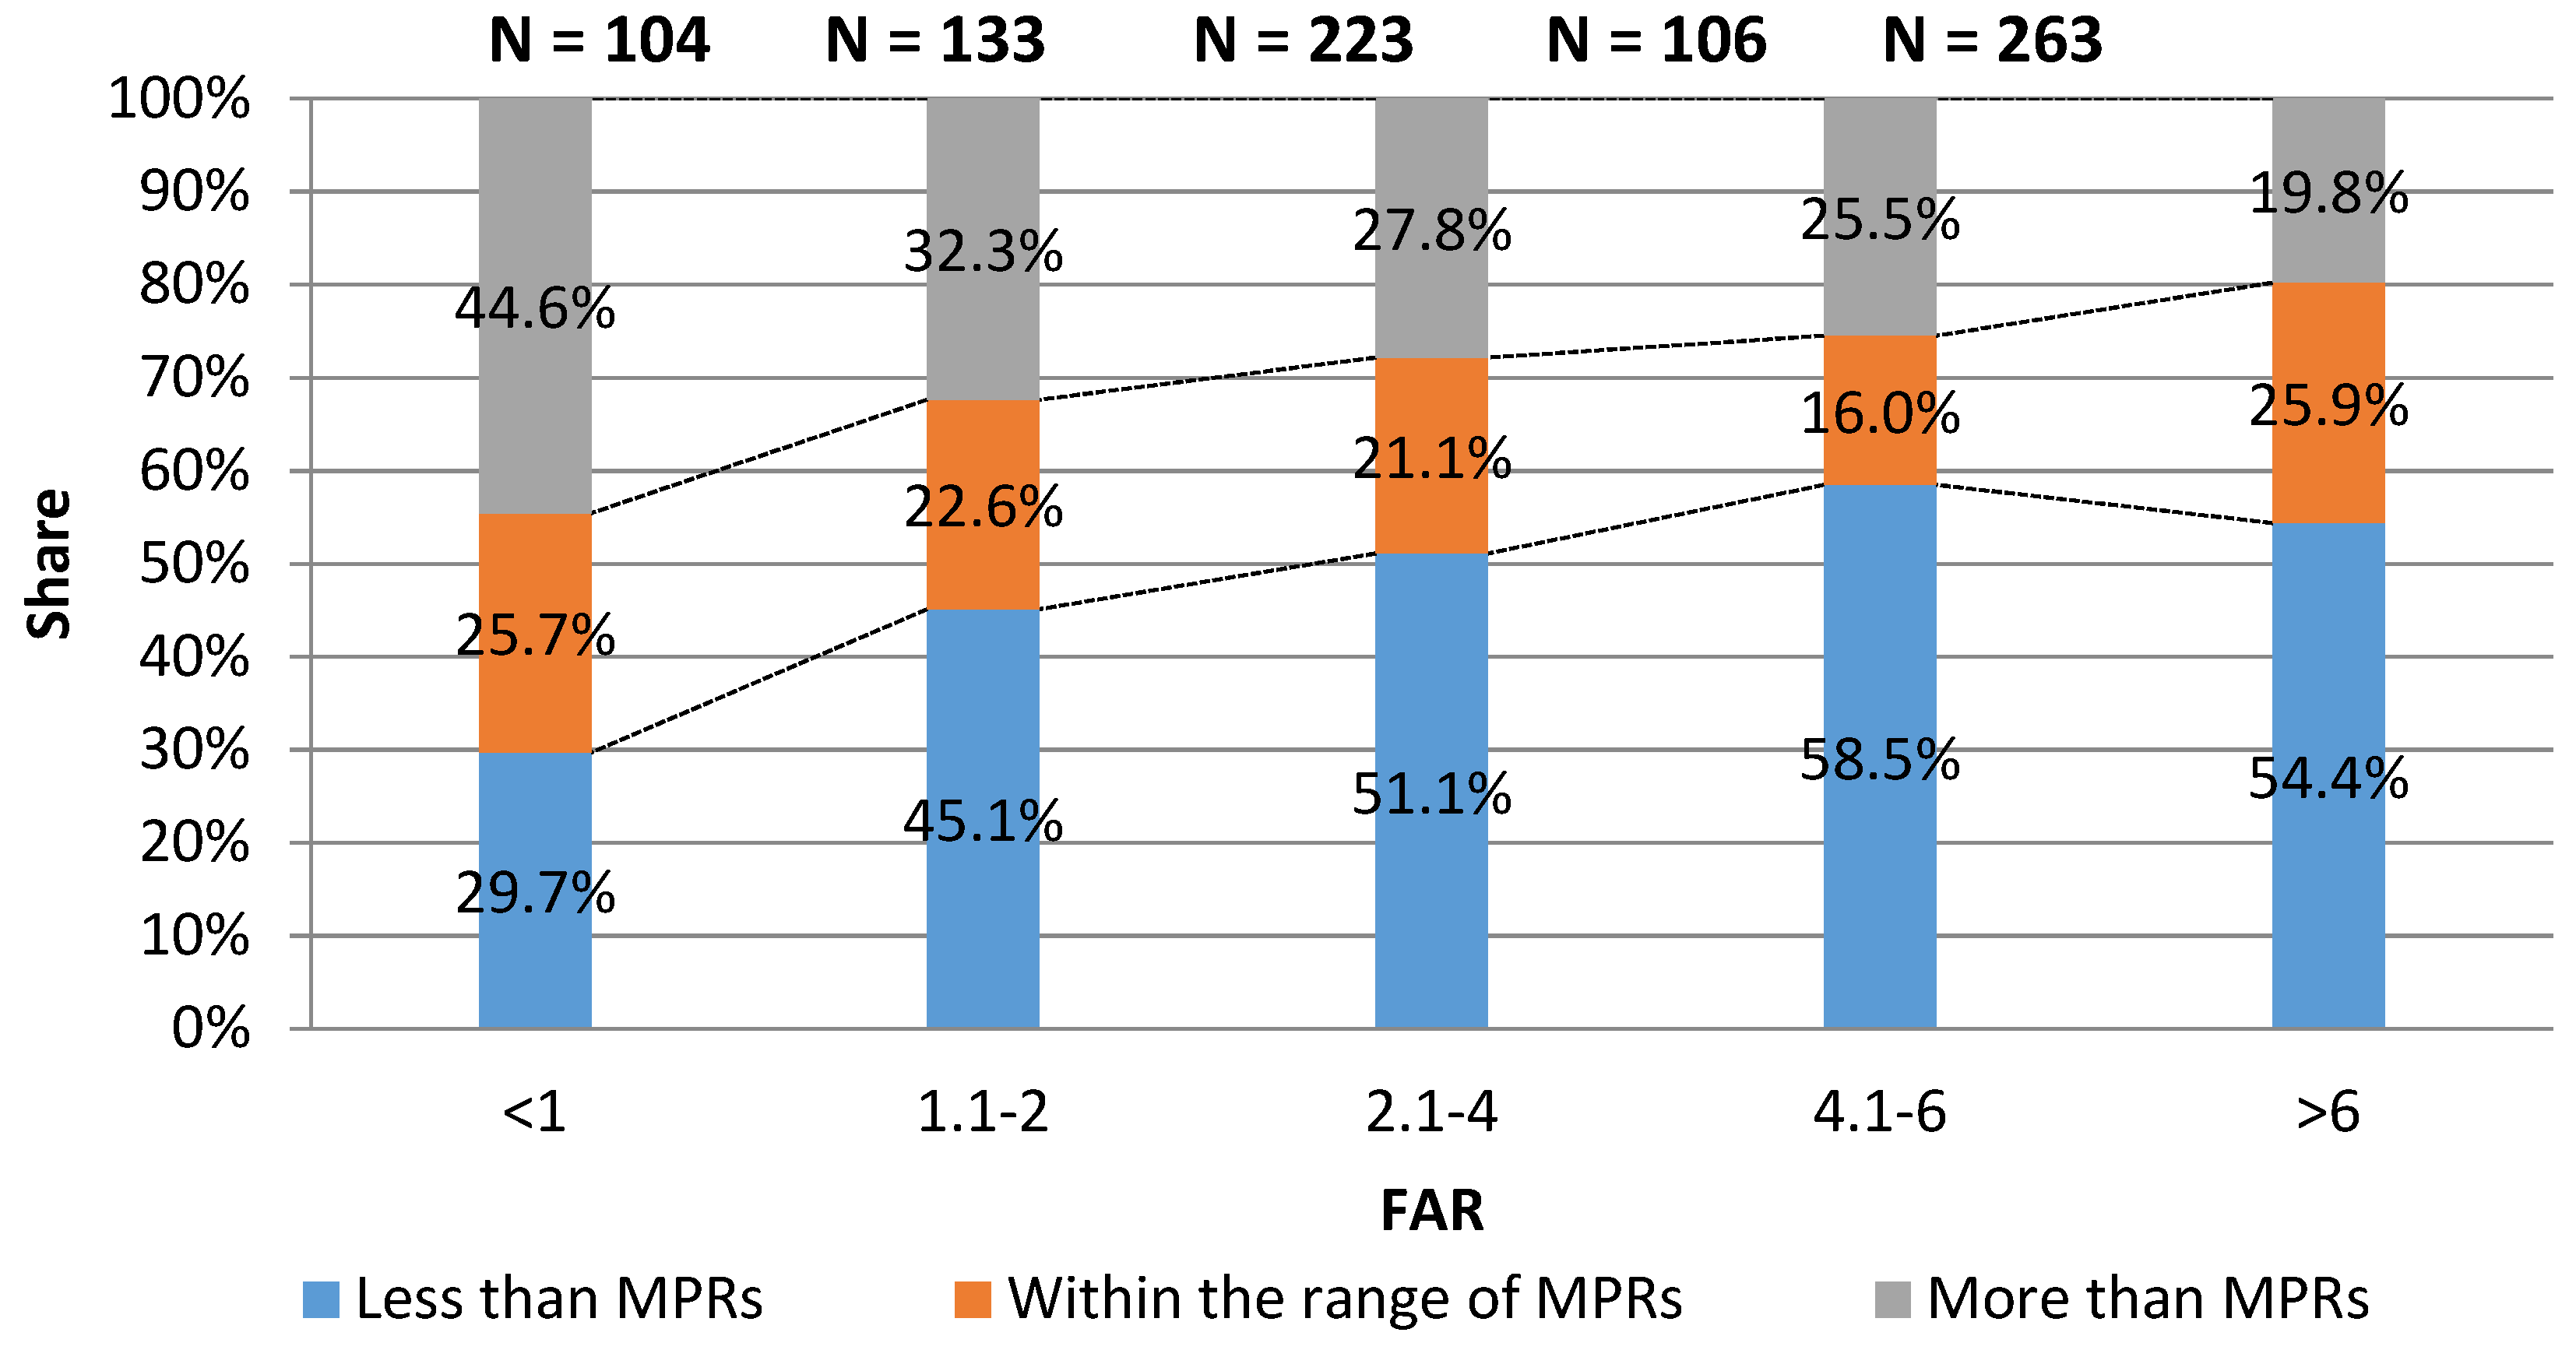
Figure 4.
Share distributions under, over, and within the required parking level between 2005 and 2014, based on transit accessibility in general offices (total observations: 287).
Figure 4.
Share distributions under, over, and within the required parking level between 2005 and 2014, based on transit accessibility in general offices (total observations: 287).

Figure 5.
Spatial relationships between absolute parking provision and the built environment (note: A is ChegongMiao area and B is Guomao central business district (CBD)). (a) GWR results for the independent variables: FAR. (b) GWR results for the independent variables: lot size. (c) GWR results for the independent variables: transit accessibility.


Figure 6.
Spatial relationships between relative parking provision and FAR (note: A is ChegongMiao area and B is Guomao CBD).
Figure 6.
Spatial relationships between relative parking provision and FAR (note: A is ChegongMiao area and B is Guomao CBD).


Table 1.
Parking minimums in Shenzhen and a general comparison with other high-density cities worldwide (unit: spaces per 100 m2 of gross floor space).
Table 1.
Parking minimums in Shenzhen and a general comparison with other high-density cities worldwide (unit: spaces per 100 m2 of gross floor space).
| The Changes in Urban Planning Standards and Guidelines of Shenzhen (UPSG) | ||||
| Categories | 1990 UPSG | 1997 UPSG | 2004 UPSG | 2014 UPSG |
| Administration and government offices | 0.7–0.8 | 2.5–3.0 |
|
|
| Financial, joint venture and foreign trade offices | 0.9–1.2 |
|
| |
| General offices | 0.3–0.4 | 0.4–0.6 | ||
| Office Parking Standards in Selective High-Density Cities Worldwide | ||||
| Hong Kong (minimum standards) 1 |
| |||
| Tokyo (minimum standards) | 0.3 | |||
| London (maximum standards) 2,3 |
| |||
| New York City (maximum standards) 4 | Manhattan core: 0.27 1 per 100 m2 or 100 spaces, whichever is less | |||
Notes: 1 Planning Department of Hong Kong, 2016. Hong Kong Planning Standards and Guidelines, website version, 2016. Available at: https://www.pland.gov.hk/pland_en/tech_doc/hkpsg/full/ch8/ch8_text.htm#7. 2 Greater London Authority (GLA), 2016. The London Plan: London’s Transport. 3 The unit is transformed from square feet to square meter for comparison. 4 City Planning Commission and Department of City Planning of New York, 2017. Zoning Resolution, website version, 2017. Barter, P.A., 2011. Parking Policy in Asian Cities.
Table 2.
Variable specifications and descriptive statistics.
| Variables | Unit | Average | Min | Max | St. Dev | Specifications |
|---|---|---|---|---|---|---|
| Dependent variables | ||||||
| Total number of parking spaces | Spaces | 148 | 1 | 2581 | 242 | The total number of parking spaces in each building. |
| Parking ratio | Spaces/100 m2 | 0.629 | 0.007 | 8.330 | 1.805 | The actual number of parking spaces per floor area in each building. |
| Independent variables | ||||||
| FAR | m2/m2 | 5.058 | 0.007 | 19.875 | 4.450 | The ratio of the floor area of each building to its site area. |
| Lot size | hectare | 1.167 | 0.031 | 70.069 | 4.067 | The site area of each building. |
| Transit accessibility | - | 270 | 0 | 748 | 190 | A transit accessibility index 1 by grid units. |
| Distance to the city center | km | 7.979 | 0.461 | 49.947 | 9.305 | The distance to the city center by road 2. |
| Job density 2 | 1000 jobs/km2 | 5.733 | 0 | 23.818 | 4.758 | The ratio of the number of office jobs to the area of the traffic analysis zone (TAZ) 3. |
| Operation period | 3.080 | 1 | 5 | 0.884 | The period when the building was completed (1 = before 1990; 2 = from 1991 to 1997; 3 = from 1998 to 2004; 4 = from 2004 to 2013; 5 = after 2014). | |
1 The transit accessibility index (TAI) is calculated based on the method of the London Public Transport Accessibility Level (PTAL) (TransportforLondon, 2010). The TAI takes into account walk access time and service availability. The calculation is based on 5090 grid units defined by the Shenzhen URC (Urban Planning Land and Resources Commission of Shenzhen, 2011). First, the total access time for each location equals the walking time plus the average waiting time. Then, the total access time is converted into an equivalent doorstep frequency (EDF) (EDF = 30/Total Access Time). Two modes (bus and rail) are considered. The final TAI is calculated by the following two formulas: (1) TAI mode = EDFmax + (0.5 *All other EDFs) and (2) TAIall = TAIbus+TAIrail. A higher TAI indicates better transit service. 2 All buildings are allocated to three city centers by location. Their distances to the corresponding city center are calculated. 3 This indicator is an aggregate measure that is used to reflect the density of office jobs.
Table 3.
Summary of the ordinary least square (OLS) results, diagnostics, and global Moran’s I test.
Table 3.
Summary of the ordinary least square (OLS) results, diagnostics, and global Moran’s I test.
| Model 1: Absolute Provision | Model 2: Relative Provision | |||||||
|---|---|---|---|---|---|---|---|---|
| Variables | Coefficient | StdError | p-Value | VIF1 | Coefficient | StdError2 | p-Value | VIF |
| Intercept | −15.363 | 35.150 | 0.610 | - | 0.207 | 0.287 | 0.499 | - |
| FAR | 20.843 | 1.870 | 0.000 ***3 | 1.254 | −0.033 | 0.015 | 0.000 *** | 1.254 |
| Lot size | 14.198 | 1.907 | 0.006 ** | 1.066 | 0.045 | 0.016 | 0.424 | 1.066 |
| Transit accessibility | −0.204 | 0.052 | 0.000 *** | 1.751 | −0.000 | 0.000 | 0.106 | 1.751 |
| Distance to the city center | −1.857 | 1.002 | 0.038 * | 1.540 | 0.009 | 0.008 | 0.539 | 1.540 |
| Job density | −1.801 | 1.979 | 0.351 | 1.570 | −0.010 | 0.016 | 0.210 | 1.570 |
| Operation period | 39.759 | 8.670 | 0.000 *** | 1.039 | 0.203 | 0.071 | 0.032 * | 1.039 |
| OLS4 diagnostics | ||||||||
| Number of observations | 829 | 829 | ||||||
| AICc5 | 11276.571 | 3307.101 | ||||||
| Joint F-statistic | 35.954; p = 0.000 | 6.757; p = 0.000 | ||||||
| Joint Wald statistic | 96.936; p = 0.000 | 35.449; p = 0.000 | ||||||
| Koenker (BP) statistic | 45.344; p = 0.000 | 26.539; p = 0.000 | ||||||
| Jarque–Bera statistic | 33,521.086; p = 0.000 | 3,872,834.020; p = 0.000 | ||||||
| R2 | 0.208 | 0.047 | ||||||
| Adjusted R2 | 0.202 | 0.040 | ||||||
| Global Moran’s I summary | ||||||||
| Moran’s Index | 0.048 | 0.001 | ||||||
| Expected Index | −0.001 | −0.001 | ||||||
| Variance | 0.000 | 0.000 | ||||||
| z-score | 4.846 | 0.245 | ||||||
| p-value | 0.000 | 0.807 | ||||||
Notes: 1. VIF: variance inflation factor; 2. StdError: standard Error ; 3. *** p < 0.001; ** p < 0.01; * p < 0.05; 4. OLS means ordinary least square; 5. AICc: Akaike Information Criterion.
Table 4.
Descriptive statistics for the geographical weighted regression (GWR) t-values.
| Negatively Significant at 95% | Negatively Significant at 90% | Not Significant | Positively Significant at 90% | Positively Significant at 95% | |
|---|---|---|---|---|---|
| Model 3: Absolute provision | |||||
| Lot size | 0.00% | 0.00% | 24.00% | 7.24% | 68.76% |
| FAR | 0.48% | 0.48% | 39.69% | 8.81% | 50.54% |
| Transit accessibility | 10.62% | 3.74% | 79.73% | 1.57% | 4.34% |
| Operation period | 3.38% | 1.81% | 83.72% | 2.90% | 8.20% |
| Job density | 5.79% | 2.90% | 84.44% | 2.77% | 4.10% |
| Model 4: Relative provision | |||||
| FAR | 15.32% | 4.70% | 79.73% | 0.00% | 0.24% |
| Lot size | 0.36% | 1.33% | 85.89% | 2.90% | 9.53% |
| Operation period | 0.24% | 0.00% | 87.33% | 0.84% | 11.58% |
| Transit accessibility | 8.08% | 3.26% | 88.66% | 0.00% | 0.00% |
| Job density | 0.36% | 2.90% | 96.14% | 0.12% | 0.48% |
Table 5.
Summary of the GWR results, diagnostics and global Moran’s I test.
| Model 3: Absolute Provision | Model 4: Relative Provision | |||||||||||||
|---|---|---|---|---|---|---|---|---|---|---|---|---|---|---|
| Variables | Min. | 1st Qu. | Median | 3rd Qu. | Max. | Positive | Negative | Min. | 1st Qu. | Median | 3rd Qu. | Max. | Positive | Negative |
| Intercept | −1208.892 | −131.722 | −8.179 | 114.669 | 795.324 | 46.80% | 53.20% | −1.611 | 0.396 | 0.622 | 0.752 | 2.443 | 92.76% | 7.24% |
| FAR | −42.375 | 6.738 | 15.292 | 24.793 | 70.582 | 96.38% | 3.62% | −0.383 | −0.041 | −0.024 | −0.020 | 0.073 | 3.14% | 96.86% |
| Lot size | −10.908 | 23.855 | 66.804 | 157.622 | 705.490 | 98.31% | 1.69% | −0.296 | −0.012 | −0.007 | 0.102 | 1.122 | 45.96% | 54.04% |
| Transit accessibility | −1.787 | −0.290 | −0.043 | 0.061 | 1.523 | 37.15% | 62.85% | −0.013 | −0.000 | −0.001 | −0.001 | 0.001 | 21.35% | 78.64% |
| Job density | −66.827 | −7.478 | 0.578 | 8.340 | 120.647 | 54.52% | 45.48% | −0.192 | −0.018 | −0.015 | −0.005 | 0.343 | 11.10% | 88.90% |
| Operation period | −120.101 | −7.847 | 5.042 | 30.850 | 196.302 | 62.61% | 37.39% | −0.707 | −0.010 | 0.027 | 0.152 | 1.585 | 66.95% | 33.05% |
| Diagnostic information | ||||||||||||||
| Degree of freedom (residual: n − 2trace(S) + trace(S’S)) | 579.618 | 748.263 | ||||||||||||
| ML1 based sigma estimate | 132.307 | 1.479 | ||||||||||||
| Unbiased sigma estimate | 158.230 | 1.556 | ||||||||||||
| Log-likelihood | 10,452.135 | 3001.691 | ||||||||||||
| Classic AIC2 | 10,856.061 | 3128.325 | ||||||||||||
| AICc | 10,987.015 | 3138.976 | ||||||||||||
| BIC/MDL3 | 11,809.371 | 3427.196 | ||||||||||||
| CV4 | 80,644.614 | 5.242 | ||||||||||||
| R2 | 0.701 | 0.328 | ||||||||||||
| Adjusted R2 | 0.572 | 0.255 | ||||||||||||
| Moran’s I summary | ||||||||||||||
| Moran’s Index | −0.013 | 0.001 | ||||||||||||
| Expected Index | −0.001 | −0.001 | ||||||||||||
| Variance | 0.000 | 0.000 | ||||||||||||
| z-score | −1.175 | 0.283 | ||||||||||||
| p-value | 0.240 | 0.777 | ||||||||||||
Note: 1. ML: maximum likelihood; 2. AIC: Akaike information criterion; 3. BIC/MDL: Bayesian Infomration Criterion/ Minimum Description length; 4. CV: cross-validation.
© 2019 by the authors. Licensee MDPI, Basel, Switzerland. This article is an open access article distributed under the terms and conditions of the Creative Commons Attribution (CC BY) license (http://creativecommons.org/licenses/by/4.0/).
Share and Cite
MDPI and ACS Style
Liu, Q.; Zhu, M.; Xiao, Z. Workplace Parking Provision and Built Environments: Improving Context-Specific Parking Standards Towards Sustainable Transport. Sustainability 2019, 11, 1142. https://doi.org/10.3390/su11041142
AMA Style
Liu Q, Zhu M, Xiao Z. Workplace Parking Provision and Built Environments: Improving Context-Specific Parking Standards Towards Sustainable Transport. Sustainability. 2019; 11(4):1142. https://doi.org/10.3390/su11041142
Chicago/Turabian StyleLiu, Qian, Mingjian Zhu, and Zuopeng Xiao. 2019. "Workplace Parking Provision and Built Environments: Improving Context-Specific Parking Standards Towards Sustainable Transport" Sustainability 11, no. 4: 1142. https://doi.org/10.3390/su11041142
Note that from the first issue of 2016, this journal uses article numbers instead of page numbers. See further details here.